Case Study - Repeatable Process to Cleanse-Visualize-Analyze
Smart sensors are transforming how we think about data – enabling utilities to gain insights about customer behavior such as energy use by appliance, lighting, heating unit, and air conditioning system. However, the ecosystem of intelligent devices is rapidly expanding, with differing protocols and proprietary data formats, where the same event can be measured in different ways. The sheer volume of data and lack of standards can create a roadblock for many energy companies seeking to make progress toward machine learning and AI.
This brief presents a repeatable process to cleanse, visualize, and analyze large volumes of customer data, which you can follow like a playbook. The exact data preparation and analysis steps may vary based on the dataset, but this approach will help you save time and avoid common pitfalls.
This infographic shows the data science workflows end-to-end. What becomes immediately clear is that analysis, and ultimately machine learning, is dependent on successful completion of many prerequisites.
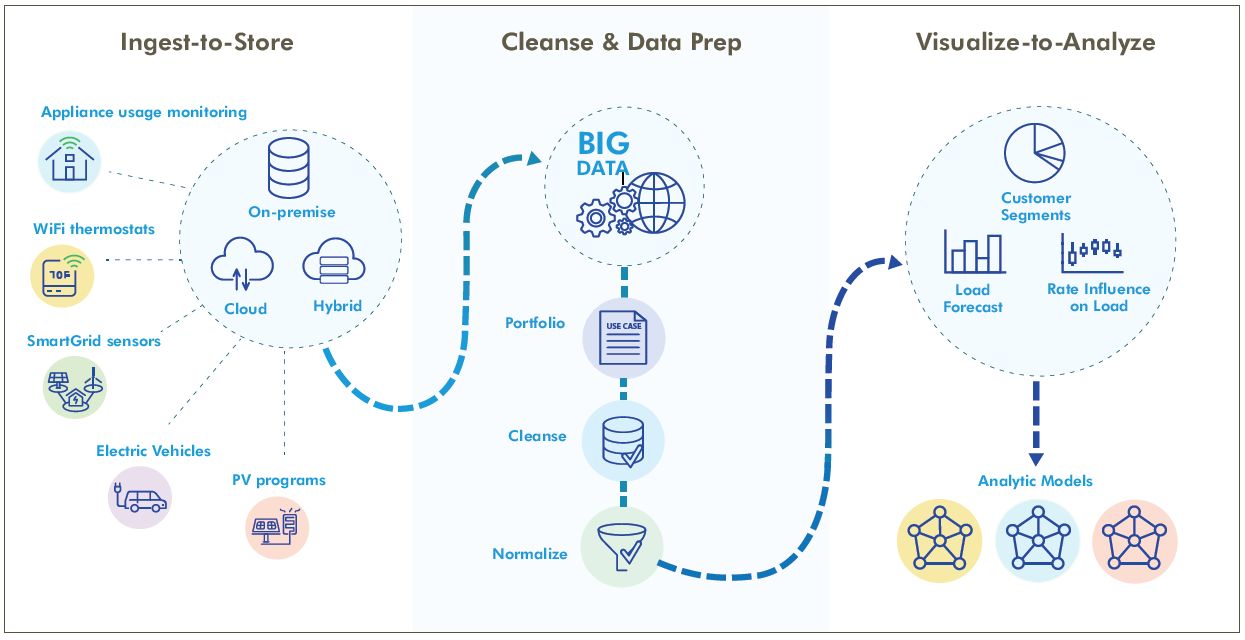
About the End-to-End Process (Infographic)
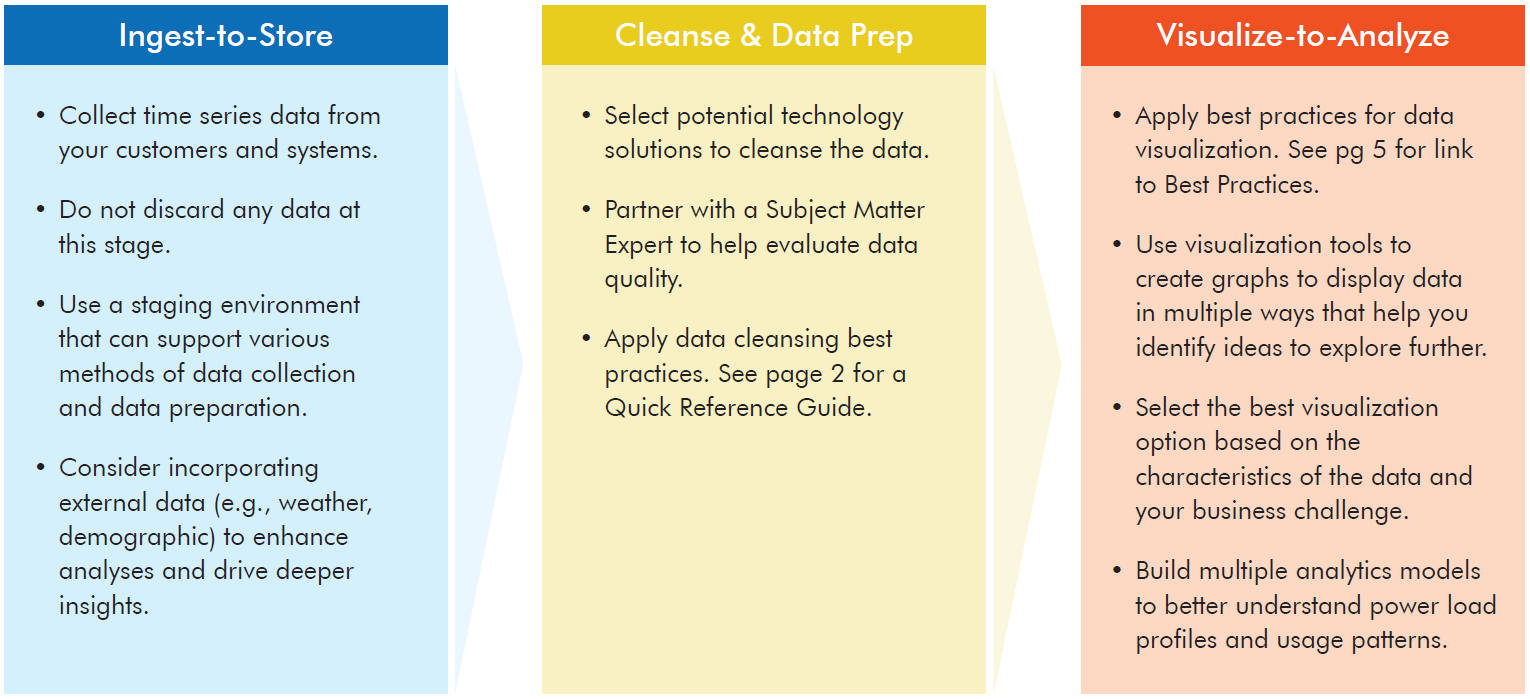
 Ingest-to-Store
The infographic shows several types of smart devices that are collecting energy usage data (new devices enter the marketplace regularly), and how the data is moved into storage. The storage solution can be multifaceted with cloud, on-premise, and hybrid.
 Cleanse & Data Prep
The data is pulled together and aggregated to become big data from thousands of households and individual devices, and potentially tens of millions of data points. Given the massive amounts of data collected, you may find it easier to get started with smaller datasets to focus on data understanding, cleansing, and normalizing.
 Visualize-to-Analyze
Using visualization techniques can help you get to insights more rapidly (such as load forecasts and rate influence by customer segments). It can also inform you on how best to start building analytic models. Finally, once you understand what the data means, you can create advanced analytic models to help predict load changes and impacts to demand.
Key Insights
- The value of time series data (like the continuous flow of data from sensors) can more easily be extracted when you apply a streamlined, repeatable process.
- Selecting the right visualization to present your findings helps tell the story and highlight patterns. Data visualization enable you to move to the analyze stage more effectively and select the most appropriate analytic models.
- Consider incorporating external data (e.g., weather, housing type, demographic) with your customer sensor data to enhance your analyses and gain deeper insights.
- To make progress toward machine learning and AI, you will need to create a pipeline that links all of the necessary tasks and workflows.
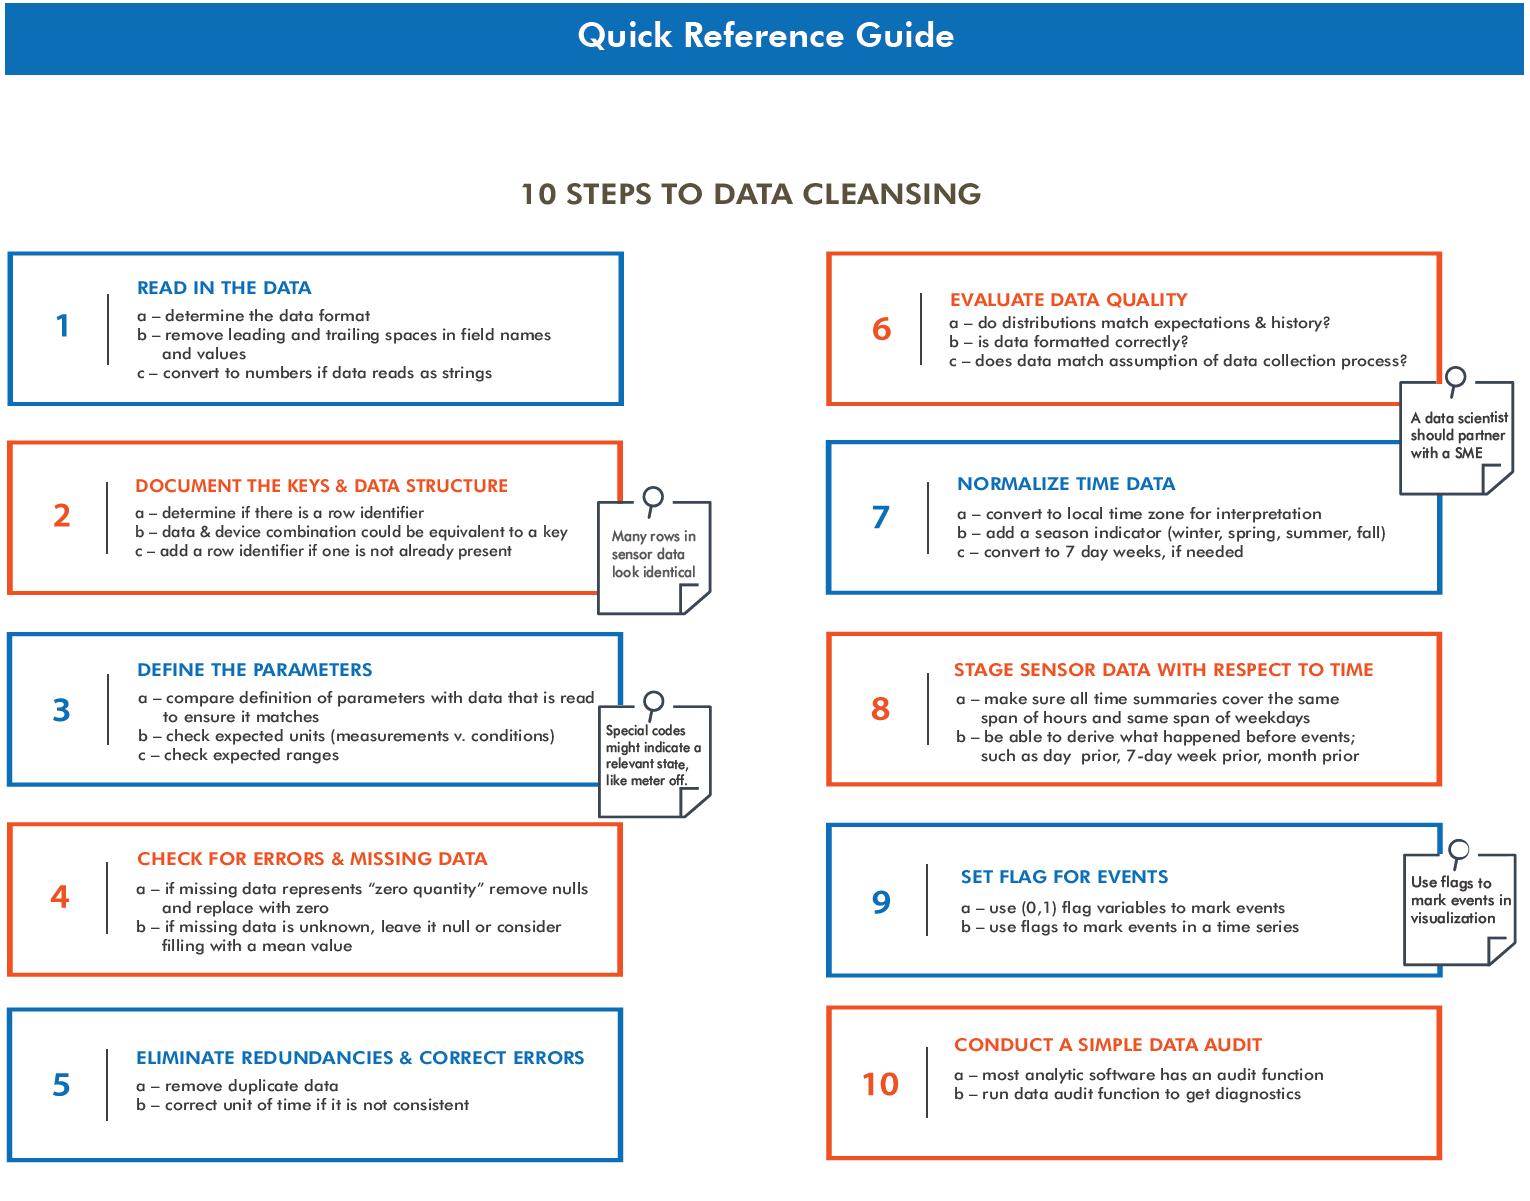
Create a Repeatable Data Cleansing Process
The proliferation of intelligent devices for consumers is enabling companies to collect customer-specific data at higher speeds and in larger amounts. That means repeatable processes for data cleansing are especially important. A key challenge is understanding how to cleanse and integrate that data efficiently. Integrating the data, often from multiple vendors, creates opportunities to understand end-use load profiles with much greater resolution, and apply new capabilities to assess load performance characteristics.
Here are some lessons learned to derive insights from large volumes of time series data. While sensors measure a multitude of specific conditions that would be helpful to energy companies, knowing how to get started can be a challenge.
Conclusion
This brief provides standardized processes for you to follow when working with sensor data. Customers are continuing to adopt new smart devices to measure and control their homes and buildings, which means the volume of data will grow exponentially. Now is the time to begin to explore, understand and derive insights from this data and use it to transform customer relationship management, demand planning, and to build load profiles. Your work in these areas can lay the foundation for increasingly sophisticated analysis and breakthroughs.
Quick Tips
- Start with a modest portfolio of time series data to use for testing and learning. Data cleansing and preparation tasks require significant investment in time to curate and normalize.
- Expect to see gaps in your data records as a normal occurrence. As time series data changes by day, week, month, and year – gaps can occur due to faulty readings, network connectivity, or other factors.
- Integrate multiple data sets to create preliminary models as a way to understand and predict customer energy demand.
- Build several analytic models to help characterize and understand end-use load profiles. Complex energy usage scenarios may require an ensemble of multiple models contributing to predictions.