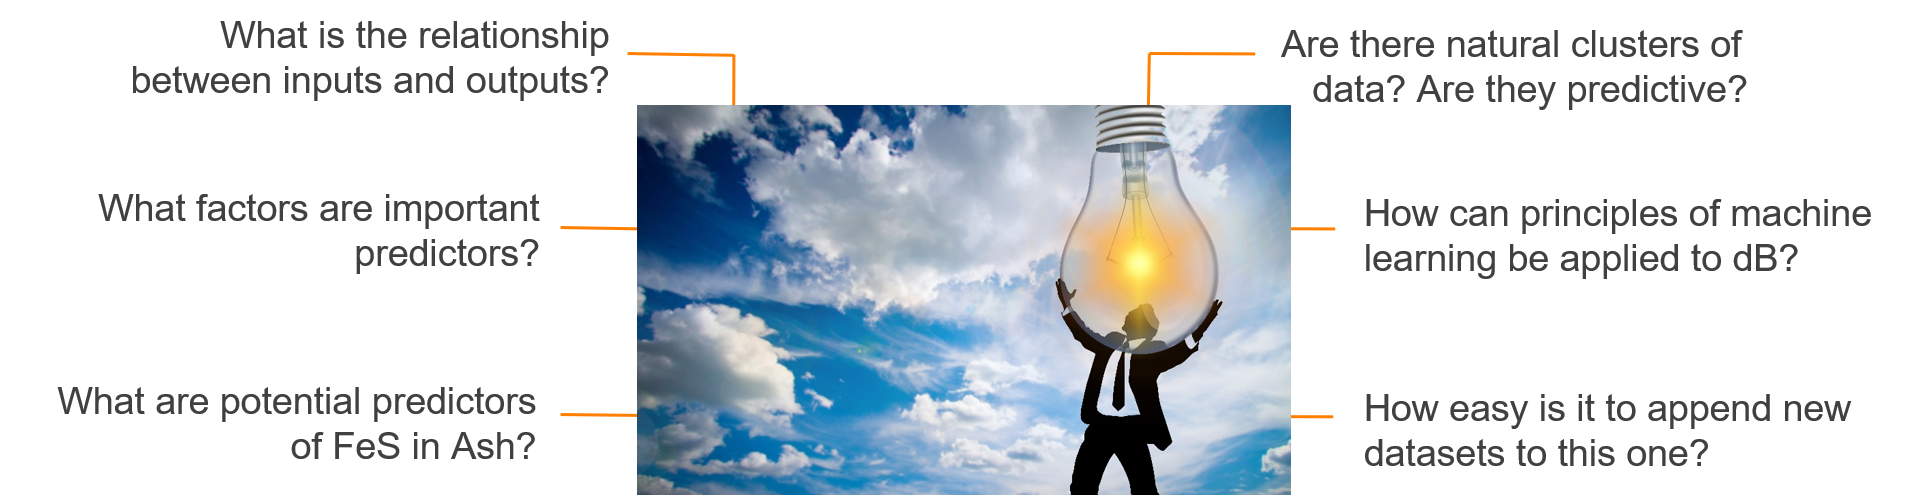
New insights through visualization
Data visualizations that highlight new insights. This use case took data from a predictor tool in EPRI’s Generation sector to discover new insights with visualizations.
Visualizations help to identify patterns in data to discover and understand stories.
Relationship between input and output
Target = FeS in Ash (% weight)
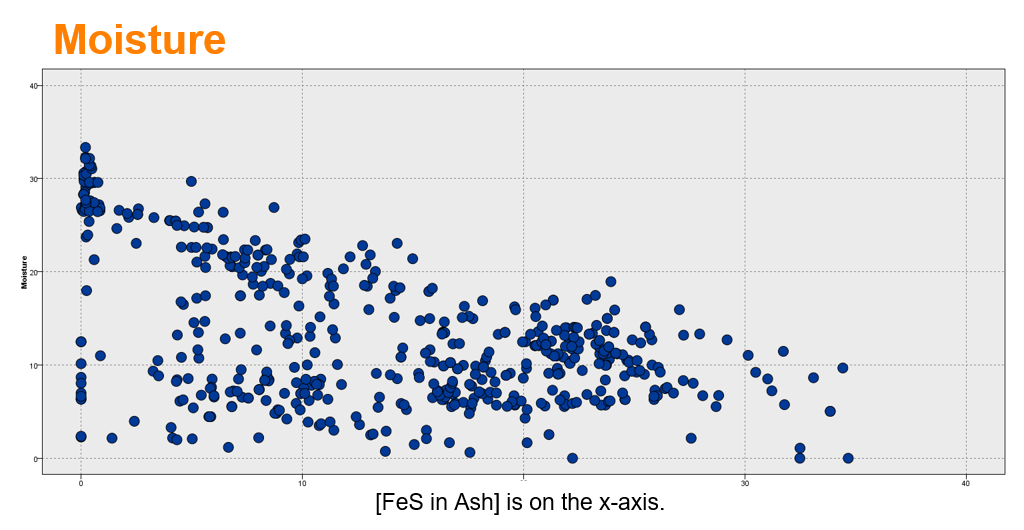
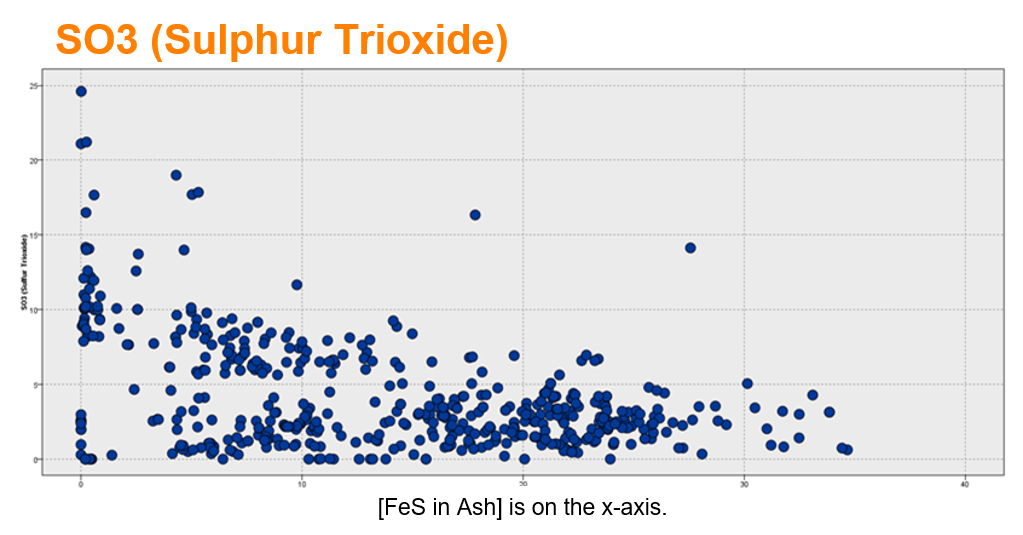
These charts show a mixed relationship with FeS in Ash (% weight). There may be two (or more) patterns.
Carbon is an important predictor in the model
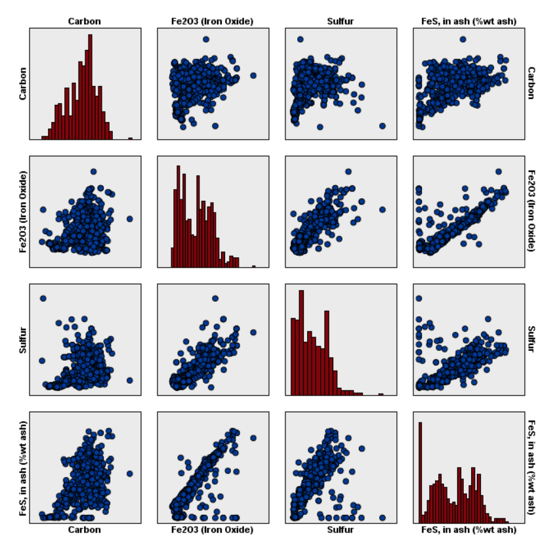
- Red plots are histograms.
- Blue plots show the scatter relationship at this intersection in the grid. For example, in the bottom row, second column, the relationship between Fe2O3 and FeS in Ash is plotted.
- The histograms for each of these parameters suggest that there might be two groups in each dimension instead of one, but the scatterplot shows a fairly strong correlation.
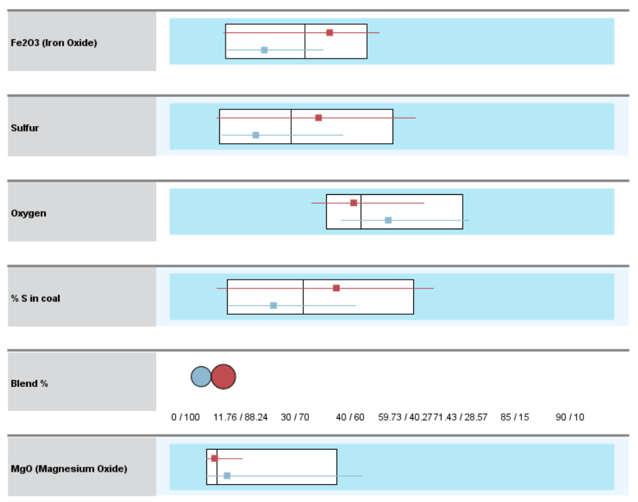
Cluster Comparison - Scale
Box plots show the median surrounded by the interquartile range (25th percentile to 75th percentile. The 2 clusters are well-separated.)
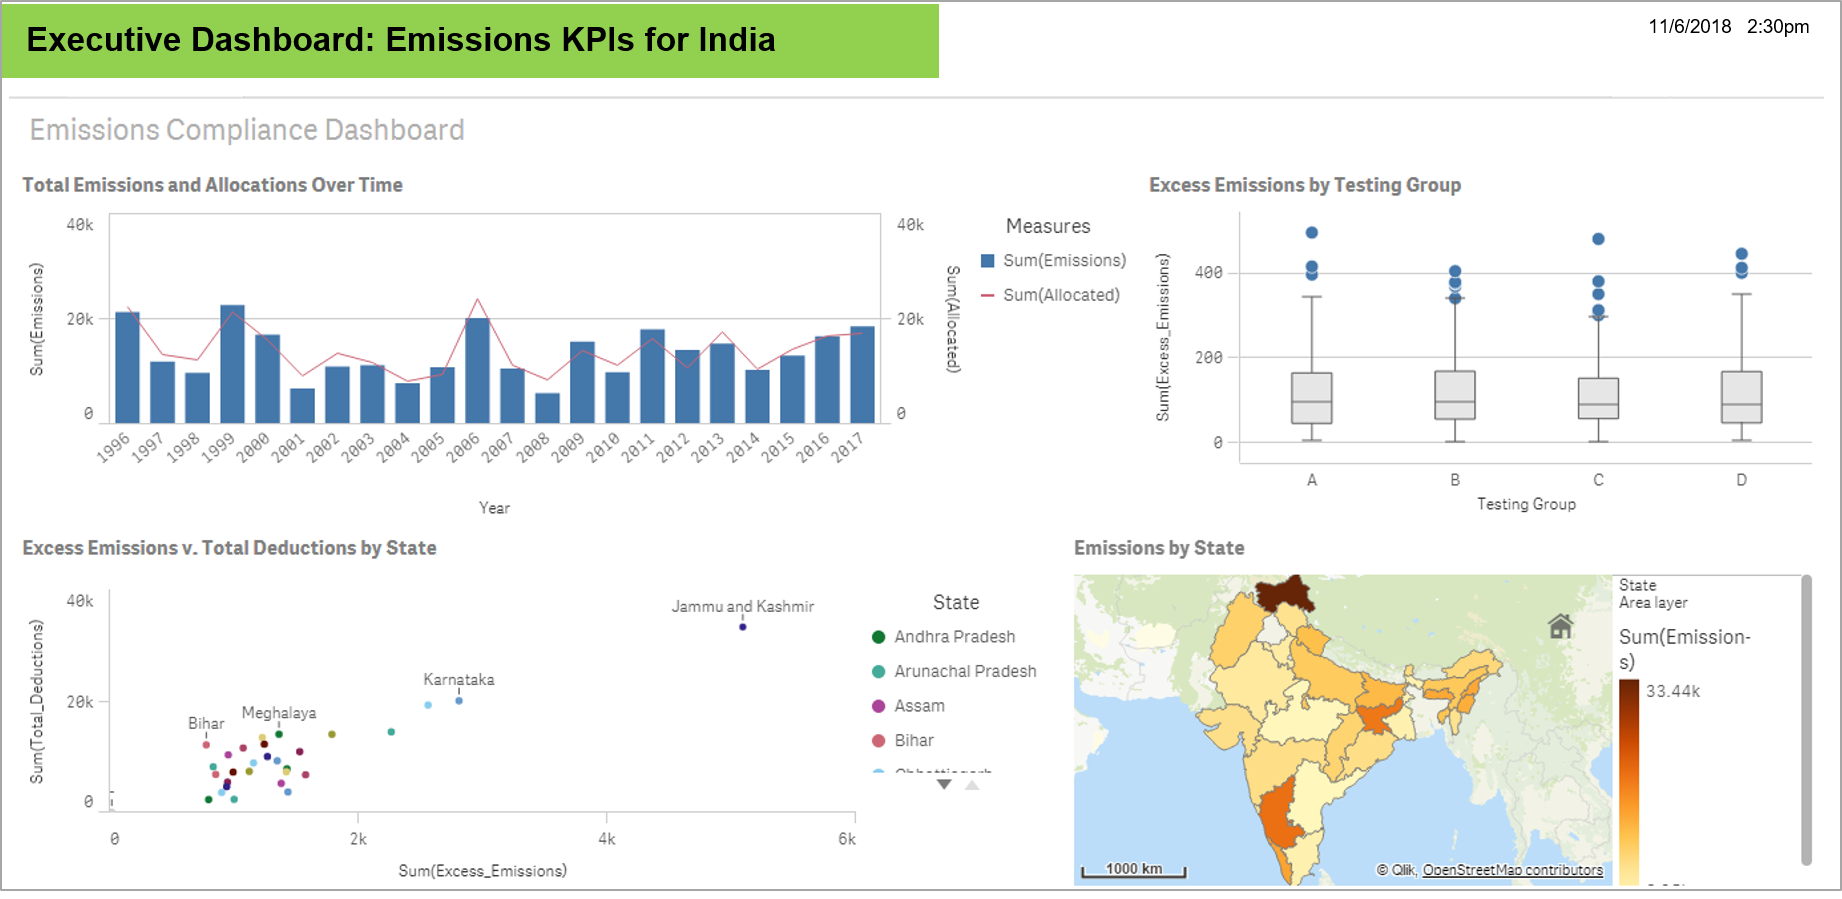
Dashboard example 1
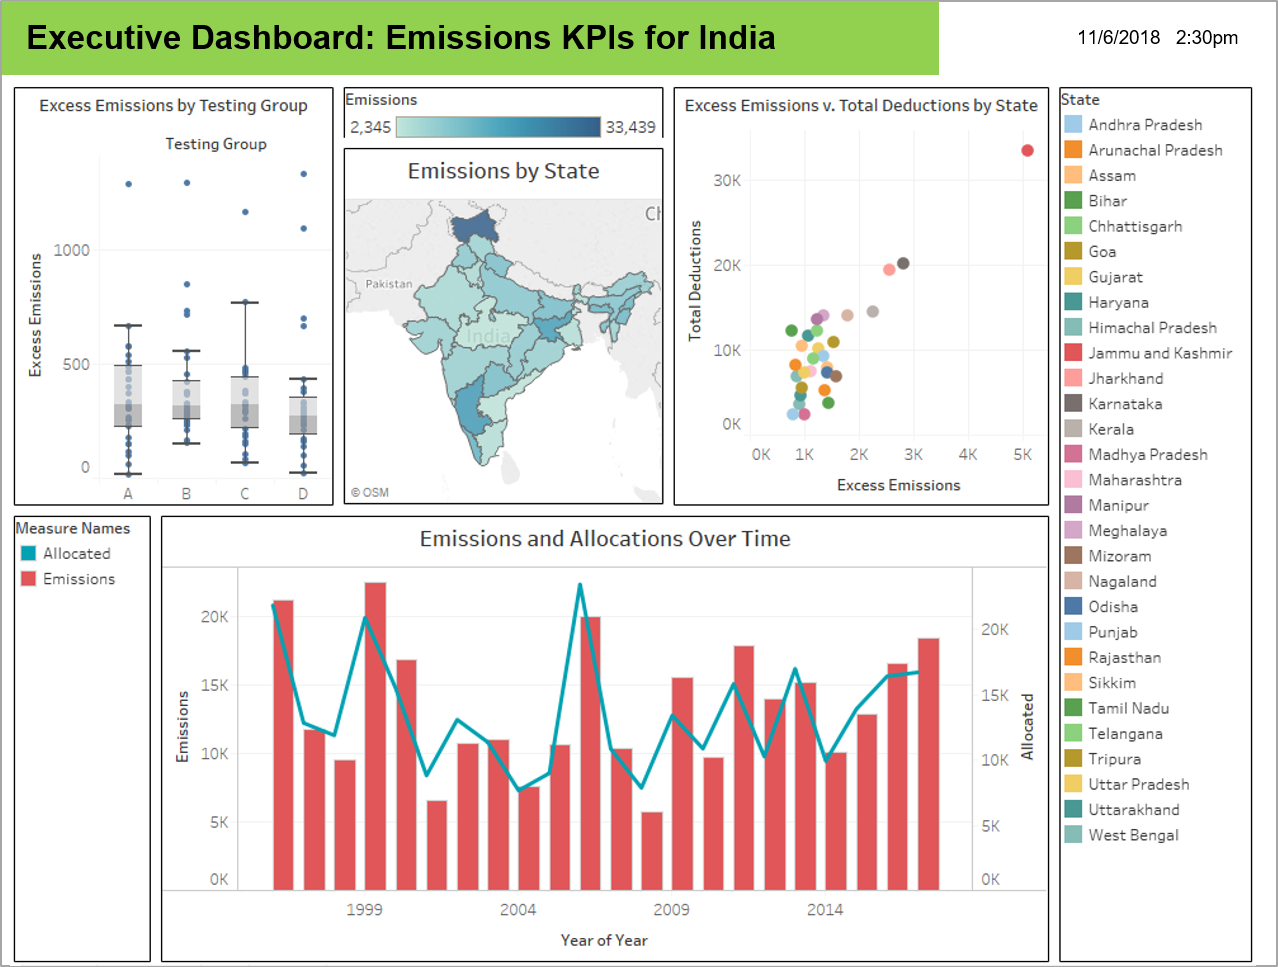
Dashboard example 2
Learn more here.