Analyze - Gaining Deeper Insights
How can advanced analytics help you extract new insights from you data?
Most companies have built programs and systems to understand “what happened?” and “why did it happen?” Machine learning and AI leads to new questions like “what will happen next?” and “what actions should I take when this happens?” This brief focuses on the key business challenge for the Analyze stage in the Data Science Lifecycle. Analyze is when you will apply data science tools and techniques to gain deeper insights from your data, and drive further inquiries to help solve business or operational problems.
Objective
Your objective is to explore new data science tools that can be integrated into your company’s toolset to enable advanced analytic modeling. With data science you can use data that may have been underutilized, or perhaps not used at all. You can also generate insights from data that was collected or used for a different purpose For example, many utilities participate in industry benchmarking, and find that reporting on metrics is valuable. With predictive analytics, you might capture even more value by asking a slightly different set of questions.
| Reporting on metrics might start with... | While data science methods might add... |
|---|---|
| How many poles did each company replace? | Why did companies on th east coast replace poles at a rate 25% higher than the west coast? |
| Tallying responses received to a set of survey questions | Using survey responses as a dataset, merging it with external data (e.g., weather data, household demographics) and finding significant correlations beyond the responses. |
| Historical information | Predictive or Prescription modeling that helps to make future decisions |
| Reactive | Proactive |
| Tracks company performance | Shapes company performance |
Using Advanced Analytics
The Analyze stage involves using techniques such as multivariate analysis and predictive analysis, both of which are enhanced with the use of multiple data sources including external data.
-
Get a more sophisticated understanding of the metrics data by applying multivariate analysis.
-
These Statistical techniques help you discover the interrelationships between variables.
Get a more sophisticated understanding of the metrics data by applying multivariate analysis.
These Statistical techniques help you discover the interrelationships between variables.
Get a more sophisticated understanding of the metrics data by applying multivariate analysis.
These Statistical techniques help you discover the interrelationships between variables.
1Properly frame your data science questions
Precision is important because your question has to be supported by the available data. If you were to ask: What is the likelihood that this piece of equipment will fail within the next 7 days? In order to analyze it, you would need a historical record of equipment failures with at least daily frequency. If you’ve only collected that data on a monthly basis, or the asset has never had a failure, the proposed question may not be a good starting point.
2Prepare your data
Once you refine your business or operational question, and matched it with relevant datasets, your focus turns to data preparation. In predictive analytics, it’s common to spend up to 80% of your project time on data preparation. Raw data may have issues with missing values, duplicate records, or inconsistencies. Data from multiple sources may need to be joined to create newly combined records. From these diverse inputs, you may need to derive new variables.
For example, a single parameter may not be predictive, but a calculated ratio using that parameter is. All of this work must take place before your analysis can truly begin. And often, preparing the data is iterative, so you may return to deriving new variables and merging additional data sources as your understanding of the problem evolves.
Translate Your Operational Problem Into Data Questions
Suppose your utility has a class of aging assets, and you want to extend the life of those assets, identify critical equipment to replace, and improve your use of limited resources. To help you refine precise data science questions, it helps to map the operational problems to causes (in data terms), and available datasets that could be used for analysis.
Key Insights
- Advanced data science tools can help identify new patterns in existing data and enable you to determine which factors are potential predictors of future outcomes.
- By integrating multiple data sources, you can gain deeper insights and better understand what correlations have the greatest impact on your metrics.
- Displaying results of analytic models graphically helps you are more quickly identify relevant relationships with the data.
Example: Exploring the Impact of Weather on Electric Pole Replacement
With data science, you can pose different questions about your operations. In this example, we conduct a simple exploration of the relationship between weather and electric power pole replacement.
| We would like to predict the effect that: | Extreme Weather |
| has on: | the frequency of electric pole replacement |
| because if we knew, we would: | Focus on pole inspections and proactive replacements in service territories that have consistently bad weather |
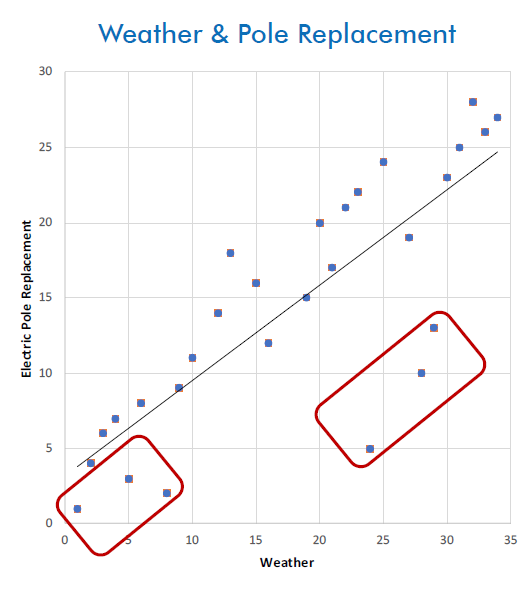
In this scenario, we needed a way to compare companies. Instead of using raw data, like inches of snowfall or number of poles replaced, we calculated rankings for the companies. We identified which companies replaced the most poles, and which had the highest number of extreme weather events.
In visualizing performance from this ranked perspective, Company A and Company B looked more similar, even though Company A replaced many more poles. This ranking method also helped to identify groups of companies that did not fit the generalized patterns.
Data visualization like this can help point you toward datasets that might be valuable in a predictive model. You might want to acquire data on pole materials, construction, soil conditions, prolonged vs. acute weather events, and much more. With data science, you can evaluate potentially thousands of inputs, and assess the degree to which each one contributes to an accurate prediction.
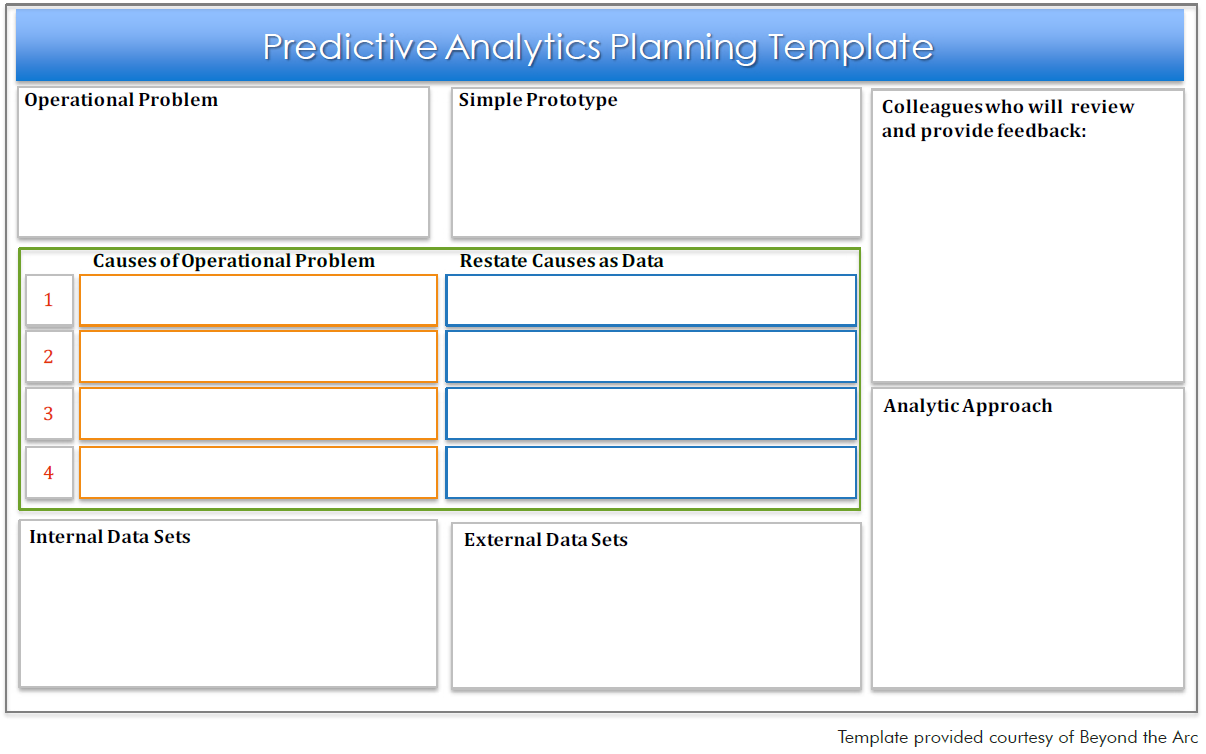
Plan Before You Analyze
This planning template is a handy “quick start” tool to help you identify the key elements you will need for an analytics project. If you’re still exploring which data science solutions to use, take advantage of the Analytics Technology Evaluation Scorecard.
Quick Tips
- Demonstrate the benefits of data science on projects that people in your organization can understand and relate to.
- Choose technologies with a graphical user interface and require minimal or no programming skills. The easier the technology is to learn and apply, the more likely your staff will use it.
- Implement a proof of principle and explore various analytic technology solutions. This practical experience will help you determine which ones will best meet you company’s needs.