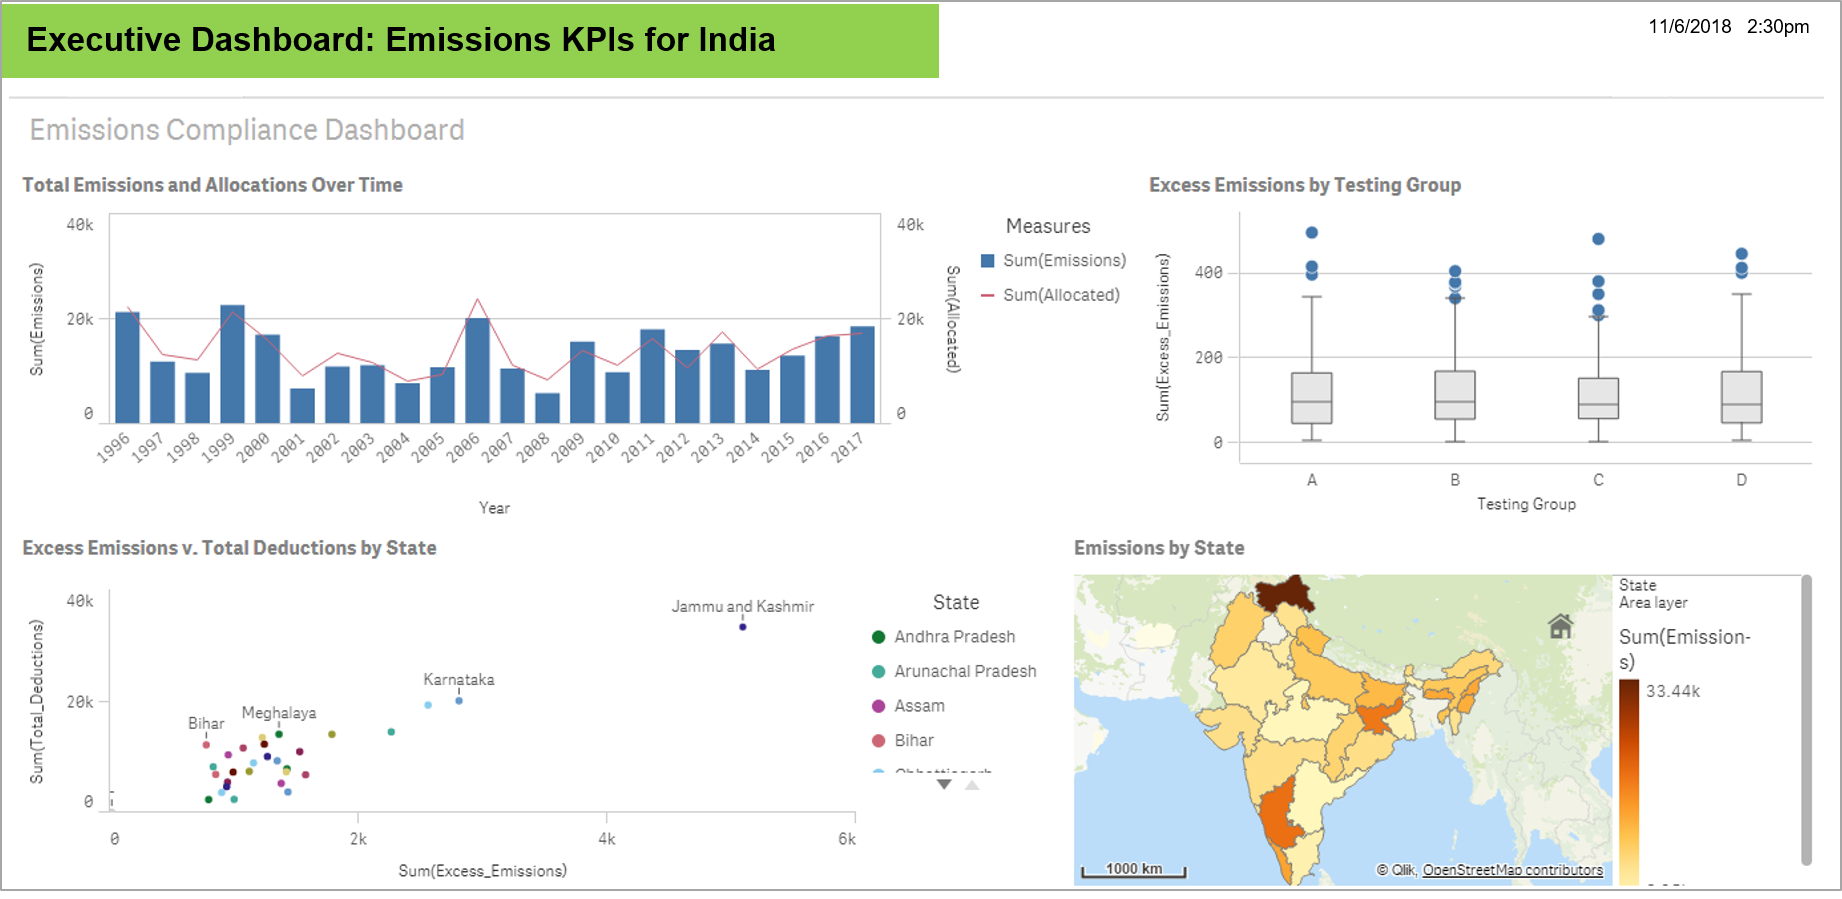
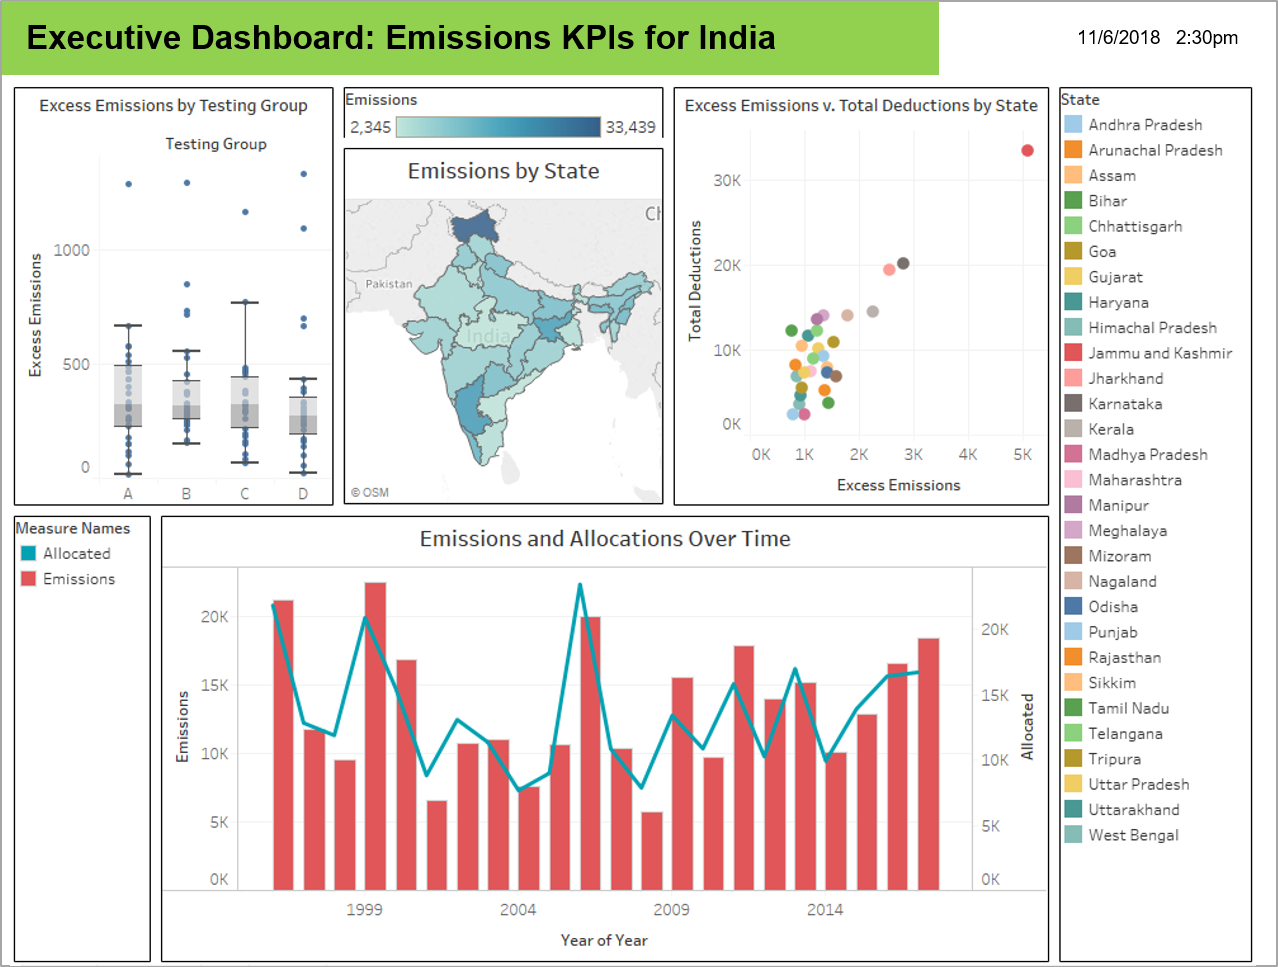
Data visualizations that highlight new insights. This use case took dat from a predictor tool in Generation to discover new insights with visualizations.
Data visualizations that highlight new insights. This use case took dat from a predictor tool in Generation to discover new insights with visualizations.
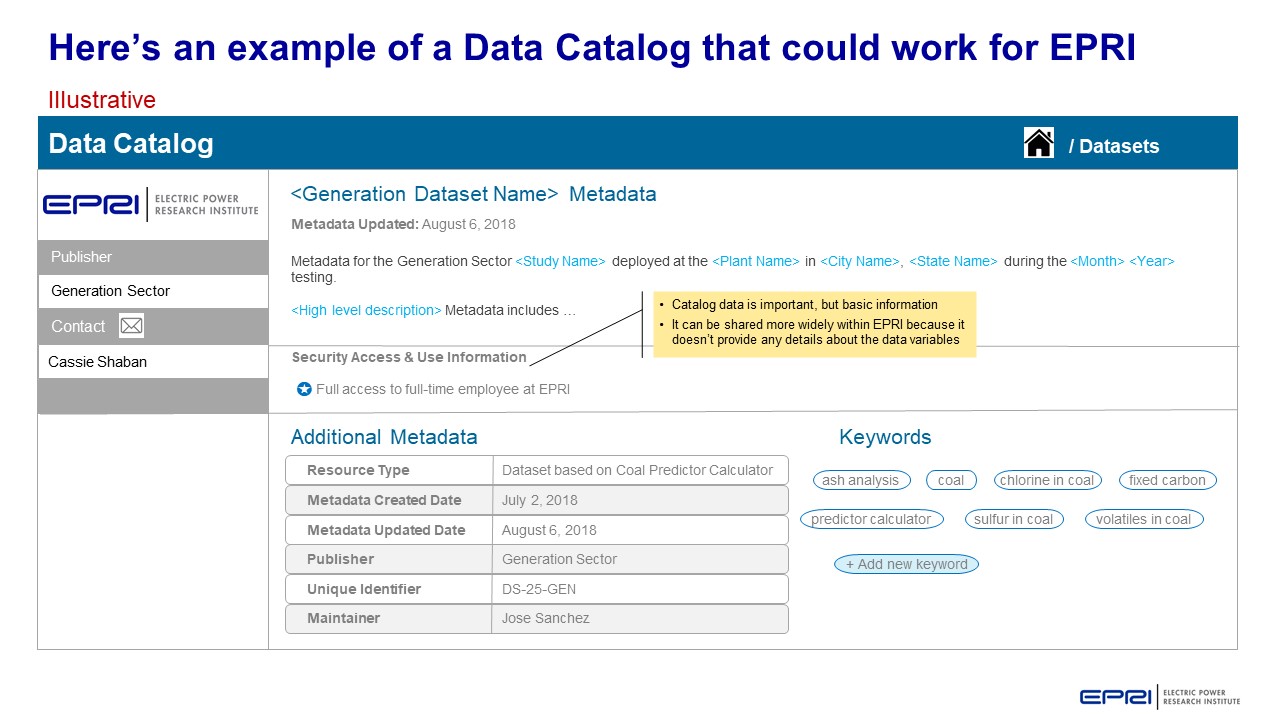
Visualizations help to identify patterns in data to discover and understand stories.
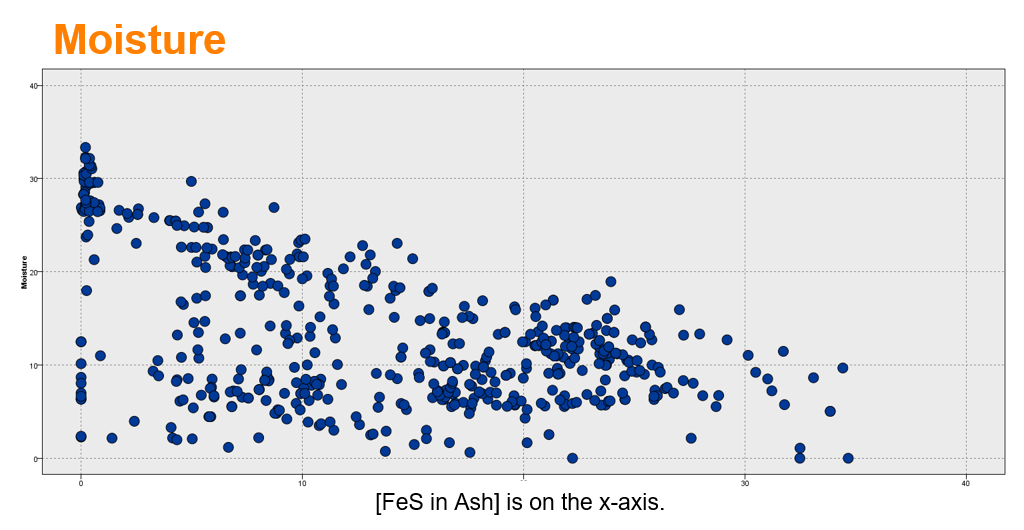
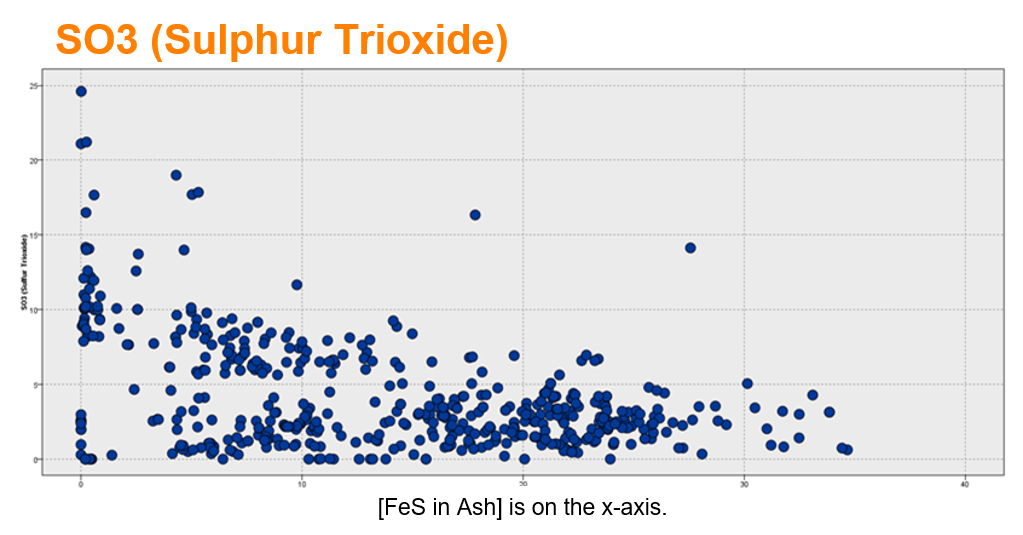
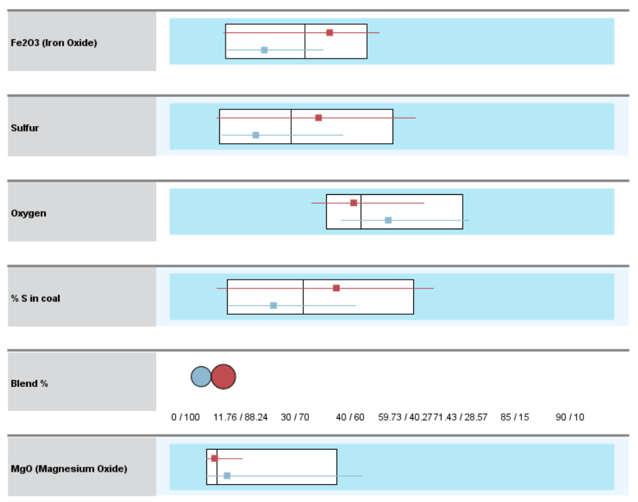
Relationship between input and output
Target = FeS in Ash (% weight)
These charts show a mixed relationship with FeS in Ash (% weight). There may be two (or more) patterns.
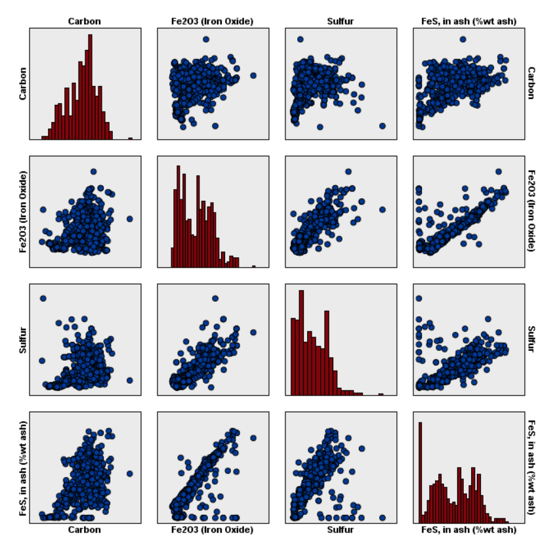
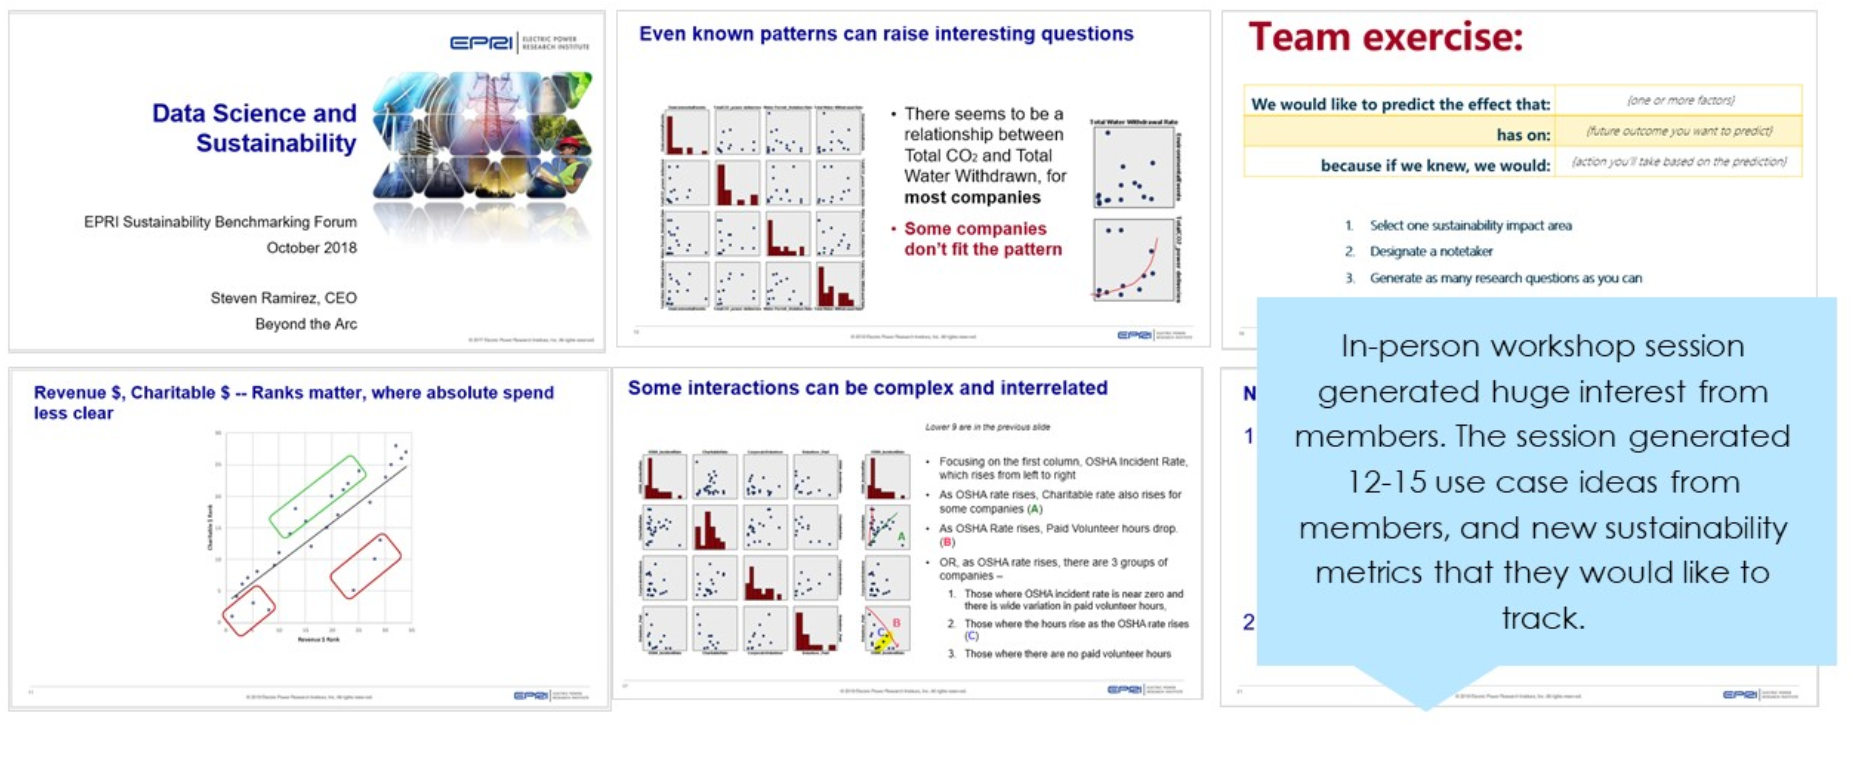
Carbon is an important predictor in the model
Red plots are histograms.
Blue plots show the scatter relationship at this intersection in the grid. For example, in the bottom row, second column, the relationship between Fe2O3 and FeS in Ash is plotted.
The histograms for each of these parameters suggest that there might be two groups in each dimension instead of one, but the scatterplot shows a fairly strong correlation.
Cluster Comparison - Scale
Box plots show the median surrounded by the interquartile range (25th percentile to 75th percentile. The 2 clusters are well-separated.)
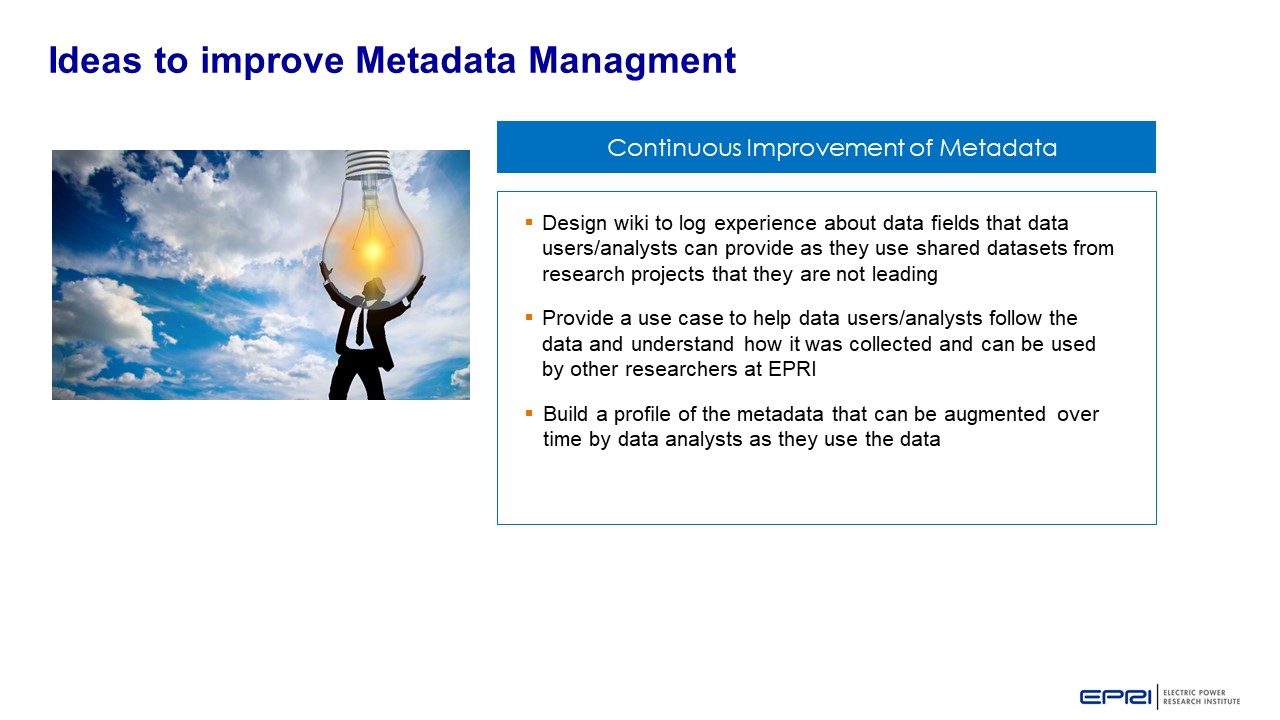
Opportunity to use data science share with members a different point of view of their data.
Multivariate analysis: Provide members with more sophisticated understanding of the benchmark data by applying multivariate analysis. Discover the interrelationships between multiple variables in the study.
Predictive analysis: Members are interested in the interrelationship of the sustainability efforts. There is an opportunity to understand the causation that may be correlated to sustainability variables in the study.
External data: Provide members with greater context for the metrics by incorporating external data to understand climate, demographics, GIS/mapping and plant operations data may affect sustainability results. For example, the EPA has emissions and water flow data at a high level of detail that can inform the member’s sustainability strategy.
Facilitate a workshop with members
Engaging members with data science
Member engagement: The TI project gave the Sustainability team an opportunity to start a dialogue with members about their hypothesis and the metrics that are of greatest importance to them. The workshop with members generated 12-15 hypothesis to explore.
Predictive variables: Through our analysis, we identified variables that might be better predictors of future performance and tagged them as valid and invalid variables.
SPSS Training: Provided Morgan Scott and a her analyst with training on using SPSS Modeler so that they can continue to explore her data without restrictions and pursue the issue of interests that the members identified during the workshop.