Demography of Distribution Assets
Demography of distribution cables, transformers and network assets
Categories:
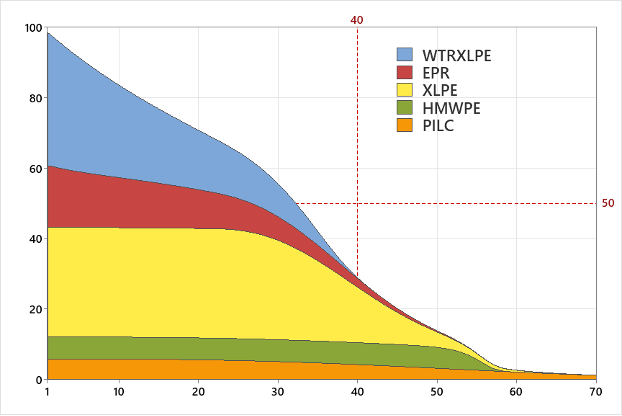
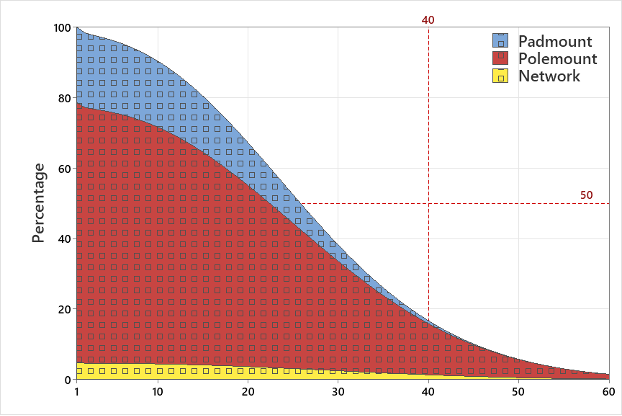
Aging assets is commonly identified as a major concern for utilities in the distribution arena. Prior to devising strategies to mitigate the effects of ageing assets it is important to understand the magnitude of the problem in terms of both the age of the asset and the number of assets involved.
As part of ongoing research utilities are invited to provide information for their assets which are collated to provide an industry overview. Such an overview may be used to provide a context for utility specific analyses.
The table below provides the age ranges for the assets currently in use within the Distribution System
Data gathering and analysis for this research is ongoing. As new results become available they will be used to update this page.
| Asset | Age Range (years) | Population | Learn More | |
| Lower Quartile | Upper Quartile | |||
| EPR Cable | 12 | 35 |
 963,000 miles
 |
Cables |
| HMWPE Cable | 53 | 57 | ||
| PILC Cable | 38 | 68 | ||
| WTRXLPE Cable | 9 | 30 | ||
| XLPE Cable | 35 | 46 | ||
| Network Transformers | 20 | 42 |
 >5,000,000 units
 | Transformers |
| Padmount Transformers | 13 | 241 | ||
| Polemount Transformers | 16 | 37 | ||
| Network Protectors | 10 | 27 | 38,000 | Network Components |
| Network Structures | 56 | 77 | 450,000 | |
| Network Primary Cable (all types) | 17 | 44 | >16,000 miles | |