An often-cited challenge for operators of underground systems is the loss of intuitional knowledge due to employee attrition. This challenge is particularly pronounced in urban underground and network systems, where knowledge is often held by relatively few individuals. This area of research seeks to identify, document and share institutional knowledge of underground systems through the development of references, information repositories and training. This research area includes regular updates to the EPRI Underground Distribution Systems Reference Manual (The Bronze Book) and the EPRI Underground Practices repository, a compendium of industry practices for managing underground systems.
This the multi-page printable view of this section. Click here to print.
Knowledge
Compilation of underground practices and training
- 1: Bronze Book
- 2: Utility Information Exchange
- 2.1: P180.002 Underground 2021 ARP Utility Information Exchange - June 17, 2021
- 2.2: P180.002 & P180.004 Issues with Cable Locating and Abandoning Underground Cable – Dec 10, 2021
- 2.3: P180.002 Underground Infrared Thermography Utility Information Exchange - May 18, 2022
- 2.4: P180.002 Underground Padmounted Equipment Inspection - July 28, 2022
- 2.5: P180.002 Underground Corrosion (part of Task force Meeting), May 16, 2023
- 3: Network Training
- 4: Network Reference
- 4.1: Introduction and Overview of Secondary Network Systems
- 4.2: General Design Considerations
- 4.3: Network Substation Design
- 4.4: Primary System Grounding
- 4.5: Primary Feeder Protection
- 4.6: Network Unit Equipment
- 4.7: Backfeed Currents for Primary Feeder Faults
- 4.8: Network Overvoltages During Backfeed
- 4.9: Secondary Grid Design Considerations
- 4.10: Network Protector Relaying
- 4.11: Network System Modeling
- 4.12: 480 Volt Spot Network Protection
- 4.13: Medium Voltage Spot Network Systems
- 4.14: Closed Transition Switching and Distributed Generation
- 4.15: Measures to Reduce Arc-Flash Hazards in 480-Volt Spot Networks
- 4.16: Special System Events
- 4.17: Appendix 1
- 4.18: Appendix 2
- 4.19: Appendix 3
- 4.20: Appendix 4
- 4.21: Appendix 5
- 5: Interest Groups
- 6: Apps for Low-Voltage Network Scenarios
- 6.1: Background on Network-Protector Relaying
- 6.2: Network Backfeeds for an Open Feeder
- 6.3: Network-Protector Operations with a Primary-Side Blown Fuse
- 6.4: Crossed or Rolled Phases on the Primary
- 7: Underground Practices Repository
- 7.1: About the Repository
- 7.2: Company Summaries
- 7.2.1: AEP - Ohio
- 7.2.2: Ameren Missouri
- 7.2.3: BC Hydro
- 7.2.4: CEI - The Illuminating Company
- 7.2.5: CenterPoint Energy
- 7.2.6: Central Hudson Gas & Electric
- 7.2.7: Con Edison - Consolidated Edison
- 7.2.8: Duke Energy Florida
- 7.2.9: Duke Energy Ohio
- 7.2.10: Energex
- 7.2.11: ESB Networks
- 7.2.12: Georgia Power
- 7.2.13: HECO - The Hawaiian Electric Company
- 7.2.14: National Grid (Albany)
- 7.2.15: PG&E
- 7.2.16: Portland General Electric
- 7.2.17: SCL - Seattle City Light
- 7.2.18: Tampa Electric
- 7.3: Construction
- 7.3.1: Account Management-Scheduling
- 7.3.1.1: Portland General Electric
- 7.3.2: Cable Installation and Replacement
- 7.3.2.1: AEP - Ohio
- 7.3.2.2: Duke Energy Florida
- 7.3.2.3: ESB Networks
- 7.3.2.4: Georgia Power
- 7.3.2.5: Portland General Electric
- 7.3.2.6: References
- 7.3.3: Cable Pulling
- 7.3.3.1: Ameren Missouri
- 7.3.3.2: CEI - The Illuminating Company
- 7.3.3.3: CenterPoint Energy
- 7.3.3.4: Con Edison - Consolidated Edison
- 7.3.3.5: Duke Energy Florida
- 7.3.3.6: Duke Energy Ohio
- 7.3.3.7: Energex
- 7.3.3.8: ESB Networks
- 7.3.3.9: Georgia Power
- 7.3.3.10: HECO - The Hawaiian Electric Company
- 7.3.3.11: National Grid
- 7.3.3.12: PG&E
- 7.3.3.13: Portland General Electric
- 7.3.3.14: SCL - Seattle City Light
- 7.3.3.15: References
- 7.3.4: Cable Quality Control
- 7.3.4.1: AEP - Ohio
- 7.3.4.2: Ameren Missouri
- 7.3.4.3: CenterPoint Energy
- 7.3.4.4: Con Edison - Consolidated Edison
- 7.3.4.5: Duke Energy Florida
- 7.3.4.6: Duke Energy Ohio
- 7.3.4.7: Energex
- 7.3.4.8: ESB Networks
- 7.3.4.9: Georgia Power
- 7.3.4.10: National Grid
- 7.3.4.11: PG&E
- 7.3.4.12: SCL - Seattle City Light
- 7.3.4.13: Survey Results
- 7.3.5: Civil Construction
- 7.3.5.1: AEP - Ohio
- 7.3.5.2: Ameren Missouri
- 7.3.5.3: CEI - The Illuminating Company
- 7.3.5.4: CenterPoint Energy
- 7.3.5.5: Con Edison - Consolidated Edison
- 7.3.5.6: Duke Energy Florida
- 7.3.5.7: Duke Energy Ohio
- 7.3.5.8: Energex
- 7.3.5.9: ESB Networks
- 7.3.5.10: Georgia Power
- 7.3.5.11: HECO - The Hawaiian Electric Company
- 7.3.5.12: National Grid
- 7.3.5.13: PG&E
- 7.3.5.14: SCL - Seattle City Light
- 7.3.5.15: Survey Results
- 7.3.6: Contracting
- 7.3.6.1: AEP - Ohio
- 7.3.6.2: Ameren Missouri
- 7.3.6.3: CEI - The Illuminating Company
- 7.3.6.4: CenterPoint Energy
- 7.3.6.5: Con Edison - Consolidated Edison
- 7.3.6.6: Duke Energy Florida
- 7.3.6.7: Duke Energy Ohio
- 7.3.6.8: Georgia Power
- 7.3.6.9: HECO - The Hawaiian Electric Company
- 7.3.6.10: National Grid
- 7.3.6.11: PG&E
- 7.3.6.12: Portland General Electric
- 7.3.6.13: SCL - Seattle City Light
- 7.3.6.14: Survey Results
- 7.3.7: Crew Makeup - Job Progression
- 7.3.7.1: AEP - Ohio
- 7.3.7.2: Ameren Missouri
- 7.3.7.3: CEI - The Illuminating Company
- 7.3.7.4: CenterPoint Energy
- 7.3.7.5: Con Edison - Consolidated Edison
- 7.3.7.6: Duke Energy Florida
- 7.3.7.7: Duke Energy Ohio
- 7.3.7.8: Energex
- 7.3.7.9: ESB Networks
- 7.3.7.10: Georgia Power
- 7.3.7.11: HECO - The Hawaiian Electric Company
- 7.3.7.12: National Grid
- 7.3.7.13: PG&E
- 7.3.7.14: Portland General Electric
- 7.3.7.15: SCL - Seattle City Light
- 7.3.7.16: Practices Comparison
- 7.3.7.17: Survey Results
- 7.3.8: Field IT Technology/Training
- 7.3.8.1: Portland General Electric
- 7.3.9: Manholes
- 7.3.9.1: Ameren Missouri
- 7.3.9.2: Duke Energy Florida
- 7.3.9.3: Georgia Power
- 7.3.9.4: Portland General Electric
- 7.3.9.5: Survey Results
- 7.3.10: Master Reel
- 7.3.10.1: CenterPoint Energy
- 7.3.11: Material Failure Reporting System
- 7.3.11.1: AEP - Ohio
- 7.3.11.2: Ameren Missouri
- 7.3.11.3: CEI - The Illuminating Company
- 7.3.11.4: CenterPoint Energy
- 7.3.11.5: Con Edison - Consolidated Edison
- 7.3.11.6: Duke Energy Florida
- 7.3.11.7: Duke Energy Ohio
- 7.3.11.8: Energex
- 7.3.11.9: ESB Networks
- 7.3.11.10: Georgia Power
- 7.3.11.11: National Grid
- 7.3.11.12: PG&E
- 7.3.11.13: Portland General Electric
- 7.3.11.14: Survey Results
- 7.3.12: Organization
- 7.3.12.1: AEP - Ohio
- 7.3.12.2: Ameren Missouri
- 7.3.12.3: CEI - The Illuminating Company
- 7.3.12.4: CenterPoint Energy
- 7.3.12.5: Con Edison - Consolidated Edison
- 7.3.12.6: Duke Energy Florida
- 7.3.12.7: Duke Energy Ohio
- 7.3.12.8: Energex
- 7.3.12.9: ESB Networks
- 7.3.12.10: Georgia Power
- 7.3.12.11: HECO - The Hawaiian Electric Company
- 7.3.12.12: National Grid
- 7.3.12.13: PG&E
- 7.3.12.14: Portland General Electric
- 7.3.12.15: SCL - Seattle City Light
- 7.3.12.16: Survey Results
- 7.3.13: Pre-cast Concrete Conduits
- 7.3.13.1: CEI - The Illuminating Company
- 7.3.13.2: Con Edison - Consolidated Edison
- 7.3.13.3: Duke Energy Ohio
- 7.3.14: Project Management
- 7.3.14.1: AEP - Ohio
- 7.3.14.2: Ameren Missouri
- 7.3.14.3: CEI - The Illuminating Company
- 7.3.14.4: CenterPoint Energy
- 7.3.14.5: Con Edison - Consolidated Edison
- 7.3.14.6: Duke Energy Florida
- 7.3.14.7: Duke Energy Ohio
- 7.3.14.8: Energex
- 7.3.14.9: ESB Networks
- 7.3.14.10: Georgia Power
- 7.3.14.11: HECO - The Hawaiian Electric Company
- 7.3.14.12: National Grid
- 7.3.14.13: PG&E
- 7.3.14.14: Portland General Electric
- 7.3.14.15: SCL - Seattle City Light
- 7.3.14.16: Survey Results
- 7.3.15: Separable Connector Installation
- 7.3.15.1: Duke Energy Florida
- 7.3.15.2: HECO - The Hawaiian Electric Company
- 7.3.15.3: Survey Results
- 7.3.16: Splicing
- 7.3.16.1: AEP - Ohio
- 7.3.16.2: Ameren Missouri
- 7.3.16.3: CEI - The Illuminating Company
- 7.3.16.4: CenterPoint Energy
- 7.3.16.5: Con Edison - Consolidated Edison
- 7.3.16.6: Duke Energy Florida
- 7.3.16.7: Duke Energy Ohio
- 7.3.16.8: Energex
- 7.3.16.9: ESB Networks
- 7.3.16.10: Georgia Power
- 7.3.16.11: HECO - The Hawaiian Electric Company
- 7.3.16.12: National Grid
- 7.3.16.13: PG&E
- 7.3.16.14: Portland General Electric
- 7.3.16.15: SCL - Seattle City Light
- 7.3.16.16: References
- 7.3.16.17: Survey Results
- 7.3.17: Three Phase Pad Mounted Transformer Installation
- 7.3.17.1: CenterPoint Energy
- 7.3.18: Training Facility
- 7.3.18.1: Portland General Electric
- 7.3.19: Resource Management
- 7.3.19.1: Portland General Electric
- 7.3.20: Vault Grounding
- 7.3.20.1: AEP - Ohio
- 7.3.20.2: Ameren Missouri
- 7.3.20.3: CEI - The Illuminating Company
- 7.3.20.4: CenterPoint Energy
- 7.3.20.5: Duke Energy Florida
- 7.3.20.6: Duke Energy Ohio
- 7.3.20.7: National Grid
- 7.3.20.8: PG&E
- 7.3.20.9: Portland General Electric
- 7.3.20.10: SCL - Seattle City Light
- 7.3.20.11: Survey Results
- 7.4: Design
- 7.4.1: Cable Design
- 7.4.1.1: AEP - Ohio
- 7.4.1.2: Ameren Missouri
- 7.4.1.3: CEI - The Illuminating Company
- 7.4.1.4: CenterPoint Energy
- 7.4.1.5: Con Edison - Consolidated Edison
- 7.4.1.6: Duke Energy Florida
- 7.4.1.7: Duke Energy Ohio
- 7.4.1.8: Energex
- 7.4.1.9: ESB Networks
- 7.4.1.10: Georgia Power
- 7.4.1.11: HECO - The Hawaiian Electric Company
- 7.4.1.12: National Grid
- 7.4.1.13: PG&E
- 7.4.1.14: Portland General Electric
- 7.4.1.15: SCL - Seattle City Light
- 7.4.1.16: References
- 7.4.1.17: Survey Results
- 7.4.2: Cable Limiter Application
- 7.4.2.1: AEP - Ohio
- 7.4.2.2: Ameren Missouri
- 7.4.2.3: CEI - The Illuminating Company
- 7.4.2.4: CenterPoint Energy
- 7.4.2.5: Con Edison - Consolidated Edison
- 7.4.2.6: Duke Energy Florida
- 7.4.2.7: Duke Energy Ohio
- 7.4.2.8: Georgia Power
- 7.4.2.9: HECO - The Hawaiian Electric Company
- 7.4.2.10: National Grid
- 7.4.2.11: PG&E
- 7.4.2.12: Portland General Electric
- 7.4.2.13: SCL - Seattle City Light
- 7.4.2.14: Practices Comparison
- 7.4.2.15: References
- 7.4.2.16: Survey Results
- 7.4.3: Civil Design
- 7.4.3.1: Duke Energy Florida
- 7.4.3.2: Energex
- 7.4.3.3: ESB Networks
- 7.4.3.4: Georgia Power
- 7.4.3.5: References
- 7.4.4: Key Accounts
- 7.4.4.1: AEP - Ohio
- 7.4.4.2: Ameren Missouri
- 7.4.4.3: CenterPoint Energy
- 7.4.4.4: Con Edison - Consolidated Edison
- 7.4.4.5: Duke Energy Florida
- 7.4.4.6: Duke Energy Ohio
- 7.4.4.7: Energex
- 7.4.4.8: ESB Networks
- 7.4.4.9: Georgia Power
- 7.4.4.10: HECO - The Hawaiian Electric Company
- 7.4.4.11: National Grid
- 7.4.4.12: PG&E
- 7.4.4.13: Portland General Electric
- 7.4.4.14: SCL - Seattle City Light
- 7.4.5: Mapping - Recording “As-Builts”
- 7.4.5.1: AEP - Ohio
- 7.4.5.2: Ameren Missouri
- 7.4.5.3: CEI - The Illuminating Company
- 7.4.5.4: CenterPoint Energy
- 7.4.5.5: Con Edison - Consolidated Edison
- 7.4.5.6: Duke Energy Florida
- 7.4.5.7: Duke Energy Ohio
- 7.4.5.8: Energex
- 7.4.5.9: ESB Networks
- 7.4.5.10: Georgia Power
- 7.4.5.11: HECO - The Hawaiian Electric Company
- 7.4.5.12: National Grid
- 7.4.5.13: PG&E
- 7.4.5.14: Portland General Electric
- 7.4.5.15: SCL - Seattle City Light
- 7.4.6: Network Area Substation Design
- 7.4.6.1: AEP - Ohio
- 7.4.6.2: Ameren Missouri
- 7.4.6.3: CEI - The Illuminating Company
- 7.4.6.4: CenterPoint Energy
- 7.4.6.5: Con Edison - Consolidated Edison
- 7.4.6.6: Duke Energy Florida
- 7.4.6.7: Duke Energy Ohio
- 7.4.6.8: Energex
- 7.4.6.9: ESB Networks
- 7.4.6.10: Georgia Power
- 7.4.6.11: HECO - The Hawaiian Electric Company
- 7.4.6.12: National Grid
- 7.4.6.13: PG&E
- 7.4.6.14: SCL - Seattle City Light
- 7.4.6.15: References
- 7.4.7: Network Design
- 7.4.7.1: AEP - Ohio
- 7.4.7.2: Ameren Missouri
- 7.4.7.3: CEI - The Illuminating Company
- 7.4.7.4: CenterPoint Energy
- 7.4.7.5: Con Edison - Consolidated Edison
- 7.4.7.6: Duke Energy Florida
- 7.4.7.7: Duke Energy Ohio
- 7.4.7.8: Energex
- 7.4.7.9: ESB Networks
- 7.4.7.10: Georgia Power
- 7.4.7.11: HECO - The Hawaiian Electric Company
- 7.4.7.12: National Grid
- 7.4.7.13: PG&E
- 7.4.7.14: Portland General Electric
- 7.4.7.15: SCL - Seattle City Light
- 7.4.7.16: References
- 7.4.7.17: Survey Results
- 7.4.8: Network Protector Design
- 7.4.8.1: AEP - Ohio
- 7.4.8.2: Ameren Missouri
- 7.4.8.3: CEI - The Illuminating Company
- 7.4.8.4: CenterPoint Energy
- 7.4.8.5: Con Edison - Consolidated Edison
- 7.4.8.6: Duke Energy Florida
- 7.4.8.7: Duke Energy Ohio
- 7.4.8.8: Energex
- 7.4.8.9: ESB Networks
- 7.4.8.10: Georgia Power
- 7.4.8.11: HECO - The Hawaiian Electric Company
- 7.4.8.12: National Grid
- 7.4.8.13: PG&E
- 7.4.8.14: SCL - Seattle City Light
- 7.4.8.15: References
- 7.4.9: Network Rehabilitation
- 7.4.9.1: AEP - Ohio
- 7.4.9.2: Ameren Missouri
- 7.4.9.3: Duke Energy Florida
- 7.4.9.4: Duke Energy Ohio
- 7.4.9.5: Energex
- 7.4.9.6: Georgia Power
- 7.4.9.7: PG&E
- 7.4.9.8: References
- 7.4.9.9: Survey Results
- 7.4.10: Network Reliability
- 7.4.10.1: Con Edison - Consolidated Edison
- 7.4.10.2: HECO - The Hawaiian Electric Company
- 7.4.10.3: AEP - Ohio
- 7.4.10.4: Ameren Missouri
- 7.4.10.5: CEI - The Illuminating Company
- 7.4.10.6: Duke Energy Florida
- 7.4.10.7: Duke Energy Ohio
- 7.4.10.8: Energex
- 7.4.10.9: ESB Networks
- 7.4.10.10: Georgia Power
- 7.4.10.11: National Grid
- 7.4.10.12: PG&E
- 7.4.10.13: Survey Results
- 7.4.11: Network Transformer Design
- 7.4.11.1: AEP - Ohio
- 7.4.11.2: Ameren Missouri
- 7.4.11.3: CEI - The Illuminating Company
- 7.4.11.4: CenterPoint Energy
- 7.4.11.5: Con Edison - Consolidated Edison
- 7.4.11.6: Duke Energy Florida
- 7.4.11.7: Duke Energy Ohio
- 7.4.11.8: Georgia Power
- 7.4.11.9: HECO - The Hawaiian Electric Company
- 7.4.11.10: National Grid
- 7.4.11.11: PG&E
- 7.4.11.12: SCL - Seattle City Light
- 7.4.11.13: Practices Comparison
- 7.4.11.14: References
- 7.4.11.15: Survey Results
- 7.4.12: Network Transformers—Primary Switch
- 7.4.12.1: AEP - Ohio
- 7.4.12.2: Ameren Missouri
- 7.4.12.3: CEI - The Illuminating Company
- 7.4.12.4: CenterPoint Energy
- 7.4.12.5: Con Edison - Consolidated Edison
- 7.4.12.6: Duke Energy Florida
- 7.4.12.7: Duke Energy Ohio
- 7.4.12.8: Energex
- 7.4.12.9: ESB Networks
- 7.4.12.10: Georgia Power
- 7.4.12.11: HECO - The Hawaiian Electric Company
- 7.4.12.12: National Grid
- 7.4.12.13: PG&E
- 7.4.12.14: SCL - Seattle City Light
- 7.4.12.15: Practices Comparison
- 7.4.12.16: References
- 7.4.12.17: Survey Results
- 7.4.13: Network Unit Design
- 7.4.13.1: AEP - Ohio
- 7.4.13.2: Ameren Missouri
- 7.4.13.3: CenterPoint Energy
- 7.4.13.4: Duke Energy Florida
- 7.4.13.5: Duke Energy Ohio
- 7.4.13.6: Georgia Power
- 7.4.13.7: National Grid
- 7.4.13.8: PG&E
- 7.4.13.9: Portland General Electric
- 7.4.13.10: References
- 7.4.14: New Service Design
- 7.4.14.1: Ameren Missouri
- 7.4.14.2: CEI - The Illuminating Company
- 7.4.14.3: CenterPoint Energy
- 7.4.14.4: Con Edison - Consolidated Edison
- 7.4.14.5: Duke Energy Florida
- 7.4.14.6: Duke Energy Ohio
- 7.4.14.7: Energex
- 7.4.14.8: ESB Networks
- 7.4.14.9: HECO - The Hawaiian Electric Company
- 7.4.14.10: National Grid
- 7.4.14.11: PG&E
- 7.4.14.12: SCL - Seattle City Light
- 7.4.15: Non-Network Design
- 7.4.15.1: Ameren Missouri
- 7.4.15.2: CEI - The Illuminating Company
- 7.4.15.3: CenterPoint Energy
- 7.4.15.4: Duke Energy Florida
- 7.4.15.5: Duke Energy Ohio
- 7.4.15.6: Energex
- 7.4.15.7: ESB Networks
- 7.4.15.8: Georgia Power
- 7.4.15.9: HECO - The Hawaiian Electric Company
- 7.4.15.10: National Grid
- 7.4.15.11: PG&E
- 7.4.15.12: Survey Results
- 7.4.16: Non-Network Service
- 7.4.16.1: Ameren Missouri
- 7.4.16.2: CEI - The Illuminating Company
- 7.4.16.3: CenterPoint Energy
- 7.4.16.4: Duke Energy Florida
- 7.4.16.5: HECO - The Hawaiian Electric Company
- 7.4.16.6: PG&E
- 7.4.17: Organization
- 7.4.17.1: AEP - Ohio
- 7.4.17.2: Ameren Missouri
- 7.4.17.3: CEI - The Illuminating Company
- 7.4.17.4: CenterPoint Energy
- 7.4.17.5: Con Edison - Consolidated Edison
- 7.4.17.6: Duke Energy Florida
- 7.4.17.7: Duke Energy Ohio
- 7.4.17.8: Energex
- 7.4.17.9: ESB Networks
- 7.4.17.10: Georgia Power
- 7.4.17.11: HECO - The Hawaiian Electric Company
- 7.4.17.12: National Grid
- 7.4.17.13: PG&E
- 7.4.17.14: Portland General Electric
- 7.4.17.15: SCL - Seattle City Light
- 7.4.17.16: Survey Results
- 7.4.18: Power Quality
- 7.4.18.1: AEP - Ohio
- 7.4.18.2: Ameren Missouri
- 7.4.18.3: CEI - The Illuminating Company
- 7.4.18.4: CenterPoint Energy
- 7.4.18.5: Con Edison - Consolidated Edison
- 7.4.18.6: Duke Energy Florida
- 7.4.18.7: Duke Energy Ohio
- 7.4.18.8: Energex
- 7.4.18.9: ESB Networks
- 7.4.18.10: Georgia Power
- 7.4.18.11: PG&E
- 7.4.18.12: Portland General Electric
- 7.4.18.13: SCL - Seattle City Light
- 7.4.19: Spot Network Design
- 7.4.19.1: AEP - Ohio
- 7.4.19.2: Ameren Missouri
- 7.4.19.3: CEI - The Illuminating Company
- 7.4.19.4: CenterPoint Energy
- 7.4.19.5: Con Edison - Consolidated Edison
- 7.4.19.6: Duke Energy Florida
- 7.4.19.7: Duke Energy Ohio
- 7.4.19.8: Georgia Power
- 7.4.19.9: HECO - The Hawaiian Electric Company
- 7.4.19.10: National Grid
- 7.4.19.11: PG&E
- 7.4.19.12: SCL - Seattle City Light
- 7.4.19.13: References
- 7.4.19.14: Survey Results
- 7.4.20: Standards
- 7.4.20.1: AEP - Ohio
- 7.4.20.2: Ameren Missouri
- 7.4.20.3: CEI - The Illuminating Company
- 7.4.20.4: CenterPoint Energy
- 7.4.20.5: Con Edison - Consolidated Edison
- 7.4.20.6: Duke Energy Florida
- 7.4.20.7: Duke Energy Ohio
- 7.4.20.8: Energex
- 7.4.20.9: ESB Networks
- 7.4.20.10: Georgia Power
- 7.4.20.11: HECO - The Hawaiian Electric Company
- 7.4.20.12: National Grid
- 7.4.20.13: PG&E
- 7.4.20.14: Portland General Electric
- 7.4.20.15: SCL - Seattle City Light
- 7.4.20.16: Survey Results
- 7.4.21: System Hardening
- 7.4.21.1: CenterPoint Energy
- 7.4.21.2: Con Edison - Consolidated Edison
- 7.4.21.3: Duke Energy Florida
- 7.4.21.4: Energex
- 7.4.21.5: Georgia Power
- 7.4.21.6: PG&E
- 7.4.21.7: Survey Results
- 7.4.22: Three Phase Loops
- 7.4.22.1: CenterPoint Energy
- 7.4.23: Vault - Manhole Design
- 7.4.23.1: AEP - Ohio
- 7.4.23.2: Ameren Missouri
- 7.4.23.3: CEI - The Illuminating Company
- 7.4.23.4: CenterPoint Energy
- 7.4.23.5: Con Edison - Consolidated Edison
- 7.4.23.6: Duke Energy Florida
- 7.4.23.7: Duke Energy Ohio
- 7.4.23.8: Energex
- 7.4.23.9: ESB Networks
- 7.4.23.10: Georgia Power
- 7.4.23.11: HECO - The Hawaiian Electric Company
- 7.4.23.12: National Grid
- 7.4.23.13: PG&E
- 7.4.23.14: Portland General Electric
- 7.4.23.15: SCL - Seattle City Light
- 7.4.23.16: References
- 7.4.23.17: Survey Results
- 7.4.24: Vault Design – Remote Trip Panel
- 7.4.24.1: CenterPoint Energy
- 7.5: Maintenance
- 7.5.1: Cable Testing - Diagnostics
- 7.5.1.1: AEP - Ohio
- 7.5.1.2: Ameren Missouri
- 7.5.1.3: CEI - The Illuminating Company
- 7.5.1.4: CenterPoint Energy
- 7.5.1.5: Con Edison - Consolidated Edison
- 7.5.1.6: Duke Energy Florida
- 7.5.1.7: Duke Energy Ohio
- 7.5.1.8: Energex
- 7.5.1.9: ESB Networks
- 7.5.1.10: Georgia Power
- 7.5.1.11: HECO - The Hawaiian Electric Company
- 7.5.1.12: National Grid
- 7.5.1.13: PG&E
- 7.5.1.14: Portland General Electric
- 7.5.1.15: SCL - Seattle City Light
- 7.5.1.16: Practices Comparison
- 7.5.1.17: References
- 7.5.1.18: Survey Results
- 7.5.2: Civil Maintenance
- 7.5.2.1: AEP - Ohio
- 7.5.2.2: Ameren Missouri
- 7.5.2.3: CEI - The Illuminating Company
- 7.5.2.4: CenterPoint Energy
- 7.5.2.5: Con Edison - Consolidated Edison
- 7.5.2.6: Duke Energy Florida
- 7.5.2.7: Duke Energy Ohio
- 7.5.2.8: Energex
- 7.5.2.9: ESB Networks
- 7.5.2.10: Georgia Power
- 7.5.2.11: HECO - The Hawaiian Electric Company
- 7.5.2.12: National Grid
- 7.5.2.13: PG&E
- 7.5.2.14: Portland General Electric
- 7.5.2.15: SCL - Seattle City Light
- 7.5.3: Elevated Voltage Testing (Stray Voltage)
- 7.5.3.1: Con Edison - Consolidated Edison
- 7.5.3.2: National Grid
- 7.5.3.3: Energex
- 7.5.4: Failure Analysis
- 7.5.4.1: AEP - Ohio
- 7.5.4.2: Ameren Missouri
- 7.5.4.3: CEI - The Illuminating Company
- 7.5.4.4: CenterPoint Energy
- 7.5.4.5: Con Edison - Consolidated Edison
- 7.5.4.6: Duke Energy Florida
- 7.5.4.7: Duke Energy Ohio
- 7.5.4.8: Energex
- 7.5.4.9: ESB Networks
- 7.5.4.10: Georgia Power
- 7.5.4.11: HECO - The Hawaiian Electric Company
- 7.5.4.12: National Grid
- 7.5.4.13: PG&E
- 7.5.4.14: Portland General Electric
- 7.5.4.15: SCL - Seattle City Light
- 7.5.4.16: Survey Results
- 7.5.5: Hot Phasing
- 7.5.5.1: CEI - The Illuminating Company
- 7.5.6: Manhole Inspection - Maintenance
- 7.5.6.1: AEP - Ohio
- 7.5.6.2: Ameren Missouri
- 7.5.6.3: CEI - The Illuminating Company
- 7.5.6.4: CenterPoint Energy
- 7.5.6.5: Con Edison - Consolidated Edison
- 7.5.6.6: Duke Energy Florida
- 7.5.6.7: Duke Energy Ohio
- 7.5.6.8: Energex
- 7.5.6.9: ESB Networks
- 7.5.6.10: Georgia Power
- 7.5.6.11: HECO - The Hawaiian Electric Company
- 7.5.6.12: National Grid
- 7.5.6.13: PG&E
- 7.5.6.14: Portland General Electric
- 7.5.6.15: SCL - Seattle City Light
- 7.5.6.16: Survey Results
- 7.5.7: Network Protector Maintenance
- 7.5.7.1: AEP - Ohio
- 7.5.7.2: Ameren Missouri
- 7.5.7.3: CEI - The Illuminating Company
- 7.5.7.4: CenterPoint Energy
- 7.5.7.5: Con Edison - Consolidated Edison
- 7.5.7.6: Duke Energy Florida
- 7.5.7.7: Duke Energy Ohio
- 7.5.7.8: Georgia Power
- 7.5.7.9: HECO - The Hawaiian Electric Company
- 7.5.7.10: National Grid
- 7.5.7.11: PG&E
- 7.5.7.12: Portland General Electric
- 7.5.7.13: SCL - Seattle City Light
- 7.5.7.14: Practices Comparison
- 7.5.7.15: References
- 7.5.7.16: Survey Results
- 7.5.8: Network Protector Operational Test
- 7.5.8.1: AEP - Ohio
- 7.5.8.2: Ameren Missouri
- 7.5.8.3: CEI - The Illuminating Company
- 7.5.8.4: CenterPoint Energy
- 7.5.8.5: Con Edison - Consolidated Edison
- 7.5.8.6: Duke Energy Florida
- 7.5.8.7: Duke Energy Ohio
- 7.5.8.8: Georgia Power
- 7.5.8.9: National Grid
- 7.5.8.10: PG&E
- 7.5.8.11: Portland General Electric
- 7.5.8.12: SCL - Seattle City Light
- 7.5.8.13: Survey Results
- 7.5.9: Network Transformer Maintenance
- 7.5.9.1: AEP - Ohio
- 7.5.9.2: Ameren Missouri
- 7.5.9.3: CEI - The Illuminating Company
- 7.5.9.4: CenterPoint Energy
- 7.5.9.5: Con Edison - Consolidated Edison
- 7.5.9.6: Duke Energy Florida
- 7.5.9.7: Duke Energy Ohio
- 7.5.9.8: Energex
- 7.5.9.9: ESB Networks
- 7.5.9.10: Georgia Power
- 7.5.9.11: HECO - The Hawaiian Electric Company
- 7.5.9.12: National Grid
- 7.5.9.13: PG&E
- 7.5.9.14: Portland General Electric
- 7.5.9.15: SCL - Seattle City Light
- 7.5.9.16: Practices Comparison
- 7.5.9.17: References
- 7.5.9.18: Survey Results
- 7.5.10: Network Transformer Replacement Criteria
- 7.5.10.1: Ameren Missouri
- 7.5.10.2: Duke Energy Florida
- 7.5.10.3: Energex
- 7.5.10.4: ESB Networks
- 7.5.10.5: Survey Results
- 7.5.11: Network Vault Inspection - Maintenance
- 7.5.11.1: AEP - Ohio
- 7.5.11.2: Ameren Missouri
- 7.5.11.3: CEI - The Illuminating Company
- 7.5.11.4: CenterPoint Energy
- 7.5.11.5: Con Edison - Consolidated Edison
- 7.5.11.6: Duke Energy Florida
- 7.5.11.7: Duke Energy Ohio
- 7.5.11.8: Georgia Power
- 7.5.11.9: HECO - The Hawaiian Electric Company
- 7.5.11.10: National Grid
- 7.5.11.11: PG&E
- 7.5.11.12: Portland General Electric
- 7.5.11.13: SCL - Seattle City Light
- 7.5.12: Non-Network Vault Inspection - Maintenance
- 7.5.12.1: HECO - The Hawaiian Electric Company
- 7.5.12.2: CEI - The Illuminating Company
- 7.5.12.3: CenterPoint Energy
- 7.5.12.4: Duke Energy Florida
- 7.5.12.5: Energex
- 7.5.12.6: ESB Networks
- 7.5.13: Oil Switch Maintenance - Replacement
- 7.5.13.1: CEI - The Illuminating Company
- 7.5.13.2: Duke Energy Florida
- 7.5.13.3: PG&E
- 7.5.13.4: Survey Results
- 7.5.14: Organization
- 7.5.14.1: AEP - Ohio
- 7.5.14.2: Ameren Missouri
- 7.5.14.3: CEI - The Illuminating Company
- 7.5.14.4: CenterPoint Energy
- 7.5.14.5: Con Edison - Consolidated Edison
- 7.5.14.6: Duke Energy Florida
- 7.5.14.7: Duke Energy Ohio
- 7.5.14.8: Energex
- 7.5.14.9: ESB Networks
- 7.5.14.10: Georgia Power
- 7.5.14.11: HECO - The Hawaiian Electric Company
- 7.5.14.12: National Grid
- 7.5.14.13: PG&E
- 7.5.14.14: Portland General Electric
- 7.5.14.15: SCL - Seattle City Light
- 7.5.14.16: Survey Results
- 7.5.15: Padmounted Transformer Inspection
- 7.5.15.1: CenterPoint Energy
- 7.5.15.2: Survey Results
- 7.5.16: Pipe Cable System Maintenance
- 7.5.16.1: CEI - The Illuminating Company
- 7.5.16.2: Duke Energy Ohio
- 7.5.16.3: HECO - The Hawaiian Electric Company
- 7.5.16.4: SCL - Seattle City Light
- 7.5.17: Preventive Maintenance and Inspection
- 7.5.17.1: AEP - Ohio
- 7.5.17.2: Ameren Missouri
- 7.5.17.3: CEI - The Illuminating Company
- 7.5.17.4: CenterPoint Energy
- 7.5.17.5: Con Edison - Consolidated Edison
- 7.5.17.6: Duke Energy Florida
- 7.5.17.7: Duke Energy Ohio
- 7.5.17.8: Energex
- 7.5.17.9: ESB Networks
- 7.5.17.10: Georgia Power
- 7.5.17.11: HECO - The Hawaiian Electric Company
- 7.5.17.12: National Grid
- 7.5.17.13: PG&E
- 7.5.17.14: Portland General Electric
- 7.5.17.15: SCL - Seattle City Light
- 7.5.17.16: Survey Results
- 7.5.18: Strategic Inspection and Maintenance System
- 7.5.18.1: Con Edison - Consolidated Edison
- 7.5.18.2: Energex
- 7.5.18.3: HECO - The Hawaiian Electric Company
- 7.5.18.4: Survey Results
- 7.5.19: Switchgear Inspection and Maintenance
- 7.5.19.1: Duke Energy Florida
- 7.5.20: Terminator Maintenance (37kV)
- 7.5.20.1: CEI - The Illuminating Company
- 7.5.21: Testing Laboratory
- 7.5.21.1: AEP - Ohio
- 7.5.21.2: Ameren Missouri
- 7.5.21.3: CEI - The Illuminating Company
- 7.5.21.4: CenterPoint Energy
- 7.5.21.5: Con Edison - Consolidated Edison
- 7.5.21.6: Duke Energy Florida
- 7.5.21.7: Duke Energy Ohio
- 7.5.21.8: Energex
- 7.5.21.9: ESB Networks
- 7.5.21.10: Georgia Power
- 7.5.21.11: PG&E
- 7.5.21.12: SCL - Seattle City Light
- 7.5.21.13: National Grid
- 7.5.22: Vault - Manhole - Cleanup
- 7.5.22.1: AEP - Ohio
- 7.5.22.2: Ameren Missouri
- 7.5.22.3: Duke Energy Florida
- 7.5.22.4: Georgia Power
- 7.5.22.5: PG&E
- 7.5.22.6: Portland General Electric
- 7.5.22.7: References
- 7.6: Operations
- 7.6.1: Determining a Feeder to be De-energized
- 7.6.1.1: AEP - Ohio
- 7.6.1.2: Ameren Missouri
- 7.6.1.3: CEI - The Illuminating Company
- 7.6.1.4: CenterPoint Energy
- 7.6.1.5: Con Edison - Consolidated Edison
- 7.6.1.6: Duke Energy Florida
- 7.6.1.7: Duke Energy Ohio
- 7.6.1.8: ESB Networks
- 7.6.1.9: Georgia Power
- 7.6.1.10: HECO - The Hawaiian Electric Company
- 7.6.1.11: National Grid
- 7.6.1.12: PG&E
- 7.6.1.13: Portland General Electric
- 7.6.1.14: Survey Results
- 7.6.2: Dispatching
- 7.6.2.1: AEP - Ohio
- 7.6.2.2: CEI - The Illuminating Company
- 7.6.2.3: CenterPoint Energy
- 7.6.2.4: Duke Energy Florida
- 7.6.2.5: Energex
- 7.6.2.6: ESB Networks
- 7.6.2.7: Georgia Power
- 7.6.2.8: HECO - The Hawaiian Electric Company
- 7.6.2.9: SCL - Seattle City Light
- 7.6.3: Fault Indicators
- 7.6.3.1: AEP - Ohio
- 7.6.3.2: Ameren Missouri
- 7.6.3.3: CEI - The Illuminating Company
- 7.6.3.4: CenterPoint Energy
- 7.6.3.5: Con Edison - Consolidated Edison
- 7.6.3.6: Duke Energy Florida
- 7.6.3.7: Duke Energy Ohio
- 7.6.3.8: Energex
- 7.6.3.9: ESB Networks
- 7.6.3.10: Georgia Power
- 7.6.3.11: HECO - The Hawaiian Electric Company
- 7.6.3.12: National Grid
- 7.6.3.13: PG&E
- 7.6.3.14: References
- 7.6.3.15: Survey Results
- 7.6.4: Fault Location
- 7.6.4.1: AEP - Ohio
- 7.6.4.2: Ameren Missouri
- 7.6.4.3: CEI - The Illuminating Company
- 7.6.4.4: CenterPoint Energy
- 7.6.4.5: Con Edison - Consolidated Edison
- 7.6.4.6: Duke Energy Florida
- 7.6.4.7: Duke Energy Ohio
- 7.6.4.8: Energex
- 7.6.4.9: ESB Networks
- 7.6.4.10: Georgia Power
- 7.6.4.11: HECO - The Hawaiian Electric Company
- 7.6.4.12: National Grid
- 7.6.4.13: PG&E
- 7.6.4.14: Portland General Electric
- 7.6.4.15: References
- 7.6.4.16: Survey Results
- 7.6.5: Flood Plan
- 7.6.5.1: Energex
- 7.6.6: Fuse Stick
- 7.6.6.1: HECO - The Hawaiian Electric Company
- 7.6.7: Incoming Materials Inspection
- 7.6.7.1: Duke Energy Florida
- 7.6.7.2: Energex
- 7.6.7.3: Georgia Power
- 7.6.8: Load Shedding
- 7.6.8.1: CEI - The Illuminating Company
- 7.6.8.2: CenterPoint Energy
- 7.6.8.3: Con Edison - Consolidated Edison
- 7.6.8.4: Duke Energy Ohio
- 7.6.8.5: HECO - The Hawaiian Electric Company
- 7.6.8.6: National Grid
- 7.6.8.7: PG&E
- 7.6.8.8: SCL - Seattle City Light
- 7.6.9: Network Protector Fuse Test
- 7.6.9.1: Duke Energy Florida
- 7.6.9.2: Duke Energy Ohio
- 7.6.9.3: Georgia Power
- 7.6.10: Operations Practices - Clearances
- 7.6.10.1: AEP - Ohio
- 7.6.10.2: Ameren Missouri
- 7.6.10.3: CEI - The Illuminating Company
- 7.6.10.4: CenterPoint Energy
- 7.6.10.5: Con Edison - Consolidated Edison
- 7.6.10.6: Duke Energy Florida
- 7.6.10.7: Duke Energy Ohio
- 7.6.10.8: Energex
- 7.6.10.9: ESB Networks
- 7.6.10.10: Georgia Power
- 7.6.10.11: HECO - The Hawaiian Electric Company
- 7.6.10.12: National Grid
- 7.6.10.13: PG&E
- 7.6.10.14: Portland General Electric
- 7.6.10.15: SCL - Seattle City Light
- 7.6.10.16: Survey Results
- 7.6.11: Organization - Operation Center
- 7.6.11.1: AEP - Ohio
- 7.6.11.2: Ameren Missouri
- 7.6.11.3: CEI - The Illuminating Company
- 7.6.11.4: CenterPoint Energy
- 7.6.11.5: Con Edison - Consolidated Edison
- 7.6.11.6: Duke Energy Florida
- 7.6.11.7: Duke Energy Ohio
- 7.6.11.8: Energex
- 7.6.11.9: ESB Networks
- 7.6.11.10: Georgia Power
- 7.6.11.11: HECO - The Hawaiian Electric Company
- 7.6.11.12: National Grid
- 7.6.11.13: PG&E
- 7.6.11.14: Portland General Electric
- 7.6.11.15: SCL - Seattle City Light
- 7.6.11.16: Survey Results
- 7.6.12: Outage Drills
- 7.6.12.1: AEP - Ohio
- 7.6.12.2: Ameren Missouri
- 7.6.12.3: CEI - The Illuminating Company
- 7.6.12.4: CenterPoint Energy
- 7.6.12.5: Con Edison - Consolidated Edison
- 7.6.12.6: Duke Energy Florida
- 7.6.12.7: Duke Energy Ohio
- 7.6.12.8: Energex
- 7.6.12.9: Georgia Power
- 7.6.12.10: HECO - The Hawaiian Electric Company
- 7.6.12.11: National Grid
- 7.6.12.12: PG&E
- 7.6.12.13: Portland General
- 7.6.12.14: SCL - Seattle City Light
- 7.6.12.15: Survey Results
- 7.6.13: Outages - Restoration
- 7.6.13.1: AEP - Ohio
- 7.6.13.2: Ameren Missouri
- 7.6.13.3: CEI - The Illuminating Company
- 7.6.13.4: CenterPoint Energy
- 7.6.13.5: Con Edison - Consolidated Edison
- 7.6.13.6: Duke Energy Florida
- 7.6.13.7: Duke Energy Ohio
- 7.6.13.8: Energex
- 7.6.13.9: ESB Networks
- 7.6.13.10: Georgia Power
- 7.6.13.11: HECO - The Hawaiian Electric Company
- 7.6.13.12: National Grid
- 7.6.13.13: PG&E
- 7.6.13.14: Portland General Electric
- 7.6.13.15: SCL - Seattle City Light
- 7.6.13.16: Survey Results
- 7.6.14: Picking Up Multiple Feeders after a Network Outage
- 7.6.14.1: AEP - Ohio
- 7.6.14.2: Ameren Missouri
- 7.6.14.3: CEI - The Illuminating Company
- 7.6.14.4: CenterPoint Energy
- 7.6.14.5: Con Edison - Consolidated Edison
- 7.6.14.6: Duke Energy Florida
- 7.6.14.7: Duke Energy Ohio
- 7.6.14.8: Georgia Power
- 7.6.14.9: HECO - The Hawaiian Electric Company
- 7.6.14.10: National Grid
- 7.6.14.11: PG&E
- 7.6.14.12: Portland General Electric
- 7.6.14.13: SCL - Seattle City Light
- 7.6.14.14: Practices Comparison
- 7.6.14.15: Survey Results
- 7.6.15: Primary Trouble Man (PTM)
- 7.6.15.1: HECO - The Hawaiian Electric Company
- 7.6.16: Remote Monitoring - SCADA
- 7.6.16.1: AEP - Ohio
- 7.6.16.2: Ameren Missouri
- 7.6.16.3: CEI - The Illuminating Company
- 7.6.16.4: CenterPoint Energy
- 7.6.16.5: Con Edison - Consolidated Edison
- 7.6.16.6: Duke Energy Florida
- 7.6.16.7: Duke Energy Ohio
- 7.6.16.8: Energex
- 7.6.16.9: ESB Networks
- 7.6.16.10: Georgia Power
- 7.6.16.11: HECO - The Hawaiian Electric Company
- 7.6.16.12: National Grid
- 7.6.16.13: PG&E
- 7.6.16.14: Portland General Electic
- 7.6.16.15: SCL - Seattle City Light
- 7.6.16.16: References
- 7.6.16.17: Survey Results
- 7.6.17: Sound Coil
- 7.6.17.1: CEI - The Illuminating Company
- 7.6.18: Temporary Overhead Jumpers
- 7.6.18.1: HECO - The Hawaiian Electric Company
- 7.6.19: Three Phase Transformer Change Outs – Hot Cap Proc
- 7.6.19.1: HECO - The Hawaiian Electric Company
- 7.7: Planning
- 7.7.1: Asset Management
- 7.7.1.1: AEP - Ohio
- 7.7.1.2: Ameren Missouri
- 7.7.1.3: CEI - The Illuminating Company
- 7.7.1.4: CenterPoint Energy
- 7.7.1.5: Con Edison - Consolidated Edison
- 7.7.1.6: Duke Energy Florida
- 7.7.1.7: Duke Energy Ohio
- 7.7.1.8: Energex
- 7.7.1.9: ESB Networks
- 7.7.1.10: Georgia Power
- 7.7.1.11: HECO - The Hawaiian Electric Company
- 7.7.1.12: National Grid
- 7.7.1.13: PG&E
- 7.7.1.14: Portland General Electric
- 7.7.1.15: San Diego Gas and Electric
- 7.7.1.16: SCL - Seattle City Light
- 7.7.2: Cable Rating
- 7.7.2.1: AEP - Ohio
- 7.7.2.2: Ameren Missouri
- 7.7.2.3: CEI - The Illuminating Company
- 7.7.2.4: CenterPoint Energy
- 7.7.2.5: Con Edison - Consolidated Edison
- 7.7.2.6: Duke Energy Florida
- 7.7.2.7: Duke Energy Ohio
- 7.7.2.8: Energex
- 7.7.2.9: ESB Networks
- 7.7.2.10: Georgia Power
- 7.7.2.11: HECO - The Hawaiian Electric Company
- 7.7.2.12: National Grid
- 7.7.2.13: PG&E
- 7.7.2.14: Portland General Electric
- 7.7.2.15: SCL - Seattle City Light
- 7.7.2.16: References
- 7.7.2.17: Survey Results
- 7.7.3: Cable Replacement Strategy
- 7.7.3.1: AEP - Ohio
- 7.7.3.2: Ameren Missouri
- 7.7.3.3: CEI - The Illuminating Company
- 7.7.3.4: Duke Energy Florida
- 7.7.3.5: Duke Energy Ohio
- 7.7.3.6: Energex
- 7.7.3.7: ESB Networks
- 7.7.3.8: Georgia Power
- 7.7.3.9: HECO - The Hawaiian Electric Company
- 7.7.3.10: National Grid
- 7.7.3.11: PG&E
- 7.7.3.12: Portland General Electric
- 7.7.3.13: Survey Results
- 7.7.4: Circuit Modeling
- 7.7.4.1: AEP - Ohio
- 7.7.4.2: Ameren Missouri
- 7.7.4.3: CEI - The Illuminating Company
- 7.7.4.4: CenterPoint Energy
- 7.7.4.5: Con Edison - Consolidated Edison
- 7.7.4.6: Duke Energy Florida
- 7.7.4.7: Duke Energy Ohio
- 7.7.4.8: Energex
- 7.7.4.9: ESB Networks
- 7.7.4.10: Georgia Power
- 7.7.4.11: HECO - The Hawaiian Electric Company
- 7.7.4.12: National Grid
- 7.7.4.13: PG&E
- 7.7.4.14: Portland General Electric
- 7.7.4.15: SCL - Seattle City Light
- 7.7.4.16: Practices Comparison
- 7.7.4.17: References
- 7.7.4.18: Survey Results
- 7.7.5: Contingency Planning
- 7.7.5.1: AEP - Ohio
- 7.7.5.2: Ameren Missouri
- 7.7.5.3: CEI - The Illuminating Company
- 7.7.5.4: CenterPoint Energy
- 7.7.5.5: Con Edison - Consolidated Edison
- 7.7.5.6: Duke Energy Florida
- 7.7.5.7: Duke Energy Ohio
- 7.7.5.8: Energex
- 7.7.5.9: ESB Networks
- 7.7.5.10: Georgia Power
- 7.7.5.11: HECO - The Hawaiian Electric Company
- 7.7.5.12: National Grid
- 7.7.5.13: PG&E
- 7.7.5.14: Portland General Electric
- 7.7.5.15: SCL - Seattle City Light
- 7.7.5.16: Survey Results
- 7.7.6: Distributed Generation
- 7.7.6.1: AEP - Ohio
- 7.7.6.2: Ameren Missouri
- 7.7.6.3: CEI - The Illuminating Company
- 7.7.6.4: CenterPoint Energy
- 7.7.6.5: Duke Energy Florida
- 7.7.6.6: Duke Energy Ohio
- 7.7.6.7: Energex
- 7.7.6.8: ESB Networks
- 7.7.6.9: Georgia Power
- 7.7.6.10: HECO - The Hawaiian Electric Company
- 7.7.6.11: National Grid
- 7.7.6.12: PG&E
- 7.7.6.13: Portland General Electric
- 7.7.6.14: References
- 7.7.6.15: Survey Results
- 7.7.7: Distribution Automation Control in Contingencies
- 7.7.7.1: CenterPoint Energy
- 7.7.8: Intermittent Supply Forecasting
- 7.7.8.1: Energex
- 7.7.9: Load Forecasting
- 7.7.9.1: AEP - Ohio
- 7.7.9.2: Ameren Missouri
- 7.7.9.3: CEI - The Illuminating Company
- 7.7.9.4: CenterPoint Energy
- 7.7.9.5: Con Edison - Consolidated Edison
- 7.7.9.6: Duke Energy Florida
- 7.7.9.7: Duke Energy Ohio
- 7.7.9.8: Energex
- 7.7.9.9: ESB Networks
- 7.7.9.10: Georgia Power
- 7.7.9.11: HECO - The Hawaiian Electric Company
- 7.7.9.12: National Grid
- 7.7.9.13: PG&E
- 7.7.9.14: Portland General Electric
- 7.7.9.15: Survey Results
- 7.7.10: Load Relief
- 7.7.10.1: Ameren Missouri
- 7.7.10.2: CEI - The Illuminating Company
- 7.7.10.3: CenterPoint Energy
- 7.7.10.4: Con Edison - Consolidated Edison
- 7.7.10.5: Duke Energy Florida
- 7.7.10.6: Duke Energy Ohio
- 7.7.10.7: Energex
- 7.7.10.8: ESB Networks
- 7.7.10.9: Georgia Power
- 7.7.10.10: HECO - The Hawaiian Electric Company
- 7.7.10.11: National Grid
- 7.7.10.12: PG&E
- 7.7.10.13: SCL - Seattle City Light
- 7.7.10.14: Survey Results
- 7.7.11: Network Planning
- 7.7.11.1: AEP - Ohio
- 7.7.11.2: Ameren Missouri
- 7.7.11.3: CEI - The Illuminating Company
- 7.7.11.4: CenterPoint Energy
- 7.7.11.5: Con Edison - Consolidated Edison
- 7.7.11.6: Duke Energy Florida
- 7.7.11.7: Duke Energy Ohio
- 7.7.11.8: Energex
- 7.7.11.9: ESB Networks
- 7.7.11.10: Georgia Power
- 7.7.11.11: HECO - The Hawaiian Electric Company
- 7.7.11.12: National Grid
- 7.7.11.13: PG&E
- 7.7.11.14: Portland General Electric
- 7.7.11.15: SCL - Seattle City Light
- 7.7.11.16: Survey Results
- 7.7.12: Organization
- 7.7.12.1: AEP - Ohio
- 7.7.12.2: Ameren Missouri
- 7.7.12.3: CEI - The Illuminating Company
- 7.7.12.4: CenterPoint Energy
- 7.7.12.5: Con Edison - Consolidated Edison
- 7.7.12.6: Duke Energy Florida
- 7.7.12.7: Duke Energy Ohio
- 7.7.12.8: Energex
- 7.7.12.9: ESB Networks
- 7.7.12.10: Georgia Power
- 7.7.12.11: HECO - The Hawaiian Electric Company
- 7.7.12.12: National Grid
- 7.7.12.13: PG&E
- 7.7.12.14: Portland General Electric
- 7.7.12.15: SCL - Seattle City Light
- 7.7.12.16: Survey Results
- 7.7.13: Program Management
- 7.7.13.1: Duke Energy Florida
- 7.7.13.2: Energex
- 7.7.13.3: ESB Networks
- 7.7.13.4: Georgia Power
- 7.7.14: System Protection
- 7.7.14.1: AEP - Ohio
- 7.7.14.2: Ameren Missouri
- 7.7.14.3: CEI - The Illuminating Company
- 7.7.14.4: CenterPoint Energy
- 7.7.14.5: Duke Energy Florida
- 7.7.14.6: Duke Energy Ohio
- 7.7.14.7: Energex
- 7.7.14.8: ESB Networks
- 7.7.14.9: Georgia Power
- 7.7.14.10: National Grid
- 7.7.14.11: PG&E
- 7.7.14.12: Portland General Electric
- 7.7.14.13: References
- 7.7.14.14: Survey Results
- 7.8: Safety
- 7.8.1: 2020 Vision Program
- 7.8.1.1: Portland General Electric
- 7.8.2: Accident - Incident Investigation
- 7.8.2.1: Ameren Missouri
- 7.8.2.2: CEI - The Illuminating Company
- 7.8.2.3: CenterPoint Energy
- 7.8.2.4: Con Edison - Consolidated Edison
- 7.8.2.5: Duke Energy Florida
- 7.8.2.6: Duke Energy Ohio
- 7.8.2.7: Energex
- 7.8.2.8: ESB Networks
- 7.8.2.9: Georgia Power
- 7.8.2.10: HECO - The Hawaiian Electric Company
- 7.8.2.11: National Grid
- 7.8.2.12: PG&E
- 7.8.2.13: SCL - Seattle City Light
- 7.8.3: Arc Suppression Blankets
- 7.8.3.1: CenterPoint Energy
- 7.8.3.2: Duke Energy Florida
- 7.8.3.3: HECO - The Hawaiian Electric Company
- 7.8.3.4: Survey Results
- 7.8.4: Career Development Program
- 7.8.4.1: Con Edison - Consolidated Edison
- 7.8.4.2: Survey Results
- 7.8.5: Contractor Safety Orientation and Certification
- 7.8.5.1: Duke Energy Florida
- 7.8.5.2: HECO - The Hawaiian Electric Company
- 7.8.5.3: PG&E
- 7.8.6: Field Safety Person
- 7.8.6.1: Ameren Missouri
- 7.8.6.2: Duke Energy Ohio
- 7.8.6.3: Georgia Power
- 7.8.6.4: HECO - The Hawaiian Electric Company
- 7.8.6.5: National Grid
- 7.8.6.6: PG&E
- 7.8.6.7: Survey Results
- 7.8.7: Lead Cable Safety
- 7.8.7.1: AEP - Ohio
- 7.8.7.2: Ameren Missouri
- 7.8.7.3: Energex
- 7.8.7.4: Georgia Power
- 7.8.7.5: National Grid
- 7.8.7.6: PG&E
- 7.8.8: Manhole - Vault Entry
- 7.8.8.1: AEP - Ohio
- 7.8.8.2: Ameren Missouri
- 7.8.8.3: CEI - The Illuminating Company
- 7.8.8.4: CenterPoint Energy
- 7.8.8.5: Con Edison - Consolidated Edison
- 7.8.8.6: Duke Energy Florida
- 7.8.8.7: Duke Energy Ohio
- 7.8.8.8: Energex
- 7.8.8.9: Georgia Power
- 7.8.8.10: HECO - The Hawaiian Electric Company
- 7.8.8.11: National Grid
- 7.8.8.12: PG&E
- 7.8.8.13: SCL - Seattle City Light
- 7.8.8.14: Practices Comparison
- 7.8.8.15: References
- 7.8.8.16: Survey Results
- 7.8.9: Morning Stretch
- 7.8.9.1: AEP - Ohio
- 7.8.9.2: Ameren Missouri
- 7.8.9.3: Duke Energy Florida
- 7.8.9.4: Georgia Power
- 7.8.9.5: HECO - The Hawaiian Electric Company
- 7.8.9.6: National Grid
- 7.8.9.7: PG&E
- 7.8.9.8: Survey Results
- 7.8.10: Near Miss Program
- 7.8.10.1: AEP - Ohio
- 7.8.10.2: Ameren Missouri
- 7.8.10.3: CEI - The Illuminating Company
- 7.8.10.4: CenterPoint Energy
- 7.8.10.5: Con Edison - Consolidated Edison
- 7.8.10.6: Duke Energy Florida
- 7.8.10.7: Energex
- 7.8.10.8: ESB Networks
- 7.8.10.9: Georgia Power
- 7.8.10.10: HECO - The Hawaiian Electric Company
- 7.8.10.11: National Grid
- 7.8.10.12: PG&E
- 7.8.10.13: Portland General Electric
- 7.8.11: Operating a 5KV Underground Oil Switch
- 7.8.11.1: CEI - The Illuminating Company
- 7.8.11.2: PG&E
- 7.8.12: Operating Errors Investigations
- 7.8.12.1: CEI - The Illuminating Company
- 7.8.12.2: Con Edison - Consolidated Edison
- 7.8.12.3: HECO - The Hawaiian Electric Company
- 7.8.12.4: SCL - Seattle City Light
- 7.8.13: Organization
- 7.8.13.1: AEP - Ohio
- 7.8.13.2: Ameren Missouri
- 7.8.13.3: CEI - The Illuminating Company
- 7.8.13.4: CenterPoint Energy
- 7.8.13.5: Con Edison - Consolidated Edison
- 7.8.13.6: Duke Energy Florida
- 7.8.13.7: Duke Energy Ohio
- 7.8.13.8: Energex
- 7.8.13.9: ESB Networks
- 7.8.13.10: Georgia Power
- 7.8.13.11: HECO - The Hawaiian Electric Company
- 7.8.13.12: National Grid
- 7.8.13.13: PG&E
- 7.8.13.14: Portland General Electric
- 7.8.13.15: SCL - Seattle City Light
- 7.8.13.16: Survey Results
- 7.8.14: Personal Protective Equipment
- 7.8.14.1: AEP - Ohio
- 7.8.14.2: Ameren Missouri
- 7.8.14.3: CEI - The Illuminating Company
- 7.8.14.4: CenterPoint Energy
- 7.8.14.5: Con Edison - Consolidated Edison
- 7.8.14.6: Duke Energy Florida
- 7.8.14.7: Duke Energy Ohio
- 7.8.14.8: Energex
- 7.8.14.9: ESB Networks
- 7.8.14.10: Georgia Power
- 7.8.14.11: HECO - The Hawaiian Electric Company
- 7.8.14.12: National Grid
- 7.8.14.13: PG&E
- 7.8.14.14: SCL - Seattle City Light
- 7.8.14.15: References
- 7.8.14.16: Survey Results
- 7.8.15: Safety Communication
- 7.8.15.1: Ameren Missouri
- 7.8.15.2: CEI - The Illuminating Company
- 7.8.15.3: Con Edison - Consolidated Edison
- 7.8.15.4: Duke Energy Florida
- 7.8.15.5: Duke Energy Ohio
- 7.8.15.6: Energex
- 7.8.15.7: Georgia Power
- 7.8.15.8: National Grid
- 7.8.15.9: PG&E
- 7.8.15.10: Portland General Electric
- 7.8.15.11: Survey Results
- 7.8.16: Safety Meetings
- 7.8.16.1: AEP - Ohio
- 7.8.16.2: Ameren Missouri
- 7.8.16.3: CEI - The Illuminating Company
- 7.8.16.4: CenterPoint Energy
- 7.8.16.5: Con Edison - Consolidated Edison
- 7.8.16.6: Duke Energy Florida
- 7.8.16.7: Duke Energy Ohio
- 7.8.16.8: Energex
- 7.8.16.9: ESB Networks
- 7.8.16.10: Georgia Power
- 7.8.16.11: HECO - The Hawaiian Electric Company
- 7.8.16.12: National Grid
- 7.8.16.13: PG&E
- 7.8.16.14: Portland General Electric
- 7.8.16.15: SCL - Seattle City Light
- 7.8.16.16: Survey Results
- 7.8.17: Safety Observations
- 7.8.17.1: AEP - Ohio
- 7.8.17.2: Ameren Missouri
- 7.8.17.3: CenterPoint Energy
- 7.8.17.4: Con Edison - Consolidated Edison
- 7.8.17.5: Duke Energy Florida
- 7.8.17.6: Duke Energy Ohio
- 7.8.17.7: Energex
- 7.8.17.8: ESB Networks
- 7.8.17.9: Georgia Power
- 7.8.17.10: National Grid
- 7.8.17.11: PG&E
- 7.8.17.12: Portland General Electric
- 7.8.17.13: Survey Results
- 7.8.18: Special Safety Programs
- 7.8.18.1: Ameren Missouri
- 7.8.18.2: CEI The Illuminating Company
- 7.8.18.3: CenterPoint Energy
- 7.8.18.4: Duke Energy Florida
- 7.8.18.5: Duke Energy Ohio
- 7.8.18.6: Energex
- 7.8.18.7: Georgia Power
- 7.8.18.8: National Grid
- 7.8.18.9: Portland General Electric
- 7.8.18.10: SCL-Seattle City Light
- 7.8.19: Training
- 7.8.19.1: AEP - Ohio
- 7.8.19.2: Ameren Missouri
- 7.8.19.3: CEI - The Illuminating Company
- 7.8.19.4: CenterPoint Energy
- 7.8.19.5: Duke Energy Florida
- 7.8.19.6: Duke Energy Ohio
- 7.8.19.7: Energex
- 7.8.19.8: ESB Networks
- 7.8.19.9: Georgia Power
- 7.8.19.10: National Grid
- 7.8.19.11: PG&E
- 7.8.19.12: Portland General Electric
- 7.9: Survey Results
- 7.9.1: 2009 Survey Results
- 7.9.1.1: Summary - Overview
- 7.9.1.2: Summary - Physical/General
- 7.9.1.3: Planning
- 7.9.1.4: Design
- 7.9.1.5: Construction
- 7.9.1.6: Maintenance
- 7.9.1.7: Operations
- 7.9.1.8: Safety
- 7.9.1.9: Distributed Generation
- 7.9.1.10: Practices of Note
- 7.9.2: 2012 Survey Results
- 7.9.2.1: Summary - Overview
- 7.9.2.2: Summary - Physical/General
- 7.9.2.3: Planning
- 7.9.2.4: Design
- 7.9.2.5: Construction
- 7.9.2.6: Maintenance
- 7.9.2.7: Operations
- 7.9.2.8: Safety
- 7.9.2.9: Distributed Generation
- 7.9.2.10: Practices of Note
- 7.9.3: 2015 Survey Results
- 7.9.3.1: Summary - Overview
- 7.9.3.2: Summary - Physical/General
- 7.9.3.3: Planning
- 7.9.3.4: Design
- 7.9.3.5: Maintenance
- 7.9.3.6: Operations
- 7.9.3.7: Safety
- 7.9.3.8: Practices of Note
- 7.9.4: 2018 Survey Results
- 7.9.4.1: Asset Management
- 7.9.4.2: Manhole Event Preparedness and Response
- 7.9.4.3: Urban Network Safety Practices Survey
- 7.9.5: 2019 Survey Results
- 7.9.5.1: UG Inspection Practices Survey
- 7.9.6: 2020 Survey Results
- 7.9.6.1: PTO Monitoring Survey
- 7.9.6.2: Underground Residential and Underground Commercial Distribution (URD /UCD) Practices Survey
- 7.9.7: 2021 Survey Results
- 7.9.7.1: Infrared Thermography Survey
- 7.9.8: 2022 Survey Results
1 - Bronze Book
Underground distribution systems reference book
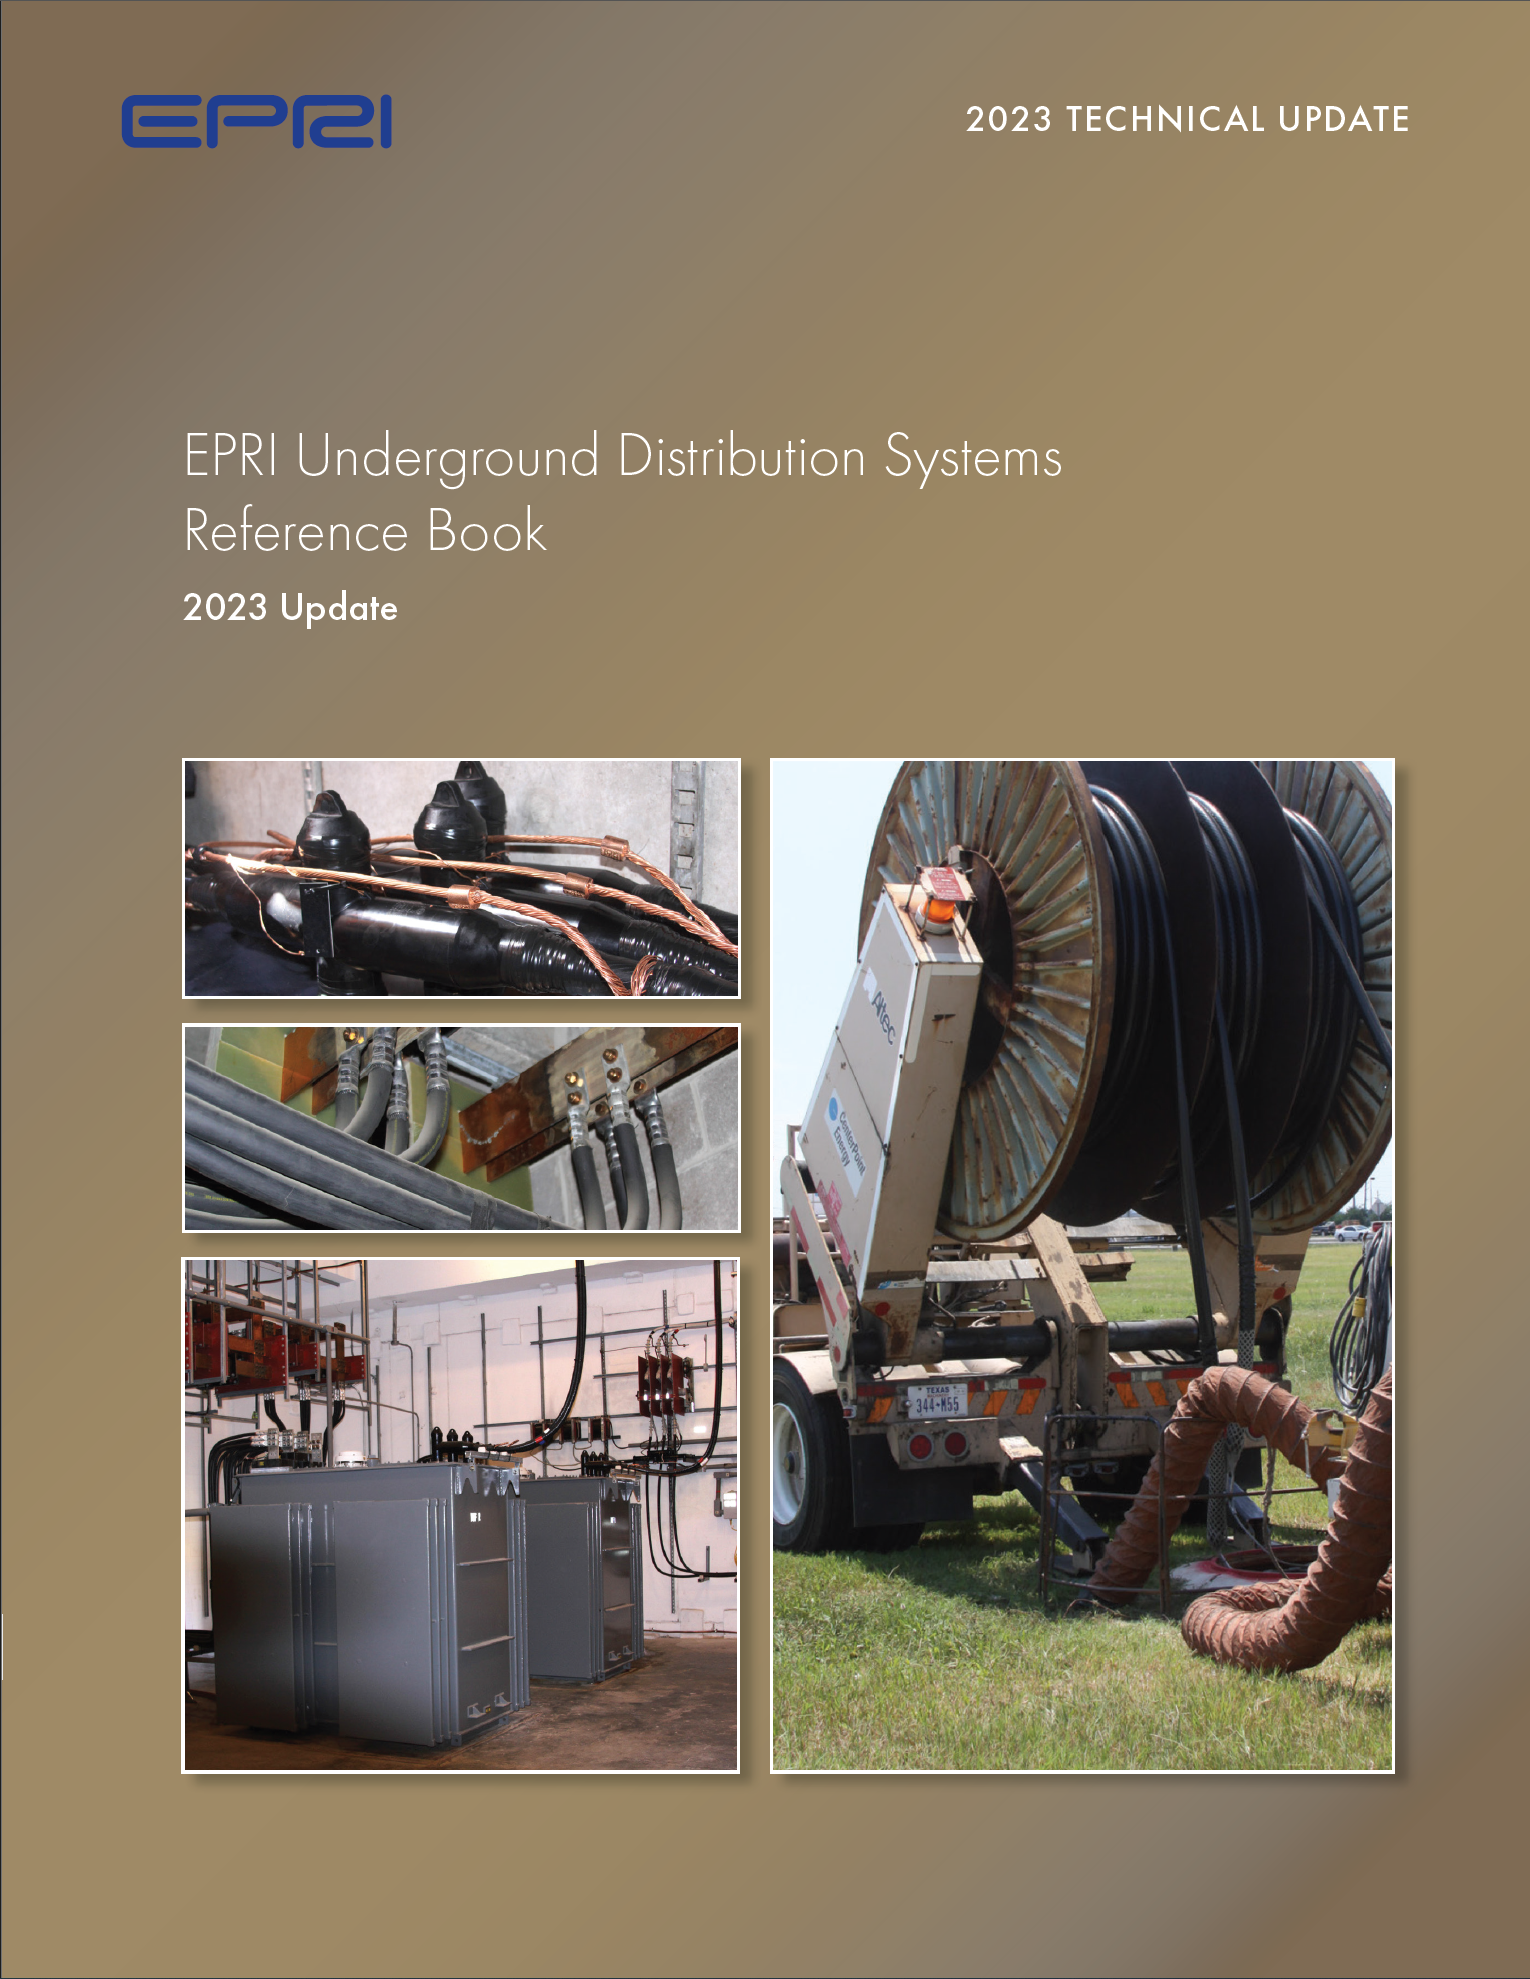
The Electric Power Research Institute (EPRI) has developed the 2022 update of the EPRI Underground Distribution Systems Reference Book (Bronze Book). This reference, authored by leading industry expert authors, joins the EPRI series of Power Delivery technical references, commonly known by the color of their covers.
The Bronze Book has been written to be a meaningful reference to utility engineers and personnel involved in the planning, design, manufacture, installation, operation, and maintenance of underground distribution systems. Its development was driven by the impending loss of institutional knowledge through attrition and retirement of experienced resources, and the consequent urgent need to document industry knowledge and practices.
The Bronze Book contains chapter sections that provide information on the state of the industry with respect to underground distribution systems, network and nonnetwork system planning and design, cable ampacity, system protection, civil and electrical construction, underground maintenance and operations including fault location and cable diagnostics, reliability, corrosion, and equipment such as cables, cable accessories, transformers, and capacitors.
The 2023 edition of the EPRI Underground Distribution Systems Reference Book includes a new chapter on “Underground Cable System Quality.”
Download EPRI Underground Distribution Systems Reference Book: 2023 Update here.
2 - Utility Information Exchange
Notes from forums, which utilities discuss practices and share knowledge.
The Utility Information Exchange (UIE) is designed to facilitate the sharing of experiences amongst EPRI member companies within the specific topic that is the subject of the meeting. This document contains the notes gathered during the call and are meant only for members of the P180.002 Distribution Underground project. The information shared during this webcast is used in part to help guide / inform the research work undertaken within the project.
2.1 - P180.002 Underground 2021 ARP Utility Information Exchange - June 17, 2021
Attendees
The UIE was attended by EPRI member companies and EPRI staff. The list of member company attendees appears in Table 1.
Table 1: List of Attendees
| Company | Name |
|---|---|
| AEP | Cory Jeffers |
| Ameren | John Rowland |
| Central Hudson | Taryn Black |
| Con Edison | Tom Campbell, Yingli Wen |
| Consumers Energy | Mark Lyons |
| DTE | Naera Haghnazarian, Adam Jacobs, Abdalla Sadoon |
| Exelon - ComEd | Jimi Conway, Urbano Gallardo |
| Exelon - PHI | Andrew Deen |
| First Energy | Dean Phillips |
| HECO | Randall Tom, Charlyne Nakamura |
| National Grid | Hernan Yepez |
| PECO | Dustin Nace |
| Portland General Electric | Jeff Kaiser |
| Salt River Project | Logan Tsinigine, Rick Hudson, Jason Gunawardena |
| Southern Company - APC | Stephen Daniel |
| Southern Company - GPC | Mike Pearman |
| Southern Company - MPC | Robery Boyd |
| Taiwan Power | Will Chang |
| WEC Energy | Mike Smalley |
Utility Information Exchange Summary
The following sections provide a summary of the responses gathered during the individual question roundtables.
Question 1: Utilization of Remote Monitoring
The first question posed to the group contained multiple parts:
- Are you utilizing any remote monitoring outside the substation?
- Where?
- What are you are monitoring?
- On what equipment is it being applied?
- What technology are you using?
- How are you communicating?
The following responses were shared:
- Consumers Energy
- Gave a presentation at the 2017 NADUUWG presentation on “Circuit West” where a pilot for online monitoring was underway
- Pilot uses localized fiber optic network
- Able to monitor load, switch positions, relays, and is control-enabled
- The circuit is a hybrid circuit – duct and manhole non-network that connects to URD system
- SCADA enabled equipment is connected to this system
- HECO
- Most monitoring implemented at HECO is in the substation. Efforts now beginning at augmenting with monitoring technology outside the substation
- Data is brought back through SCADA
- Initially looking at faulted circuit indicators (FCI’s) to help with fault locating activities
- Also monitoring recloser status / operation
- Communication is primarily through cellular back to control center
- Network improvements are underway including installation of fiber optic to all vaults. Now in second or third year of 5 year program.
- SRP
- Using faulted circuit indicators and reclosers (IntelliRupter®)
- Cooper fault indicators are connected through Verizon cellular
- IntelliRupters® (several tens of them installed) are monitored through field area network and wireless where needed
- Replacing capacitor controllers with Cooper product that ties into SRP area network
- Power quality monitoring at large industrial customers is also in place.
- PQ monitors in place to capture large voltage swings at the customer switchgear or substation depending on the situation
- Monitoring primarily current and sometimes voltage at cap banks
- Also have one switch outfitted with current and fault indication monitoring capability
- Using faulted circuit indicators and reclosers (IntelliRupter®)
- AEP
- Currently employing extensive real time monitoring capability, including:
- Circuit loading
- Temperature
- Oil pressure
- Status on vacuum interrupters, network protectors, etc.
- Network and secondary voltage
- Using Eaton VaultGard communications platform
- Fiber backbone installed at all vault locations to act as communications channel.
- Data are collected at local cluster locations, compiled, then fed back to a centralized location
- Currently preparing/implementing pilot program to look at real-time distributed temperature sensing (DTS) for real time cable ampacity ratings.
- Looking to use single fiber run within each duct bank to sense temperatures in adjacent ducts
- Aiming to eliminate need to run CYMCAP calculations
- Currently employing extensive real time monitoring capability, including:
- FirstEnergy
- Not currently utilizing monitoring outside of the substation
- Twelve networks (small)
- Monitoring tied in through SCADA
- Currently using some fault indicators to monitor portions of URD system
- Not currently utilizing monitoring outside of the substation
- Ameren
- Currently monitoring radial and network UG systems.
- Using S&C IntelliTeam® equipment
- Padmount switchgear
- IntelliRupters®
- Switchgear inside building
- Monitoring includes several features:
- Switch status
- Fault status
- Voltage
- Current, etc.
- Network protectors include monitoring as well. This includes:
- Status
- Water level
- Handle position
- Looking to add pressure, temperature, and oil level (PTO) sensors
- ETI relaying on 277 V network protectors
- Eaton CM52 on 480 V network protectors
- Communications system is radial cell system through a private vendor
- Considered adding fiber but currently building private LTE network for Ameren. May move to that for all network protectors with a targeted 2022 start up
- National Grid
- Utilizing monitoring on their network system
- Currently undertaking a monitoring pilot project in Buffalo. Project will include transformer monitoring including:
- Online transformer DGA (likely Qualitrol multi-gas module)
- Oil temperature
- Volt-var optimization (VVO) to come
- Exelon - PHI
- Monitoring is use on network system and is focused on network transformers
- Communications are via RMS system – radio backbone through Itron
- Monitored features include:
- Water level
- Temperature
- Pressure (primary and NP)
- Status
- Also conducting pilot program with Richards ETI & Eaton solutions
- Exploring use of other equipment for automatic restoration and fault location:
- Smart fault circuit indicators from Sentient
- Underground interrupters which are similar to a recloser but without reclosing capability.
- Pilot underway on condition assessment monitoring technology:
- Active partial discharge monitoring system for cables.
- Planning to use on several feeders which include river crossings or are historically poor performers.
- Believe communications will be Cellular.
- Manufacturer will perform analysis on recorded discharge activity.
- Retrofitting FCI’s on URD system padmount equipment. Planning to expand to network in the future.
- Central Hudson
- Currently working on deployment of monitoring on network system (<50% setup).
- Uses ETI system.
- Monitored features include:
- Current.
- Voltage.
- Network protector status.
- PTO sensors.
- Water ingress.
- Communications via 3rd party cellular.
- Now constructing private wireless network.
- Con Edison
- Monitoring all network transformers using PTO.
- Communication is via RMS powerline carrier system.
- Pilot program looking at integrated T-body sensors which can measure current, voltage, and phase angle.
- DTE
- Conducting pilot study for CNIGuard manhole monitoring unit (1 year complete, starting 2nd year).
- Unit includes multiple sensor types:
- IR camera.
- Combustible gas detection.
- Monitoring current and fault status on network banks.
- Cellular signal for CNIGuard.
- Southern Company - Alabama Power
- Uses feeder communications system.
- SCADA with comms back to operators.
- Monitoring and control of these devices.
- Communications channel is SouthernLink – private cellular LTE system.
- Automatic throwover switches (ATO’s) are on SCADA system.
- All network protectors monitored and communicate via fiber optic network.
- Pilot to monitor network transformers with DGA and temperature monitoring.
- Uses feeder communications system.
- Southern Company - Mississippi Power
- Same as APC excluding network system monitoring.
- Stand by generation agreements with status and control on the switchgear.
- Exelon - PECO
- Monitoring is very limited in underground outside of the substation.
- Current monitoring over fiber optic network.
- Secondary system uses PSI network monitoring for voltage and current. System operation is currently limited.
- Communications through powerline carrier between stations and cellular modem back to central location.
- There have been many issues with this communications path.
- Piloting 3M sensor for measuring voltage, current, temperature, water level.
- Sensus radio for communications.
- One switch being monitored over Sensus radio.
Question 1 Key Takeaways
- Limited deployment of monitoring systems outside of substation with the focus being network systems.
- Field systems to date are focused on measuring voltage, current, and temperature. Additional status indicators are also routinely recorded.
- Several pilot projects underway.
Question 2: Data Interpretation and Usage
The second question for discussion involved the following topic:
- If you are using remote monitoring, please describe how you are using the information.
- Have you established alarms / thresholds?
- What sort of analysis and reporting have you deployed?
The following responses were shared during the roundtable discussion:
- Consumers Energy
- Work mostly on substation equipment not so much out on UG system.
- HECO
- Most work on FCI’s – comes back strictly as an alarm at this time, no data to interpret.
- Not ready to establish threshold levels at this time.
- SRP
* Data from Cap bank controllers has been most useful so far:
- Monitoring the neutral and operation of the cap bank switch.
- Identify if there is abnormal operation of the cap bank switch (e.g. phase gets stuck).
- No response criterion has proven useful as it indicates that troubleshooting is required and a team can be dispatched.
- AEP
- Piloting a few different data interpretation / analysis approaches.
- Cyme software using real time data including AMI data.
- Running state estimator using the data that are coming in.
- Visualization using dashboard view of data (ABB product).
- Incorporating maintenance (DGA) into dashboard.
- Combining different data into visualization.
- Converting all data into “data lake” and housing internally. Enables them to push and pull data across platforms and not have to work with many different datasets
- Working with Eaton to do secondary fault detection using data from network protectors.
- Piloting a few different data interpretation / analysis approaches.
- FirstEnergy
- Nothing to report on this topic.
- Ameren
- Using network data for loading alarms (66% of transformer kVA rating).
- Network protector monitoring allows Ameren to operate in abnormal conditions due to switching during restoration efforts.
- Able to detect equipment failures.
- Conducting a trial for DTS within cable ducts – monitor actual cable temp and identify overloaded circuits.
- Exelon - PHI
- Using data to try and understand how much solar and DER is on the system.
- Also using data to detect backfeed on the system (most likely from DER site).
- Central Hudson
- No established alarms / thresholds.
- Focused on getting relays communicating properly back to central location.
- Working to figure out how to leverage data but focused for the time being on getting everything hooked up and working.
- DTE
- Manhole monitoring system from CNIGuard has internal alarms setup.
- Key personnel receive text messages to dispatch crew when alarm goes off
- Two threshold levels (yellow and red).
- IR camera alarms as well. Alarm triggers on fluctuating temperature.
- Manhole monitoring system from CNIGuard has internal alarms setup.
- Southern Company - Alabama Power
- System in place that collects data from each switching device (SCADA Tools):
- Voltage.
- Current.
- Switch position.
- Open/close.
- Alarms for high voltage, low voltage, and current.
- Network transformer pilot project underway.
- Not collecting the data but planning to start later on.
- System in place that collects data from each switching device (SCADA Tools):
- Mississippi Power
- Same as APC.
- Alarm thresholds set on status fields only (e.g. battery alarm, etc.).
- Exelon - PECO
- PSI secondary monitor (not fully functional right now).
- When working, reported current and provided alarm on set threshold.
- PSI secondary monitor (not fully functional right now).
Question 2 Key Takeaways
- Most participants indicate alarming to be the most common data captured.
- Efforts starting to look at combining data and developing ways to extract information from the data through visualization and other means.
Question 3: Challenges to Implementing Monitoring
The third question for discussion was:
- What was the most difficult challenge to implementing online monitoring?
The following responses were shared during the roundtable discussion:
- Consumers
- Convincing IT to allow engineering to install and connect the monitoring equipment to the system.
- The need to bring on many different consultants with an ambiguous scope.
- HECO
- Retrofitting old equipment with new sensors and other devices. Lots of trial and error trying to adapt the sensors and relays to the old equipment.
- SRP
- Communication problems getting the data back for use.
- Line of sight wireless communication can get blocked.
- Need to monitor the wireless connections.
- May need additional power and maintenance on transmitter system.
- Communication errors cause alarms which need to be addressed and this becomes a problem if there are too many alarms – created group just to handle comms issues.
- Communication problems getting the data back for use.
- AEP
- Size of rollout was a challenge to manage given the numerous different Op-Co’s involved.
- Material issues along the ways
- Submersible subpanels were a problem as they would leak and cause issues with the electronics inside
- Training the crews takes time to get everyone up to speed
- Contractors help at the start but then the management of the system becomes inhouse – “Day 2” after the contractors leave. Need to be ready for this.
- Ameren
- Difficult to keep communications working
- Cell connections had issues at antennas in vaults / manholes.
- Powering up the equipment was an issue.
- CM52’s – comms exit when placed in vault is hard to get to and water can get into the cabinet.
- Had to redesign the bulkheads and put the equipment higher up on the vault wall
- Difficult to keep communications working
- Exelon - PHI
- Issues with maintaining communications.
- Buildings are a problem that they block comms.
- Trucks park over vaults and this disrupts.
- Worked to install repeaters to improve wireless signal.
- Unable to install fiber as it is not considered to be a distribution asset at PHI.
- Training of crews.
- Issues with maintaining communications.
- Central Hudson
- Finding resources to implement / install the equipment has been difficult.
- It is challenging to find an appropriate place to store all the data.
- Current system only stores 13 months of data and then these data need to be moved somewhere else.
- Con Edison
- Sealing of all the boxes for comms and wiring against water ingress. IP68 is not effective enough for vault applications.
- Different generations of monitoring equipment. Procurement of proper connectors and wires has been difficult especially during COVID.
- DTE
- Communications problems.
- Double decker manholes have been a problem.
- Trying to shift to DTE mesh network.
- Communications problems.
- Southern Company - Alabama Power
- Installing new sites for monitoring.
- Initially there were many different groups involved (structures, radios, programmers, etc.) and the process took 6 months to get a location installed and operational.
- Streamlined to be 3-4 weeks now.
- Installing new sites for monitoring.
- Southern Company - Mississippi Power
- Same as APC.
- Exelon - PECO
- Communications are problematic.
- Water intrusion issues which damages electronics.
- Corrosion occurs at the connections.
- Access to resources for getting equipment installed and operational.
Question 3 Key Takeaways
- Communications is the biggest challenge facing utilities in deploying monitoring systems outside the substation.
- Wireless is impacted by structures and other obstacles.
- Utilities are working towards installing fiber systems to overcome communications challenges.
- Suitability of accessories and mounting equipment to manhole / vault environment (i.e. submergence ratings seem optimistic).
- Access to resources and coordinating installation is more complicated than non-monitored situations and so it is difficult to coordinate all the personnel that need to be involved.
- Streamlining can be done but is not simple to implement.
2.2 - P180.002 & P180.004 Issues with Cable Locating and Abandoning Underground Cable – Dec 10, 2021
EPRI Hosts:
- Tom Short, tshort@epri.com, Distribution Safety
- John Tripolitis, jtripolitis@epri.com, Underground Distribution Assets
- Josh Perkel, jperkel@epri.com, Underground Distribution Assets
These are notes from a utility exchange webcast on November 10, 2021.
Introduction:
Utility 1 presentation:
- Abandoned cables have been clouding URD cable locating effort
- Focusing on residential and commercial
- Abandoned cables often aren’t mapped
- Abandoned cables sometimes tone better than the in-use cables
- Standards for abandoning underground cables
- Most cable replacement methods don’t remove the old, buried cables
- Need to map abandoned cables
- Do we electrically “float” the ends?
- Do we ground one or both ends?
- Do standards vary across jacked concentric neutral cables or jacketed cable or secondary cables?
- What are the best practices and techniques for locating the abandoned cables?
Tom Short:
- Shared an application that models the current flow across an energized cable and a parallel abandoned cable.
- The app can be found at: https://distribution.epri.com/safety/2021/ug/
- The model suggests:
- The cable with the bigger neutral is more likely to show up when searching with an active search method.
- Both cables will appear the same using a passive method
- This suggests that it might be best to disconnect the inactive cable at both ends
- The program considers two jacketed concentric neutral cables. The results would vary if one cable is unjacketed.
Have you had issues related to mislocating a cable due to an abandoned cable?
Utility 1: Yes, we’ve had issues with abandoned cable underground.
Utility 2: We do not have issues to the extent that an older city might. We sometimes run into concentric neutral cable, and we are usually able to remove it.
Utility 3: We used to trench and pull out the band cable. This might be more of a problem going forward since we are doing more directional drilling. We have had this issue on a few occasions. We keep our maps up to date.
Utility 4: Yes.
Utility 5: We have had minor issues mislocating, I don’t know if it’s due to abandoned cable. We cut cable below ground and don’t ground it but leave it isolated. For putting something new, it’s not an issue.
Utility 6: Has not heard of any specific issues with this.
Utility 7: Not aware of issue mislocating cables due to abandoned cables.
Does bare concentric neutral vs. jacketed make a difference?
Utility 1: Don’t have many details about cable types, but in one case it was concentric neutral cable where energized was poorly located, but the deenergized cable was located very well.
Utility 2: We have difficulty getting a tone on bare, unjacketed concentric cable because it tends to erode.
Utility 3: Have not heard much one way of the other. Losing the concentric neutrals is an issue.
Utility 4: Older cables with exposed concentric have contributed to the problems in locating the cables.
Utility 5: Everything new is jacketed.
Utility 6: We do have some corroded unjacketed cable due to flooding, salt, and weather conditions. I can imagine they would be hard to locate.
Utility 7: Our older cables are unjacketed. There might be issues identifying those. We now mainly install jacketed cables.
Are there other sources of mislocating? (e.g. water pipe)
Utility 1: Water and gas are examples as well as phone cable. They run both parallel and at angles to the abandoned wires. (“All of the above”)
Utility 2: Yes, we have experienced mislocating due to gas, telephone, fiber, and leftover lead jacket
Utility 4: Yes, water and communication lines.
Utility 5: Trouble with deep facilities at highway crossings. We sometimes put marker balls near the surface as a solution to this problem.
Have you had other issues related to cable locating?
Utility 1: Infrastructure improvements that are still grounded are a problem. It appears that tone bleeding is a larger problem when the ground is very saturated. We find that the abandoned bare concentric neutral is energized over anything else. The actual soil might be a problem. We have a lot of clay and not much rock. The problem is more common in the spring and the fall.
Utility 2: Our locating difficulty often comes from discerning which is the wire we are looking for [from non-abandoned utilities]. There is a lot of stuff in the ground. A small percentage of issues are from direct parallel circuits.
Utility 4: We have challenges during wet seasons and also very dry periods. Fault locating under pavement/concrete is a problem, too. Abandoned cables prolong outages during restoration events while ensuring the correct cable is marked/located.
What technologies are used to locate cables?
Utility 1: The standard is direct connection to the structure (at a transformer for example). Both active and passive modes are used. We don’t ourselves use ground penetrating radar, but other companies we own do. The ground penetrating radar doesn’t let us positively identify a specific utility – it only lets us know there is something there.
Utility 2: We have a locating wand. It has both active and passive modes.
Utility 4: Mostly passive and active. We rarely use ground penetrating, via a contractor.
Utility 5: Mostly direct connect on the transformer or other above ground device. We sometimes have trouble with the paint. No ground penetrating radar.
Utility 7: Only aware of radar use (of contractors for this company).
Are multiple approaches used?
Utility 1: Yes, both active and passive in one device.
Utility 2: Yes, both active and passive in one device.
Utility 4: Both passive and active.
What utility records do locators have available?
Utility 1: We have GIS maps that include existing abandoned cable, and we share this with our contractors.
Utility 2: We have GIS maps that include abandoned cable.
Utility 3: Circuit maps. We don’t have a many old cables in the ground.
Utility 4: We have records for self-locating, usually for faults. They are GIS records. They do include abandoned cables. We also use 811.
Utility 5: We have a mapping system that we share with our line locators. It includes the abandoned facilities as well as gas and our other assets.
Utility 6: We have a GIS system and a specific layer for abandoned cables.
Utility 7: Doesn’t know what contractors have, but we have a GIS system. Not sure what abandoned line indications are in it.
Will those records include abandoned cables?
Utility 1: In theory it has the abandoned cables, but in practice when a cable is replaced, workers update [replace] the existing cable record, so the information about the abandoned cable is lost.
Utility 2: The GIS maps include abandoned cables. Record keeping is manual and so not always accurate.
Utility 3: If crews are replacing a cable, they usually mark it on a circuit map. The maps will typically show the presence of an abandoned cable.
Utility 4: We have records for self-locating, usually for faults. They are GIS records. They do include abandoned cables. We also use 811.
Utility 5: Yes.
Utility 6: Yes, in a specific GIS layer.
When a cable is marked, what’s the normal “dig distance” that a contractor would normally use? Is there a standard or guideline on that?
Utility 3: The dig distance is likely 18 in but would have to double check.
Utility 5: The dig distance is 18 in.
Utility 6: Hand dig within 18 in of the markout.
Utility 7: 3 ft for hand dig.
What are the best strategies for location to prevent mislocating?
Utility 1: Idea - potentially take the abandoned cable three feet out of the structure and cut it off at both ends to see if that eliminates the problem. We have photos of the abandoned cable that has been cut in the transformer sitting in water. They do not always disconnect the neutral.
Utility 3: There is a cutback requirement at the substation. They will cut back to the substation boundary.
Utility 5: The better signal, the better the results. Cross-bonding with coms makes it harder to locate.
Utility 6: We don’t have any best strategies to prevent mislocating.
Are cable replacements done by contractors, utility crews, or a mix?
Utility 1: Contractors.
Utility 2: A mix.
Utility 3: Almost always contractors.
Utility 4: Contractors. They typically do directional boring. We will do it ourselves in the case of an outage or under a time constraint.
Utility 5: Contractors.
Utility 6: Contractors.
Utility 7: We mainly use contractors.
Do you have a standard on how to replace cables?
Utility 1: No
Utility 2: We have service standards that we follow. There might be one for replacing cables.
Utility 3: The standards are only the end result specifications.
Utility 4: Does not see much in the construction standards. It’s more of a work practice.
Utility 5: No, not specifically for replacing cables. We have abandoning and installation guides. We have looping guidance and an overall aged cable replacement program guide.
Utility 6: We do not have a standard for that. We have a standard for how it should be built.
Utility 7: Yes.
Do you have requirements for how to disconnect the ends of abandoned cables (including neutrals)?
Utility 1: No, that is what we are hoping to learn.
Utility 2: It was our practice to clear the neutrals – cut cable, remove the concentric from that spot, then take the neutral back to the individual cables.
Utility 3: For URD, no. (For manhole applications, there are requirements.)
Utility 5: Older stuff was a polypad at grade level. Now they lop everything off – neutrals and conductor below grade. This is not a requirement but just what we tend to do.
Utility 6: We don’t have standards for abandoning cables. We have standards for how cables should be abandoned on the underground.
Utility 7: We follow similar practices to the rest of the utilities that spoke.
When replacing UG cables with parallel cables, how much separation is used? Do you have a minimum or maximum suggested separation?
Utility 1: We have no standard for this in place.
Utility 3: None as far as I know.
Utility 4: We have construction standards. Typically, if you’re boring, you’re just trying to get a good path.
Utility 5: We use the same standards as constructing single-phase or three-phase circuits, which is 1 ft. This is to keep a safe clearance from the testing equipment – we treat all cables within 12 in as hot.
Utility 6: We don’t have any separation requirement as far as I know.
Utility 7: We don’t have a specific requirement for proximity to our own cables. Near other utilities we try to stay 1ft away.
Are abandoned cables noted in GIS or other database?
Utility 1: Yes, in theory in GIS although they often get over-written when new cables are installed.
Utility 2: Yes, abandoned cables are noted in GIS.
Utility 3: We don’t have underground marked on the GIS, so abandoned cables are marked on a paper map.
Utility 4: We have maps. They aren’t 100% because sometimes there are older abandoned cables that we do not know about.
Utility 5: Abandoned cables are noted in the GIS system as an additional layer.
Utility 6: We do have abandoned cables in GIS.
Utility 7: Yes.
Does the replaced cable often end up out of the expected path from point A to point B?
Utility 1: Yes, occasionally. It depends on the feeding and boring and skill of the crew out there.
Utility 2: Yes.
Utility 3: I would say yes, but typically it’d be in the same run.
Utility 4: Sometimes, but we hope they are put in our maps appropriately.
Utility 5: For the most part they end up in the expected path.
Utility 6: Usually in the correct location.
Utility 7: It’s usually fairly accurate.
Our state is starting to require everyone to provide X,Y,Z coordinates of all installations. Anything with 12-in deviation from the proposed location needs approval.
Discussion
Utility 1 (person 1): If there are best practices, could we push this through state 811 programs? For any utility?
Tom: It sounds like the best practice is cutting back, but the question is how far back it needs to be to be effective.
Utility 1 (person 2): We would love equipment that can help us identify the correct cable in this scenario. Our experts do not know how to resolve the problem. Price tag matters, but we are going to continue to face this problem because we can’t fix decades of abandoned cables. Is anyone aware of equipment or advice to mark the appropriate cables?
Utility 1 (person 3): One of the vendors has a new piece of equipment out that is somewhat effective at this. They claim that they can catch the live wires over the dead wires in places where they had trouble with this in the past. Their sales person is not overselling it – maybe it isn’t a perfect solution but it can be helpful. We are looking forward to doing our own tests.
Tom: do you know why it works better than existing technologies?
Utility 1 (person 3): No, it still uses magnetic locating. It has to do with the antenna configuration. It’s made by Vivax.
Tom: Any other discussion items?
Josh Perkel: In the cases you have jacketed cables and unjacketed cables, do they have the same specifications like the amount of neutral and conductor size? Or do the new cables tend to be a different design than the previously abandoned ones?
Utility 5: We’ve seen some #2 stranded from the 60s, 70s, and 80s, but everything since then has been #1 solid to prevent any chance of water migration into it. They’re single phase, three phase circuit-type cables. For the most part, what we’re replacing is quite similar. There might be a small size change. Sometimes, we replace the oldest #1 with a #1 solid again.
Tom: What about the neutral?
Utility 5: The neutral is the same size. The jacket goes over it. It’s the same size concentric-style neutral.
Utility 7: We’ve had problems with the old ones that were unjacketed and replaced as well as the older jacketed ones that were replaced.
Utility 1 (person 1): We’re mostly replacing bare concentric neutral cables. The new cables we’re replacing with are jacketed. Sometimes the replacement is slightly higher voltage, like replacing 15-kV cable with 25-kV cable to facilitate a voltage conversion or get rid of step-up/step-down transformer. We still have close to 100 million feet of bare concentric neutral cable in the ground from before 1985. It’s starting to get old. Much of the process is how to do this right going forward.
2.3 - P180.002 Underground Infrared Thermography Utility Information Exchange - May 18, 2022
EPRI Hosts
- John Tripolitis, jtripolitis@epri.com, Underground Distribution Assets
- Josh Perkel, jperkel@epri.com, Underground Distribution Assets
Attendees
The UIE was attended by EPRI member companies and EPRI staff. The list of member company attendees appears in Table 1.
Table 1: List of Attendees
| Company | Name |
|---|---|
| Ameren Services Co. | John Roland |
| Ameren Services Co. | Paul Aten |
| American Eletric Power Service Corp. | Cory Jeffers |
| American Eletric Power Service Corp. | James W. Robbins |
| American Eletric Power Service Corp. | Matt Myers |
| BC Hydro | Aaron Norris |
| Consolidated Edison, Inc. | Divith Aruni Babu |
| Consolidated Edison, Inc. | Michael Donohue |
| Consolidated Edison, Inc. | Paul Volmar |
| Dominion Energy, Inc. | Marty O’Baker |
| DTE Electric Company | Patty Hasa |
| Exelon Corporation | Ali Syed |
| Exelon Corporation | Andrew Morris |
| Exelon Corporation | Beata Okruta |
| Exelon Corporation | Dustin Nace |
| FirstEnergy Service Company | Elizabeth Akosile |
| Hawaiian Electric | Ikaika Mokiao |
| Lincoln Electric System | Winston Larson |
| Los Angelos Dept. of water and power | Bryan Castillo |
| Los Angelos Dept. of water and power | Frank spencer |
| Los Angelos Dept. of water and power | Richard Trujillo |
| Los Angelos Dept. of water and power | Yousseff afif |
| National Grid UK, ltd. | Hernan Yepez |
| Portland General Electric Co. | Aharown Luke |
| Portland General Electric Co. | Brad Spiering |
| Portland General Electric Co. | Eric Bryant |
| Portland General Electric Co. | Jeff Kaiser |
| Salt River Agricultural Improvement and Power District | Jason GunaWardena |
| Seatle City Light | Hamed Zadehgol |
| WEC Energy Group, Inc | Marty Koutnik |
Utility Information Exchange Summary
The following is a summary of responses gathered during the individual question roundtables
Topic: Infrared thermography assessment in the field
Companies participating in the Round Table session
-
Portland General, PGN
-
LADWP
-
AEP
-
Ameren
-
Con Edison
-
National Grid
-
SRP
-
We Energies, WEC
-
Seattle City Light
-
ComEd
Q1: Why do you do IR inspections on your UG system assets?
-
PGN
-
Safety
-
Preventative maintenance
-
Both were 4 years ago – not happening recently
-
-
LADWP
-
They have an inspection group and crews do inspection when they go into vaults
-
They are inspecting for any weak spots
-
-
AEP
-
Policy in place for 12 years
- They have actions for different temperature ranges.
-
Primarily for safety and is used for every entry into a structure
-
-
Ameren
- Safety check and when rebuilding manholes
-
Con Edison
-
Safety check before entry
-
Planning for proactive cable replacements (condition assessment) – scheduled inspections
-
Most inspections are on 120/208 V system
-
260,000 plus structures to inspect at least once every 8 years
-
Installing IR sensors in other monitoring devices
-
-
National Grid
-
Worker safety – inspection done before operating any separable connector
-
Reliability – structure inspection to assess condition
-
-
SRP
-
Scheduled cycle inspection to identify issues with equipment (reliability)
-
They do not enter energized manholes but when they did they would do IR prior to entry
-
-
WEC
-
No IR program for some time
-
Trying to come up with a procedure
- Proactive mainline feeder patrol
-
Starting to get more involved with manhole-duct system. Before they would only do a visual inspection
-
Thinking to start using IR in structures
-
Expectation is that crews will IR scan prior to working
-
-
-
Seattle City Light
-
Good indicator of loading on the circuit and can be used for maintenance and planning
-
Also used to find manhole event precursors
-
-
ComEd
-
Safety and reliability
-
Standing practice to do IR scan before doing any work in the manhole
-
Occasionally they will do IR inspections of cable system components
-
For transformers, they will do IR inspections for preventative maintenance rather than safety
-
Q2: If you use IR, what thresholds have you established for action?
-
PGN
-
Actions are based, in part, on the experience of the line worker
-
Delta T levels for OH and UG based on ITC work (which was based on ComEd)
-
No adjustment for thickness of the insulation
-
No consideration for component history / known issues
-
-
LADWP
-
Look at differences in temp ( ΔT ) between different components.
-
>26F ΔT, major deficiency, immediate repair. No work in structure until hazard mitigation.
-
Between 14 and 26F ΔT, deficiency, repair in reasonable time, work can continue if workspace can be made safe.
-
Between 5 and 15F ΔT, possible deficiency, notify supervision. Works can continue.
-
-
AEP
-
They have thresholds
-
Minor delta T < 45 F
-
Intermediate 45 – 72 F
-
Serious > 72 F
-
-
-
Ameren
-
Unofficial policy at this time
-
Temperature differences between the phases
-
-
Con Edison
-
Primary and LV secondary
-
Delta 15C – splice compared to cable on either side of the splice and same cable to other sections of the cable
-
Secondary
-
55C hotspot
-
Delta T of 15C compared to other cable in the same structure – repair within 1 year (applies to all UD cable) – No work allowed in the structure
-
93C hotspot – emergency ticket for immediate repair
-
-
-
-
National Grid
-
12 year old procedure
-
Includes delta T table
-
< 10F Normal, begin work
-
11-20F, do not operate and schedule repairs
-
> 20F, schedule immediate repairs
-
-
-
SRP
-
12 to 18 degrees difference requires a response within 6 months
-
19 to 45 degrees difference requires a response between 2 to 4 weeks
-
46 degree or more difference will require a response withing 3 days
-
-
WEC
-
Focused on 200 A & 600 A elbows
-
< 4C over reference
-
4-14C intermediate
-
>15C immediate repair
-
3/C PILC cable joints are a challenge and it is unclear what criteria to use – would welcome comments from other utilities
-
-
Seattle City Light
-
Nothing in writing
-
Advised field crews to reach out to engineering if Delta T exceeds 5C
-
-
Exelon (Based on information provided by Com Ed and PEPCO)
-
Safety focused
-
1-5F localized ΔT – low priority, fix in under 2-3 years
-
6-25F ΔT – Fix within one year
-
> 26F ΔT – Fix within 14 days
-
Spot temp > 167 F, Fix right away ( either 24 or 48 hrs)
-
Q3: Have you developed a way to demonstrate or quantify the benefits of your investments in IR testing to your internal stakeholders?
-
PGN
-
PM system
- System did not work well and so could not help
-
No database connecting IR measurements to actual condition / findings when components were taken apart
-
-
LADWP
- Needs to reach out to inspection group for more information
-
AEP
-
Have the means to quantify but have not made use of it
- Data about failures and IR are captured in a database
-
-
Ameren
-
In early stages of deploying IR
-
Too early to say
-
-
Con Edison
-
Difficult to quantify
-
Many examples of locations that have been identified and others where they were not able to inspect prior to a manhole event occurring
-
They use cost of manhole event as reference to show the value
-
Efficiency in quickly finding issues inside manholes / vaults
-
-
National Grid
- Hotspots are logged and viewed as a “catch” and are reviewed internally with staff for increased learning and safety awareness
-
SRP
- Believe IR is a good predictor of future failure but have not found a good way to quantify the benefits
-
WEC
-
No way to demonstrate or quantify
-
They also use IR in inspecting URD
-
Cited an example that demonstrated value to their management involving a customer with flickering lights, where they had to send multiple troubleshooters out with a PQ employee. (3 total)
-
Lots of personnel
-
Was able to identify issue by loading service and using IR. Bad connection identified within a few seconds.
-
Savings in labor and time for identifying and solving issues
-
-
-
Seattle City Light
-
No need to demonstrate value internally
-
Left to discretion of engineering and network crews
-
-
ComEd
-
Haven’t needed to develop a way
-
Safety and identification of hot components in structures is recognized as valuable
-
Q4: What metrics, if any, do you use?
-
PGN
-
No
-
Would like to relate to risk (customer interruptions, crew safety, etc.)
-
-
LADWP
- No
-
Con Edison
- Corporate level risk – secondary cable is part of key risk indicator
-
SRP
-
Time between initiation of work order and completion
-
Temperatures used to prioritize the work
-
-
WEC
-
No metric to track
-
Thinking maybe CAIDI may be a way to track
-
-
Seattle City Light
-
Would need to depend on the system
-
Operations of protection system
-
Arc flash risk
-
Comprehensive view
-
-
ComEd
-
Not using any at this point
-
Scheduled inspections and completion are probably the only metrics they are using with respect to IR
- Example: Does work get done on time?
-
2.4 - P180.002 Underground Padmounted Equipment Inspection - July 28, 2022
EPRI Hosts
- John Tripolitis, jtripolitis@epri.com, Underground Distribution Assets
- Josh Perkel, jperkel@epri.com, Underground Distribution Assets
Attendees
The UIE was attended by EPRI member companies and EPRI staff. The list of member company attendees appears in Table 1.
Table 1: List of Attendees
| Company | Name |
|---|---|
| Ameren Services Co. | Patrick Ridgley |
| Ameren Services Co. | Paul Aten |
| American Electric Power Service Corp. | Cory Jeffers |
| American Electric Power Service Corp. | Matt Myers |
| BC Hydro | Jason D’Cunha |
| BC Hydro | Thomas Huitika |
| Central Hudson Gas & Electric Corp. | Amanda Lugo |
| Central Hudson Gas & Electric Corp. | Taryn Black |
| Consolidated Edison, Inc. | Andrew Reid |
| Consolidated Edison, Inc. | Frank Doherty |
| Consolidated Edison, Inc. | Mohamad Ali-Bappim |
| Consumers Energy | Leslie Shaughnessy |
| Dominion Energy, Inc. | Adam Flowers |
| Dominion Energy, Inc. | Amy Carrion |
| Dominion Energy, Inc. | Liz Sullivan |
| Dominion Energy, Inc. | Leonard Sandberg |
| Duquesne Light Co. | Dan Antonucci |
| Duquesne Light Co. | Matt Thimons |
| Exelon Corporation | Aiye Fabiyi |
| Exelon Corporation | Ali Syed |
| Exelon Corporation | Dan Barabas |
| Exelon Corporation | Merle Turner |
| Exelon Corporation | Najwa Abouhassan |
| Exelon Corporation | Rebecca Kartheiser |
| FirstEnergy Service Company | Dean Philips |
| Georgia Transmission Corp. | Mohamed Aly |
| Lincoln Electric System | Tim Menter |
| Lincoln Electric System | Winston Larson |
| Los Angeles Dept. of Water & Power | Marnelli Batra |
| National Grid UK, Ltd. | Hernan Yepez |
| Portland General Electric Co. | Bobby Kosowski |
| Portland General Electric Co. | Jeff Kaiser |
| Salt River Project Agricultural Improvement and Power District | Chance Bellflower |
| Salt River Project Agricultural Improvement and Power District | Logan Tsinigine |
| Salt River Project Agricultural Improvement and Power District | Rick Hudson |
| Saudi Electricity Co. | Nouh Al-Herz |
| Southern Company | Robert Boyd |
| Southern Company | Scott Strahan |
| WEC Energy Group, Inc. | Amin Khanlar |
| WEC Energy Group, Inc. | Marty Koutnik |
Utility Information Exchange Summary
The following is a summary of responses gathered during the individual question roundtables. Responses are provided in the Excel file at the following link.
Questions
1. Do you perform periodic inspections of Padmounted Equipment?
If yes, please briefly describe your program:
- What equipment to you inspect?
- How often?
- Who does your inspection? Your own employees or contractors?
- Is your inspection program limited to the exterior, or do you open equipment and inspect the interior?
- Does your inspection approach include the use of IR?
- Do you take and record photographs or video of inspected units?
2. Is your inspection approach informed by a written guideline?
If yes,
- does your guideline include criteria for assigning criticality or severity (such as determining the severity of corrosion, for example)?
- does your guideline indicate expected times within which repairs must be made based on severity of findings?
3. Do you record your inspection findings?
- If yes, please describe how that is done (on paper, utilizing a handheld application, or other).
- Also describe any computer systems / WM systems into which data is being recorded.
4. If you are tracking inspection data, please describe how you leverage that data.
- Are you performing any predictive analytics?
- Do findings inform replacement decisions?
2.5 - P180.002 Underground Corrosion (part of Task force Meeting), May 16, 2023
Companies who participated in the information Exchange
- AEP
- PECO
- Con Edison
- SRP
- Central Hudson
- OG&E
- Dominion
- FirstEnergy
- PHI
- CPS Energy
- Commonwealth Edison
- National Grid
- WEC
Question 1:
For equipment in below grade vaults:
- Please describe the main corrosion issues you encounter
- Please describe your approach to identifying, preventing and remediating corrosion
Responses / Comments
AEP
- Issues vary across system as conditions can be different among geographically disparate operating areas
- Routine inspections are important for identifying issues. Replacement decisions are based on inspection findings
PECO
- Inspections are used to identify corrosion issues. Replacement decisions are based on inspection findings
- Corrosion prevention techniques include standards associated with equipment tank materials and coatings
- PECO also uses passive cathodic protection on switches and transformers
- Inspections include an assessment of anodes used for cathodic protection. Anodes are inspected on a 6 year cycle for transformers, and a 3 year cycle for switches
Con Edison
- The main corrosion concerns are network transformer corrosion and switch corrosion
- In addition, corrosion of steel beams and re-bar within the structure is a concern. Structural corrosion can create access issues
- Con Edison installs anodes on units
- Visual inspection of the units is used to ascertain corrosion severity and decide on replacement
SRP
- Almost no below grade vaults or equipment in below grade vaults
- No significant corrosion issues with this sort of equipment
Central Hudson
- Primary issues are with network transformer and protector corrosion
- Structure roofs, the tops of equipment tanks, and the first foot at the bottom of transformers are the most common areas for corrosion
- CH places anodes for cathodic protection at the bottom part of transformer
- Ch has tried plastic sheeting to divert water entering the structure from the grate away from the equipment tank tops; however, this approach was difficult to implement, and limited structure access in some cases
- To remediate corrosion identified through inspection, CH has tried sandblasting away rust and then repainting, but found this expensive. Primary remediation approach is to replace units identified through inspection.
- CH noted that corrosion issues found during inspection may include cable system components
OG&E
- Transformers are their main issue, as units have direct exposure to water dripping on them as units are situated under the vault grating
- Switches and other equipment seem to perform better since they are wall mounted and not located under the grating
- If, through inspection, corrosion is identified early, OG&E may sand and recoat equipment tank sections
- OG&E uses galvanized ladders in vaults; if corroded, they will remove, repair and recoat the ladders
- For vaults that contain standing water, they may place UG transformers on a 6 inch stainless steel I-beam to keep the transformer above the water in order to forestall corrosion.
Dominion
- Conditions may vary, for example, they experience salt water in the eastern part of VA
- Identify corrosion through inspection
- Have been replacing the tops of the transformers for about 12 years
- Most of their corrosion issues are with transformers and switches that are under water
- Utilized Mg anodes, but led to build up on transformers. Switched to Zn but then had to reduce the size
- One strategy they used was to specify corrosion resistant coatings on transformers
- Initially used metal I-beams to raise transformer off the ground, but experienced corrosion of the beams. Switched to a concrete beam to raise transformer
FirstEnergy
- Have had corrosion issues with transformers
- Different ways of addressing corrosion across their operating companies.
- One strategy to prevent debris and moisture from affecting transformer tops is to install sheeting over the tops of transformers using corrugated fiberglass roofing material. This is effective, but the material can break and fall onto the transformer
- Keep vaults dry as much as possible – but sump pumping may not be possible due to oil contamination
- Metal cable racks on the wall are an issue – switched to a fiber reinforced cable rack
- Cast in place ladder rungs tend to corrode away
- Focus on avoiding scrapes and scratches in transformer coatings to prevent corrosion
PHI
- In their equipment tank specifications, other than network transformers, they are moving away from mild steel and towards stainless steel. Network transformers continue to be mild steel
- Aggressive inspection program, including recording corrosion findings.
- A challenge is identifying how much rust is acceptable. It is hard to see the rust, especially in locations under the paint
- PHI specifies anodes (32 – 3 lb Mg anodes) , they replace the anodes if found more than 50% consumed during inspection
CPS Energy
- CPS does not experience major issues with UG equipment corrosion
- During their normal inspection cycle for transformers (yearly), CPS Energy does a visual inspection for corrosion.
- A vault inspection checklist is completed by crews, includes corrosion findings.
- If a corrosion finding is repairable, the crew can take care of it then
Com Ed
- Not much trouble with corrosion of UG transformers. The bulk of their corrosion issues are with structural items, such as cable racks.
- For transformers, specify a robust coating system and most are in dry vaults
- Transformers are not placed directly underneath grating. Drip edge helps keep moisture from dripping on transformer
- Cable racks seem to be more of an issue; Com Ed is replacing older galvanized steel racks with stainless & composite racks
- Bronze supports did not work well
National Grid
- Same corrosion problems as most utilities experience
- NE gets runoff from road treatments in their vaults
- Prevention strategies include the use of stainless steel tanks, and special coatings.
- The have experienced corrosion issues with pressure relief devices (PRDs) used on network transformers. Switched from an Al to a brass flange
- Had had corrosion issues with galvanized steel ladders and cable racks
- Install Mg anodes in the manholes
- Utilize support I-beams (concrete or granite slabs) to support transformers
- Use Tin coated copper bonds for all the equipment
- 5 year cycle inspection
We Energies
- No network, but do have under sidewalk type vaults on their system
- Use stilts under equipment to keep them off the floor in the vaults. Use Concrete supports under transformers an switches.
- Use sacrificial anodes
- Use a basin on the top of transformers to cover the top of the transformer, and keep the salt spray off of the units
- Use other diversion techniques as well to keep salt water from hitting equipment
- Use stainless steel equipment as a corrosion prevention strategy
- Do not experience problems with their cable racks.
- Perform a Bi-annual inspection of the manhole. The inspection card is stored at the manhole. (Change prompted by an incident where a ladder broke away from the frame and an employee fell).
- Noted that they have corrosion the lift off slab, corrosion of the roof of the structure, and cracking walls.
To download a PDF of this summary, click here.
3 - Network Training
Training on low voltage secondary network systems available through EPRI U
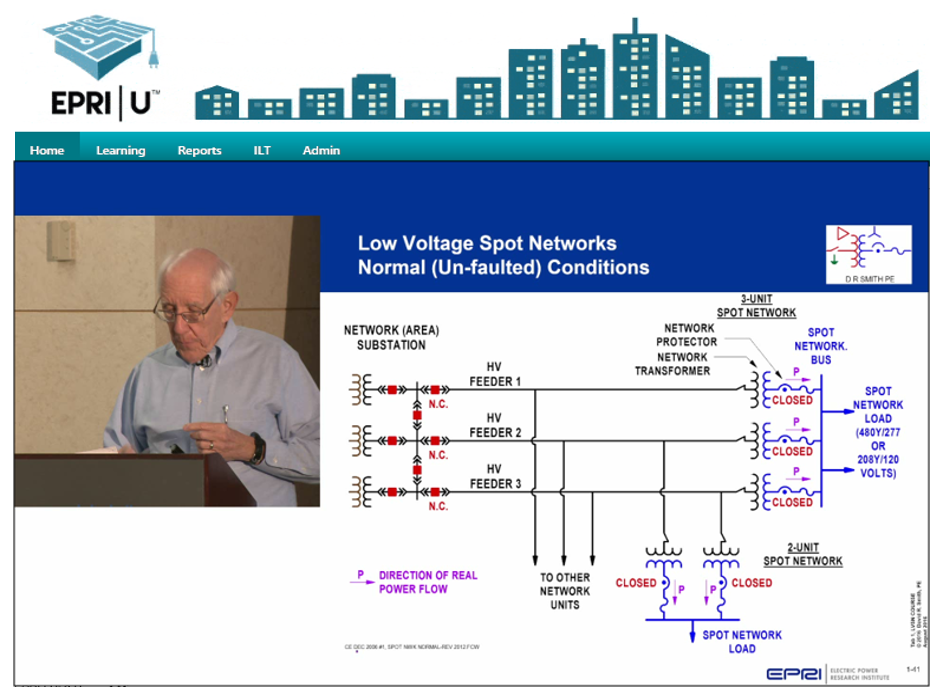
EPRI is pleased to present a series of training videos on Low Voltage Secondary Network Systems. These videos, offered through EPRI U, are part of a comprehensive training curriculum on low voltage network systems.
The training videos have been developed from content recorded during a live training session held at PEPCO (Exelon), in Washington DC, in 2016. EPRI sincerely thanks PEPCO for supporting the creation of this video. The training videos are focused on varied topics related to low voltage secondary networks, including an overview of network systems and network system components, design considerations, network feeder protection, network protector relaying, fuse and cable limiter application, and distributed energy resources on network systems. Participants will gain knowledge of network system operation, various network system layouts, and network components, including the network unit.
Click Here to view Network training videos on EPRI U!
4 - Network Reference
Network reference material
The EPRI Low-Voltage Secondary Network Systems Reference Book (Network Reference) is a comprehensive, stand-alone reference on network systems, a design type that utilizes a meshed or “networked” secondary system supplied by multiple primary feeders.
The Network Reference includes technical content on network components and their operation, network system designs including substation, MV, and LV system designs, system protection, network protector relaying, modeling, arc flash reduction, and distributed energy resources on network systems.
For a hard copy version of the Network Reference, please see the following link: 3002023669
4.1 - Introduction and Overview of Secondary Network Systems
INTRODUCTION AND OVERVIEW OF SECONDARY NETWORK SYSTEMS
This chapter provides a brief overview of the secondary network system, discusses the system response when a primary feeder is taken out of service and placed back into service in absence of a fault, and discusses the system response for faults at different locations. The overview will utilize the simplified three-feeder secondary network system shown in Figure 1. In this system the three primary feeders supply a three-phase 208Y/120-volt grid (area) network system, and a two-unit spot network, which normally supply service at either 208Y/120-volts or 480Y/277 volts.
Basic Parts of the Network System
The secondary network system consists of (1) the supply substation and the network primary feeders, (2) the network unit, and (3) the low-voltage grid of interconnected cables for the area network, and for the spot network the means for paralleling the network protectors, either cables or bus from which the services are taken. The network unit includes the high-voltage disconnect and grounding switch, a network transformer, and a network protector. In the spot network the network units are physically close together, sometimes in the same vault or room, and have no ties to the area network, even when operating at 208Y/120-volts. One major user of spot networks refers to these as “isolated networks”, to clarify that there are no ties to the street network. Spot networks frequently supply the service(s) to a single building.
Supply Substations and Primary Feeders
The substation supplying the secondary network system may be dedicated to the network, in that it supplies through medium-voltage circuit breakers, called feeder breakers, only network primary feeders, as in Figure 1. The substation supplying the network primary feeders may also supply non-network primary feeders, or other radial distribution feeders for medium-voltage customers. Network Substation Design discusses in detail substations for supplying secondary network systems. The nominal voltages of the medium-voltage system that supplies the network primary feeders range from 4.16 kV up through 34.5 kV, with the number of primary feeders supplying the secondary network ranging from 2 to about 28. The primary feeder systems of most secondary network systems operate at 15 kV class primary voltages, such as 11 kV, 12.47 kV, 13.2 kV, and 13.8 kV. Most always every primary feeder for a given secondary network operates at the same nominal voltage, although some secondary networks have been supplied from primary feeders operating at two different nominal voltage levels. Usually there are operating problems with the latter arrangement, due to voltage magnitude difference and voltage angle differences, and this design is not recommended. The effect of voltage and phase angle differences on the operation of network protectors is discussed in Chapters 3 and 10.
Network primary feeders are classified as either dedicated, or nondedicated. Dedicated primary feeders supply just network transformers for the area network and spot networks.

Figure 1: Simplified secondary network system with area network and
two-unit spot network.
The primary feeders of the system in Figure 1 are dedicated, supplying only network transformers. Nondedicated primary feeders supply network transformers, and other distribution transformers for non-network load. Nondedicated primary feeders may also supply medium-voltage customers, and utility-owned small unit substations that step-down to a lower primary voltage, such as from 13.8 kV to 4.16 kV, or 4800-volt delta. When the nondedicated feeder supplies three-phase distribution transformers with their primary windings connected from phase to neutral, the primary feeder must be effectively grounded. Primary System Grounding discusses grounding of the medium-voltage system that supplies the network primary feeders.
Network Unit
The network unit consists of either a two-position grounding switch as shown in the upper left-hand corner of Figure 1, or a three-position disconnect and grounding switch, as found at all other network units in the figure, the network transformer, and the network protector. The three-position disconnect and grounding switch most always is in a separate compartment welded to the side-wall of the network transformer tank. The two-position grounding switch is contained within the main tank of the network transformer, with the operating handle on either the top or side of the transformer tank. A few utilities have replaced the three-position disconnect and grounding switch with HV bushings for separable connectors, either 200- or 600-ampere located on the transformer end wall opposite the throat for the network protector. Figure 2 shows a network transformer with 600 ampere bushings for the primary cable connections.

Figure 2: Network transformer with separable HV connectors
(courtesy PPL).
The network protector on the low-voltage side of the network transformer most often is mounted on a low-voltage throat of the network transformer. The low-voltage throat is on the end-wall of the transformer, opposite the primary connections. However, some utilities have network transformers where the network protector and HV disconnect and grounding switch are mounted next to each other on the side-wall of the network transformer. Some network protectors are separately mounted on a vault wall or elsewhere, where there are cable connections from the LV terminals of the network transformer to the network protector “transformer” side terminals. The network protector also contains a fuse, which can be either inside or outside of the enclosure of the network protector. Network Unit Equipment includes a description and pictures of the network unit, and describes the functions of that equipment.
For the purpose of the network system overview in this chapter, the functions of the network protector are briefly described. Simplified, the purpose of the network protector is to protect the low-voltage (LV) secondary system, either grid or spot, from disturbances that occur on the primary feeders or in the network transformers. First, if a feeder breaker at the substation in Figure 1 opens, either in absence of or with a fault on the primary feeder, the network protectors associated with the primary feeder open, thereby disconnecting the LV secondary network from the primary feeder and its network transformers. Network Protector Relaying discusses the tripping characteristics of the network protector relay that controls automatic opening of the protector, but oversimplified the protector opens when the real power flow (watt) is in the reverse direction, or from the LV network back towards the primary, and is greater than several tenths of one percent of the kVA rating of the network transformer. For a protector on a 500 kVA 216Y/125-volt network transformer, the protector may open for reverse flows as low as 900 watts, less than that of a typical hand-held hair dryer.
The second function of the network protector, when the primary feeder breaker at the substation is closed and energizing the feeder and its network transformers, is to automatically reclose the open network protector to connect the network transformer to the LV secondary network, either grid or spot. The network relays in the protector will initiate closing of the open network protector providing the watt and var flows in the protector following closure are into the network, and above thresholds, and the relay trip criteria are not satisfied.
Secondary Cable Grid
The network units for the grid (area) network usually are located at or very close to the larger loads. Furthermore, depending upon the size of the load, two or more network units may be located at the larger loads. In Figure 1, single network units are feeding into the 208Y/120-volt grid network at all locations, except in the lower right-hand corner where two network units are supplying a bus. From this “paralleling bus”, are cable ties to the area network, and a service from the bus to a large load.
Figure 3 shows a schematic for a large multi-bank installation with four network units, with cable connections from the network protectors to a bus, with two services for a large load, and from which there are cable ties to the 208Y/120-volt street network. This particular multi-bank installation is designed in conjunction with the street ties to function under a double contingency (loss of any two network transformers).
For area networks, most always the nominal voltage of the secondary is 208Y/120-volts, with the secondary system being three-phase four-wire, supplying a combination of three-phase power load at 208 volts, and single-phase lighting load at 120 volts. When a single-phase three-wire service is supplied from the area (grid) network, the nominal phase-to-phase voltage is 208 volts, rather than 240 volts, and the utilization equipment in the supplied system must be selected accordingly. ANSI/IEEE C84 lists system voltages and the voltage rating of utilization equipment that should be used in these systems. A few small grid networks have been installed that operate at 480Y/277 volts, but the concern with these systems is the difficulty in clearing faults in secondary cable circuits, either with cable limiters, burning clear, or manual cutting of energized cables which can be done under certain circumstances in systems operating at 120-volts to ground (neutral).

Figure 3: Large multi-bank installation for supply to large
208Y/120-volt load with ties to street network.
The network units scattered throughout the load area in Figure 1 are interconnected through three-phase secondary cable circuits, referred to as secondary mains, consisting of either single or multiple sets of cable. A cable set consists of three-phase cables and a neutral cable, where the neutral may be either insulated or bare. The secondary mains, shown with the green lines, are intended to supply loads that are close to network transformers whose protectors are open, either because they are open for maintenance, or because the primary feeder and all of its associated network transformers are taken out of service. The secondary mains can be thought of as a “low-voltage” transmission system, performing the same function for the LV secondary network as the HV transmission system performs for the overall power system. In Figure 1, when primary feeder 1 is removed from service, network protectors at network unit 1-1, 1-2, and 1-3 are open, and the load that these network units would normally carry must be picked up by the secondary mains connected to the network units with open network protectors. Also note from Figure 1 that smaller loads can be supplied directly for the secondary mains from manholes, service boxes, and handholes. It is not necessary to install additional network transformer to serve small loads. Secondary Grid Design Considerations discusses secondary grid design considerations.
Spot Network Paralleling Bus
For spot networks, the network units usually are physically close together, with the network units installed in the same vault, or each network unit in a separate vault. Primary feeders supplying network units for the grid network also supply the network units for the spot networks, as in Figure 1. The network side terminals of the network protectors are paralleled to a structure that is called a “paralleling bus” or a “collector bus”, which may be in the same vault as the network units, or may be in a separate vault or bus compartment. The paralleling bus can be made from large cables, rigid bus bars, moles, and commercial metal-enclosed bus duct. Some operators will not allow use of the latter because they believe it is more prone to failure. One or more services are connected to the paralleling bus, with multiple services for just one customer or for multiple customers. As shown in Figure 1, there are no ties to the area or grid network from the spot network. Spot networks are in operation with up to six network units connected to the paralleling bus. When large spot networks are installed to satisfy the load requirements, the fault currents must be limited to within the momentary and short-circuit current interrupting rating of the customer’s service equipment. Figure 4 shows a portion of a three-unit 480-volt spot network in an above-grade in-building vault.

Figure 4: Spot network with all network units and paralleling bus
in the same vault (photo by author).
The network units and the paralleling bus, a portion of which is just visible in the upper left-hand corner in Figure 4, are located in the same vault as the network units. The connections from the network protector terminals to the paralleling bus are made with insulted cables laid in trays, having silver-sand type cable limiters in both ends of each cable. Note the current transformer around each X0 bushing of the network transformer, for supply to relays for a ground fault detection scheme.
Operation During Normal Conditions
Figure 1 shows that in the secondary network system there are many parallel paths from the substation medium-voltage bus to any one load supplied from the low-voltage grid, unlike distribution systems that operate in a radial fashion where there is a single path from the substation to the load. Consequently, removing a single parallel path from service, such as a primary feeder and all of its network transformers, either for maintenance of because of a fault on a primary feeder, will not cause an outage to any load supplied from the area network or a spot network.
Operation When Primary Feeder Breaker Opened in Absence of a Fault
When the feeder breaker at the substation is opened in absence of a fault on the feeder, to take the feeder out of service, all network protectors should open automatically so that an operator does not have to visit each transformer/protector vault supplied by the primary feeder to manually open the network protector. Figure 5 shows the system of Figure 1 the instant after opening of the substation circuit breaker for primary feeder 2, without a fault, but before any network protector opens. On feeder 2 are three network units for the area (grid) network, and one network unit for the two-unit spot network. A fairly common misconception is that at the instant the feeder breaker opens, the real power flow in each network protector on the feeder with the open breaker will be in the reverse direction, or from the LV network back towards the primary feeder.
At the instant the primary feeder breaker opens, the real power flow in each network protector associated with feeder 2 may be either into the LV network, or out of the LV network. In Figure 5, as indicated by the arrows next to the protectors on Feeder 2, the real power flow is in the reverse direction in network units 2-2 and 2-4, and in the forward direction in network units 2-1 and 2-3. The reason for the real power flow being in either direction is that the voltage magnitude and angle applied to the network-side terminals of each of the four closed protectors fed from feeder 2 is different. This causes circulating current flows from one point in the LV secondary network to another, through the network transformers and primary feeder. In addition, there are power flows in the network protectors on feeder 2 from the no-load losses of the network transformers, and I2R losses from currents in the network transformers and cables of primary feeder 2. Consequently, some protectors see a forward power flow, and other protectors see a reverse power flow. This means that when the feeder breaker first opens in absence of a fault, the network relays that control tripping of the protectors do not see a tripping condition in all protectors. The network protectors on feeder 2 will trip sequentially, with the topology of the system changing with the tripping of each protector, and the circulating flows changing following the opening of each network protector. The time for all protectors to open, following opening of the feeder breaker, depends on the network relay sensitive trip time. If some protectors are equipped with time delay tripping, the time for the feeder to go “dead” on backfeed can increase significantly. Network Protector Relaying discusses network relay sensitive trip characteristics and time delay tripping.
With reference to Figure 5, assume that the first two protectors on feeder 2 to open when the feeder breaker is open are at locations 2-3 and 2-4, as shown in Figure 6. With these two protectors open, the power flow in the protector at location 2-2 is in the reverse direction, and the power flow in the protector at location 2-1 is in the forward direction.
With the network relays and protectors at locations 2-1 and 2-2 functioning properly in Figure 6, the protector at location 2-1 will not trip as it has a forward power flow, but the protector at location 2-2 has a reverse power flow and should trip. Utility operating experience has shown that when one protector with a reverse flow is defective and fails to open under backfeed with the feeder breaker open in absence of a fault, it prevents other properly functioning protectors on the feeder from tripping. Manual tripping will result in de-energizing the feeder.
After the protector at location 2-2 in Figure 6 trips, the real power
flow in the protector at location 2-1 will be in the reverse direction,
as shown in Figure 7 and it should trip. With just the protector at
location 2-1 in Figure 7 backfeeding the primary feeder 2, the real
power flow in the backfeeding protector at location 2-1 will be from the
no-load losses of all network transformers on feeder 2, plus the
I2R losses from the flow of transformer magnetizing currents
and primary cable charging currents. Of significance in this discussion
is that the network relay which controls opening
of the network protector does not, in most situations, have to make its
trip contact on just the exciting current and no-load losses of the
network transformer the protector is mounted on.

Figure 5: Network with breaker for feeder 2 open and two closed
network protectors.

Figure 6: Network with feeder breaker 2 closed, but protectors on
feeder 2 closed at locations 2-1 and 2-2.

Figure 7: Network with feeder breaker 2 open and protector at
location 2-1 closed.
After the protector at location 2-1 in Figure 7 opens, as shown in Figure 8, voltage can still appear on primary feeder 2 with the feeder breaker and all network protectors open, due to “sneak circuits across the open contacts of the network protectors on feeder 2. These voltages have been measured in practice. The point is that until the feeder with open breaker and open network protectors is grounded, it is not dead.
Operation When Primary Feeder Re-Energized
Following successful clearing of primary feeder 2 by opening of the feeder breaker and all network protectors on the feeder, the feeder can be placed back into service by closing of the primary feeder breaker at the substation Of course, this would be done only after the feeder is tested to assure that all grounds placed on the feeder for working are removed. At the instant the breaker for feeder 2 closes at the substation, all network protectors on feeder 2 are still open. This condition is illustrated in Figure 9. The network relay in each open network protector fed from feeder 2 senses the voltages on the network side and the transformer side of the open protector, and when the network relay close characteristics are satisfied, the protector will automatically close. Following this, the real and reactive power flows in the closed protectors should be into the network. Network relay close characteristics and settings are discussed in Network Protector Relaying. Further, relationships between network relay close characteristics/settings, and the load on the in-service network transformers in spot networks needed for automatic reclose of the protectors is discussed in Network Protector Relaying. However, all network protectors on the feeder may not reclose when the feeder is first re-energized, depending on the loading on the LV secondary grid network at the instant the feeder is re-energized. It is desired that when the network loads reach their peak levels in the load cycle, all protectors automatically close, but this may not happen if the peak load is light in comparison to the installed network transformer capacity.
Determining the network load at which a network protector in Figure 9 for the grid network closes is not easy, as the voltage at the network-side terminals of each open protector is different. However, in two-unit spot networks as in Figure 9, where protector 2-4 is open, it is possible to determine the load on the in-service network transformer, transformer 3-5 in Figure 9, at which the open network protector, 2-4, closes if it is assumed that the voltage at the HV terminals of both network transformers is the same in magnitude and angle. This is discussed in detail in Network Protector Relaying.
Figure 10 shows the circular close characteristic for the microprocessor network protector relay frequently employed in spot networks. For the two-unit spot network on the right-hand side in Figure 9, with the same voltage applied at the HV side of both network transformers, at the open network protector the phasing voltage, VP, which is the voltage across the open contacts of the protector, is simply the voltage drop in the network transformer whose protector is closed. As shown in Network Protector Relaying, the network loaded needed to cause the open protector to close can be expressed in terms of the relay close settings, load power factor, and network transformer impedance.

Figure 8: Network with breaker for feeder 2 open, and all network
protectors on feeder 2 open.

Figure 9: Primary feeder 2 breaker closed but all network
protectors on feeder 2 open at instant of breaker closing.

Figure 10: Circular close characteristic of network relay for application in spot
networks.
Operation For Faults
This section describes how a LV secondary network system responds for faults at different locations. Figure 11 shows a portion of a network primary feeder and one network unit that is supplying a section of a 208Y/120-volt area network.

Figure 11: Portion of network primary feeder, network unit, and
secondary grid.
The network unit has a three-position disconnect and grounding switch and a throat-mounted network protector. An inter-vault tie circuit, consisting of four sets of cables, with cable limiters at both ends, connects the network protector “network terminals” to an adjacent manhole or vault where the secondary mains terminate, and from which a large service (P+jQ) is connected.
Primary Feeder Faults
Faults on the primary feeder are isolated by opening of the primary feeder breaker, device 52 in Figure 11, and by tripping of all network protectors on the faulted primary feeder. The most common type of fault on the primary feeder cables is the single line-to-ground (SLG) fault, with the current in the fault path with the feeder breaker closed determined by the type of grounding at the substation for the MV system supplying the primary feeders. Primary System Grounding discusses primary system grounding and how it affects currents for the SLG fault, the phase-to-ground voltages on the unfaulted primary phases, and the phase-to-ground voltages in the secondary network when the network transformers have the delta connected primary windings. Primary Feeder Protection discusses phase overcurrent protection and some basic criteria for setting phase and ground overcurrent relays for the primary feeder breakers in the substation.
With conventional circuit breakers at the substation using either oil, vacuum, SF-6, or air for the interrupting medium, the time to interrupt the fault current contribution from the substation side will be the protective relay time, plus the circuit breaker interrupting time. The sum typically is not less than three cycles, and can be higher with older circuit breakers. Faster clearing times can be achieved with high-ampere current-limiting devices, sometimes called electronic fuses, installed in the primary feeders at the substation, as discussed in Primary Feeder Protection.
Primary Feeder Faults In Three-Feeder System
In the three-feeder system of Figure 12, faults on primary feeder 2 are isolated by opening of the primary feeder breaker, and by tripping of all four network protectors on the faulted primary feeder. The most common type of fault on the primary feeder cables is the single line-to-ground (SLG) fault, with the current in the fault path with the feeder breaker closed determined by the type of grounding for the medium-voltage system at the substation. But for multi-phase faults on the primary feeder, the phase currents are a function of both the available three-phase and single line-to-ground fault current on the substation medium-voltage bus. After the breaker for the faulted feeder opens, the backfeed currents from the network are low for the SLG fault, but the backfeed currents for the multi-phase fault will be high.
Terminal Compartment and Switch Compartment Faults
The current for faults in the transformer terminal compartment and or switch compartment in Figure 11 are the same as for faults on the primary feeder at the entrance to the terminal compartment. These faults are cleared by opening of the feeder breaker at the substation, and the network protectors on all network transformers supplied by the primary feeder. However, experience has shown that faults in the terminal or switch compartment may result in rupture of the compartment where the bolted-on cover plates are dislodged. These compartments have relatively small volume in comparison to the network transformer main tank, and can’t absorb much energy without rupturing.
Network Transformer Faults
Faults in the tap changer or in the high-voltage (HV) leads within the network transformer main tank, up to the point where the leads enter the HV winding, also draw the same current as faults on the primary cable at the entrance to the terminal compartment of the transformer in Figure 11. They are cleared by opening of the feeder breaker at the substation, the network protector on the secondary side, and all other network protectors associated with the faulted circuit. The clearing time from the substation with conventional protective relays and circuit breakers will not be less than about 3 cycles. Because of the much larger volume of the network transformer main tank relative to that of the terminal compartment or switch compartment, the main tank can absorb much larger fault energies without rupturing. Network Unit Equipment describes several approaches to network transformer design which reduce the probability of a network transformer main tank from rupturing for high-current internal multi-phase faults.
The currents for faults on primary feeder cables, and for faults in the HV leads or tap changers of the network transformer can be accurately found by calculation with short circuit programs if the system is modeled in detail. For faults within the HV leads, the programs will give the total current in the fault path, the current contribution from the HV primary feeder, and the backfeed current contribution through the network protector from the secondary system. In contrast, for faults within the HV or low-voltage (LV) windings of the network transformer, determination of the current in the fault path, primary feeder, and network protector is not straightforward, due to the uncertainties in the impedances of the faulted windings of the network transformer and the current paths for internal winding faults.
Faults in the network transformer HV winding can be between turns, between layers of the winding, or both and may involve ground. An accurate impedance model does not exist for the transformer for faults internal to the windings, making exact analysis very difficult. When faults within the winding progress to the point where they draw sufficient current to operate either the phase, ground, or both relays for the primary feeder breaker at the substation, the feeder is disconnected from the substation, and all network protectors associated with the feeder will open.
Operation for Faults in Three-Feeder Network System of Figure 1
Considered in this section are the response of the system in Figure 1 for faults on the primary feeder, both multi-phase faults and the SLG fault on the feeder. Also considered are faults in the low-voltage grid (area) network.
Multi-phase Faults on Primary Feeder 2 With Feeder Breaker Closed
Figure 12 shows a multiphase fault, either three-phase of double line-to-ground (DLG) on feeder 2 with the feeder breaker closed. For this system it is assumed that the primary feeders for the network come from a substation with closed bus-tie circuit breakers, so that at the substation-end the same voltage is applied to all primary feeders with the breaker for the faulted feeder closed.
For the network protectors in Figure 12 connected to the faulted feeder, the power flow in each can be either into or out of the network, as shown by the double arrows next to each closed protector fed from feeder 2. The significance of this is that the network relay in these protectors may not make their trip contact with the circuit breaker for faulted feeder 2 closed. However, after the circuit breaker for the faulted feeder opens, with a multi-phase fault on the feeder, the network relay sensitive trip characteristic in each protector on the faulted feeder should be satisfied, and all protectors on the faulted feeder should open. But if one of the protectors fail to open for the multi-phase fault, as in Figure 13, then it is desired that the high-current backfeed be cleared by blowing of the fuse or fuses in the backfeeding network protector that fails to open.
Multi-phase Fault on Primary Feeder 2 with Stuck Closed Protector
In Figure 13, it is assumed that for the multi-phase fault on feeder 2, the protector that fails to open is at location 2-1. The backfeed currents in each phase of the protector at location 2-1 depends upon the type of fault, the impedance of the backfeeding network transformer, and the stiffness of the LV network at the backfeed location. Usually the impedance of the primary feeder between the backfeeding transformer/protector and the fault is negligible in comparison to the network transformer impedance. This is discussed in more detail in Backfeed Currents For Primary Feeder Faults, considering both the three-phase fault, and the DLG fault.
With the protector failing to open as in Figure 13, the only way to clear the backfeed is by blowing of the fuses in the backfeeding network protector, where it is desired that the protector fuses blow before the backfeeding network transformer can be damage thermally or mechanically. But suffice it to say that it is more difficult to blow all the fuses in the backfeeding protector for the double line-to-ground (DLG) fault than for the three-phase fault, especially if the backfeeding network protector is connected to the fringe of the grid (area) network. For backfeed to the DLG fault, the current in one phase of the protector is the same as that for a three-phase fault, but in the other two phases it is approximately 50% of that for the three-phase fault.
Network Unit Equipment discusses through fault protection provided to the network transformer by the network protector fuses. At this point suffice it to say that the higher the backfeed current, the more likely that the network protector fuses will protect the network transformer. An advantage of having network transformers with 4% impedance rather than 5% impedance is that the backfeed currents are higher, especially when the backfeed is from a fringe area of the network. The higher the available fault current from the network, the more likely the protector fuse will protect the network transformer if the protector fails to open Furthermore, the protection the fuses provide is influenced by the type of fuse in the protector, such as low-loss tin, Y or Z copper, type S, or current-limiting.

Figure 12: Multi-Phase fault on primary feeder 2 with feeder
breaker at substation closed, closed bus-tie breakers.
Single Line-to-Ground Fault on Primary Feeder 2 with Stuck Closed Protector
If the fault on the primary feeder were a single line-to-ground (SLG) fault as shown in Figure 14, the currents in the fuses in the backfeeding network protector at location 2-1 may not be high enough to blow the protector fuses if the protector fails to open. The reason for this is that with the HV windings of the network transformer connected in delta and the feeder breaker at the substation open, the SLG fault is on an ungrounded system, and the current in the fault path is limited by the capacitances of the faulted primary feeder. And if the protector fuses do not blow, which is quite likely, the feeder remains live on backfeed.
When this happens, the voltage to ground of the two unfaulted primary phases of the primary feeder rise up to or slightly exceed the nominal phase-to-phase voltage of the primary system. The duration of this 173 percent voltage to ground will be the time from fault inception until the backfeeding protector is manually or remotely opened which could be for many hours. The cables, splices, and other equipment on the primary feeder must be specified to withstand this 173 percent voltage for many hours. If surge arresters were inadvertently applied on the feeder side of the feeder circuit breaker, they must be selected to have a maximum continuous operating (MCOV) capability that is higher than the nominal phase-to-phase voltage of the primary system. Utilities who have placed arresters on the feeder side of the breaker have experienced failure of the arresters following backfeed to the SLG fault when the arrester MCOV is less than nominal phase-to-phase voltage.
From the preceding discussion, recognize that with the primary feeder breaker closed, the primary feeder is part of a grounded system, but after the feeder breaker opens, the primary feeder becomes an ungrounded system when the network transformers have the delta connected primary windings.
However, in some network systems the network transformers have the grounded-wye connections for the primary windings. Under these circumstances, with the primary feeder breaker open, the primary feeder is still part of a grounded system during backfeed, and the backfeed currents in the faulted phase to the SLG fault will be high. The Z0 to Z1 ratio (ratio of zero-sequence impedance to the positive-sequence impedance) on the primary feeder during backfeed may be less than that when the feeder breaker at the substation is closed. But the backfeed current to the SLG fault will not be as high as that for backfeed to the three-phase fault, because the backfeed current to the SLG fault is a function of both the positive-and zero-sequence impedance of the area (grid) network at the backfeed location. The zero-sequence impedance of the network at the backfeed location in area networks usually is higher than the positive-sequence impedance. The sequence impedances of the network at the backfeeding location is impacted by the sequence-impedances of secondary cable circuits, having either phase-grouped or phase-isolated construction. Secondary Grid Design Considerations discusses the differences for the impedances for phase-grouped and phase-isolated low-voltage cable circuits.

Figure 13: Multi-phase fault on primary feeder 2 with stuck closed
protector at location 2-1

Figure 14: Single line-to-ground fault on primary feeder 2 with
stuck closed protector at location 2-1
Unfaulted Feeder Currents for Adjacent Feeder Fault.
When the primary feeders to a network come from the same electrical bus in the substation, as in Figure 15, with a fault on a primary feeder and the feeder breaker closed, the current from the substation end, ISUB, is quite high, but the current coming back to the fault from the network, IBACK is relatively low. The reason for this is that with the breaker for the faulted feeder closed, the fault pulls down the voltage on the substation bus. Consequently, the currents in the unfaulted primary feeders with the faulted feeder breaker closed are usually not that high. In Figure 15, this would be the currents in unfaulted primary feeders 1, 2, 4, and 5 of the simple system having a fault on feeder 3.

Figure 15: Primary feeder fault with faulted feeder breaker closed.
After the breaker for faulted feeder 3 opens as shown in Figure 16, the substation bus voltage returns to near normal, and backfeed current IBACK can increase to a very high level with all network protectors closed. A result is that the current in unfaulted feeders 1, 2, 4, and 5 at the substation can be quite high with all protectors closed.

Figure 16: Primary feeder fault with faulted feeder breaker open.
With the feeder breakers at the substation having instantaneous current relays, device 50ϕ, it is imperative that the pickup of 50ϕ for each unfaulted primary feeder be set high enough so that they do not reach through the secondary network to see a fault on the adjacent primary feeder whose feeder breaker is open. There have been incidents in actual systems where this happened and created significant problems.
Faults in Secondary System
With reference to Figure 11, faults in a set of low-voltage cables in the inter-vault tie circuit between the network protector terminals and the adjacent manhole or vault will either self-clear, blow cable limiters, be cut in the clear, or by a combination of these mechanisms. If cable limiters are not used, then the fault must self-clear or burn clear. Network protectors do not trip for faults in the secondary cable circuits, and the instantaneous current relays for the primary feeders at the station do not pickup, and the overcurrent relays do not time out for faults in the LV secondary. Generally, isolating faults in the LV secondary in this manner does not result in an outage to the network. However, when cable limiters are not installed in the secondary, there have been cable faults which did not burn clear, and caused burning of cable insulation. To clear these faults, it was necessary to shut-down the network by tripping of all primary feeder breakers at the substation.
Figure 17 shows the simple three feeder network system with a fault in one set of phase-grouped cables in the duct between the manhole supplied from the protectors at locations 2-2 and 3-2. With cable limiters installed as shown, it is desired that the currents in the limiters at the terminal ends, IF1 and IF2, are high enough so that the limiters in the faulted phases blow before any cable insulation, other than that in the vicinity of the fault can be damaged, and before the fault can propagate away from the location of the initial fault.
For bolted faults in secondary mains with cable limiters at both ends, there is a good chance that the fault currents will be high enough to give rapid clearing by blowing of the cable limiters. However, if the fault is arcing in nature and intermittent, the cable limiters may not blow to clear the fault.
Unprotected Zone Faults
An unprotected zone exists in most LV secondary network systems. With reference to Figure 11, it includes the path from the point where the LV leads exit the coils of the network transformer to the point where the network protector fuse is located. For practical purposes, it is the current path within the throat-mounted network protector. From Figure 11, faults in this area may be cleared from the network by blowing of the network protector fuse, or by cable limiters in the inter-vault tie circuit, or to a paralleling bus in a spot network. But if the fault is within the network protector enclosure, depending on location, the internal fault may propagate to the protector bus work between the fuses and the network-side terminals of the protector enclosure. Fuses external to the protector are more likely to isolated a faulted protector from the LV network. However, in most systems faults in the unprotected zone are not detected by the overcurrent relays for the primary feeder at the substation. If the primary relays were set to operate for faults in this area, then such faults could result in tripping of multiple primary feeders when the faulted network protector is in a multi-bank installation, as in the lower right-hand corner in Figure 1. This circumstance will be discussed in more detail in Chapters 5 and 12.
The unprotected zone also includes areas in the network transformer LV
windings and leads where faults are not detected by the relays for the
primary feeder breaker. For a fault in the transformer to be detected by
the relays for the primary feeder breaker, it must propagate back into
the transformer windings to the point where it draws sufficient current
to be seen by either the phase or ground relays for the primary feeder.
If a fault occurs in the unprotector zone
and sustains itself, extensive damage will be incurred.
Fortunately, in systems operating at 208Y/120-volts, the probability of a sustained arcing fault in the unprotected zone is very low, and the existence of this zone in 208Y/120-volt systems rarely has created problems. The reason for this is that arcs in network protectors operating at 208Y/120- volts are less likely to restrike if spacing is maintained between the surfaces between which the arcs were initiated. But there have been faults in the housing busbars and roll-out unit busbars of 208-volt network protectors that caused considerable damage, because the failure was such that phase-to-phase or phase-to-ground metallic contact was repetitively re-established

Figure 17: Three-feeder network system with fault in one set of
secondary network mains
However, in contrast, in systems operating at 480Y/277-volts, faults have occurred in the unprotected zone, which did not self-clear, and there have been extensive meltdowns of network protectors. Because the network transformer remains energized from the primary side, extensive damage occurs to the network protector that has the arcing fault. This phenomenon, along with enhanced protection schemes for protecting against faults in the unprotected zone in 480-volt network protectors is discussed in 480-Volt Spot Network Protection.
Figure 18 shows the effect of a sustained arcing fault in a 480-volt type CM-22 network protector in a spot network. The relays for the primary feeder breaker don’t detect such faults, and the arcing persists until the protector is manually de-energized, or until it burns clear, which is very unlikely. The extent of the damage caused by such faults is clear from the picture. The protector is like a mini “arc furnace”.

Figure 18: Remains of a 480-volt throat mounted network protector
following arcing fault in unprotected zone (courtesy Westinghouse).
Spot Network Equipment Arrangements
Spot network systems are used to serve large loads requiring reliable service. The World Trade Center Twin-Towers that were destroyed on 9/11/2001 were supplied from multiple four-unit spot networks located on the mechanical equipment floors of each tower, as depicted in Figure 19.

Figure 19: Spot network service to the twin towers of the World
World Trade Center (courtesy Power Engineering Magazine).
The One World Trade Center Freedom Tower, shown in Figure 20, built to replace the twin towers, also is supplied from multiple spot networks located on different levels throughout the tower. The spot network systems within the tower are owned and operated by the Port Authority of New York and New Jersey.

Figure 20: One World Trade Center Freedom Tower (photo by author).
Shown in Figure 21 is the PNC Park in Pittsburgh, PA, which is home for the Pittsburgh Pirates baseball team. This facility is served from five two-unit spot networks supplied from 23, kV primary feeders. Four of the spot networks are in walk-in vaults, and the fifth is in a below grade vault.

Figure 21: PNC Baseball Park in Pittsburgh supplied from multiple
two-unit spot networks (photo by author)
The example system of Figure 1 includes a two-unit spot network. Many different arrangements are used by utilities for the equipment that makes up the spot network. This section presents an overview of some common arrangements found in utility installations, where there are three or four network units in the spot network.
Arrangement 1
Figure 22 shows an arrangement where all network units and the paralleling bus are within the same vault, with no barriers or walls between network units. Each network unit consists of the HV disconnect and grounding switch, the network transformer, and the throat mounted network protector.

Figure 22: Spot network arrangement 1.
The paralleling bus can be made with insulated moles, large diameter cables, commercially available low-voltage bus duct, or may be fabricated from rigid bus bars that are either insulated or bare. The connections from the network protectors to the paralleling bus frequently are made with insulated cables, either phase grouped or phase isolated. Figure 4 shows a spot network with this equipment arrangement. The services to the customer may be made with insulated cable as in Figure 4, customized bus, or a combination of the two. Depending on construction, this configuration may be suitable for submersible operation. Figure 23 is another example of arrangement 1, where insulated moles are used to parallel the network protectors and supply the service cables.

Figure 23:
Three-unit spot network with arrangement 1 (photo by
author)
Arrangement 2
The arrangement in Figure 24 is similar to arrangement 1 in Figure 22, except that the paralleling of the network protectors is accomplished with cable connections between the protector terminals and the two bus ducts from the service switchgear that are stubbed into the network vault. There are also cable connections between the bus duct stabs in the vault to complete the paralleling. This arrangement usually is not suitable for submersible applications because of the use of low-voltage (LV) metal-enclosed bus duct.

Figure 24:
Spot network arrangement 2.
Shown in Figure 25 is a portion of an installation with arrangement 2, where there are three service bus stabs that are interconnected with insulated cables, and there are, not seen in the picture, three network transformers and protectors, with LV cables in trays to the bus stabs.

Figure 25:
Three-unit spot network with arrangement 2 (photo by
author)
Figure 26 is another example of a spot network with equipment arrangement 2, where insulated low-voltage cables are used to make the parallel connection and to the services. With this arrangement, due to the voltage drop from flows in the cables interconnecting the bus stabs, the same voltage is not applied to the network side terminals of all network protectors in the spot network

Figure 26:
Spot network with equipment arrangement 2 (courtesy
Westinghouse).
Arrangement 3
In the arrangement of Figure 27, two of the network units are in one vault, and two are in an adjacent vault, with the paralleling bus running between the two vaults. One or more services are taken from each vault. The connections from each network protector to the paralleling bus can be made with insulated phase-isolated cable, or with bus. Usually the paralleling bus is close to and above the network protectors, and the connections from the protectors to the bus are phase isolated in air, without cable limiters at either end.
Bus-tie fuse are installed in the paralleling bus, with the intent that if a high-current fault occurs on the bus in one vault, service can be maintained to loads supplied from the paralleling bus in the unfaulted vault. The bus-tie fuses in this arrangement should be selected such that for backfeed to a fault on a primary feeder where the backfeeding protector fails to open, the backfeeding protector fuse should selectively coordinate with the bus-tie fuse so that only fuses in the backfeeding protector blow. Also, for faults on the paralleling bus in one vault, the bus-tie fuse seeing the current contribution from two network transformers must selectively coordinate with the protector fuses supplying the unfaulted bus section so that only the bus-tie fuses blow.

Figure 27: Spot network arrangement 3
Figure 28 shows the bus-tie fuses in a spot network with equipment arrangement 3. Note that two of the fuses are type KRJ fuses, and the third is type KRPC, suggesting that perhaps there was a fault that blew one of the KRJ fuses.

Figure 28: Bus tie fuses in spot with arrangement 3 (photo by
author).
Arrangement 4
Arrangement 4 shown in Figure 29 departs from arrangements 1, 2, and 3 in that each network unit is in a separate vault, and the paralleling bus is in a separate vault, manhole, or bus hole (bus compartment). With this arrangement frequently the connections between the network protector terminals and the bus are made with insulated cables, with cable limiters installed at both ends of each cable.

Figure 29: Spot network arrangement 4.
The benefit of having each network unit in a separate vault is that if there is a transformer or HV switch failure that results in an oil or liquid fire, only one primary feeder would be affected. But with arrangements 1, 2, and 3, an oil fire in a vault could result in faults on more than one primary feeder cable, and the creation of a double or triple contingency condition.
Figure 30 shows a portion of a bus hole for a 480-volt installation, where the paralleling bus is made from large insulated cables. For the cable bus, in effect it is double insulated from ground due to the insulation on the cable and the porcelain insulators for securing the cable to the structure. Note that the bus phases are staggered so that cable connections can be easily made. Also observe the use of silver-sand cable limiters suitable for installation in 480-volt systems. Conventional copper cable limiters can’t be used at 480-volts as upon melting they can’t interrupt the fault current at the higher recovery voltages in the 480-volt system.

Figure 30: Bus hole for system arrangement 4 (photo by author).
Arrangement 5
In this arrangement, as shown in Figure 31 each network unit is in a separate vault, with the paralleling made in the service equipment. The connections from the protectors to the service equipment are made with insulated cable, with cable limiters installed on both ends of each insulated cable. Of course, limiters are not installed in the neutral cables. As depicted in Figure 31, the cable connections are made in a bus compartment or metering compartment ahead of the main breaker or main switch and fuse for the service entrance switchgear.

Figure 31: Spot network arrangement 5
Figure 32 is a picture of the cable connections made in the service equipment of a system with equipment arrangement 5. Notice that the cables are relatively new. This particular installation had experienced a cable fire due to the use of reduced size neutrals between the network transformer X0 bushings and service equipment. The conditions responsible for this, and measures to minimize the chance of occurrence are discussed in detail in Backfeed Currents For Primary Feeder Faults.

Figure 32: Cable connections in service equipment for arrangement 5
(photo by author).
Arrangement 6
The arrangement shown in Figure 33 is that used by a large metropolitan utility for 480-volt isolated spot networks, with up to five network unit feeding the paralleling bus. Each network transformer is in its own vault, and may or may not be submersible. If the network transformers are under the sidewalk, submersible network transformers are used, but if located on the upper floors of a building dry-type network transformers can be used. The connections from the LV terminals of the network transformer to the network protectors are made with insulated cables with cable limiters at both ends. If the length of the 480-volt circuit from the transformer LV terminals to the protector is less than 50 feet, phase isolated construction is used. Phase isolated construction reduces the likelihood of a fault in the tie circuit between the transformer and network protector. Secondary Grid Design Considerations compares the characteristics and impedances of phase isolated and phase grouped low-voltage cable circuits.

Figure 33: Spot network arrangement 6.
Figure 34 shows one submersible network transformer in a vault located below the sidewalk. Visible are the primary cables entering the top of the network transformer, the operating handle for the high-voltage two-position grounding switch, for applying a three-phase ground to the primary feeder.
Figure 35 shows a portion of the phase isolated cable circuit in the transformer vault that connects the LV terminals of the network transformer to the network protector. For this installation, there are six 750 kcmil copper cables per phase.

Figure 34: Network transformer for arrangement 6 (photo by author).

Figure 35: Portion of the phase isolated circuit in the transformer
vault between the transformer and network protector (photo by author).
The paralleling bus depicted in Figure 33 is physically located above the network protectors, each of which is in its own protector compartment. Figure 36 shows a frame-mounted network protector in the protector compartment, and the connections to the overhead insulated paralleling bus. For these installations the utility installs large silver-sand fuses between the network protector network terminals and the paralleling bus, as seen in Figure 36. The phase isolated cables from the LV terminals of the network transformer are connected to the bottom of the network protector, out of site in the picture in Figure 36.
Just visible in the upper right-hand corner of Figure 36 are the current-limiting fuses for one of the service take-offs shown in the schematic in Figure 33. The phases of the paralleling bus, made from integral web aluminum bus, are insulated and are located on 15-inch centers, giving a very reliable design that is intended to have a minimum chance of faulting. This bus design has been referred to as the “ivory soap bus”, being 99.9% fault free.
This system has been made with submersible 5000 ampere network protectors, which were recently develop by Richards Manufacturing for this utility. Figure 37 is a picture of a 5000 ampere 480-volt submersible network protector in a system with equipment arrangement 6. The silver-sand network protector fuses, are mounted outside of the protector. Generally, current-limiting fuses create significant heat and can’t be located inside submersible network protector enclosures.

Figure 36: Non submersible network protector in protector
compartment for arrangement 6 (photo by author).

Figure 37: Submersible 5000 Ampere network protector for 480-volt
spot network (courtesy of Consolidated Edison).
Arrangement 7
Figure 38 shows an equipment arrangement that is similar to that in Figure 29, except that each network transformer and protector are not in a separate vault, but in a vault with some barriers between the network units. Each network protector is mounted on the end of the network transformer that is in the opposite direction of the bus compartment. The low-voltage cable from the network protector to the bus compartment run in cable trays above the network transformer as shown in Figure 39. The three-position disconnect and grounding switch on the opposite end of the network transformer is not visible in this picture. Note that for this installation the neutral cables connected to the network transformer X0 bushing have a smaller cross- sectional area than that of the phase cables attached to the network protector terminals. Under backfeed to a double line-to-ground (DLG) fault on the primary feeder, with the protector failing to open, the reduced size neutrals may experience overheating.
From Figure 38, each service, made with multiple sets of cables, is supplied from the paralleling bus in the bus compartment through high-capacity current-limiting fuses. These fuses provide a means for disconnecting each service from the paralleling bus after the service switch or breaker is opened. Figure 40 is view of this bus compartment under construction, showing the location for the installation of the current-limiting fuses. For these fuses, there are inter-phase barriers, but not all have been installed at all locations in this picture.
There are many other configurations used by utilities for spot networks, and all of those are not included in this section.

Figure 38: Spot network arrangement 7.

Figure 39: Network transformer and protector for arrangement 7
(photo by author).

Figure 40: View of bus compartment for arrangement 7 (photo by
author).
Network Substations
From the discussions in the preceding sections of this chapter, it is seen that the network system from the substation medium-voltage bus to any load consists of parallel paths from the substation to loads served from the grid network and loads supplied from spot networks. This redundancy is responsible for the high levels of reliability provided by the secondary network system.
Figure 41 is taken from a paper prepared by Con Edison of New York showing the number of customer interruptions per 1000 customers for 2001, for the different types of power distribution systems, including the Con Edison LV secondary network systems. From this it is clear that reliability provided by the secondary network is orders of magnitude better than that provided by other types of power distribution systems.
The area or distribution substation supplying the feeders for the secondary network system must also be designed to handle either single or double contingency conditions such that faults in the substation do not result in an outage to the secondary network system. Network Substation Design presents substation design issues, and gives examples of different bus arrangements that are used. Figure 42 is an example of a substation that supplies three six-feeder secondary network systems at 11.5 kV, and uses resistance grounding.

Figure 41: Number of customer interruptions per 1000 customers for
2001.

Figure 42: Substation for supply to three six-feeder secondary
networks.
Important points to be noted for the substation in Figure 42, that should also be considered in evaluating any substation design for service to secondary networks are listed below.
-
There are three transmission lines supplying the HV side of the substation. Loss of any one creates only a single contingency. The station should be designed to carry the peak load with any one transmission cable out-of- service.
-
There are three 69 to 11.5 kV main power transformers in the substation. Normally such a station would be designed such that the peak load can be supplied with the loss of any one main power transformer.
-
Resistance grounding, with a 3 Ohm resistor applied with each substation transformer, is used for the 11.5 kV system that supplies the network primary feeders. Primary System Grounding discusses the advantages of using resistance or reactance grounding for the medium-voltage (MV) system that supplies the secondary network system, applicable when all network transformers have the delta connected primary windings.
-
The same voltage is applied to all 11.5 kV primary feeders of each six-feeder network supplied by the substation. This gives the best load division and stable operation of network protectors, where the probability of network protectors cycling or pumping is minimized.
-
Each feeder for a given six-feeder network originates from a different 11.5 kV bus section. Thus, a fault on an 11.5 kV bus section causes only a single contingency to each of the three secondary networks supplied from the substation.
-
Should a fault occur on any 11.5 kV bus section in Figure 42, following its isolation the same voltage is applied to the remaining five feeders which supply each secondary network. Thus, isolating a bus fault in the substation should not result in network protector cycling of pumping.
-
Should a fault occur in any 11.5 kV circuit breaker, isolation of the fault creates only a single contingency for each network, and the same voltage is applied to the five feeders of the network following isolation of the faulted circuit breaker.
4.2 - General Design Considerations
GENERAL DESIGN CONSIDERATIONS
Low-voltage networks are designed, as a minimum, to withstand the outage of any one primary feeder during the peak loading period. Throughout the outage of any one primary feeder, the loads normally carried by the network transformers on the feeder are picked up by the network transformers on the in-service network feeders, without exceeding the single contingency rating of the feeders and the network transformers. Similarly, the low-voltage secondary mains are designed to handle the loading under the loss of any one primary feeder. This design is referred to as single contingency design, or an N-1 design. Some systems designed for an N-1 condition may be able to withstand a double contingency (two primary feeders out-of-service) at time of light load, or at certain times in the year. Many LV network systems are designed to operate with any two primary feeders out-of-service.
The single contingency design criteria should also apply for major components in the substation supplying the low-voltage network. For example, the loss of any one main power transformer or loss of a transmission supply to the station should not cause dropping of the network. Some utilities design their substations for an N-2 condition, where the peak load of the network can be carried with any two main power transformers out-of-service.
Supply Substations
Substation Dedication
The substation supplying the network may be dedicated to serving just secondary networks. In this case, the feeders emanating from the medium voltage buses in the substation are for supplying just the primary feeders of secondary networks. Some utilities in large metropolitan area have substations that supply only network primary feeders. Considering system grounding, fault current levels, overcurrent protection, and operation of the network, it is preferable to have substations that are dedicated to supplying just the secondary network. But in many systems, this luxury is not possible.
In many systems the substation must supply the primary feeders of the secondary network, and other distribution primary feeders, or distribution supply lines that supply unit substations for stepping down to lower-voltage primary feeders, such as from 13.2 kV down to 4.16 kV or 4800-volt delta. When the medium-voltage buses in the substation supply both network primary feeders and non-network multi-grounded neutral distribution feeders, the medium-voltage system must be effectively grounded. Resistance grounding can’t be used. Primary system grounding is discussed in great detail in Primary System Grounding.
Number of Substations
Network Substation Design presents different configurations for substations that are used to supply secondary networks. Most networks are supplied from a single substation, having multiple main power transformers and multiple transmission or sub-transmission feeds to the substation. With a single substation, where the primary feeders originate on medium-voltage buses, the medium-voltage bus-tie breakers can be either open or closed. A given network can also be supplied from two or more substations, or from the same substation with open bus-tie breakers. With a single substation operating with open bus-tie breakers, or if the network is supplied from different substations, the voltages applied to the network primary feeders can be considerably different.
Impact on Load Division In Networks
When supplied from one substation with closed medium-voltage bus tie breakers, the same voltage is applied to each primary feeder of the network. The load division in network transformers in spot networks and in multi-bank installations that feed the grid network usually is well balanced, and network protector cycling or pumping is not expected. Cycling and pumping is discussed in Network Protector Relaying, and network relay settings to prevent pumping are described.
If the MV bus-tie circuit breakers in the substation are open, or if the primary feeders come from different substations, voltage magnitude and angle differences will exist on the network feeders at the substation. Network protector cycling, pumping, or failing to close is quite likely.
Impact During Primary Feeder Faults
When the primary feeders emanate from the same substation with closed medium-voltage bus-tie breakers, and a fault occurs on any one primary feeder, the only network protectors to open are those on the faulted primary feeder. Before the feeder breaker opens, the power flow in the protectors on the faulted primary feeder can be either into or out of the network as shown in Figure 1. But in protectors on the unfaulted feeders, the power flow will be into the network as shown, the network protector relay sensitive trip characteristics will not be satisfied, and network protectors on the unfaulted primary feeders will not trip. With the feeder breaker closed, the sensitive trip characteristic of network relays in protectors on the faulted feeder, feeder 4 in Figure 1 may or may not be satisfied. But after the feeder breaker opens, the network relays sensitive trip characteristics are satisfied, and all network protectors on the faulted feeder open.

Figure 1:
Single substation supply to network.
With a bolted three-phase fault on feeder 4 near the substation as in Figure 1, with the feeder breaker closed the voltage on the substation bus is pulled down to near zero volts until the circuit breaker for the faulted feeder opens. This also lowers the voltage in the LV network on all three phases to near zero volts. After the breaker for the faulted feeder opens, and with all backfeeding protectors on the faulted feeder still closed, the voltages in the LV network will rise up to a value that is less than nominal, the exact level determined by the system topology, impedances, and fault type. With microprocessor relays in the network protectors on the faulted feeder, the relay must be able to function during the voltage drop to near zero from the three-phase fault, and the rise up to less than nominal. In contrast, with the SLG fault on the feeder at the substation, the voltage on the faulted primary phase drops to near zero volts. But in the LV secondary network with the circuit breaker for the faulted feeder still closed, the voltages on all three phases drop, but not to the level where the microprocessor relay power supply will not function. Primary System Grounding quantifies the voltages that appear in the secondary network for the SLG fault on the primary feeder with the faulted feeder breaker still closed, and the effect of the grounding of the medium-voltage system on the voltages in the LV network.
If the primary feeders to the network come from different substations as shown in Figure 2, or from the same substation with open bus- tie breakers, a three-phase fault on a primary feeder close to the substation may result in the tripping of not only network protectors on the faulted feeder, but the tripping of network protectors on unfaulted primary feeders. How this happens can be seen from Figures 2 and 3.

Figure 2:
Network supplied from two different substations with
three-phase feeder fault.
In Figure 2, a bolted three-phase fault is on feeder 4 at Substation 2 with the feeder breaker closed. Electrically, until the circuit breaker for the faulted feeder opens, it looks like there is a three-phase fault on both primary feeders 3 and 4 fed from Substation 2, as the fault pulls Substation 2 bus voltage down to near zero. Consequently, as shown in Figure 2, there is a reverse power flow in all protectors on feeder 3 and feeder 4 prior to opening of the breaker for faulted feeder 4.
Whether the network protectors on unfaulted primary feeder 3 supplied from Substation 2 trip for the bolted three-phase fault on feeder 4 depends upon the network relay sensitive trip time relative to the clearing time for the breaker for faulted feeder 4. On one microprocessor network protector relay, the sensitive trip time is fixed at three (3) cycles, and it can initiate opening of protectors on feeder 3 before the faulted feeder breaker opens. This occurred in one system when a three-phase ground was inadvertently applied to the primary feeder. In another microprocessor relay the sensitive trip time is adjustable with a default setting of six (6) cycles. With this trip time and high-speed feeder breakers with instantaneous current relays, the breaker for the faulted feeder can open before the network relays in protectors on the unfaulted primary feeders make their trip contact. In Figure 3, it is assumed protectors on both feeders 3 and 4 trip before the breaker for faulted feeder 4 opens.

figure 3:
Faulted feeder breaker closed with network protectors on
feeders 3 and 4 open.
Assuming that the network protectors on both unfaulted feeder 3 and faulted feeder 4 open, after the breaker for faulted feeder 4 opens as shown in Figure 4, the voltage on the medium voltage bus at Substation 2 returns to near normal. With Substation buss 2 voltage at normal value, a phasing voltage, designated VP, appears at the open protectors on feeder 3. Depending on loading on the network, the network relay close characteristics in the protectors on feeder 3 may be satisfied, and the protectors will auto close.
For the configuration and fault condition of Figure 2, the slower trip time for the microprocessor relay may be preferred so that protectors on unfaulted primary feeders do not trip. However, when the primary feeders for the network come from the same electrical bus in the substation as in Figure 1, the faster tripping time is preferred as it limits the duration of the backfeed current to the fault on the primary feeder, and energy input to the fault path. Further the faster trip time limits the duration of the voltage dip in the network for the three-phase fault close to the substation.

figure 4:
Faulted feeder breaker open with protectors on feeders 3 and 4 open.
One advantage of feeding the LV network from two different substations as in Figure 2 or from a substation with open bus tie breakers is that a bolted three-phase fault on a primary feeder close to the substation does not pull the network voltage down to zero. With the system balanced between the two substations, the voltage in the LV network would not drop much below 50 percent in the interval between fault inception and the opening of the breaker for the faulted feeder. In comparison, when supplied from one substation with closed medium-voltage bus-tie breakers, the voltage in the network for the three-phase fault drops to near zero until the breaker for the faulted feeder opens. However, when a network is supplied from different substations or from the same substation with open bus-tie breakers, there can be serious problems with network protectors cycling, pumping, or failing to automatically close.
Contingency Design Practice
When there is just one substation supplying the LV network, the supply substation may be designed for either a single contingency or a double contingency at time of peak load. Single-contingency design allows for loss of any one main power transformer, or loss of any one transmission or sub-transmission feed to the substation. Substations designed for the single contingency may be able to supply the load with loss of two main power transformers if provisions have been made that allow rapid reconnection of a mobile transformer. Single contingency design also implies that if a fault occurs on any medium-voltage bus section in the substation, the network primary feeders remaining in service can carry the peak load of the system without exceeding emergency ratings. If the LV network is designed to operate with just one primary feeder out of service, then a medium-voltage bus fault should not remove more than one primary feeder.
In one major metropolitan area, the substations supplying the networks are designed for a double contingency, where the peak load can be supplied with any two power transformers, or any two transmission lines out of service. The transformers remaining in service can carry the peak load with an acceptable loss of life for the time required to replace one transformer. Network Substation Design shows different substation configurations used to supply secondary networks, including the configuration designed for operation with two main power transformers out-of-service.
One concern with having a single substation supplying one or more networks is the loss of the entire substation due to a major catastrophe or terrorist attack. Having two substations reduces the chance of dropping the network from such an event, but the entire network must operate from just one substation. This requires excess reserve capacity in the network transformers, the primary feeders, and in the secondary grid.
There have been small network systems designed that can be supplied from two different substations, such that if the preferred substation is lost, the primary feeders can be supplied from a second substation. Figure 5 shows one four feeder system, supplying just spot networks, that can be supplied from one of two substations. The four network primary feeders are normally supplied from the North Substation, but the feeders run through to the South Substation where the four feeder breakers are normally open.

figure 5:
Small four-feeder network capable of supply from two
substations
If the 12.47 kV bus at the North Substation needs to be de-energized for work, the breakers for the four feeders at the South Street Substation can be closed, of course assuming the circulating flow between the North Street and South Street substations in the primary feeders is low enough to allow the temporary paralleling. Then the feeder breakers at the North Street Substation can be opened to de-energize the 12.47 kV bus at North Street.
It can’t be over-emphasized that one drawback to feeding a network from two different substations, or from a substation with open bus-tie breakers is that it can cause, due to differences in voltage magnitude and angle, network protectors to cycle, pump, or fail to auto close.
Tie Breaker Position
When networks are supplied from the same substation, but with open tie breakers in the medium-voltage buses as in Figure 2 From Network Substation Design, there can be voltage magnitude and voltage angle difference between the medium-voltage buses that supply the network primary feeders. This phenomenon occurs because of unequal loading on the substation transformers that supply the buses with the network primary feeders, which produce unequal voltage drops in the substation transformers. Although load tap changers or individual voltage regulators may be able to compensate for voltage magnitude differences, they have minimal effect on the phase angle difference between substation medium-voltage buses. This situation sometimes is encountered in substations that supply both network feeders and radial multi-grounded neutral distribution feeders from the medium-voltage buses. The tie-breakers are operated normally open to limit short-circuit currents on radial non-network feeders.
Voltage magnitude difference between the substation buses that supply a LV network circulates primarily vars through the network. With most network protector relays, the circulation of vars will not cause the protector to trip. Voltage angle difference between substation buses circulates primarily watts through the low-voltage network. As network relays are more sensitive to watt flow than reactive flow, it is the angle difference that can interfere with or prevent proper operation of the LV secondary network.
Figure 6 shows two substation transformers paralleled on the HV side but with an open tie breaker on the MV side. If each substation transformer has the same impedance magnitude and angle, then the magnitude difference and angular difference of the voltage on the two medium-voltage buses is due to different loadings on the transformers. Whether the angular difference has a negative impact on network operation depends primarily on the magnitude of the angle difference and the loading on the network supplied from the substation. The system may function acceptably under heavy load conditions, with there being no pumping or cycling of the network protectors. But at light load on the network, and in particular with spot networks, small phase angle differences at the substation may cause protectors to sit open, cycle, or possibly pump, as experienced in practice. Network Protector Relaying defines the conditions which cause pumping, and identify network protector relay settings that can be made to prevent pumping.

Figure 6: Simplified substation with open bus-tie breaker on MV
side.
The effect of unequal loading of the substation transformers on voltage magnitude and angle between the medium-voltage buses in the substations is discussed and quantified in Network Substation Design.
Network Primary Feeder Voltage Levels
Standard Voltage Levels
The nominal voltage levels for the primary feeders of secondary network systems are between 2400 volts and 34.5 kV. Voltage levels for the primary feeders of many early network systems were less than 5 kV. However, as load densities increased in the areas supplied by secondary networks, and/or if the substation sites were located far from the network area boundary, higher primary voltage levels were adopted.
ANSI C84-1 lists the more common nominal voltages for electric power systems. Table 1 is a summary of data for medium-voltage systems found in the ANSI standard.
Table 1:
Primary Feeder Nominal Voltages for Medium Voltage Systems
VOLTAGE CLASS |
NOMINAL SYSTEM VOLTAGE | |
|---|---|---|
| THREE-WIRE | FOUR WIRE | |
| Medium | 2400 | |
| Medium | 4160Y/2400 | |
| Medium | 4160 | |
| Medium | 4800 | |
| Medium | 6900 | |
| Medium | 8320Y/4800 | |
| Medium | 12000Y/6930 | |
| Medium | 12470Y/7200 | |
| Medium | 13200Y/7620 | |
| Medium | 13800Y/7970 | |
| Medium | 13800 | |
| Medium | 20780Y/12000 | |
| Medium | 22860Y/13200 | |
| Medium | 23000 | |
| Medium | 24940Y/14400 | |
| Medium | 34500Y/19920 | |
| Medium | 34500 |
Notes
-
Nominal system voltages in boldface are the preferred nominal system voltages for new systems.
-
The 4160-volt, 6900-volt, and 13800-volt three-wire systems are particularly suited for industrial systems that supply predominantly polyphase loads, including large motors, because these voltages correspond to the standard motor ratings of 4000 volts, 6600 volts, and 13200 volts.
Voltages selected for distribution primary feeders, both network and non-network, are in the medium-voltage (MV) class, the other classes being low voltage, high voltage, and extra high voltage.
Many of the nominal system voltages in Table 1 are selected for the primary feeders of secondary network systems.
The most recent data on voltage levels for network primary feeders is old, appearing in the 1959-1961 Edison Electric Institute (EEI) A-C Network Operations Report. These are the last years for which voltage and operating data for secondary networks were reported by the EEI. Data on the voltage levels for network primary feeders are summarized in Table 2. The EEI report identifies other nominal voltages used for network primary feeders, not given in Table 1, such as 11.0 kV, 11.5 kV, 14.4 kV, 26.4 kV, 27 kV, 33 kV, and a few others.
Table 2:
Network Primary Feeder Voltage Levels
Primary ϕ-ϕ Voltage (kV) |
Peak Load on Network | Companies in Survey | ||
|---|---|---|---|---|
| MVA | % of Total | Number | % of Total | |
| 2-5 | 675 | 8.2 | 30 | 56.7 |
| 5-10 | 0 | 0 | 0 | 0 |
| 10-15 | 5978 | 72.5 | 46 | 86.8 |
| Over 15 | 1593 | 19.3 | 10 | 18.9 |
| Total | 8246 | 100 | 53a | - |
-
-
One company did not report peak
-
Companies with one voltage class: 27
-
Companies with two voltage classes: 19
-
Companies with three voltage classes: 7
-
- Source: EEI A-C Network Operations Report, 1959-1961
The Consolidated Edison Company of New York investigated in the 1950’s installing a spot network system with primary feeders utilizing gas insulated cables operating at 69 kV. However, analog computer studies showed that due to the high cable charging kVAr of the 69-kV cables relative to the kVA size of the network transformers in the spot network, excessive overvoltage would occur in the secondary network during backfeed, both balanced and to a single line-t0-ground (SLG) fault on the feeder with the 69 kV feeder breaker open. Thus, the use of 69 kV for network primary feeders was abandoned. The overvoltages that occur in the secondary network during backfeed from excessive cable charging kVAr are discussed in Network Overvoltages During Backfeed, along with measures that prevent the overvoltages.
The usage pattern illustrated with the data in Table 2 is still applicable today, with the majority of secondary networks supplied from primary feeders with nominal voltages in the 10 to 15 kV range. However, it is obvious that peak load supplied today from secondary networks in large metropolitan areas are much greater than indicated by the EEI survey data of Table 2, where the total peak load of all of the surveyed utilities was 8,246 MVA. This is not only because of load growth in many network service areas, but also because the survey did not include some large municipal utilities, such as Seattle City Light, that operates large secondary network systems.
To put the numbers in Table 2 in perspective, the largest operator of secondary network systems, the Consolidated Edison Company of New York, indicates that the peak load supplied from its electric systems in 2006 was 13,141 MW, of which roughly 86% or 11,300 MW is supplied from secondary networks, either grid or isolated spot networks. This amount is greater than the peak network load in 1960 of all utilities in the EEI survey, which also includes Consolidated Edison.
Reasons for Higher Primary Voltages
The maximum size network (including the grid network and spot networks within the network area) that can be supplied at any given voltage level is determined mainly by the number of primary feeders to the network, the ampere rating of the primary feeders, and the load balance between primary feeders during normal operating conditions and under contingency conditions. The normal and emergency ratings assigned to a primary feeder circuit at the substation are determined by many factors, including conductor material (copper or aluminum), conductor size, cable insulation (paper, polyethylene, EPR, etc.), number of circuits in the duct bank including low-voltage circuits, earth ambient temperature, thermal resistivity of the earth surrounding the duct bank, earth moisture level, duct bank material, other nearby heat sources such as steam lines, the depth of burial below the surface, and the circuit loss factor (ratio of average power losses to peak power losses). Detailed discussion of the determination of cable and feeder ratings is beyond the scope of this chapter, but the reader should avail themselves of computer software for cable rating, available from several vendors.
Using a normal rating of 350 amperes for the primary circuits of the network, the effect of nominal voltage level on circuit MVA rating is seen from Table 3.
Table 3:
Primary Feeder Normal Ratings Based on 350 Amperes Peak Load
Nominal ϕ-ϕ Voltage (kV); |
4.16 | 13.8 | 23 | 27 | 33 | 34.5 |
|---|---|---|---|---|---|---|
Normal Rating (MVA) |
2.5 | 8.4 | 13.9 | 16.4 | 20.0 | 20.9 |
| Six Feeder Nwk Peak Load (MVA) | 15.1 | 50.2 | 83.7 | 98.2 | 120.0 | 125.5 |
The first row of Table 3 lists the nominal voltage, and the second row lists the circuit rating in MVA based on 350 amperes normal peak current. The last row lists the maximum load that could be supplied from a six-feeder network, assuming that all feeders are in service, the total load divides equally between the in-service feeders, and a single contingency overload of 120% is acceptable. Evident from the data in Table 3 is that in large metropolitan areas with high load densities and tall buildings, voltages above 5 kV are required so that the number of primary feeders is held to a minimum.
The basis for the values in Table 3 follows, using the data for a 13.8 kV circuit. The normal circuit rating in MVA is 13.8*√3*350/1000 or 8.4 MVA. Under a single contingency with just five feeders in service, and assuming a load current of 120% of the normal rating of 350 amperes, the load which can be supplied from the network is 13.8*√3*(350/1000)*1.2*5 or 50.2 MVA. In these calculations, it is assumed that under single contingency, the load divides equally between the five in-service network primary feeders.
Figure 7 depicts an area to be supplied from a secondary network system or systems. Regardless of the primary voltage level, the number of network transformers and protectors, and the size of the individual transformers and protectors installed to supply the load practically are independent of the primary voltage level. However, for the grid network there is the option of using a larger number of smaller network units, typically 500 kVA, closely spaced, or larger units, 750 kVA or 1000 kVA, spaced further apart. In most systems transformers of different sizes are selected based on the size and location of the loads to be served.
The cost of network transformers with HV ratings of 15 kV and below does not vary much with primary voltage. One manufacturer’s price list shows the costs are the same, but do vary with transformer size, with the dollars per kVA decreasing with increasing transformer size. Assuming that the transformers and their size are selected based on the loads to be supplied from the grid network, the cost of the primary feeders, including mains and branches, has a major impact on the overall cost of the secondary network system.

figure 7:
Area supplied by either three networks with 4.16 kV
primary feeders, or one network with 13.8 kV primary feeders.
For the hypothetical configuration of Figure 7, the load area could be served from three grid networks supplied at 4.16 kV, each having 16 750 kVA network transformers. Assuming that each 4.16 kV feeder has a nominal rating of 2.5 MVA, a total of 15 or 16 4.16 kV feeders are needed to supply the three independent networks at 4.16 kV. In contrast, with the 13.2 kV voltage for the primary feeder, with each feeder rated 8 MVA, the load area could be served with 5 or six primary feeders. A smaller number of feeders at the 13.2 kV voltage level results in a lower feeder cost in most situations. It also requires fewer circuit breakers in the substation, and fewer ducts for primary feeder station exits, and main feeders.
The advantage of the higher primary voltage is that significantly more load can be supplied than with lower primary voltage with the same number of circuits installed in a duct bank, assuming that the higher voltage and lower voltage circuits use cables with the same size phase conductors, and the duct size will accommodate the higher voltage cables. Roughly, when the circuit voltage is increased from 4.16 kV to 13.2 kV, with the same size phase conductor, three times as much load can be supplied with a given number of ducts within the duct bank at the higher voltage. Viewed differently with a given number of ducts for the primary feeders, larger loads can be supplied from the network with the higher primary voltage.
Selecting primary voltages above 5 kV frequently results in lower overall costs. Sometimes voltages above 15 kV provide a lower cost system, as evidenced by use of systems in large metropolitan areas operating at 19.9 kV, 23 kV, 27 kV, 33 kV, and 34.5 kV. At system primary voltages of 5 kV and below, the number of ducts required to supply the network is excessive, and there can be voltage drop problems, especially if the substation supplying is remote from the network area. Furthermore, the load division in isolated spot networks and in multi-bank installations for the grid network, will be better at the higher primary voltages.
Voltage Drop in Express Portion of Primary Feeder
When the network area is remote from the substation that supplies the network, primary voltages of 5 kV or lower may not be technically feasible due to the voltage drop in the express portion of the primary feeders. A classic case is Pittsburgh, Pennsylvania (Hoover and Berckmiller 1986), where one substation that supplies the commercial area secondary networks is approximately three miles from the boundary of the commercial area.
Figure 8 illustrates four network areas supplied from a remote substation, where all network areas are on the same side of the substation. The express portion of the primary feeder is the part from the substation to the boundary of the network area, with no network transformers connected to the express portion. In the express portion the load current is constant, although there is a slight change in phase current due to capacitive charging current. The voltage at the end of the express circuit in volts is given by eq (1).
(1) $$ \ \ \ V_{R} = V_{S} - IR cos\theta - IX sin\theta + j[IR sin\theta - IX cos\theta] $$
The magnitude of the voltage at the end of the express portion is given by eq (2), and the voltage drop in % is given by eq (3).
(2) $$ \ \ \ |V_{R}| = \sqrt[]{|V^2_{S}| + I^2 R^2 + I^2 X^2 - 2 |V_{S} | I (R cos\theta + Xsin\theta )|} $$
(3) $$ \ \ \ V_{D} = 100 \frac{| V_{S} | - | V_{R} |}{| V_{S} |} % $$
In these equations, the terms are defined as follows.
|VS| = Magnitude of ϕ to neutral voltage at substation
I = Magnitude of line current in amperes
R= Resistance (positive-sequence) of express circuit from substation to network in Ω
X = Reactance (positive-sequence) of express circuit from substation to network in Ω
θ = angle by which the current lags the voltage VR

figure 8:
Express feeders between remote substation and four LV
networks
With the same size cable for the primary circuit, the circuit ampere rating at different primary voltages will be approximately the same, everything else being equal, because the watts loss at a given phase current in amperes are the same, irrespective of voltage. But the ampere rating of the higher voltage circuit will be somewhat less, because the cable insulation is thicker, thereby reducing the heat transfer from the phase conductor to the ambient surroundings.
By reference to eq (2) and eq (3), it can be seen that at the higher voltage levels, the voltage drop in percent in the express portion of the feeder will be less.
Figure 9 plots with the red colored curves the voltage drop in percent at voltage levels of 4.16 kV, 13.8 kV, and 23 kV for load power factor of 85%. They assume that 500 kcmil copper cable is applied at all voltage levels, and the current
in the express portion is 350 amperes. If the power factor were higher, the percent voltage drop would be less. Given on the figure are the positive-sequence resistance and reactance for the 3/C cables at each voltage level. The red curves show that if 4.16 kV is the primary voltage and the substation supplying the network is remote from the network service territory, excessive voltage drop occurs in the express portion of the feeder. At 4.16 kV and 350 amperes, the peak load per feeder is just 2.5 MVA, whereas at 13.8 and 23 kV the load per feeder is 8.4 MVA and 13.9 MVA.
The blue colored curves in Figure 9 show the angle of the feeder voltage in degrees at the end of the express section as a function of voltage level. At the 4.16 kV level, the angle at the express end is more than 1 degree behind the angle of the voltage at the substation, whereas at the higher voltages it is less than 0.5 degrees.

figure 9:
Voltage drop in the express portion of the network
primary feeder
The voltage drops and angle shift shown in Figure 9 are for primary circuits made with three-conductor PILC cables. With single-conductor cables, the positive-sequence reactance would be somewhat higher, and the voltage drop and angle shifts slightly higher. However, the reactance of cable circuits is much less than that of overhead lines constructed on an 8-foot cross arm. Overhead lines have been used in suburban areas to supply spot networks. For OH lines the positive-sequence reactance is in the range of 0.5 to 0.7 Ohms per mile, depending on phase conductor size, and voltage drop and angle shifts are much higher with overhead lines.
With unequal current loadings on network primary feeders, everything else being equal, and with the feeders coming from the same electrical bus in the substation, load division in spot networks improves with the higher primary voltages and with the use of cables rather than overhead lines.
Impact of Primary Voltage Level on Load Division
Another advantage of higher voltages for the primary feeders is that frequently better load division is achieved in spot networks. The reason for this can be seen from the simple system in Figure 10, where the three primary feeders, supplied from a substation with closed bus-tie breakers, are supplying just spot networks.
Assume that there are two identical systems, except for the primary voltage level. The load in kVA on each feeder is approximately the same at each primary voltage level:
-
The primary feeder load currents in amperes are lower at the higher voltage, although at each voltage level, the load current in feeders X, Y, and Z may be different.
-
The feeder lengths from the substation to spot network 1 are the same at each voltage level, although the length of feeders X, Y, and Z may be different.
-
The same size conductor is used for each feeder at each primary voltage level, although different size conductors may be used for feeder X, Y, and Z.
With these assumptions, for practical purposes the voltage drops in actual volts from the substation to spot network 1 in feeder X is lower at the higher primary voltage. The voltage drop in volts from the substation to spot network 1 in feeder Y is lower at the higher primary voltage level. And, similarly for the voltage drop in feeder Z.
Notably, the voltage drop in percent on the higher voltage circuits is significantly less, and consequently the difference in voltage magnitude in percent at the HV terminals of the network transformers in spot network 1 is less at the higher voltage levels. This means the balance in the reactive flow in the network transformers in spot network 1 will be better at the higher voltage level. Similarly, the difference in the angle of the voltage at the HV terminals of the network transformers in spot network 1 will be less at the higher voltage levels. The effect of this is to give a more equal real power (kW) flow in the network transformers in the spot network.

figure 10:
Network feeders supplying spot networks
With more equal voltages applied to the HV terminals of the network transformers in the spot networks (lower difference in magnitude and angle), load division is better in the higher voltage systems. This practically means that once the network protectors in the spot network are closed, they will stay closed for lighter loads on the spot network, with protector cycling or pumping less likely. Furthermore, with there being less voltage magnitude and angle difference between the primary feeders at the HV terminals of network transformers in spot networks, the loading on the in-service network transformers needed to cause auto reclosing of open network protectors can be better predicted from network transformer impedance, load power factor, and network relay close characteristics and settings. Secondary Grid Design Considerations discusses this in detail.
Primary Feeder Fault Currents
An important consideration in designing substations to supply network primary feeders is the available currents for the three-phase fault, and the single line-to-ground (SLG) fault on the feeders at the substation. If sectionalizing switches are installed in the network primary feeders, their momentary rating and fault close rating may be considerably less than those of the feeder circuit breakers at the substation. Or if the substation is not dedicated to the network and is also supplying radial four-wire multi-grounded neutral (MGN) distribution feeder circuits where the interrupting capacity of devices such as fuses and reclosers is low, it is necessary to limit the fault currents. When the network transformers have the delta connected primary windings, and all other distribution transformers on the non-network feeders have the delta connected primary windings, the current for the SLG fault can be controlled by proper selection of a neutral grounding impedance for the substation transformers. Grounding of the medium voltage system that supplies the network feeders is discussed in detail in Primary System Grouding.
When phase reactors are not installed in the primary feeders at the substation, maximum short circuit currents for feeder faults are the same as those for faults on the medium-voltage buses in the substation. There are no standards or guides suggesting upper limits for fault currents on network primary feeders, yet from industry and other surveys, it is known that utilities make a conscious decision to control the maximum fault current on their primary distribution systems, network or other. Network Substation Design lists factors to consider when establishing fault current limits in substations that supply networks.
Most all utilities have grounding switches on the HV side of their network transformer. When placed in the ground position, they must be rated to carry the maximum available three-phase fault current, for the time required for the feeder breaker at the substation to open should it be inadvertently closed into a three-phase ground.
The following discussion of the effects of fault current level on three physical phenomena illustrate the benefits of limiting fault currents in the primary of network systems.
Arc Energy
When an arc occurs in apparatus in the primary portion of the network system, the potential for the arc to cause a disruptive-type failure is related to the energy input to the arc. In general, the higher the electrical power and energy into the arc, the more likely the energy released by the arc will cause a disruptive failure. Examples are arcs in primary cable splices, causing manhole cover ejections, and arcs in the HV terminal compartment or in the HV switch compartment of network transformer, which have blown off the bolted-on cover plates. A major user of networks has indicated that when a fault occurs in the main thank of a network transformer, the probability of a rupture of the main tank is significantly lower when the available three-phase fault current is 15 kA or less, and the primary feeder breaker at the station trips through instantaneous current relays.
The electric energy into an arc is given by eq (4).
(4) $$ \ \ \ W_{arc} = \int^T _{0} P_{arc} (t)dt = \int^T _{0} e_{arc} (t)dt \enspace Joules $$
Where in eq (4):
Parc(t) = instantaneous arc power in watts
earc(t) = instantaneous arc voltage in volts as a function of time
iarc(t) = instantaneous arc current in amperes as a function of time
T = arc duration in seconds.
For arcs in air, and in oil, the arc voltage is a function primarily of the arc length and the pressure of the medium. But the arc voltage is usually small in comparison to the nominal voltage of the medium-voltage system, so the arc has little effect on the current in the short circuit path in medium-voltage systems. Thus, the arcing current is determined primarily by the system impedances at the fault point, and the open-circuit voltage, and practically the arcing current is just somewhat less the current available for the bolted fault. Consequently, the higher the available fault current, assuming a fixed clearing time, the higher the arc energy, and the more likely that fault may cause a disruptive type failure. This is another reason for limiting fault currents on the primary feeders for the secondary networks.
Secondary Grid Design Considerations discusses another mechanism responsible for disruptive failures, primary manhole cover displacements, which is unrelated to the available fault currents on the primary feeders of the network. This is from arcing faults in low-voltage secondary cables that either do not blow cable limiters or burn clear. The high temperature of the arc causes pyrolysis of the low-voltage cable insulation and certain duct materials, and may cause the cable insulation to burn. Some of the gasses from the pyrolysis are explosive, and when they accumulate in manholes, they can result in powerful explosions if ignited, and manhole cover ejection.
Fault Current Asymmetry
Fault current produces high forces between conductors, between bus bars in the substation, and between the high-voltage and medium-voltage windings of transformers in the substation. The peak forces are proportional to the square of the peak of the instantaneous current wave. The equipment and components of the system must withstand the forces associated with short-circuit currents, including the effects of asymmetry in the fault current wave.
When the rms value of the symmetrical fault current is known, the peak value of the symmetrical current is √2 times the rms value, as seen from the symmetrical sine wave (ac component-blue curve) in Figure 11. However, when the fault occurs, there can be asymmetry in the fault current wave, dependent upon the point on the open-circuited voltage wave at which the fault is initiated (the closing angle). Asymmetry results in the instantaneous peak current being much larger than the instantaneous peak current of the symmetrical current wave. For the asymmetrical current wave, where the circuit X to R ratio is 15, with the fault initiated at the zero point on the voltage wave, the instantaneous peak of the asymmetric current wave is 2.56 times the rms value of the symmetric wave. The peak forces with the asymmetric wave are (2.56/1.414)2 or 3.28 times the peak forces with the symmetric wave. The effect of asymmetry in the fault current wave must be recognized in the design of apparatus applied on the network substation and on the network primary feeders. Recognize that in most systems the asymmetry in the fault current wave is highest for faults at the substation, due to the inherent high X to R ratio of the substation transformers. But as the fault moves out the network primary feeder, the X to R ratio at the fault point decreases, with there being less asymmetry for faults out on the feeder.

figure 11:
Symmetric current wave, and asymmetric current wave with
same steady-state value.
An approximate expression for the peak current in per unit of the rms value of the symmetrical fault current, referred to as the peak current factor (PCF) is given by eq (5).
(5) $$ \ \ \ PCF = \sqrt{2} [1.0 + e \frac{\theta_{z} + \frac{\pi}{2} }{ \frac{ X }{ R } } * \sin{\theta_{Z}}] $$
Where:
X/R = X-to-R ratio of the circuit impedance that limits the fault current.
θZ = tan-1(X/R), θZ must be in radians in eq. (5)
For example, when the X-to-R ratio is 15, as might be typical at or close to the substation, angle θZ is 1.504 radians. Inserting these values into eq (5), the peak current factor is 2.564, as shown by the red colored curve in Figure 11 for the asymmetric current wave. If the system X-to-R ratio were infinite, the peak current factor is maximum at 2*√2, or 2.828. But out on the end of a long network primary feeder, the X-to-R ratio might be 2 or less, as the impedance of the network primary feeder cable accounts for the majority of the total impedance at the fault point, and the peak current factor, PCF, is 1.746 or less.
Regardless, as the available symmetrical fault current increases, the forces on equipment carrying fault current also increases. Installing substation transformers with high impedances, or installing phase reactors between the substation transformer MV terminals and the MV buses for the network feeders, will help to limit the currents for not only the three-phase fault and line-to-line fault, but also for the single line-to-ground (SLG) fault and the double line-to-ground (DLG) fault. Installing neutral reactors or resistors with the substation transformers will further help to limit the fault current for the SLG fault. In substations supplying low-voltage secondary networks, where the substation transformer HV windings are connected in delta and the MV windings are connected in wye, utilities have installed either reactors or resistors between the X0 bushing of the MV windings and ground to limit ground fault currents. Primary System Grouding discusses neutral grounding at the substation, and compares resistor and reactor grounding for the substation transformers.
Protecting Smaller Primary Cable Conductors
Another reason for limiting fault currents in network systems is to allow the primary feeder breaker to thermally protect the smaller phase conductors (cables), typically those in tap circuits to individual network transformers, during three-phase or phase-to-phase faults. If the through currents in the small conductors are too high, the instantaneous phase relays and tripping of the feeder breaker at the substation may not limit the temperature rise of the phase conductors to an acceptable level, frequently taken as 250o C for copper conductors. This situation may exist with small conductors connected to the main primary feeder close to the substation.
The curves in Figure 12 show the time to raise the temperature of different size copper conductors from either 25o C or 75o C to 250o C, assuming that all heat is stored.
If instantaneous current relays are used with the feeder breaker at the substation, the fault current contribution from the substation may be interrupted in 6 cycles, depending on circuit breaker total clearing time. From Figure 12, the #1 copper conductor temperature (green colored curve) will exceed 250o C if the available fault current is above about 20 to 25 kA, dependent upon the conductor initial temperature prior to the fault. It is even more difficult to protect smaller phase conductors, such as #6 copper, which has been used for tap circuits to individual network transformers. If the feeder breaker fails to open for a fault and the fault is cleared by backup relaying and breakers, the clearing time can be much longer than 6 cycles. This circumstance is illustrated in Figure 12, assuming a backup clearing time of 0.5 seconds. Smaller conductors protected by the feeder breaker tripping may not be protected when cleared with backup breakers at high available fault currents.
The relays for the feeder breaker at the substation should also protect the conductors (sheaths, flat strap neutrals, tape shields) of the ground return path.

figure 12:
Temperature rise curves for copper conductors assuming
all heat is stored.
Limiting Primary Feeder Fault Currents
Fault currents in the medium-voltage portion of the secondary network system can be controlled using different techniques.
Operating with open bus-tie breakers in the medium-voltage buses in the substation that supply the network primary feeders is very effective at limiting fault current. When this is done, in effect the substation transformer capacity that is connected to a medium-voltage bus is limited, whereas with closed bus-tie circuit breakers in effect there are multiple transformers feeding the medium-voltage bus. This approach frequently is selected for substations that supply both network primary feeders, and radial distribution feeders, where expulsion fuses and other devices, such as 200 ampere elbow connectors, have limited interrupting capability and withstand rating respectively. However, when the substation supplies low-voltage networks, operating with open medium-voltage bus-tie breakers, this creates voltage magnitude and phase angle difference on the network primary feeders at the substation. Because of this, load division problems can occur in spot networks, and can result in network protectors sitting open (not automatically closing), cycling, or pumping.
There are numerous utilities that supply the network primary feeders from a closed ring bus in the substation. Network Substation Design shows different substation designs for supplying network primary feeders, including the closed ring bus configuration. One utility supplying both network primary feeders and non-network feeders from a ring bus, as shown in Figure 13 installed series reactors in the ring bus, to limit the fault currents. These are identified in green as R1 thru R4 in Figure 13 . Although this is effective in limiting short-circuit currents, under normal loading conditions, there are current flows through the reactors in the ring bus. The effect of this is to cause voltage magnitude and angle differences between the sections of the ring bus. The utilities experience with three-unit spot networks supplied by feeders fed from Bus Sections 2, Bus Section 1, and Bus Section 6 was that network protectors experienced severe cycling and pumping. In contrast, in three-unit spot networks supplied form Bus Sections 3, 4, and 5, which have the same voltage magnitude and angle, the operation of the protectors in the three-unit spot networks is very stable.

figure 13:
Medium-voltage ring bus with reactors for supplying
network primary and non-network distribution feeders.
Figure 14 shows another substation supplying spot networks from 4.16 kV primary feeders, with there being six substation transformers stepping down from 27 kV to 4.16 kV. If the 4.16 kV windings of the transformers were paralleled on to a 4.16 kV bus, regardless of the bus configuration, the available short circuit current for a fault on the 4.16 kV bus would be excessively high. To limit the short circuit current on 4.16 kV buses A thru F that supply the network primary feeders, buses A thru F are connected to a reactor bus through phase reactors as indicated in Figure 14.
In the system of Figure 14, the 480-volt spot networks fed from the 4.16 kV feeders, contained four-units with 1500/2000 kVA dry-type network transformers. When the system was first placed into operation, the loading on the spot networks was very light in comparison to the installed transformer capacity. The magnitude difference of the voltage on the 4.16 kV buses feeding the network primary feeders was 0.66 %, which is 0.79 volts on a 120-volt base. This is significant in comparison to a typical overvoltage close setting used for the network relay, which might be 1.0 volt. Further, the angle difference for the voltages on the 4.16 kV buses was estimated to be as high as 0.89 degrees. Differences like these at light loads can cause network protectors to cycle, which is indeed what was happening. Some of the network protectors had 3800 operations in a two-year period. The particular protectors had fault close rating, with a mechanical limit of 10,000 operations, so the protector mechanical life would be reached in less than 3 years if the cycling were not stopped. Also, of concern was at some periods only one of the four protectors in each spot network was closed. Loss of the 4.16 kV feeder with the closed protector would cause a momentary outage, which was totally unacceptable for the installation being served from the spot networks (an airport terminal building). Ultimately the cycling was stopped by changing of relay trip characteristics and settings. Further the load served from the spot network also increased, which helped to prevent cycling or pumping of network protectors. As discussed later, network protector operation is more stable at higher loading levels.

figure 14:
Substation for supplying 4.16 kV primary feeders for
spot networks at airport terminal building.
Some utilities operating with closed medium-voltage bus-tie breakers specify high impedances for the substation transformers, to limit fault currents in the medium-voltage system. Although a typical impedance for a distribution substation transformer may be around 8% to 10%, some large capacity networks supplied from substations with closed bus-tie breakers have substation transformers with impedances approaching 24%. With high impedance transformers, the voltage is regulated primarily with load tap changers in the transformers, and with switched capacitor banks connected to the medium-voltage buses that supply the network primary feeders.
Sometimes a utility desires to use the same transformer with standard impedances in substation with closed medium-voltage bus-tie breakers that supply secondary networks, and in substations with open bus-tie breakers that supply radial distribution feeders. To limit fault currents in substations supplying secondary networks, where bus-tie circuit breakers are closed, phase reactors can be inserted between the medium-voltage windings of the substation transformer and the buses for the network feeders. This affects currents for both the three-phase and single line-to-ground (SLG) faults. Further, reductions in ground-fault currents can be achieved through application of neutral reactors or resistors. Additional benefits of neutral resistors or reactors, as discussed in Primary System Grouding, are the reduction in the voltage sag in the secondary network during single line-to-ground (SLG) faults on network primary feeders, and the reduction in step and touch potentials during SLG faults in the medium-voltage system.
Feeder Phase Reactors Effect on Fault Current
Further control of the currents for faults on the network primary feeders can be achieved by inserting phase reactors
in the primary feeders at the substation. Numerous utilities have adopted this approach. When a reactor is inserted in each phase of a network primary feeder, its impedance appears in both the positive- and zero-sequence networks. Thus, feeder phase reactors will limit currents for both the three-phase and SLG faults on the network primary feeders. Figure 15 shows the application of feeder phase reactors in a substation supplying two independent secondary network systems, having network transformers with the delta grounded-wye connections.
One major benefit of the feeder phase reactors, with closed bus-tie breakers in the substation, is that the feeder reactors prevent the substation medium-voltage bus and voltage in the secondary network from dropping to zero for a bolted three-phase fault on the primary feeder at the substation. This can prevent the voltage in the network from dropping below the level where the power supply in microprocessor network protector relays will cease to function. In effect, the feeder phase reactor at the station acts like an express portion of the feeder from the station to the network area. The impact of feeder phase reactors on voltage drop and regulation for the secondary network, as well as load division, must also be considered.
To determine the effect of the feeder phase reactors on the current in the fault path, for faults at the reactor terminals as in Figure 15, the entire system must be rigorously modeled in detail, including the secondary system. Before the faulted feeder breaker opens, the total current in the fault path consists of the component from the substation, IS shown in blue, plus the component backfed from the network, IB shown in green. These two components are identified in Figure 15 for feeder 1 of network 2. After the feeder breaker at the station opens, the total current in the fault path is the backfeed current, IB. This quantity is less than the current in the fault path with the feeder breaker closed, but generally the backfeed current increases after the breaker for the faulted feeder opens.
To illustrate the effect of the phase reactors in limiting the current in the fault path, for a fault at the reactor terminals in Figure 15, the simplified equivalent circuit in Figure 16 can be analyzed.

figure 15:
Feeder phase reactors for liming primary feeder fault
current.
The equivalent in Figure 16 is applicable when the substation operates with closed bus-tie circuit breakers. It includes the effects of the impedance (positive-sequence) of the system looking into the substation medium-voltage, ZS, the feeder phase reactors, ZR, and the network transformers on each feeder, ZT%.. The currents obtained with the simplified equivalent circuit in Figure 16 generally are the upper limits.
In Figure 16, ZS is the Thevenin positive-sequence impedance looking into the substation medium-voltage bus, and ZR is the feeder reactor impedance, both in Ohms. There are a total of N primary feeders supplying the network, each feeder having connected to it MVAT of network transformer capacity, with an impedance of ZT%. on transformer rating. The three-phase fault is on the bottom-most feeder at the reactor terminals, with the current in the fault path being IF shown in red, the current in the reactor being IS shown in blue, and the backfeed current in the faulted feeder being IB, shown in green.

figure 16:
Simplified equivalent circuit for three-phase fault at
feeder reactor terminals.
Figure 17 shows the effect of the ohms of the phase reactor in limiting fault path current IF, for the three-phase fault. It applies to a nominal 13.8 kV system, when the available three-phase fault current on the substation bus is either 40 kA or 20 kA. Connected to each feeder is 10 MVA of network transformers with 5% impedance. For each available fault current level on the substation bus, 40 kA or 20 kA, the red-colored curve applies to a six-feeder network, and the blue-colored curve applies to a three-feeder network. The dashed curve applies if the feeder were radial, which corresponds to there being no network transformers connected to the feeder (MVAT = 0). In plotting these curves, it is assumed that all impedances in the equivalent of Figure 16 have the same angle.
Figure 18 is for the same situation as Figure 17, except that there are 20 MVA of network transformers connected to each 13.8 kV primary feeder. Increasing network transformer capacity results in slightly higher currents in the fault path, current IF, everything else being the same. From these curves, when the bus-fault currents are high, such as 40 kA, the addition of small phase reactors can significantly reduce fault path current IF for faults on network dedicated primary feeders.

figure 17:
Effect of phase reactors on fault-path current,
IF, 10 MVA network transformer capacity per feeder.
Feeder phase reactors also affect the backfeed current from the network during a fault on the primary feeder. In Figure 15 and 19, the backfeed current, IB, is the current from the network back to the fault at the terminals of the phase reactor. The simple model of Fig 2-16 gives insight on the impact of the feeder phase reactor ohms on backfeed current IB. Plotted in Figure 19, for the same conditions as in Figure 18, is the total backfeed current with the breaker for the faulted feeder closed. The curves apply for networks with either three or six feeders, with 20 MVA of network transformer capacity connected to the feeder. The top-two curves apply when 40 kA is available at the substation, and the bottom two when 20 kA is available.

figure 18:
Effect of phase reactors on fault-path current,
IF, 20 MVA network transformer capacity per feeder.
For a 0.25 Ohm feeder phase reactor, the backfeed current with the feeder breaker closed, with 40 kA available on the substation bus and a six-feeder network, is about 6 kA from the top red-colored curve in Figure 19. This quantity is an upper bound, because the impedance of the network secondary circuits is not included in the simple model of Figure 16. From Figure 18, the 0.25 Ohm feeder phase reactors reduce the fault path current IF from 40 kA to about 20 kA in the six-feeder network. If the 6 kA backfeed current is divided equally between the five unfaulted feeders, with the station breaker still closed, in each unfaulted feeder the total fault current at the station would be 1.2 kA. Clearly the instantaneous phase relays for the unfaulted primary feeders at the station must not pickup at the 1.2 kA level, as this would result in dropping of the network.
After the faulted feeder breaker opens, and before any network protectors can open, the backfeed current, IB, to the fault increases, but the phase reactors reduce this component. For the simplified model of Figure 16 and the same parameters that apply to Figure 19 which gives backfeed current with the station breaker closed, Figure 20 gives the backfeed current IB with the breaker for the faulted feeder open. As indicated before, these curves give the upper bound on the backfeed current as secondary impedances are neglected.

figure 19: Effect of phase reactors on backfeed current,
IB, 20 MVA network transformer per feeder, faulted feeder
breaker closed.

figure 20:
Effect of phase reactors on backfeed current,
IB, 20 MVA network transformer capacity per feeder, faulted
feeder breaker open.
With a six-feeder network with 40 kA at the substation and 0.25 Ohm phase reactors, the total backfeed current with the faulted feeder breaker open is about 9.8 kA (top red curve in Figure 20, or about 1.96 kA in each of the five unfaulted feeders. With the three-feeder network with 40 kA available at the substation and 0.25 Ohm phase reactors, the total backfeed current with the faulted feeder breaker open is about 7.8 kA (upper blue curve), and the current in each of the two unfaulted feeders is about 3.9 kA. If the available current for a fault on the substation bus is 20 kA, the current in each unfaulted feeder with 0.25 Ohm feeder reactor would not exceed 1.2 kA and 2.3 kA respectively, for the six- and three-feeder networks. From these numbers, it is seen that the phase instantaneous current relays can’t be set too low, or they will reach through the network and trip for faults on adjacent primary feeders. Table 1 in Primary Feeder Protection lists actual pickup settings for instantaneous phase relays used by utilities in 15 kV class network primary feeders.
Required Minimum Fault Currents on Primary Feeders
Primary Feeder Protection discusses overcurrent protection for network primary feeders. In designing the network system and selecting maximum fault currents to be permitted on the primary feeders, the designer also must consider the minimum fault current levels. Most practitioners desire that on dedicated network primary feeders, the minimum fault currents are high enough to assure that the instantaneous current relays, phase, ground, or both pick up for faults at the most remote points on the protected primary feeder. The desire for the phase instantaneous current relays to pickup for minimum fault current at the most remote point on the dedicated feeder establishes an upper bound on their settings.
Furthermore, the phase instantaneous current relays for the dedicated network feeders at the substation must not pickup for faults in the secondary system, and for faults on an adjacent primary feeder. Also, the phase instantaneous relays must not pickup on the magnetizing inrush current of network transformers when energizing a network primary feeder. Also, they must not pickup on magnetizing currents and cold-load pickup current when restoring a network feeder following shutdown of the feeder. These considerations establish a lower bound on the setting for the phase instantaneous current relays. Figure 21 depicts these levels.
Although most secondary network systems with dedicated primary feeders have instantaneous phase relays for the feeder breaker, instantaneous phase relays may not be applicable on non-dedicated primary feeders where the relays for the feeder breaker at the substation frequently have to selectively coordinate with fuses or other overcurrent devices on the non-dedicated network primary feeder.
When current for the single line-to-ground (SLG) fault on the dedicated network feeders is limited by installation of neutral resistors or neutral reactors with the substation transformers, the residual current should be high enough to ensure that the ground instantaneous relay, if used, operates for the SLG faults at the most remote points on the network primary feeder. Note that the settings which can be used for the ground instantaneous relay is affected by the connections for the primary windings of the network transformer on the dedicated feeder. With delta connected primary windings, low settings are possible, but with the grounded-wye primary windings for the network transformers, the feeder ground relay may reach through the network transformers and see faults in the secondary system. It can’t be set as sensitive as with delta wye connected network transformers.

Figure 21:
Range for 50 phase relative to minimum fault and maximum
inrush.adjacent feeder fault current.
Allowed Maximum Fault Currents on Primary Feeders
What is not quantified in the industry is the level to which fault currents for multiphase faults should be limited, to prevent a fault in a cable splice from causing a manhole lid ejection, a fault in the terminal compartment or switch compartment of the network transformer from causing ejection of the bolted-on covers. Lower fault current reduces the power into arcs in the faulted equipment for multiphase faults. Further, lowering fault currents reduces the energy input and reduces the chance of a disruptive-type failure for these faults, assuming that the time for the feeder breaker instantaneous current relays to operate at the lower currents is the same. Figure 22 shows the pickup time for the instantaneous element of one microprocessor relay, from which it is seen that the pickup time for currents greater than 1.2 times pickup is very low. For this relay, a time of 4 mS or 0.24 cycles should be added to account for the time for the electro-mechanical output relay to make its contacts.

figure 22:
Pickup time of instantaneous element of one
microprocessor relay (courtesy SEL Inc.).
In addition to current, arc voltage, and time, another factor affecting the energy input to faults in terminal compartments, switch compartments, transformer main tank, and splices is the number of phases involved in the fault. In general, as more phases are involved in the fault, more energy is supplied to the arc. Limited fault recorder data suggest that single line-to-ground faults in liquid filled enclosures with all three phases present involve all three phases within a cycle of inception, and consequentially the energy input to the enclosure is greater than if only one phase were present. There seems to be no test data or industry study results defining the energy that terminal compartments and switch compartments on network transformers can withstand without rupture. But industry experience is that the majority of faults in terminal and switch compartments result in either partial or total displacement of the bolted-on cover plates.
However, as discussed in Primary Feeder Protection, some utilities have installed electronic current-limiting fuses with the feeder breakers in the substation. These devices can interrupt high fault currents in less than 1 cycle, and thereby limit the energy input to faults in terminal compartments and switch compartments on network transformers. Experience has shown that these devices can be effective in preventing rupture of these compartments for internal faults.
For faults inside the network transformer main tank, references defining the tank arc energy withstand level without rupturing and expelling hot fluids are not available. No doubt, that the withstand is a function of many parameters, including tank volume and construction, and loading on the transformer prior to fault. But because of the larger volume of the main tank of the transformer relative to that of the terminal and switch compartments, the main tank can withstand higher arc energies without rupture. Furthermore, there is evidence from one large operator of secondary networks, whose three-phase available fault currents are in the range of 40 kA at the substation, that when the transformer is at a location on the feeder where the available three-phase fault current is 15 kA or less, it is less likely the transformer main tank will rupture for a fault in the HV portion of the transformer (leads, tap changer, internal grounding switch). Further, the probability of tank rupture in the larger network transformer, such as 2500 kVA, is less due to the larger internal volume and ability to absorb the energy of the arc through deformation of the tank without rupture. In contrast, when the network transformer is close to the substation where the available fault current is much higher than 15 kA, the main tank may rupture even though the primary feeder breaker opens through instantaneous current relays.
A significant difference between network transformers and other three-phase pad-mounted or sub-surface distribution transformers is that usually the latter are protected on the HV side with individual fuses, either expulsion or current-limiting. The fuses are sized (ampere rating) based on the full-load current of the transformer they are applied with, and can clear high-current faults in one cycle or less with current-limiting fuses. Further, with fuses on the HV side, they are better able to detect faults (turn-to-turn or layer-to-layer) within the HV windings of the transformer than the phase relays for the feeder breaker. The pickup of the phase relays for a network feeder may be 720 amperes or higher, whereas the full load current of a 500 kVA 13.8 kV network or pad-mounted transformer is just 20.9 amperes.
Network Unit Equipment discusses two new designs for network transformers that are intended to minimize the chance of rupture for faults internal to the main tank. One design allows the tank and cooling panels to distort and absorb the energy of the arc without rupturing at the top. The other design is a sealed dry type that has no flammable oil or fluid.
Similarly, for faults in single-conductor and three-conductor primary cable splices, there is no data on the arc energy levels or available fault currents that prevent manhole lid displacements. However, EPRI has developed models that allow studying the basic phenomena. Regardless, the higher the available fault current, the greater the explosive effects of arcs in cable splices.
Many faults in primary cables and cable splices, especially when single conductor cables are used, start from on phase to ground (cable sheath, flat-strap neutral, etc.). Limiting the current for the SLG fault on the feeder limits the energy input, and reduces the change of more than one phase being involved in the fault, thereby limiting the energy in the fault path. There is some evidence suggesting that when the current for the SLG fault is limited to 4 kA or lower in 15 kV class systems, it is less likely that faults in cable splices will propagate to a second phase, which only increases the arc energy at the fault point and the chance of a manhole lid displacement. When the primary feeders to the network are dedicated and supply network transformers with the delta connected primary windings, the currents for the SLG fault can be limited to values which are much less than the currents for multi-phase faults, by either reactance or resistance grounding of the medium-voltage system that supplies the network primary feeders.. Further, if the ground instantaneous current relays are used with the feeder breaker, the duration of the SLG fault can be kept short.
Primary Feeder Design Practice
Design Contingency
Most networks are designed to operate with the loss of either one or two primary feeders. The design is influenced by the utility’s philosophy for loading of network transformers and other components during contingency conditions, and the number of primary feeders. During contingency conditions, the loading on the network transformers may or may not exceed their nameplate rating. Overload practices vary with different operators. Some utilities will overload the network transformers during the contingency conditions, because the network transformers have short-time overload capability. However, the network protector should not be loaded above its current rating because it is a maximum rated device. Network Unit Equipment discusses network transformer and protector ratings and applications. The overload philosophy also affects the design of primary cable circuits and secondary mains.
Today, many utilities will analyze their system during normal and contingency conditions using a power flow program. Programs specifically for this purpose are available from several vendors. The system must be analyzed for each possible contingency for the primary feeders. If there are N feeders for the network, and the system is designed for single contingency, then N power flows must be run, one with each feeder out-of-service at a time. But if the system is designed for a double contingency with any two primary feeders out of service, the number of contingency cases is N(N-1)/2. For a six-feeder network, 15 double contingency cases must be run, looking for overloads in cables and transformers, and low voltages in the secondary system. Considering both single and double contingency conditions, the total number of case to be run is N(N+1)/2, or 21 cases for a six-feeder network.
Feeder Dedication
As mentioned in Introduction and Overview, the primary feeders to a given secondary network may be either dedicated or non-dedicated. In the simple system of Figure 1 in Introduction and Overview, the primary feeders are dedicated. Dedicated primary feeders supply only network transformers, whereas non-dedicated primary feeders supply both network transformers, and other distribution transformers. The other transformers may be radially fed, dual fed with one source feeder normally open, or be part of an automatic primary transfer system.
The preferred design for secondary networks is to have dedicated primary feeders. With dedicated primary feeders:
-
Overcurrent protection is simplified, as usually the only overcurrent devices on the feeder are the relays for the feeder breaker at the substation. But when the feeders are non-dedicated, the relays for the station breaker, in particular the ground relay, may need to be de-sensitized to coordinate with downstream fuses or other overcurrent devices. This is discussed in Primary Feeder Protection.
-
There are more available options for grounding the medium-voltage system that supplies the network primary feeders. With delta-wye network transformers, either resistance or reactance grounding can be selected. But with non-dedicated feeders, usually resistance grounding is not applicable, because the distribution transformers have their primary windings connected from phase-to-ground (neutral). And if reactance grounding is used, the requirements for an effectively grounded system must be met. Specifically, the X0 to X1 ratio must be less than 3, and the R0 to X1 ratio must be less than 1.
-
Taking a dedicated network primary feeder out of service for work is simplified as no provisions must be made to prevent outages to the non-network load on the feeder. The “drop test” can be run to confirm that all network protectors on the feeder will trip. But with non-dedicated primary feeders, an alternate supply to the non-network transformers must be established if an outage is to be prevented.
Recognize that under certain circumstances, there may be economic incentives to connect non-network load to the otherwise dedicated primary feeders of the network. For example, there may be no available feeder breaker positions in the substation for radial feeders for non-network load. When the medium-voltage feeders supplying the network have to be non-dedicated, the negative impacts on network operation and protection must be weighed.
Location in Manholes
Ideally, in the secondary network system, separate manholes are used for primary cables, and separate manholes for low-voltage secondary cables. The intent of this design is to prevent fires in secondary cables from causing faults in one or more primary cable circuits, possibly creating an N-2, N-3, or higher contingency, which may necessitate dropping of the network. However, rarely is this possible, and both primary and secondary cables are within the same manhole. When both are in the same manhole, the preferred practice is to locate the secondary cables above the primary cables, or have the primary and secondary cables on opposite sides of the manhole. With the secondary cables above the primary cables, a fire in secondary cables is less likely to cause a fault in a primary cable, especially if the primary cables have arc proof wrapping.
It is also preferable to limit the number of primary feeders in any one manhole so that a failure and fire in a secondary cable does not cause faults in multiple primary feeders, especially when the system is designed for a single contingency. There was a fault in the primary cable of one feeder in a system with the wye-grounded wye-grounded connections for the network transformers, where a backfeeding protector failed to open after the primary feeder breaker opened. The backfeeding protector was at a fringe area in the 208Y/120-volt grid, where the backfeed current was very low, resulting in an excessively long time for the protector fuses to clear the backfeed. Before the backfeed was cleared by the protector fuse(s), the arcing at the original fault point in the manhole produce conditions where other primary feeders in the same manhole faulted.
Sometimes, limiting the number of primary feeders in a manhole to two or less isn’t possible, especially in manholes close to the substation. Measures for preventing multiple primary feeder outages should be considered, such as arc proofing, separation, and location within the manhole. As discussed before, with single-conductor primary cables and either resistance or reactance grounding of the medium-voltage system that supplies the network, the current for the SLG fault, the most common, is limited. And with instantaneous current relays for the feeder breaker, the energy into the SLG fault is limited. Further, with delta wye-grounded connections for the network transformers, after the primary feeder breaker opens, the current in the fault path is limited by the capacitance to ground of the primary feeder, with the duration of this low backfeed current to the fault determined by the sensitive trip time of the network protectors.
Maximum Size For Secondary Networks
The maximum size of a network (grid and spots supplied from a feeder group) is based upon several considerations. Some utilities have described breaking a large secondary network up into two smaller networks. Baker (1969) describes how in 1968, Dallas Power and Light spit one network when the peak load was 54.8 MW, and predicted to rise to 69.9 MW the following year. Factors affecting network size are discussed in the following.
Effect on Reliability
Whether a network is designed for single or double contingency, there are situations where the network has to be shut down. In some substations supplying secondary networks, there is a master control switch which will trip all primary feeder breakers at the substation for the network. Possible reasons for dropping a network are loss of the supply substation, a fault in a manhole that involves multiple primary feeders, or a fault in the secondary, either 208-volt or 480-volt that will not clear. Should this happen, the entire load supplied from the network experiences an outage, the duration of which depends upon the particular circumstances and time to repair the problem.
If a given area is supplied by two or more smaller networks, rather than one larger network, the impact of the shutdown on reliability indices (SAIDI and CAIDI) will be less with the smaller network. Kramer and Cawley (1985) describe how the immediate solution to a reliability problem in a network in Boston was to take one 14 feeder network, with a peak load of 122 MVA, and split it into two sub networks. Con Edison of New York has described how they took a large 400 MW network for the Long Island City area, and split it into three smaller networks. In one major city in the Western part of the country, the downtown area is supplied from multiple three-feeder networks. Should any one three-feeder network be dropped, the load experiencing an outage is minimized.
Restoration Following An Outage
If a network has been de-energized, it must be picked up when the conditions causing the de-energization have been corrected. This issue must be considered in the overall design of the secondary network1 system. In general, the secondary network can’t be picked up in pieces as is possible in radial distribution systems. To pick up the network, all primary feeders must be energized simultaneously from the substation. There are several ways this can be done.
-
After the medium voltage buses that supply the network primary feeders are energized, the primary feeder breakers for all available feeders are closed simultaneously. Some utilities have a master control switch that allows for this.
-
Before re-energizing the network, the medium-voltage buses that supply the network primary feeders are cleared. First, all network primary feeder breakers are closed. Second the medium-voltage buses with the network primary feeders are simultaneously energized, by closing the secondary side breakers for the substation power transformers that supply the buses with the network feeders. If the medium-voltage buses that supply the network primary feeders also supply non-network feeders, the non-network feeder breakers are left open when energizing the bus. After the network is restored, the non-network feeders are re-energized. The network operator should have a well-defined plan or procedure to follow for restoring an entire network following an outage.
Regardless of how the network primary feeders are simultaneously energized, the supply substation and system must be able to withstand the cold load pickup associated with re-energizing the network. The cold load pickup consists of short-term component due to the magnetizing currents and other inrush currents, and an enduring component from loss of load diversity. The longer the network outage, the longer the duration of the enduring component due to loss of load diversity. One utility has indicated that it is more difficult to pickup a network which serves primarily residential customers, as these customers frequently do not disconnect loads such as air conditioners, refrigerators, and electric water heaters during an outage. The instantaneous current relays for the primary feeder breakers must not pickup, and the time overcurrent relays should not time out when picking up a de-energized network.
Number of Primary Feeders Per Network
The number of primary feeders per network is a variable associated with the size of the network, primary voltage level, the loading capacity per primary feeder, and whether the network is designed for single or double contingency. Secondary networks are in operation with as few as two primary feeders, and as many as 28 feeders. Many networks designed for a single contingency have between five and seven primary feeders, with six 15 kV class primary feeders being quite common with some operators. And as indicated before, in one major downtown area the networks all have just three primary feeders. This design not only limits the size of the network, but also minimizes the effect on reliability indexes if a network has to be dropped.
Impact on Reserve Capacity
The reserve capacity ratio is the ratio of the peak load that can be served from the network to the installed network transformer capacity for the network, for a specified overload on the network transformers during the outage of one primary feeder. The theoretical value assumes that the network transformer capacity on each primary feeder is the same, and the load divides equally between the network primary feeders in service.
Table 4 lists the reserve capacity ratio, assuming either 100% load or 125% load on the in-service transformers during the single contingency. Given for each loading level are the theoretical values, and the value usually obtainable.
The usually obtainable values with 100% loading during single contingency are from Table 12 of chapter 5 of the Westinghouse Distribution Reference Book (Westinghouse 1959). The usually obtainable values with 125% loading during contingency are from Table 1 of chapter 5 of the EEI Underground Systems Reference Book (EEI 1957). With a network having six or more primary feeders with an allowed network transformer loading of 125% during first contingency, the theoretical ratio of peak load to transformer capacity is greater than 1.0, being 1.042 for the six-feeder network (last row of Table 4). But a theoretical reserve capacity ratio greater than 1.0 implies that under normal conditions with all feeders in service, the load on each network transformer during normal conditions is not to exceed 100 % of transformer rating.
The higher the reserve capacity ratio, the better is the utilization of the installed network transformer capacity. The numbers in Table 4 show that going from two to three primary feeders gives a significant improvement in transformer utilization. But as more feeders are added, the incremental gain in transformer utilization decreases. It suggests that going beyond six or seven feeders for the network does not result in an improvement in transformer utilization. Considering other factors such reliability, network restoration, and management of the network may explain why some utilities networks have a maximum of six feeders when the primary feeders operate at the 15-kV class voltage levels, and the system is designed for a single contingency.
Larger numbers of primary feeders typically are used when the system is designed for double contingency, but there are some six-feeder networks that are designed to operate under a double contingency condition.
Table 4:
Reserve Capacity Ratio (Ratio of Peak Load Served to
Installed Network Transformer Capacity
Number of Primary Feeders |
Reserve Capacity Ratio, 100% Loading During Single Contingency |
Reserve Capacity Ratio, 125% Loading During Single Contingency |
||
|---|---|---|---|---|
| Theoretical | Usually Obtainable | Theoretical | Usually Obtainable | |
| 2 | 0.5 | 0.40 | 0.625 | 0.45 |
| 3 | 0.667 | 0.54 | 0.833 | 0.60 |
| 4 | 0.75 | 0.58 | 0.938 | 0.70 |
| 5 | 0.80 | 0.60 | 1.000 | 0.75 |
| 6 | 0.833 | 0.61 | 1.042 |
Figure 23, taken from the EEI A-C Network operations report for 1959-1961, (EEI 1959-61), plots peak load, installed network transformer capacity, and the ratio of the peak load to the installed transformer capacity (reserve capacity ratio). Although this data is old, with the last year of collection being 1961, it shows that the average reserve capacity ratio of actual systems does not go above 0.60.

figure 23:
Network Peak Load, Installed Network Transformer
Capacity, and ratio (courtesy EEI, 1959-61)
Measures to Limit Double Contingencies
In network systems designed for single contingencies, outage of any two or more primary feeders may necessitate network shutdown until repairs are made. When this has occurred, frequently it is due to fires in secondary cable circuits, which impinge on multiple primary feeder cables, causing faults in more than one primary feeder. Figure 24 shows a cable fire which resulted in the tripping of all primary feeders to a secondary network.

figure 24:
Secondary cable fire that resulted in tripping of all
primary feeders to the network (courtesy PEPCO).
Figure 25 contains a portion of an article from the Boston Globe on June 1, 1994, indicting the manhole fire resulted in dropping of the network, with nine primary feeders knocked out by the fire in a manhole.
To minimize the chance of these types of situation and network shutdown, sometimes the following measures are incorporated in the design of the secondary network system.
-
No more than two primary feeder cables are in a manhole with secondary cable.
-
Primary cables and secondary cables are on opposite sides of the manhole, and do not cross.
-
Secondary cables are located above primary cables. Otherwise the heat from the secondary cable fire rises up into the primary cables, causing faults in the primary cable.
-
Arc proofing material is applied to the primary cables and splices in the manhole.
-
As discussed in Introduction and Overview, in vaults for spot networks only one network transformer and its primary feeder are in the vault. Other primary feeders do not pass through the vault so that an oil fire from a switch or transformer failure removes only one primary feeder from service.
Further, by locating no more than two, and preferably one primary feeder circuit in a given manhole, the probability of a second contingency is lowered.
Other measures to minimize the probability of a double contingency in systems designed for outage of one primary feeder are:
-
Avoid taking primary feeders out-of-service for construction or maintenance during peak load conditions. For areas where peak loads occur during the summer months, scheduled work is completed in the spring prior to peak load conditions.
-
If a primary feeder breaker opens from a fault, the fault should be located, repaired, and the feeder returned to service as quickly as possible. Research by a major operator of secondary networks shows that the longer a primary feeder is out of service, the greater the probability of a second primary feeder failing.
-
Perform manhole and vault inspections to identify and correct problems before failures occur.
-
Obtain agreement with large customers to curtail load during single contingency periods.
-
Install a remote monitoring system for network transformer vaults, to detect overloaded network transformers, inoperable network protectors, blown fuses in the network protector, network transformer internal pressure, etc.
-
Keep accurate records of component failures to identify any trends that require action. For example, if the pre-molded splices of a particular manufacturer, produced in a given time window, have experienced a high failure rate, a program of planned replacement may be justified.
-
When components fail, perform detailed failure analyses to determine the cause of the failure.


figure 25:
Portion of article from 1994 Boston Globe on network
outage in Boston from secondary cable fire (courtesy Boston Globe).
Secondary System Voltage Levels
For grid or area networks, most often the nominal voltage of the secondary system is 208Y/120 volts, although small grid networks have been installed operating at 480Y/277 volts. The concern with the higher-voltage grid networks is the high probability of sustained arcing faults in cables in ducts which do not self-clear or blow cable limiters if installed, the availability of suitable cable limiters rated for 480 volts or higher, and the hazards associated with the cutting of an energized cable in a 480Y/277 volt system. Rothfus et. al 1954 describes a 480-volt area network for a medium load density area, and Buettner 1966 discusses the economics of interconnecting otherwise isolated 480-volt spot networks.
For spot networks, most systems operate at either 208Y/120 volts or 480Y/277 volts. However, other voltages have been used, such as 600Y/346 volts in Canada, and 380Y/220 volts in Korea. Some utilities have installed spot networks that operate at medium-voltage levels, such as 4.16 kV, as discussed in Medium Voltage Spot Network Systems.
Secondary Main Capacity
The secondary mains are installed to supply the smaller loads from manholes or handholes, and to interconnect the network units that are located at or close to the large loads. Figure 26 shows a portion of an area network, including three transformer vaults and three primary feeders. Whenever a primary feeder is out-of-service, the network transformer capacity on that feeder is not available, and the power flows in the secondary network will redistribute. With reference to Figure 26, if primary feeder 2 were out-of-service, the network protector in transformer vault 2 is open. The secondary mains will have to carry a portion of the load normally supplied from the network transformer in vault 2. The secondary mains must be sized such that when any one primary feeder is out-of-service, the mains can carry the peak load without exceeding their ratings.
If the system is designed for a double contingency of the primary feeders, the loading on the secondary mains must be examined under all possible double contingencies. Secondary Grid Design Considerations discusses further the required capacity of the secondary mains. Other subjects related to secondary main design are presented in Secondary Grid Design Considerations.
To evaluate the loading on the secondary mains during normal and contingency conditions, the system must be modeled in a power flow program to determine the currents. Recognize that the topology of the secondary network system of many utilities is as or more complex than the topology of the utilities transmission system. Just as one would not attempt to evaluate the power flows on the transmission system with “back-of-the-envelope” calculations, the same is true for the LV secondary network.
Backfeed Current With Stuck Closed Protector
Network protectors are intended to open under high-current backfeeds to multi-phase faults on the network primary feeder, after the breaker at the substation for the faulted feeder opens. However, should the backfeeding network protector fail to open, the network protector contains a fuse, which is to serve as a backup device when the protector fails to open. The protector may fail to open because of a defective network relay or incorrect trip characteristic. Or it may be that the network relay makes its trip contact, but the protector mechanism is defective, for whatever reason.

figure 26:
Portion of 208Y/120-volt secondary network
Figure 27 shows a multi-phase fault on network primary feeder 3, with the feeder breaker at the substation open. The network protector in Vault 3 is stuck closed, so the high-current backfeed should be cleared by blowing of the fuses in the backfeeding protector in Vault 3. Further, it is desired that the fuses in the network protector blow before the backfeeding network transformer can be damaged thermally.
The magnitude of the backfeed current is determined primarily by the impedance of the backfeeding network transformer, and the impedances of the secondary network system at the backfeed location. The impedance of the primary feeder between the HV terminals of the backfeeding network transformer, connected delta wye-grounded, and fault typically is very small in comparison to the network transformer impedance reflected to the HV side, and feeder impedance has minimal effect on the magnitude of the backfeed current.
Further, the magnitude of the backfeed current in the protector is a function of the type of fault on the primary feeder. For a three-phase fault, the backfeed currents are the highest, and nearly equal in all three phases. If the multi-phase fault on the primary feeder is a double line-to-ground (DLG) fault, the current in one phase of the backfeeding protector is the same as that for the three-phase fault, but in the other two phases of the backfeeding protector the backfeed current is approximately 50% of that for the three-phase fault. In many situations, for backfeed to the DLG fault, the protector fuse which sees the same current as for a three-phase fault will blow first. But if the backfeed location is at a fringe area of the network, there may not be enough backfeed current to blow a second fuse in the backfeeding protector for the DLG fault. The problems caused by this, including overheating of secondary neutral conductors, are discussed in more detail and quantified in Backfeed Currents For Primary Feeder Faults.
Furthermore, note from Figure 27 that if a protector fails to open during high-current backfeed, most all system operators desire that only the fuses in the backfeeding protector open. Limiters in secondary mains or in vault-to-manhole tie circuits should not blow for this condition. It is easier to replace a protector fuse than a cable limiter, especially if the cable limiters are in fusible crabs.

figure 27:
Backfeed to multi-phase fault with stuck-close protector
Should the fault on Feeder 3 in Figure 27 be a single line-to-ground (SLG) fault, after the faulted feeder breaker opens, the SLG fault is now on an ungrounded primary system because it is supplied from the delta-connected primary windings of the network transformer(s). The current in the fault path and the currents in the backfeeding network protector are limited by the capacitance to ground of the primary feeder cables. The backfeed currents in the protector may not be high enough to blow the network protector fuses, and the feeder remains live-on-backfeed, until the backfeeding protector is manually opened. During the time period that the feeder is live on backfeed, the voltage to ground on the two un-faulted phases of the primary feeder cable is 173% of the normal value. Primary feeder cables, splices, and other equipment on the primary feeder must withstand these overvoltages for the time required to clear the backfeed to the SLG fault.
Recognize that in most systems the primary feeders are part of a grounded system when the feeder breaker is closed. But with the feeder breaker opens, the primary feeder is now part of an ungrounded system if the network transformers have the delta connected primary windings.
Cable Limiters In 208-V Area Networks
In early low-voltage secondary network systems, low-voltage cables were solidly joined at junction points, without fusing devices for short circuit protection, as in Figure 28.

figure 28:
Area network without cable limiters in 208-volt
secondary circuits
Of course, in these systems fuses were installed in network protectors as shown in Figure 28.
It was felt that faults in the low-voltage cables operating at 120-volts to ground would burn clear without the fault spreading. In Figure 28 there is a solid fault in one set of cables between Manhole 2 and Manhole 3. The current flowing into the fault from Manhole 2 is I2, and the current flowing into the fault from Manhole 3 is I3. In early systems with lead-sheath low-voltage cables, some engineers believed the many faults were initiated from the phase conductor to the lead sheath, and would self-clear before penetrating the lead sheath. Further, with the lead sheath having a much lower melting temperature than the copper, the sheath would burn back sufficiently far to allow the fault to self-clear. With non-leaded cables, there was some evidence that copper to copper faults, especially with the smaller size conductors, would burn clear. Additionally, it was hypothesized that faults in cables installed in larger ducts were more likely to self-clear, because there was more room for the cables to separate due to magnetic forces when the fault current was flowing. And when larger cables are installed in ducts, they occupy a greater percentage of the duct space, and consequently make it more difficult for the metal, metal vapors, and gases to escape. The presence of these vapors and gases around the arc make it more stable and more likely to restrike. (Blake 1928a) contains early thoughts on how the network system would respond to faults in low-voltage cables when cable limiters were not used.
But experience in early network systems without limiters showed that in
some cases with solid-type faults, before the fault would self-clear, it
would spread to other parts of the secondary system. With reference to
Figure 28, with the solid fault between manholes 2 and 3 in one set of
cables, currents I2 and I3 feeding into the fault
will raise the temperature of the conductors carrying the current. With
copper conductors, the copper temperature could reach a
level which could damage the insulation and allow the fault to spread.
If the fault in a duct spread into a manhole, other secondary or primary
cables in the manhole could fault.
To prevent or minimize the chance of these faults from spreading, the cable limiter was developed, first applied in the LV network systems in New York City. In an AIEE article in the early 30’s titled, “Operating Record Proves Value of Limiters” by C.P.Xenis and E. Williams of Con Edison, it was stated that, “In all cases where limiters were installed and a fault occurred the insulation of cable on both sides of the fault was found to be in good condition. Furthermore, all faults were confined to that section of cable in which they originated”. Although cable limiters can be effective in preventing solid-type faults from spreading, experience has shown that they may not provide protection for arcing faults, and manhole explosions can still occur even when limiters are installed. Secondary Grid Design Considerations discusses the currents associated with intermittent arcing faults in secondary cables to show why these arcing faults may not blow the cable limiters. Some steps taken by utilities to reduce the chance of manhole explosions from these faults are described.
Impact of Voltage Phase Angle on Spot Network Operation
As mentioned before, if a secondary network is supplied from two different substations, or from the same substation but with open bus-tie circuit breakers, there can be considerable difference in the voltage applied to the primary feeders of the network, in both magnitude and angle. Figure 29 shows a six-feeder secondary network supplied from two different substations. Some of the network transformers are for the grid network, and two are for a spot network. To determine the system response, rigorously the system must be modeled in a power flow program to look at the effect of voltage magnitude and voltage angle difference on the medium-voltage buses at the two substations.

figure 29:
Network fed from two different substations.
However, for the two-unit spot network fed from HV feeder 1 from Substation 1, and from HV feeder 2 fed from Substation 2, a simple analysis as presented in this section shows that for a phase angle difference of 3 degrees or larger between the two substations supplying the spot network, it is very unlikely the load on the spot network would reach the level where both network protectors will remain closed.
Figure 30 (a) show the two-unit spot fed from feeder 1 where the voltage magnitude is 1.0 per unit, at an angle of zero degrees, and from feeder 2 were the voltage magnitude is also 1.0 per unit, but at an angle of 3.0 degrees. For the simplified analysis presented here, it is assumed that the network transformer impedance is purely inductive. The load supplied from the network is a constant current sink with unity power factor, drawing a current of IL in per unit of network transformer rating.
With reverence to Figure 30 (a), the total current in the transformer fed from feeder 1 is I1 in per unit on transformer rating, and the total current in the transformer fed from feeder 2 is I2 in per unit on transformer rating. Further the impedance of each network transformer is jXT in per unit on transformer rating.
The total current in each network transformer, consists of the circulating component, IC in Figure 30 (b), plus a load component as shown in Figure 30 (c). The circulating current is that which flows with no load on the secondary if the protectors were blocked closed. It is due to the difference in voltage on the primary side of the network transformers. The load component in each transformer, for practical purposes is the same, and is shown as IL/2 in Figure 30 (c).
Figure 30 (d) shows to scale the voltages applied to the primary side of the network transformers. The difference in these is shown as ∆V, in per unit. For practical purposes ∆V is quadrature to the applied voltage to feeder 1.

figure 30:
Total Current, circulating current component, and load
current component.
The circulating current in per unit, IC, lags the voltage
difference ∆V by 90 degree, so for practical purpose the
circulating current causes a watt circulation, with the watt flow in the
transformer fed from feeder 1 being in the reverse direction, and the
watt flow in the transformer fed from feeder 2 in the forward direction,
or into the network. The circulating watt flow in per unit of network
transformer kVA rating is the same as the per unit circulating current.
The circulating current in per unit of transformer rating is given by eq (6), where all quantities are in per unit.
(6) $$ \ \ \ I_{C} = \frac{\Delta V}{j2X_{T}} = \frac{1.0 \enspace \angle \enspace 3 \degree - 1.0 \angle 0 \degree}{j2X_{T}} \approxeq \frac{j \sin{3 \degree}}{j2X_{T}} \approxeq \frac{ \sin{3 \degree } }{2X_{T}} $$
For angle difference of 3 degrees, and with network transformers having an impedance of 5% (0.05 per unit), the magnitude of the circulating current in per unit of transformer rated current is given by eq (7).
(7) $$ \ \ \ I_{C} = \frac{\sin{3 \degree}}{2X_{T}} = \frac{0.05234}{ 2 * 0.05} = 0.52 \text{ per unit} $$
From eq (7), the magnitude of the circulating current, which for practical purposes corresponds to a watt circulation, is 52 percent of the kVA rating of the network transformer. The total current in network transformers 1 and 2 is given by eq (8).
(8) $$ \ \ \ I_{1} = \frac{I_{L}}{2} - I_{C} \text{ and} I_{2} = \frac{I_{L}}{2} + I_{C} $$
From eq (8), in order to prevent a reverse current (watt) flow in the transformer fed from Feeder 1, inequality (9) must be satisfied.
(9) $$ \ \ \ \frac{I_{L}}{2} \gt I_{C} \text{ or } I_{L} \gt 2 I_{C} $$
With the circulating current being 0.52 per unit, the load current IL in per unit must be 1.04 per unit as shown by eq (10)
(10) $$ \ \ \ I_{L} \gt 2 * 0.52 \text{ or } I_{L} \gt 1.04 \text{ per unit} $$
Recognize that this analysis assumes the load current is at 100% power factor. Regardless, this simple analysis shows that if the sources to the spot network are three degrees out of phase, in order to prevent a reverse power flow and keep both network protectors closed, the load on the network must be at least 104% of the kVA rating of one network transformer (5% impedance network transformers).
Network Primary Feeder Voltage Drop
When the network primary feeders originate on the same electrical bus in the substation, at the source end of the network primary feeders the voltage is the same in both magnitude and angle. But at any point away from the substation, the voltage is different due to voltage drop on the primary feeder.
If a two-unit spot network is suppled from two feeders which originate on the same electrical bus in the substation, at the HV terminals of the network transformers the voltages will not be the same, as the voltage drops in the two feeders from the substation to the spot network will not, in general, be the same. However, if the feeder loadings are reasonably balanced, the angle difference at the HV terminals will not be that large in many situations.
Figure 31 shows two primary feeders, supplying a two-unit spot network. The difference in the voltage at the HV terminals of the two network transformers, ∆V, is the difference in the voltage drop on feeder 1, VDFDR1, and the voltage drop on feeder 2, VDFDR2.
With reference to Figure 32, by assuming that the load current profile along the primary feeder is linear, with the current at the substation end being IS amperes, and the current at the end of the feeder, having length L, being K*IL amperes, where K is a decimal that is less than 1.0, it is possible to calculate on the feeder at distance “x” from the substation the voltage drop magnitude in percent, and the angle shift from the substation to point “x” in degrees.
Assuming that the current at the substation end, IS, is 300 amperes, which corresponds to a load of 7.17 MVA at 13.8 kV, and the feeder is made with 500 kcmil flat-strap single conductor cables, with the length of the feeder, L, being 10,000 feet, the magnitude of the voltage drop on the feeder, and the angle shift at point “x” can be found. This gives insight into the maximum difference in ∆V at the high-voltage terminals of the network transformers for the spot network.
Figure 33 plots the magnitude of the voltage drop on the primary feeder with the red colored curves, and the phase angle shift with the blue colored curves for three different values of K, either 0.0, 0.25, or 0.5, which correspond to the current at the end of the 10,000 foot long feeder being either 0 amperes, 75 amperes, or 150 amperes. Further, as indicated on the figure it applies for a power factor of 85 % along the entire length of the feeder. If there were no voltage drop on one of the two feeders to the spot network, then the curves in Figure 33 give an upper bound on the differences in voltage magnitude, ∆V, and angle at the HV terminals of the two transformers in the spot network.

figure 31:
Two -unit spot network fed from substation with closed
bus-tie breakers

figure 32:
Linear load current profile for current on network
primary feeder.
The curves in Figure 33 further assume that the same size conductor is used for the main feeder between the substation and the end of the feeder, 10,000 feet from the substation. Also listed on the figure are the positive-sequence resistance and reactance for the feeder made with the single-conductor 500 kcmil copper cables.
The red curves show that the voltage drop magnitude to any point along the feeder in percent can exceed 1.0 percent, which on a 120-volt base is 1.20 volts. This will affect primarily the var flow in the spot network when both protectors are closed. However, the angle shift to the end of the primary feeder having a length of 10,000 feet will not exceed about 0.20 degrees. If there were no angle shift on one of the two feeders, and 0.20 degrees on the other, the maximum angle difference at the HV terminals of the network transformers would not exceed 0.20 degrees. Referring to the simple analysis of the two-unit spot network in Impact of Voltage Phase Angle on Spot Network Operation, an angle difference of 0.20 degrees would produce a circulating current, watts, of 0.0349 per unit of the kVA rating of one network transformer, assuming the transformers have 5% leakage impedance. Thus, once the protectors are closed, they would stay closed as long as the load on the spot network was about 7% of the kVA rating of one network transformer.

figure 33:
Voltage drop magnitude and angle shift on 10,000 foot
long feeder with 500 kcmil copper cables.
Although the angle shift along a 10,000 foot circuit in Figure 33 is not that large when 500 kvmil copper cable is used for the primary feeder, if the circuit were made with open wire line on an 8-foot cross arm, as might be the situation in a spot network in suburban areas, the angle shift will be much larger. Figure 34 plots the voltage drop in percent, and the angle shift in degrees if the primary circuit is an OH line with 477 kcmil aluminum phase conductors, constructed on an 8-foot cross arm. It is seen from the blue-colored curve that the angle shift at the end of a 10,000-foot long OH line can exceed 1.0 degree. This is consistent with observations that in two-unit spot networks fed from OH lines, load division usually is not as good as when cable circuits are utilized. Further, experience of some operators is that network protector cycling and pumping is more likely when OH lines are used for the primary feeders of spot networks.

figure 34:
Voltage drop magnitude and angle shift on 10,000 foot
long OH feeder with 477 kcmil aluminum phase conductors.
Sectionalizing Network Primary Feeders
In most low-voltage network systems, the only overcurrent protective devices on the primary feeder are the instantaneous and time-overcurrent phase and ground relays for the feeder breaker at the substation. The design philosophy is that a fault on the primary feeder or in the network transformer is the same, and the feeder and all transformers are removed from service for either fault. This is reflected in the single-line diagrams of the three-feeder network in Introduction and Overview, and in Figure 35. However, some utilities have installed fuses or vacuum breakers at the HV terminals of network transformers in spot networks. Regardless, if a fault occurs on the primary feeder ahead of any overcurrent device applied with the network transformers, the entire feeder is removed from service.

figure 35:
Network primary feeder with fault, feeder breaker and
all network protectors open.
With no sectionalizing devices in the primary feeder in Figure 35, generally the feeder can’t be returned to service until the fault is located, repaired, and appropriate tests performed. If there is a mid-point or thereabout sectionalizing switch in the primary feeder as in Figure 36, the initial fault will still remove the entire feeder from service. The feeder breaker at the substation opens, and all network protectors on the feeder open, just as when a sectionalizing switch is not present in the primary feeder.
But if the fault is on the “back-half” of the feeder as in Figure 36, after the fault is isolated by opening of the feeder breaker and network protectors, and the fault is located, the sectionalizing switch can be opened. Then, after appropriate testing, the feeder breaker can be reclosed to energize the network transformers on the first half of the feeder. Their network protectors would then close to help reduce the loading on the remaining in-service network transformers and secondary mains. Figure 37 shows the configuration with the sectionalizing switch open, the feeder breaker closed, and the network protectors on the first half of the feeder closed.
Whenever sectionalizing switches are added to the primary feeder, operating, testing and fault locating procedures must be updated to assure safe operations. The sectionalizing switch should have a fault close and momentary rating if the switch will be closed, manually or remotely, with the feeder breaker closed at the substation. After the fault on the back-half of the feeder is repaired, the back-half could be re-energized by closing the sectionalizing switch with the feeder breaker closed. An alternate approach would be to open the feeder breaker, close the sectionalizing switch, and then close the feeder breaker.

figure 36:
Fault on network primary feeder with closed
sectionalizing switch, with feeder breaker open and all network
protectors open.

figure 37:
Fault on network primary feeder isolated by opening of
sectionalizing switch and network protectors “downstream” of the
switch.
Verifying the Network Design
The design of secondary networks and its response under normal and contingency conditions must be verified through calculations and simulations. Similarly, the response under fault conditions, for both primary and secondary faults, must be determined to assure proper operation. The power flow calculations and short circuit calculations are best done with detailed modeling using appropriate software, available from different vendors.
For the modeling to be accurate, the system topology and impedances of the secondary circuits of the grid network, and the impedances of the primary circuits that are input to the model must be correct. Secondary Grid Design Considerations discusses in detail the calculation of the impedances of phase grouped and phase-isolated secondary circuits and secondary mains in grid networks.
4.3 - Network Substation Design
NETWORK SUBSTATION DESIGN
Secondary network systems have many parallel paths from the distribution substation to the low-voltage portions of the secondary network, either 208Y/120-volt grid network or spot networks, as shown in Figure 1 of Introduction and Overview. Because of this redundancy, one or more of these paths can be removed from service for maintenance or because of a fault on a primary feeder, and the load served from the secondary network will not experience an outage. Similarly, the substation that supplies the network primary feeders should be designed such that a fault within the substation, loss of a main power transformer, or loss of one or more supply sources to the substation, either transmission or generation, does not result in an outage to customers served from the secondary network.
This Chapter is not a treatise on substation design – this would require a book in itself. It is intended to identify certain areas that should be considered when designing or selecting substations that supply secondary networks. It is not possible to include all substation configurations that have been used to supply secondary networks, but select examples are included. As mentioned in Introduction and Overview, substations that supply the primary feeders of the secondary network may also supply other distribution primary feeders with non-network loads, or the substation may be dedicated to supplying just primary feeders for the secondary network.
Design Considerations
Fault Current Levels
Generally, the larger the capacity of the substation that supplies the secondary network, the higher the available currents for the three-phase fault, the phase-to-phase fault, and the double phase-to-ground fault on the primary system. Primary Feeder Fault Currents addressed this area, and discussed some general measure for reducing the currents for multi-phase faults on the primary system. And as indicated before the currents for the single line-to-ground fault can be limited by use of resistor or reactor grounding of the system when applicable, as discussed in Chapter 4. Reasons for limiting the available currents for faults in the primary portion of the secondary network system are summarized below.
-
Lower interrupting rating required for medium-voltage circuit breakers in the substation.
-
Lower power and frequently energy input to faults in primary cables and splices.
-
Reduced arc flash energy levels for faults within the substation and manholes.
-
Reduced mechanical forces on substation buses and conductors.
-
Less heating in phase conductors and ground-return path conductors when faults are rapidly cleared with instantaneous current relays (50ϕ and/or 50G).
-
Low step and touch potentials during faults to ground.
When a limit has been established for the available currents for faults on the substation buses, and on the network primary feeders, the following measures are available to limit the fault currents.
-
Specifying higher impedances for substation transformers. However, as mentioned in General Design and Consideration, this measure results in more voltage drop during normal operation, which can be compensated for with voltage regulating equipment (transformer load tap changers, separate voltage regulators, and switched capacitors).
-
Phase reactors in the medium-voltage leads from the substation transformer to the medium-voltage buses which supply the network primary feeders.
-
Phase reactors in the network primary feeder, the effect of which was quantified in General Design and Consideration.
-
Neutral grounding resistors or reactors to limit the current for the single line-to-ground (SLG) fault. As discussed in Primary System Grounding, this also improves power quality for customers served from the network when the network transformers have the delta connected primary windings.
-
Operation with open bus-tie breakers on the medium-voltage side of the substation. The potential drawback of this approach is that different voltages are applied to the primary feeders of the network, which can result in poor load division in network transformers in multi-bank installations for the area network, and in spot networks. It also increases the chance of network protectors cycling, pumping, or failing to automatically close.
Network Feeder Voltage Synchronization
As will be quantified later in this chapter, the most favorable network load division and network protector operation results when the same voltage is applied to all network primary feeders at the substation. As discussed in General Design and Consideration, if the phase angle difference between the primary feeders at the substation equals or exceeds 3 degrees, spot network operation with all protectors closed is very unlikely. Equal load division in spot networks is desired not only because it generally results in the lowest losses in the network transformers in the spot, but it allows all network protectors in the spot network to stay closed at very low load levels on the spot network.
Preferably, the same voltage is applied to all primary feeders at the substation under normal conditions, and after clearing of a fault on any medium-voltage bus within the substation
Substation Bus Faults
Faults in substations are rare relative to the number of faults that occur on network primary feeders, either in cables or splices. Regardless, faults in the substation should not cause an outage to the load supplied from the secondary network. If the network is designed for the loss of just one primary feeder, then a fault on any medium-voltage bus in the substation should not take more than one primary feeder out-of-service. For networks designed for a double contingency of the primary feeders, a bus fault in the substation should not remove more than two primary feeders from service.
Substation Breaker Failure and Breaker Faults
Similarly, a fault in a circuit breaker in the substation or the failure of the circuit breaker to open, should not cause outages to customers supplied from the secondary network. Depending on the configuration of the medium-voltage buses in the substation, a fault in a circuit breaker, or the failure of a circuit breaker to open may result in the loss of one or more network primary feeders. This point will be seen from the discussion of the substation configurations in Low-Side Bus Configurations.
Power Transformer Failure
The medium-voltage buses in most substations supplying secondary networks are fed from at least two power transformers, or equivalent sources of generation, or a strong tie circuit operating at the same voltage as the medium-voltage buses that supply the network primary feeders. The station must be designed to carry the peak load with any one power transformer or other source for the medium-voltage buses out-of-service, for the time required to either connect a mobile transformer or spare transformer, or to repair the faulted transformer. During the outage of a main power transformer, the loading on the remaining in-service substation transformers may result in higher loss of life than occurs under normal conditions. Although such failures are infrequent, the transformers, generation sources, or tie lines must be specified to carry the contingency loading for the time required to replace the faulted source.
Maintenance Considerations
The substation that supplies secondary networks, just like other substations, should be configured and designed such that maintenance can be performed without causing an outage to the load served from the secondary network. It may be that the substation design permits maintenance during any time period, but in some situations, maintenance of certain components may be allowed only during periods of light load. The design must allow for isolation and grounding of those portions being maintained.
Low-Side Bus Configurations
This section contains single-line diagrams of substations that supply secondary networks. Included are comments on how they respond to some or all of the issues mentioned in Design Considerations of this chapter.
Two Bus design
The substation of Figure 1 supplies two four-feeder secondary networks, with network transformers for both the area network and the spot networks. The following observations should be made.
-
Loss of any one power transformer or generation source does not cause a network outage.
-
Each four-feeder network is supplied from a separate bus, either BUS 1 or BUS2. With this arrangement, the same voltage is applied to each feeder of each network at the substation. Good load division is expected in spot networks and in multi-bank installations supplying the area network.
-
A fault on BUS 1 or BUS 2 results in an outage to the entire four-feeder network supplied from the faulted bus. However, in place are switches for transferring the feeder breakers on the faulted bus to the un-faulted bus, following which the network can be re-energized by group (simultaneous) closing of the four feeder breakers.
-
The substation is designed such that if there is a loss of any two of the four feeders to a given network, the network is automatically shut down to prevent overloading of the network transformers on the two energized feeders, and overloading secondary mains of the area network.
-
Solid grounding is used for the medium-voltage windings (13.8 kV) of the 115 to 13.8 kV power transformers.
-
Phase reactors, 0.80 ohms nominal, are in each primary feeder to limit currents for both phase faults and ground faults.

Figure 1:
Substation for two four-feeder secondary networks.
Four-Bus Design with Open MV Tie Breakers
The substation configuration of Figure 2 supplies three four-feeder networks, the primary feeders for non-network load (multi-grounded neutral), feeders for normally open ties to other substations, and capacitor banks. There are four main power transformers connected to a ring bus on the HV side, such that the same voltage is applied to the HV terminals of each substation transformer. However, there are no tie breakers between the medium-voltage buses that supply the network primary feeders, the purpose being to limit the short circuit current on the non-network feeders. Each substation transformer is equipped with a load tap changer to control the voltage on the medium-voltage bus.
-
With no medium-voltage bus-tie breakers, voltage magnitude and angle difference can exist between the medium-voltage buses that supply the network primary feeders. These differences can result in poor load division, or network protectors cycling, pumping, or sitting open, even if the load tap changers for each transformer were to maintain the exact same voltage magnitude on each medium-voltage bus.
-
The loss of any one main power transformer, or a fault on any one medium-voltage bus, will remove just one network primary feeder from service for each network, creating only a single contingency condition.
-
Solid grounding is used for the neutral of the wye-connected medium-voltage winding of each main power transformer.
-
A three-phase fault on any MV bus section does not drop the voltage of the secondary system to zero.

Figure 2:
Substation with open bus-ties for supply to three
four-feeder secondary networks.
Multiple Substation Supply with MV Tie Lines
Figure 3 illustrates how a secondary network system in a medium-sized city is supplied at 13.8 kV from three different substations. There are 13.8 kV tie lines between the medium-voltage buses that supply the network primary feeders. Depending on the configuration of the buses in each substation, bus faults would not result in the loss of more than one primary feeder to the network, or the loss of more than one source transformers. Similarly, loss of one 115 kV transmission line to any one substation does not produce an outage to the network. Several points to be noted are:
-
Each source substation uses reactance grounding, with the Z0 to Z1 ratio at the substation ranging between 10 and 16.9. At the substation, the grounding of these systems would be classified as high inductance grounding (ANSI C62.92). Consequently, all transformers (network and non-network) supplied by the 13.8 kV system must have their primary windings connected between phases (in delta for the network transformers). With this class of grounding, multi-grounded neutral distribution primary feeders can’t be supplied from the 13.8 kV buses. Primary System Grounding discusses grounding of distribution primary systems.
-
The buses supplying the network feeders in Figure 3 generally do not have the same voltage magnitude and angle on them, which can result in poor load division in spot networks and in multi-bank installations in the grid network. The voltage difference between the substation buses only can be determined through power flow simulations, or by measurements. These voltage differences also can be determined from the 13.8 kV tie-line flows and the impedances of the tie lines.

Figure 3:
Supply to secondary network from multiple substations
with medium-voltage tie lines.
H Bus Design with Resistance Grounding
The substation configuration in Figure 4 has been used by one sizeable operator of secondary networks, and is referred to as the “H” bus design due to the arrangement of the 13.8 kV buses that supply the network primary feeders. The station has two main power transformers, each with double-wye secondary windings for supply of four 13.8 kV main bus sections, from which the network primary feeders originate. The following are noted:
-
Loss of any one 115 kV circuit or any one main power transformer does not cause an outage to the networks supplied from the substation (single-contingency design)
-
Resistance grounding is used for the 13.8 kV medium-voltage system. The current for the single-line-to-ground fault is limited to approximately 7967/2, or 3984 amperes when both main power transformers are in operation. This is considerably less than the three-phase fault currents, which could be in the range of 20 kA to 40 kA, depending mainly on the impedances of the substation transformers. With the medium-voltage windings of just one main power transformer connected to the buses, the ground fault current is limited to approximately 7967/4 or 1992 amperes.

Figure 4:
Network substation supplied from power transformers with
double-wye secondary windings and low-resistance grounding.
-
The same voltage is applied to each network primary feeder at the substation providing all 3000-ampere bus-tie circuit breakers are closed, resulting in well balanced load division in spot networks. If the system is operated with one or more 3000-ampere bus-tie circuit breakers open, to limit the current for multi-phase faults in the 13.8 kV system, poor load division, cycling or pumping of network protectors may be experienced in spot networks.
-
Each primary feeder to a given spot network must come from a different 13.8 kV bus section so that a bus fault causes only a single contingency for the spot network.
-
Primary feeders that supply the area network must be configured and interlaced such that a fault on a 13.8 kV bus does not result in an outage to any network supplied from the substation.
-
A fault on the tie bus does not result an outage to any network primary feeder. However, isolation of the tie-bus fault by opening of all four 3000-ampere bus-tie circuit breakers results in loss of synchronization between the four bus sections that supply the network primary feeders. This can cause poor load division, cycling, and pumping of network protectors.
-
A fault in a 3000-ampere bus-tie breaker removes from service all network primary feeders on the 13.8 kV bus section associated with the faulted bus-tie breaker, plus it results in loss of synchronization between the three 13.8 kV bus sections that remain in service.
H Bus Design with Reactance Grounding
Figure 5 shows another “H Bus” configuration that is supplying 23 network primary feeders operating at a nominal voltage of 13 kV.

Figure 5:
H Bus Substation supplied at two different transmission
voltage levels.
Note the following points about this “H Bus” design.
-
There are five power transformers in the station, but only four are connected to the system at any one time, to limit the current for the three-phase fault.
-
The power transformers are supplied from both 138 kV and 69 kV transmission circuits.
-
A fault on the 13 kV tie bus to which transformer T5 connects results in the primary feeders to the network being supplied from two non-synchronized sources. Such a fault could result in large circulating watt and var flows through the secondary network.
-
Although not shown in Figure 5, in this station neutral reactors are installed between the X0 bushing of the wye-connected 13 kV windings of each power transformer and ground, to limit the short circuit current for ground faults.
Double Tie-Bus Design for 12 Network Primary Feeders
Figure 6 shows a substation design that is dedicated to supplying 12 network primary feeders.

Figure 6:
Double tie-bus design for supply to 12 13.2 kV network
primary feeders.
From Figure 6, the following points should be observed:
- Each main power transformer, rated 30/48/69 MVA, has a delta tertiary winding, with the HV and MV windings connected in grounded-wye. Thus, each power transformer is a ground source for both the 138 kV system and the 13.2 kV system that supplies the network feeders. Each transformer has a +/- 10% load tap changer (LTC) range.
The X0 to X1 ratio of the 13.2 kV system on the bus is 0.69. The significance of this is that the current for the single line-to-ground (SLG) fault on the 13.2 kV bus is higher than the current for the three-phase fault. The grounding of the 13.2 kV system would be classified as “very effective”. Primary System Grounding discusses grounding.
-
There are two13.2 kV tie buses, Tie Bus 135, and Tie Bus 246 that keep the same voltage applied to all network feeders at the substation during unfaulted conditions, and for a fault on any bus section within the substation. The network primary feeders remain synchronized even for a fault on either 13.2 kV tie bus.
-
Each bus section for network primary feeders supplies two network feeders, and a bus fault causes a double contingency for the network. However, the network primary feeders are interlaced and the system designed to operate if two feeders from the same bus section are taken out-of-service. Good design practice is that in a given spot network, there would be no more than one feeder from each bus section in the substation.
-
Each capacitor bank on the tie bus is rated 21.6 MVAR, and can be switched in three 7.2 MVAR steps to help regulate voltage in the secondary network system.
-
In this particular system, the HV windings of the network transformers are connected grounded-wye.
Double Tie Bus Design for Network and MGN Feeders
Figure 7 shows a substation design similar to that in Figure 6, except that it serves ten network primary feeders, and two radial multi-grounded neutral (MGN) distribution feeders.

Figure 7:
Double tie bus configuration supplying both network
primary feeders and two radial MGN feeders.
The following characteristics should be considered.
-
The substation transformers are three-winding, with the neutral of the 13.2 kV medium-voltage windings grounded through a 0.7 Ohm neutral reactor. Further each substation transformer is a ground source for both the 138 kV HV system, and for the 13.2 kV medium-voltage system.
-
The neutral reactor Ohms were selected such that the X0 to X1 ratio on the 13.2 kV medium-voltage buses for the network feeders and radial multi-grounded neutral feeders is 2.60. Thus the 13.2 kV system satisfies the criteria for effective grounding, allowing it to supply 4-wire multi-grounded neutral (MGN) distribution feeders. Grounding classes are defined in Primary System Grounding.
-
With the double tie-bus configuration, a fault on any one bus section, including a tie bus fault, is isolated and the same voltage still is applied to all network primary feeders that remain in service.
-
The failure of a 13.2 kV bus-tie breaker drops either one or two primary feeders, depending on the bus-tie breaker that has the fault.
-
Each capacitor bank is 14.4 MVAR, switchable in three equal steps of 4.8 MVAR for voltage control and reactive supply.
Ring Bus Design for Six-Feeder Networks
Figure 8 shows a substation with the ring bus design for the 13.8 kV medium-voltage buses. This particular station has a seven-section ring bus, and supplies two six-feeder secondary networks, and non-network primary feeders. This arrangement has been used to supply more than two six-feeder networks. The following points are to be noted:
-
Outage of a main power transformer or loss of a 138 kV supply line does not produce an outage to any of the six-feeder networks supplied from the MV ring bus.
-
A fault on any one 13.8 kV bus section removes from service only one network primary feeder to each six-feeder network, creating only a single contingency for each network, and thus not causing a network outage
-
The network primary feeders remain synchronized (same voltage magnitude and angle applied at the station end) after isolating a fault on any one main section of the ring bus.
-
Isolating a fault in any one medium-voltage bus-tie breaker, such as BT 5-6 in Figure 8 results in loss of two main bus sections and an outage of two primary feeders to each network supplied from the bus sections. However, the four network primary feeders of each network staying in service remain in synchronism.
-
For a fault on a network primary feeder where the feeder breaker fails to open, if breaker failure protection is applied, only one bus section and one primary feeder to each network is removed from service.
-
Some non-network feeders have phase reactors, to limit short-circuit current to within the interrupting and momentary rating of the distribution equipment applied on the non-network radial feeders.

Figure 8:
Substation with 13.8 kV ring bus for supply of two
six-feeder networks and non-network primary feeders.
Breaker and Half Design
The breaker and half design found in transmission and sub-transmission substations also has been used for the medium-voltage buses in the substation supplying network primary feeders. Figure 9 is an example of this arrangement, where a main power transformer is connected to each medium-voltage main bus. The station is supplying just one six-feeder secondary network, and is a single-contingency design for loss of one main power transformer or loss of a source to a main power transformer.
The following points should be noted for the breaker and half configuration:
-
A fault on either main bus 1 or main bus 2 does not result in an outage of any network primary feeders, and the six primary feeders to the network remain synchronized.
-
A fault in any “outside” breaker connected to either main bus results in the loss of just one network primary feeder, which creates just a single contingency for the secondary network.
-
A fault in any “common” breaker, such as Breaker 5-6 results in the loss of two primary feeders to the network, which creates a double contingency for the secondary network.
-
Failure of a breaker to trip for a fault on the network primary feeder results in loss of two primary feeders to the network when cleared with backup protection.

Figure 9:
Substation with breaker and half configuration for supply
to one six-feeder secondary network.
Six Bus Synchronized Design
The substation configuration of Figure 10 supplies three six-feeder networks at a nominal voltage of 11.5 kV. Each six-feeder network system is designed for a single contingency. The following points should be noted.
-
A 69 kV ring bus is on the HV side in the substation with three 69 kV transmission lines.
-
Resistance grounding is used with each substation transformer, with a 3 Ohm resistor between the X0 bushing of the transformer 11.5 kV wye-connected windings and ground. This will limit the current for the single line-to-ground fault to 11,500/(√3*3) or 2213 amperes per transformer. With all three transformers connected to the 11.5 kV bus, the current for the SLG fault would not exceed 6640 amperes.
-
Each transformer is equipped with a load tap changer for voltage regulation.
-
A fault on any one 11.5 kV bus section causes only a single contingency to each independent six-feeder network supplied from the substation.
-
All network primary feeders to each network remain in synchronism for a fault on any 11.5 kV bus section, or for a fault in any one bus-tie circuit breaker.
As discussed in Primary System Grounding, the application of resistance grounding not only limits the current for the SLG fault in the 11.5 kV system, but it minimize the voltage dip (sag) in the secondary network for the SLG fault on a network primary feeder, which exists from the time of fault inception until the circuit breaker for the faulted primary feeder opens.

Figure 10:
Substation for supply to three six-feeder networks, with
resistance grounding.
Double Synchronizing Bus Design
Figure 11 shows a substation design of a utility in a large metropolitan area for supply of up to two sixteen-feeder secondary networks. Each network and the substation are designed to supply the peak load during a double contingency. This utility also has some substations which have a ring bus, H bus, or a split bus design, but the double syn bus design of Figure 11 is their most reliable arrangement. The following points should be made:
-
Five transformers are in the substation, but only four are paralleled on the 13.8-kV sides, so that fault currents are kept within the interrupting rating of the bus-tie circuit breakers and the feeder circuit breakers.
-
The substation transformers are sized and rated such that they can carry the peak load of the two networks with any-two substation transformer out of service, for the time period required to return to service one of the out-of-service transformers.
-
The neutral of the 13.8 kV wye-connected windings of each substation transformer is grounded through a reactor, selected such that at the substation the 13.8 kV system meets the requirements of low-reactance grounding (3 < X0/X1 < 10) as defined in ANSI C62.92. See Table 1 in Primary System Grounding.
-
Substation transformers have load tap changing mechanisms, which operate in conjunction with switched capacitor banks on the 13.8 kV buses to regulate voltage in the secondary network, and to limit circulating currents between the main power transformers.

Figure 11:
Substation with reactance grounding and double
synchronizing buses for supply to two 16 feeder networks.
-
Four network primary feeders are supplied from each of eight “minor” bus sections. A fault on a minor bus section results in loss of two primary feeders to each network, but the networks are designed for such double contingency conditions.
-
A fault in any primary feeder breaker, transformer breaker (XFR), or synchronizing breaker (SYN) does not remove more than two primary feeders from service for each network. Furthermore, under these conditions the network primary feeders remaining in service stay synchronized (same voltage applied to all feeders).
-
For a fault on either the West Synchronizing Bus, or the East Synchronizing Bus, the 32 network primary feeders remain synchronized through the “unfaulted” synchronizing bus. When substations with this design have only one synchronizing bus, a fault on the synchronizing bus results in the loss of synchronization between network primary feeders. Should this happen, there can be large circulating currents and power flows through the network, which might cause a network outage.
Figure 12 is street-side view of a substation that utilizes the double-syn bus design, for supply of up to two sixteen-feeder secondary networks.

Figure 12:
Street-side view of a substation with the double
synchronizing bus design (photo by author).
Substation With High-Reactance Grounding
Figure 13 shows a network substation for supply to four six-feeder secondary networks, from six 13.2 kV bus sections. There are six main power transformers in the station, connected grounded wye on the 115 kV side, and delta on the 13.2 kV side. The following points should be observed.
-
The substation main power transformers are a ground source for just the 115 kV system.
-
Connected to the secondary winding of each main power transformer is a zig-zag grounding transformer, having an impedance such the 13.2 kV system is high-reactance grounded (X0/X1 > 10.0). This limits the currents for the single line-to-ground fault on the 13.2 kV buses and on the network primary feeders to less than 25% of the current for the three-phase fault.
-
A fault in any main power transformer or its grounding bank does not cause an outage to any network primary feeder.
-
A fault on any one 13.2 kV bus does not drop more than one feeder to any six-feeder network.
-
A fault in any one 13.2 kV bank breaker does not drop more than one feeder to each six-feeder network.
-
Under normal conditions, the same voltage (magnitude and angle) is applied to the network primary feeders fed from 13.2 kV buses 1, 2, and 3. Further the same voltage is applied to the network primary feeders supplied from 13.2 kV buses 4, 5, and 6. But the voltage on buses 4, 5, and 6 is different in magnitude and angle from the voltage on buses 1, 2, and 3.
-
Capacitor banks are on the 13.2 kV buses to supply the reactive requirements of the network. There is one 6.0 MVAR bank on each 13.2 kV bus. With each capacitor bank there is a 40 μH inductor to limit the inrush current during capacitor bank (back-to-back) switching.

Figure 13:
Substation for six feeder networks with high-reactance
grounding of the 13.2 kV system.
Novel High-Capacity Substation with Current Limiting Devices
Figure 14 shows a novel substation configuration for supply to multiple six feeder networks, of which only two are shown in the figure. In effect there are two 13.8 kV ring buses, which are interconnected through one circuit breaker, #460, and a current-limiting device, labeled ISL 460. Further there are four 45 MVA 16% impedance transformers feeding the two interconnected 13.8 kV ring buses.
If the two ring buses are connected together without the current-limiting device in the interconnection between the two rings, the short circuit current for faults on the 13.8 kV buses or on the network feeders close to the substation would exceed the allowed level, which is 25 kA. The reason for limiting the fault current to 25 kA is that sectionalizing switches are to be installed on the network primary feeders, and the switches momentary rating is 25 kA.
For faults on either ring bus, or faults on a network feeder close to the station, where the fault current would exceed 25 kA in absence of the current-limiting device, ISL, the ISL device operates to limit the short circuit current to 25 kA, following which the circuit breaker in series with the ISL device opens. So, if there is a fault on 13.8 kV bus section 3 in the top ring, ISL device 460 will limit the short circuit current to 25 kA or less, and then breaker 460 opens. This disconnects the two closed ring buses. But the system is automated to close a second ISL current-limiting device and its circuit breaker on the opposite side of the ring to reconnect the two 13.8 kV ring buses. This is achieved by closing of breaker 468 and ISL 468. Then ISL 460 that operated to limit the fault current is replaced for use at a later time. Note that if the ISL device and breaker to reclose was on the same side of the ring, it could reclose into a faulted bus section. For example, with the fault on bus 3 in Figure 14, reclosing breaker 461 and ISL 461 would re-energize faulted bus 3.

Figure 14:
Interconnected double ring bus with current-limiting
device in interconnection
The following points should be noted for this substation.
-
The same voltage is applied to each primary feeder of each six-feeder network under normal operating conditions.
-
Should a fault occur on any bus section of either ring, it is isolated, resulting in just one feeder being removed from service from each network.
-
Following isolation of a fault on any one section of a 13.8 kV ring bus, the voltage applied to the remaining five feeders supplied from the ring with the fault is the same. Thus, load division in spot networks and multi-bank installations for the grid network should be good following isolation of a fault on a 13.8 kV bus section.
The picture in Figure 15 shows the new Denny Substation of Seattle City Light, under construction, which employs a scheme similar to that for the substation in Figure 14. The ultimate buildout of this substation will supply 24 13.8 kV network feeders for 4 and 6 feeder subnetworks.

Figure 15:
Seattle City Light Denny Substation employing a version
of the scheme for the system in [Figure 14](#figure-14) (courtesy SCL).
Figure 16 shows a picture of the new Marquam Substation that Portland General Electric constructed for supplying secondary networks in downtown Portland Oregon. On the 12.47 kV side which supplies the network primary feeders, a ring bus configuration is used.

Figure 16:
Portland General Electric new Marquam Substation for
supply of secondary networks (courtesy PGE).
Feeder Breaker Faults
Relaying and control should be incorporated into the substation design to isolate a faulted feeder breaker within the substation, without causing an outage to the secondary network(s) supplied from the substation. Figure 17 shows a substation bus section with a faulted network feeder breaker, with all other breakers connected to the faulted bus section being open. Faults in the feeder breaker could be on either side, or both sides of the breaker main contacts, or they could be in the main contacts if the breaker uses vacuum bottles for the interrupters. Isolating and de-energizing the faulted feeder breaker requires isolating the bus section that normally supplies the faulted breaker by opening of all circuit breakers connected to the bus, as well as all sources of backfeed on the feeder supplied by the faulted breaker.

Figure 17:
Network transformer backfeeding a fault in a primary
feeder breaker.
If a faulted feeder breaker is for a radial feeder, all major sources of energy are removed when the bus section with the faulted feeder breaker is isolated. The exception would be if a synchronous generator or other source were connected to the radial feeder. But with a fault in the breaker for a network primary feeder as in Figure 17, in general, the faulted circuit breaker will not be cleared by just isolating the bus section to which the faulted feeder breaker is connected. In addition, all backfeeding network protectors on the feeder must open.
For a fault in the feeder breaker, with the bus section for the faulted feeder breaker isolated from other buses and sources in the substation, the closed network protectors on the feeder with the faulted breaker will have a high backfeed currents for the three-phase fault, phase-to-phase fault, and the double phase-to-ground fault. For the single line-to-ground (SLG) fault, the backfeed current in the faulted phase will be high if the network transformers have the wye-grounded connections for the primary windings, But if the network transformers have the delta connected primary windings, the backfeed currents are limited by the capacitance to ground of the primary feeder, and the current will be relatively low.
For the multi-phase fault, before the backfeeding network protector opens, and with the bus section with the faulted feeder breaker isolated, the backfeed currents can be quite high, depending on the size of the network, the total capacity of the network transformers on the feeder, and the available fault current in the substation. The backfeed current into the faulted breaker will decrease as the backfeeding network protectors open sequentially. Depending on network protector relay sensitive trip time, and network protector total clearing time, the backfeed from the network can be removed in less than several tenths of one second, especially if all of the network protectors are equipped with microprocessor relays, following isolation of the substation bus section with the faulted breaker.
However, if one or more backfeeding network protectors fail to open, as depicted in Figure 17, considerable current is backfed to the feeder breaker with a multi-phase fault until the network protector fuses blow. The magnitude of the backfeed current in a system with 13.2 kV primary voltage can exceed 1200 amperes with just one backfeeding 2500 kVA 7% impedance network transformer in a five-unit 480-volt spot network. The time to clear the backfeed current depends upon the type of fuse in the backfeeding protector, but this time can exceed 60 cycles. With more than one protector on the feeder failing to open, the backfeed current to the fault in the feeder breaker will be much higher than 1200 amperes.
In most, if not all secondary network systems in operation, no additional protection is installed to clear a backfeed to a faulted network feeder breaker, other than that provided by the normal tripping of the protector, and if a protector fails to trip, the protection is provided with the network protector fuse. Thus, the time to clear a faulted feeder breaker in a substation supplying network primary feeders is higher than if the breaker were for a radial feeder. More energy is supplied to the faulted feeder breaker in a network system, especially if a network protector fails to open. Backfeed currents for different fault types, and factors affecting the backfeed current, which affects protector fuse clearing time, are discussed and quantified in Network Unit Equipment.
Faults in feeder breakers, or on the feeder at the breaker terminals, can result in significant momentary voltage dip in the secondary network, depending on the type of fault, and the configuration of the substation medium-voltage buses that supply the network. The most significant dip occurs for the three-phase fault. In systems operating with closed medium-voltage bus-tie breakers in the substation, the three phase-to-ground voltages in the network can drop to less than 5% of nominal for a bolted three-phase fault in the feeder breaker, or for the bolted three-phase fault on the feeder at the feeder circuit breaker line terminals.
For the fault in the feeder circuit breaker, the duration of the dip is the time to isolate the bus section with the faulted feeder breaker. Following isolation of the bus, the voltage in the network will rise up, but not to normal values. The value to which they rise depends on network topology and system impedances. The network voltages return to near normal following opening of the last backfeeding network protector on the primary feeder whose breaker has faulted.
For the fault on the feeder at the feeder breaker terminals, the duration of the dip in the secondary network is the time between fault inception and opening of the breaker for the faulted feeder. After the breaker for the faulted feeder opens, the voltage in the network will rise up from near zero, but not to normal voltage until all backfeeding protectors open. The concern with this fault is the performance of the power supply of the microprocessor network protector relay. For a three-phase fault, the voltage at the backfeeding protector drops to near zero until the faulted feeder breaker opens. After the circuit breaker for the faulted feeder opens, the network voltage rises back up to a value which can be much less than nominal. It is important that the microprocessor network relay can function during this voltage dip and return to less than nominal voltage.
Voltage Regulation and Capacitors in Secondary Network Systems
The voltage in the secondary network must be regulated such that at the service it falls within range A in the ANSI C84.1 standard, which is 120 volts plus or minus 5%. To regulate the voltage in the secondary network, the voltage on the substation medium-voltage buses that supply the network primary feeders is regulated.
In secondary network systems, all voltage regulating equipment is located within the substation. For most utilities, this equipment must function to keep the voltages in the LV 208Y/120-volt grid system at the service, and in 480-volt spot networks within range A as defined in ANSI C84.1, or by the jurisdiction having authority, during normal and contingency conditions. Range A in ANSI C84.1 is plus or minus 5% from nominal 120 volts. The lower limit is 114 volts, but many utilities do not allow the service voltage to drop down to 114 volts during normal and first contingency conditions.
The voltage regulating equipment in the substation must compensate for the variation in the transmission system voltage that supplies the substation main power transformers, for the voltage drops in the substation transformers, in the network primary feeders, in the network transformers, in the secondary of the grid network, and in the services to customer meters. Table 1 lists in the first column two nominal system voltages for secondary networks, in the second column the nominal utilization voltage associated with nominal system voltage, and the limits applicable to Range A for both the service voltage and the utilization voltage in the last three columns of the table.
Table 1:
Nominal Voltages and Range A Limits
Nominal System Voltage |
Nominal Utilization Voltage |
Voltage Range A | ||
|---|---|---|---|---|
| Maximum | Minimum | |||
Utilization & Service Voltage |
Service Voltage |
Utilization Voltage |
||
| 208Y/120 | 200 | 218Y/126 | 197Y/114 | 191Y/110 |
| 480Y/277 | 460 | 504Y/291 | 456Y/263 | 440y/254 |
Voltage Drop in Primary Feeders
The voltage drop in a network primary feeder depends upon the cable size (impedance per unit length), the feeder length, the current, the power factor, and the load distribution. Figure 18 shows the voltage drop in a primary feeder in percent per 1000 feet of length per 100 amperes of current, as a function of power factor, for a system operating at a nominal voltage of 13.2 kV. The curves are for feeders made with single-conductor copper cables with a flat-strap neutral (shield), having the positive-sequence impedance characteristics given in the figure, with the current constant along the feeder. If the feeder were made from three-conductor PILC cables, the impedance and voltage drop would be somewhat less than shown in Figure 18.

Figure 18:
Voltage drop in 13.2 kV primary
The curves in Figure 18 give the voltage drop assuming that the current is constant in the section of feeder. This is the situation in the express portion of a primary feeder between the substation and the first network transformer on the feeder. When the load is uniformly distributed on the feeder section with the load current at the end being zero, the voltage drop is exactly one-half of that which occurs when the load current is constant in the feeder section.
Also listed in Figure 18 is the approximate ampacity of the three different size cables, based on the ambient temperature and duct bank parameters listed in the footnote on the plot. Table 2 shows at 85% power factor the voltage drop in percent per 1000 feet per 100 amperes, and the voltage drop in percent per 1000 feet at rated ampacity for a system operating at 13.2 kV.
Table 2:
Voltage Drop in Primary Feeder, in Percent per 1000 feet
(85% PF).
Cable Size (kcmil) |
Circuit Rating (A) |
Voltage Drop (%) | |
|---|---|---|---|
At 100 Amperes |
At Rated Capacity |
||
| 350 | 343 | 0.0649 | 0.223 |
| 500 | 413 | 0.0518 | 0.214 |
| 750 | 503 | 0.0417 | 0.209 |
From the last column of Table 2, at rated ampacity, the voltage drop in percent is nearly independent of cable size for the single-conductor primary cables in the example. The voltage drop is approximately 0.215% per 1000 feet at rated ampacity, which is 0.258 volts on a 120-volt base. For a circuit 1 mile in length with the current constant throughout its length, at rated ampacity the voltage drop would be 1.36 volts on a 120-volt base.
If instead the primary nominal voltage were 23 kV or 34.5 kV, the voltage drop in percent per 1000 feet at rated ampacity would be less than in Table 2. This is because the impedance in ohms of the cables in the higher voltage system does not increase by the same factor as the voltage. For example, the ratio of 23 kV to 13.2 kV is 1.74, but the impedances of cables in the 23 kV system, with the same ampacity rating as in a 13.2 kV system, is less than 1.74 times the cable impedance in a 13.2 kV system.
Voltage Drop in Network Transformers
The voltage drop in a network transformer at transformer rated current is significantly greater than the voltage drop that occurs in one mile of primary cable at rated ampacity of the cable. Figure 19 plots the voltage drop in percent in network transformers having a leakage (nameplate) impedance of 5%, at loadings of 100%, 140%, and 30% of nameplate rating. The highest X to R ratio considered is 8, because higher values usually are no found in network transformers with 5% impedance.

Figure 19:
Voltage Drop in 5% impedance network transformers.
At a power factor of 85% and a load of 100%, the voltage drop varies between 3.13% and 3.59%, depending on the X-to-R ratio of the network transformer leakage impedance. For a network transformer with a secondary winding rated 208Y/120 volts, this corresponds to 3.77 volts to 4.11 volts on a line-to-neutral basis. However, with a contingency the load on the network transformer might be as high as 140% of transformer rating, and still be within the rated current of the network protector applied with the network transformer, depending on protector sizing practices. At 140% load on the network transformer, the voltage drop is between 4.40% and 5.02% at 85% power factor load, much greater than the drop in one mile of cable in a 13.2 kV primary circuit that is carrying rated current. But at light load conditions, say 30%, the voltage drop at 85% power factor is only about 1.0%, or 1.2 volts on a line-to-neutral basis.
To limit voltage-drop in network transformers during double contingency conditions, where the loading may exceed 150% of rating, Con Edison of New York uses network transformers for the 208Y/120-volt area network having 4% impedance. Another advantage of having 4% impedance in network transformer for the 208Y/120-volt grid network is that it gives higher backfeed currents for multi-phase faults to blow the protector fuses should the protector fail to open.
In network transformers rated 1500 kVA and above, the standard impedance is 7%, and the voltage drop on a 120-volt basis is significantly higher than in 5% impedance network transformers.
Voltage Drop in Secondary Cable Circuits
Voltage drop occurs in secondary mains and in services of the network system. Figure 20 plots the voltage drop in a set of 500 kcmil phase grouped unleaded cables, used for either secondary mains of for a service. Secondary Grid Design describes the phase grouped and phase-isolated configurations, and compares the impedance of LV circuits made with the two cable configurations. Figure 20 gives the voltage drop in millivolts per ampere per foot of circuit length, versus the power factor of the load current in the cable set. If multiple sets of phase-grouped cables are paralleled, for practical purposes the total current splits equally between the parallel sets. The voltage drop in each set is equal to the product of the total current divided by the number of sets, the result times the impedance of one set of cables.

Figure 20:
Voltage drop in 500 kcmil phase grouped cable circuit.
In Figure 20, the voltage drop is given assuming that the three phase cables are either triplexed, or else cradled in the bottom of the duct. For the cradled configuration the positive-sequence reactance is higher, giving a higher voltage drop than with the triplex configuration. The dashed curve gives the average of the voltage drop with the cradled configuration and the triplex configuration.
The magnitude of the voltage drop that occurs on a service with 500 kcmil copper cables can be found from Figure 20. Assume a 208Y/120-volt service, 40 feet in length with a current of 450 amperes per set of cables. Also assume the cables are cradled in the bottom of the duct, and the power factor is 85%. From Figure 20, the voltage drop is 0.040 mVolts/ampere/foot at 85% power factor. Thus, the voltage drop in the 40 foot service at 450 amperes per set is 0.72 volts, or 0.6% on a 120-volt base.
Voltage Regulation Schemes
The preferred method in most situations is to supply the secondary network from one substation with the medium-voltage bus-tie breakers closed, as illustrated in Figure 4 through Figure 11. With closed bus-tie breakers, the same voltage is applied to all primary feeders. As mentioned numerous times before, this arrangement gives the most stable operation of network protectors in both the grid network and spot networks.
Load Tap Changing Transformers and Feeder Regulators
In the systems of Figures 4 through 11, the substation load tap changing (LTC) transformers are operated in parallel when the transformers are connected to a common electrical bus on the HV Side. When the LTC transformers are operating in parallel, the LTC control equipment is to achieve two basic objectives.
-
The transformer LTC units must continue their basic function of controlling the voltage at the load bus as prescribed by the LTC control.
-
The transformer LTC units must act so as to minimize the current that circulates between the parallel LTC transformers in the substation, as would be due to the tap changers operating in different positions. With the leakage impedance of the substation transformers being primarily inductive, different tap positions will circulate vars through the substation transformers.
When there is a single LTC transformer in a distribution substation supplying one or more radial feeders, the voltage regulator can be equipped with a line-drop compensator that will hold the voltage at the regulation point or load center downstream from the LTC transformer. However, if there are two or more LTC transformers in the substation that are paralleled on both the HV and MV sides, as in a typical substation supplying secondary networks, the standard line-drop compensator will not function. With the standard line-drop compensators on two parallel transformers, one load tap changer will rise to the maximum position, and the other load tap changer will lower to the minimum position, giving excessive circulation currents between the two transformers, which corresponds to a var circulation.
Different methods are available for controlling LTC transformers that operate in parallel. Three common methods are the reverse reactance control method, the circulating control method (also called the current balance method), and the out-of-step control method. With the reverse reactance control method, it is not necessary to have electrical or mechanical interconnections between the regulator control circuits of the paralleled transformers. Also, electrical connections are required between the regulator control circuits with the circulation control method and with the out-of-step control method. A detailed description of these methods is beyond the scope of this chapter. Moreover, with either method of control for parallel transformers, the circulating current can be controlled to an acceptable value, and the control can be equipped with line-drop compensation so the voltage can be regulated, not on the medium-voltage bus in the substation, but at a fictitious load center within the LV network system.
Considering the voltage drop occurring in the network primary feeders, and particular in the network transformers at rated load current, the voltage maintained on the substation medium-voltage buses supplying network primary feeders must be near or above the top of Range A voltage if the voltage at the secondary terminals of the network transformers is to be near the top of range A. Also, as the loading on the network increases, in particular during contingency conditions, higher voltages are required on the substation medium-voltage bus to maintain the same voltage in the network. Furthermore, in deciding on the voltage to hold on the substation medium-voltage bus, the rated voltage of the secondary windings of the network transformers, either 216Y/125 volts or 208Y/120 volts, must be considered in the analysis.
The primary feeders for the secondary network may come from the same electrical bus in the substation, but supplied by transformers without LTC, as shown in the system in Figure 21. In this system, the bus sections that supply the network primary feeders are fed from a four-section medium-voltage ring bus fed by two substation transformers. Since the transformer medium-voltage windings are connected in delta, a separate grounding bank (grounded-wye delta) is applied with each power transformer.
In this system, there are eight primary feeders, two from each bus section, with individual voltage regulators in each primary feeder. Also supplied from the four-section ring bus, but not shown, are non-network primary feeders.
With the arrangement in Figure 21, the voltage applied to each primary feeder at the substation bus has, for practical purposes, the same angle. This limits the circulating current between primary feeders from angle difference on the buses. The circulating current from angle difference causes primarily a circulation of watts thru the primary feeders and secondary network. Because network protectors trip basically on the flow of reverse watts, individual feeder regulators as in Figure 21 generally do not cause closed protectors to trip, or cycle, or pump when the regulators are supplied from the same electrical bus in the substation, except possibly at times of very light loading on the network. However, if network protectors are open on a feeder, they may not close if the feeder voltage magnitude is low.
When the regulators in the feeders are on different taps, this causes primarily a var circulation between the primary feeders through the secondary network. The effect of different taps can be seen by examining the response of a two-unit spot network as shown in Figure 22, or a multi-bank installation in an area network.

Figure 21:
Substation for LV network supply with individual voltage
regulators in each primary feeder.
In Figure 22, the two-unit spot network is located close to the substation, such that the voltage applied to the HV terminals of each network transformer equals the output voltage of the feeder regulator. Given in the figure are the pertinent data for the 500 kVA 216-volt network transformers and protectors, and the trip and close characteristics and settings for the network relays. Network Protector Relaying discusses network relay characteristics and settings. For this illustration, the network relay has a true watt trip characteristic (trip curve perpendicular to the network line-to-ground voltage, which is a 90-degree trip-tilt angle).
The data in Table 3 show the effect of different tap positions for the voltage regulators on the network load at which one protector in the two-unit spot network trips, and following the opening, the network load needed for auto reclose of the protector. It is assumed that the voltage change per tap position on the regulator is 5/8%, which is 0.75 volts on a 120-volt base. From the first row of data in Table 3, when the regulators in each feeder have the same tap position, both protectors stay closed when there is zero load on the spot network. If the protector supplied from feeder 1 were opened, for whatever reason, it automatically recloses when the load on the spot network reaches 154 kVA, which is 30.8% of the rating of the 500 kVA network transformer. This is a typical load needed for auto close in a two-unit spot network when the load power factor is 85%, with network relays having the straight-line close characteristics and a 1.5 volt zero-degree closes setting (V0).
From the second row of data, if the regulator for feeder 1 is one tap position below that for feeder 2 regulator, network protector 1 trips at a network load of 6 kVA, but will not auto reclose until the load on the network transformer with closed protector rises to 45.8% of the rating of one network transformer. That is if the regulator for feeder 1 is just one tap position below that for feeder 2 regulator, about 50% load must be on the spot network for automatic reclose of the protector on feeder 1.

Figure 22:
Two-unit spot network with voltage regulators in each
primary feeder.
Table 3:
Network Load for Trip and Auto Reclose of network
protector 1 (NWP 1) on 500 kVA transformer.
Feeder 1 Regulator Tap Position Relative To Feeder 2 |
Network Load at Trip of NWP1 (KVA) |
Network Load @ 85% PF For Auto Reclose of NWP 1 |
|
|---|---|---|---|
| Same | No Trip | 154 kVA | 30.8% |
| 1 tap below | 6 | 229 kVA | 45.8% |
| 2 taps below | 15 | 305 kVA | 61.0% |
| 3 taps below | 25 | 391 kva | 78.2% |
The last two rows of Table 3 show the effect of feeder 1 regulator being either two or three taps below the tap position for the regulator for feeder 2 (two tap positions corresponds to a voltage difference of 1.5 vols on a 120-volt basis, and three taps corresponds to a voltage difference of 2.25 volts). Although being three taps down has minimal effect on the network load needed to keep both protectors closed (25 kVA or 5% of network transformer rating), the spot network load needed for auto reclose of the open protector is 78.2% of the kVA rating of one network transformer.
With individual feeder regulators as in the configuration of Figure 22, ideally the regulators are set and controlled such that they are on the same tap. Furthermore, if the control units for each regulator were identical, with the same set point, same bandwidth, the same time delay, and the feeder regulators supplied from the same electrical bus, they would operate on the same tap position, or at most with only one tap step difference, providing there was no line-drop compensation for the regulator control circuits. In contrast, if the regulators had line drop compensation, the regulators could assume different tap positions if the loading on the feeders was different.
In addition, with reference to Figure 22, the configuration with the two network transformers and regulators is similar to that when two LTC substation transformers are paralleled on their HV and MV sides in the substation. As such, if the regulators in the network feeder had line-drop compensation with a positive reactance setting, it is possible that one of the regulators would run to the maximum boost position, and one would run to the maximum buck position.
Network Feeder Phase Reactors
As shown by the single-line diagrams in Figure 1, and Figure 21, some utilities install phase reactors in the network primary feeders (0.8 Ohms and 0.49 Ohms respectively). When reactors are in the primary feeders at the substation, under normal loading there is a drop in voltage across the reactor, but of greater concern is the phase angle shift that occurs in the reactor between the bus side and the feeder side. This phase shift can be significant, as shown by the curves in Figure 23 for a 0.49 Ohm 400 ampere reactor.

Figure 23:
Phase shift in a 0.49 Ohm 400 ampere feeder phase
reactor versus reactor current.
What affects the performance of the network protectors in spot networks fed from feeders with phase reactors, connected to medium-voltage buses with closed tie breakers, is not the magnitude of the phase shift in degrees in any one reactor, but the difference in the angle of the voltages at the feeder side terminals of the reactors. From the curves of Figure 23, if the reactors in each feeder are carrying the same current, the phase shift is the same, and the difference in angle on the feeder side of the reactors is small. But if the reactors in one feeder were carrying 400 amperes at 85% power factor, and the reactors in another feeder were carrying 200 amperes at 85% power factor, the angle of the voltage on the feeder side of the reactor with 400 amperes would lag that on the feeder side of the reactor with 200 amperes by about 0.7 degrees. This will cause unequal watt flows in a spot network or multi-bank installation. What is important when feeder phase reactors are installed is that the current loading on each feeder be about the same to minimize the angle difference between the network feeders.
Substation Capacitor Banks
Most loads supplied from the secondary network have a lagging power factor, unless the network customers have installed power factor correction capacitors on their own systems. Further, most utilities do not install capacitors on the spot network paralleling buses and in transformer vaults or in manholes for the street network. Consequently, the reactive power requirements of the secondary network system must be supplied from the substation feeding the secondary network. Although the capacitance of primary cable from the substation to the network transformers will supply some reactive power, it usually is a small portion of the reactive load requirements of the network load. With 15 kV class network primary voltage levels, the reactive kVA supplied per mile of cable may be in the range of 30 to about 60 kVAc, depending on cable size and type.
Capacitors on Network Primary Feeders
On dedicated network primary feeders, having network transformers with the delta connected primary windings, capacitor banks should not be located on the primary feeder, downstream of the feeder breaker. If this is done, it can result in excessive overvoltages in the secondary network during backfeed should a network protector fail to open, either for a balanced backfeed, or backfeed to a single line-to-ground fault on the primary feeder. The reactive requirements of the network are usually supplied by switched capacitor banks on the medium-voltage buses in the substation that supply the network primary feeders. Overvoltage that can occur in the network during backfeed from excessive cable charging are discussed in Network Overvoltages During Backfeed.
Capacitor Banks on Substation Medium-Voltage Buses
To control the voltage in the network, the voltage on the substation medium-voltage buses that supply the network feeders usually is regulated with load tap changing substation transformers, and capacitors applied to the medium-voltage buses. Some utilities have a schedule showing the voltage to hold on the medium-voltage bus at different times in the day.
When the substation operates with closed medium-voltage bus-tie breakers (ring bus, breaker and half, double synchronizing bus etc.), the same voltage is applied to each network primary feeder at the station. With high impedance substation transformers, it may not be possible to regulate the voltage with just the transformer load tap changers. However, the addition of switched shunt capacitor banks to the medium-voltage buses will help with the voltage regulation provided by the load tap changing transformers.
The benefits of applying capacitor banks on the medium-voltage buses in the substation that supplies the network primary feeders are well known, and will be briefly reviewed.
-
Reduce power (I2R) losses in the substation transformers.
-
Cause a voltage rise on the substation medium-voltage bus when the capacitor bank is switched on.
-
Release capacity in the substation transformer so that additional network load can be served without increasing the loading on the substation transformer.
Reduced Power Losses
Figure 24 shows a substation transformer, supplying a load fed from the medium-voltage bus drawing current IL, a capacitor bank with current IC, and the current in the substation transformer, IT. Rigorously a capacitor bank is a constant reactance device, but it can be considered as a constant current sink as shown. Without the capacitor, the transformer current IT is the same as the load current, IL, and the losses in the substation transformer are due to IL. However, when the capacitor is added, it supplies some of the reactive current drawn by the network load, IL, which then reduces the magnitude of the current in the substation transformer, and consequently the losses in the substation transformer. This is seen from the phasors in Figure 24.

Figure 24:
Current phasors for load current, IL,
capacitor current, IC, and substation transformer current,
IT.
Figure 25 plots the reduction in losses in the substation transformer versus the capacitor bank current (kVAr size) in per unit of the load current (kVA size), for load power factors of 80, 85, 90, and 95%. The poorer the load power factor, the greater the reduction possible for the I2R power losses in the substation transformer. Significant reduction in losses in the substation transformers can be realized by application of capacitors in the substation.

Figure 25:
Reduction in I2R losses in substation
transformer versus the capacitor current IC in per unit of
the load current IL.
Given with each curve in parentheses in Figure 25 is the capacitor size that produces the greatest possible reduction in I2R losses, and the maximum possible reduction in losses. Further, note from each curve that a significant reduction in losses is possible even when the capacitor size is not exactly the value that maximizes the reduction in losses.
Voltage Change from Switching Capacitor Bank
Whenever capacitors are on the medium-voltage side of the substation transformers for the secondary network, they produce a step change in the steady-state voltage on the medium-voltage bus to which they are connected when switched either on or off. The step change in bus voltage in percent of nominal voltage caused by switching the capacitor bank can be estimated with eq (1).
(1)
$$ \ \ \ V_{ RISE } = 100\frac{MVA_{C}}{MVA_{SC}} $$
In equation (1), the terms are as follows
MVASC = Available three-phase short-circuit capacity on the medium-voltage bus supplying the capacitor bank.
MVAC = Nominal three-phase MVA rating of the capacitor bank.
For example, assume the capacitor bank is rated a nominal 10 MVAR, and the available three-phase fault MVA on the nominal 13.2 kV bus to which the capacitor is connected is 750 MVA (32.8 kA at 13.2 kV). Switching the capacitor would produce a steady state voltage change of about 1.33% on the bus. On a 120-volt basis, this corresponds to a change of 1.6 volts rms. Recognize that these calculations are approximate, because the capacitor is a constant reactance, not a current source [ ICAP = 1000 MVAC/(√3*KVϕϕ)] based on the capacitor nominal MVA and kV ratings. However, the results of the approximate calculations are valid for estimating the effect of the capacitor switching on bus voltage, and are in good agreement with more accurate results obtained with detailed modeling with a load flow program.
When capacitors are switched on medium-voltage buses in substations supplied from transformers with load tap changers (LTC), or individual voltage regulators, the control for switching the capacitors must be coordinated with the control for operating the LTC. Considered would be regulator set points, bandwidths, line drop compensation if utilized, circulating current control, and step changes in voltage produced by capacitor switching. Further, when capacitors are connected to the MV buses, they can produce transient overvoltages, and high-frequency inrush currents in the capacitor banks. Transients from capacitor switching can be reduced by inserting small inductors in series with the capacitor banks, or using switching devices that either insert resistance during the capacitor switching, or control the switch closing based on the angle of voltage wave on both sides of the open switch.
In addition to causing a change in bus voltage magnitude when the capacitor is switched on, the angle of the bus voltage will change. Contrary to common belief, the angle of the bus voltage will lag slightly its initial angle prior to connecting the capacitor to the bus.
When the substation supplying the low-voltage network operates with closed MV bus-tie breakers, the connection or disconnection of capacitor banks on the MV bus will have virtually no effect on circulating watts and circulating vars in the primary feeders of the network. Consequently, switching of capacitors on the MV buses in the substation, practically, will have no effect on the operation of network protectors (cycling, pumping, preventing closure), and needs not be considered by system operators in the decision-making process to switch substation capacitor banks.
In contrast, when the MV bus-tie breakers are open at the substation supplying the network primary feeders, as in the system in Figure 2, switching of capacitor banks will affect both the circulating watts and circulating vars in the primary feeders of the network. This is because the switching changes both the magnitude and angle of the bus voltage to which the capacitor is connected. Thus, switching of capacitor banks in systems with open bus-tie breakers can have adverse effects on the operation of network protectors, particularly in lightly-loaded spot networks. This should be considered in designing substations that supply secondary networks.
Substation Transformer Released Capacity
In addition to reducing voltage drop and I2R losses in the substation transformer, capacitor application on the MV buses can release capacity, thereby allowing the supply of more network load from the medium-voltage buses in the substation without increasing the MVA loading on the substation transformer. Stated another way, it allows serving more network load without increasing the size of the substation transformers. This principal can be seen from Figure 26
In Figure 26, the load supplied to the network is designated as KVA1, shown with the red colored vector, and this is the loading on the substation transformer when there is no capacitor connected to the medium-voltage bus. The dashed red arc is a locus of constant kVA equal to KVA1. The rating or output of the capacitor is KVAR shown in blue in Figure 26. Adding or connecting the capacitor reduces the loading on the substation transformer from KVA1 to KVA2. The released capacity is the additional network load that can be supplied, after the capacitor is connected, without exceeding KVA1. In Figure 26, the released capacity is shown with the orange vector, which is parallel to the red phaser for KVA1.

Figure 26:
Released capacity obtained through application of
capacitors on substation medium-voltage bus.
Figure 27 plots the released capacity in per unit of the original load, KVA1, versus the size of the capacitor in per unit of the original load, KVA1. Curves are given for network load power factors of 80%, 85%, 90%, and 95%. If the load power factor is low, it is clear from the curves that adding the capacitor bank to the substation medium-voltage bus can release a significant capacity. That is, after the capacitor bank is added to the medium-voltage bus, additional network load can be supplied without having to increase the size of the substation transformer. Adding capacitors can defer installation of more substation transformer capacity.
For example, if the network load power factor were 85%, adding a capacitor to the medium-voltage bus might allow serving an additional 15% network load without requiring increasing the size of the substation transformer.

Figure 27:
Released capacity in substation transformer versus
capacitor size in per unit of network load, KVA1..
Network Primary Feeder Sourcing
When the network substation operates with open medium-voltage (MV) bus-tie breakers as in Figure 2, where the substation transformers are paralleled on the HV side, the same or nearly the same voltage magnitude can be maintained on the MV buses that supply the network primary feeders. This is achieved with load tap changing on substation transformers, or with separate voltage regulators between the transformers and the medium-voltage buses. However, even if the voltage regulation equipment maintained the exact same voltage magnitude on each medium-voltage bus, it does not control the phase angle.
When the load on the substation transformer goes from zero to any finite value, with the power factor of the load and the voltage on the HV side of the transformer remaining constant, in absence of LTC, the magnitude of the output voltage decreases, and the output angle lags the angle of the bus voltage at no load. Figure 28 shows the impedance diagram of the transformer, where VS is the high-side voltage in per unit reflected to the secondary side. Secondary side voltage VR is at angle zero degrees as shown. VR is the secondary side voltage in per unit, and before any compensation is made with the LTC, or a separate voltage regulator.
Voltage VRO in Figure 28 represents the output of an ideal separate voltage regulator, which changes only voltage magnitude, having no effect on phase angle. At no load, VS and VR are in phase and equal in magnitude. But as load is added to the transformer, the secondary voltage magnitude drops, and the angle of the secondary voltage lags the no-load secondary voltage angle, by ever increasing amounts as the load increases. R and X are the transformer leakage resistance and reactance respectively in per unit on the self-cooled OA rating. I is the transformer current in per unit, and angle θ is the angle by which I lags VR, being positive for lagging power factor load. Eq. (2) gives the relationship between VR and VS found from the vectors in Figure 28. The relationship between the magnitude of VS and VR is given by eq (3). Eq. (3) can be solved to find the magnitude of VR in terms of the magnitude of VS, as given by eq (3-4). For these equations, it is assumed that the angle of current I, θ in Figure 28, is that relative to VR, where VR is at an angle of zero degrees. Eq. (5) gives the angle by which VR lags VS.
(2)
$$ \ \ \ V_{S} = V_{R} + I(R\cos{\Theta} + X\sin{\Theta}) + jI(X\cos{\Theta} - R\sin{\Theta})$$
(3)
$$ \ \ \ |V_{S}|^2 = |V_{R}|^2 + I^2 R^2 + I^2 X^2 + 2 |V_{R}|I(R\cos{\Theta} + Xsin{\Theta}) $$
(4)
$$ \ \ \ |V_{R}| = -I(R\cos{\Theta} + Xsin{\Theta}) + \newline \sqrt{I^2(R^2 \cos^2{\Theta} + X^2 \sin^2{\Theta} + 2RX \cos{\Theta} \sin{\Theta}) - ( I^2 (R^2 + x^2) - 4|V_{S}|^2)} $$
(5)
$$ \ \ \ \Theta_{R} = tan^(-1) \enspace {\frac{I(X\cos{\Theta} - R\sin{\Theta})}{|V_{R}| + I(R\cos{\Theta} + X\sin{\Theta})}} $$

Figure 28:
Simplified transformer model plus current and voltage
phasors.
In eqs (2), (3), and (4), angle θ, between VR and current I, is positive for lagging power factor loads.
The phasors in Figure 28 show that as the load on the substation transformer increases, in terms of current I, not only does the magnitude of the output voltage, VR, decrease, but it lags behind the voltage on the primary side by angle θR, In Figure 28, voltage VR is at an angle of zero degrees.
Figure 29 plots the magnitude of secondary voltage VR, in per unit versus the load on the transformer in per unit, using eq. (4), assuming that the output voltage at no load is 1.025 per unit. Curves are given for transformers with impedances of 8% and 14%, for power factors of 85 percent and 98 percent. The voltage drop in the transformer is significantly impacted by the load power factor, with it being larger at the lower power factors.

Figure 29:
Medium-voltage bus voltage magnitude in per
Figure 30 plots angle θR, from eq (5) for two different transformer impedances, 8% and 14%, for power factors of 85% and 98%, as a function of the load on the transformer. The curves show that when the load goes from zero to rated OA or beyond, the angle of the output voltage changes significantly. Note that regardless of the impedance of the transformer, the angle shift is greater at the higher power factor loads. In contrast, the magnitude of the voltage drop is lower at the higher power factor loads.

Figure 30:
Medium-voltage bus angle in degrees.
Consequently, when the substation supplying the network operates with open medium-voltage bus-tie breakers as in Figure 2, there can be significant voltage angle difference between the MV buses that supply the network primary feeders. The amount depends upon the impedance characteristics of the substation transformers, and the relative loading on the different transformers supplying the medium-voltage buses. From Figure 30, if the load power factor were 85%, with one transformer loaded to 75% of nameplate OA, and the other loaded to 100% of nameplate, the angle difference between the two MV buses would be -6.5 – (-5.0), or -1.5 degrees for 14% impedance transformers. Angle differences of 1.5 degrees between substation buses supplying feeders for spot networks can produce poor load division, and possibly result in cycling or pumping of network protectors, especially at light load conditions.
Impact of Angle Difference on Protector Operation
Figure 31 plots for a two-unit spot network with 1000 kVA network transformers, supplied directly from the medium-voltage buses in the substation, the network load (blue curve) at which the protector supplied from the bus with the lagging angle will trip. The red curve plots the magnitude of the network load at which the protector supplied from the bus with the lagging angle, bus 2, will auto reclose. The network relay has a 1.0-volt close setting on a 120-volt base. It is assumed that perfect voltage regulators are installed such that the magnitude of the voltages on the two buses are equal. Network Protector Relaying considers cases where the magnitudes of the substation bus voltages are different. Listed on Figure 31 are the particulars for the network transformers, the network relay close and trip settings, and the network load power factor. Network Protector Relaying discusses network relay characteristics and settings in detail.

Figure 31:
Network load levels for trip and auto reclosing of
protectors in a two-unit spot network
From the blue colored curve which gives the load at which the protector fed from bus 2 trips, both protectors will stay closed down to zero load if the angle difference is zero degrees. At a lag angle of 1.0 degree for bus 2, both protectors will stay closed only if the network load is about 40% of the kVA rating of one network transformer. If the lag angle were 2 or 3 degrees respectively, the network load needed to keep both protectors closed is approximately 80% and 120% of the kVA rating of one network transformer. Consequently, with large phase angle differences between the substation buses supplying the spot network, network operation is not possible. Very large angle differences are more likely if the network is supplied from two or more different substations.
The red curve in Figure 31 gives the load on the spot network needed to cause automatic reclose of the network protector fed from the lagging bus, bus 2, after it opens, as a function of bus 2 lag angle. If the lag angle is greater than about 0.6 degrees, network protector 2 fed from bus 2 automatically closes at a load level that is less than the load level at which it trips. When these conditions exist, with both network protectors initially closed with the load above the level where one protector will trip, one protector trips should the network load decrease to the trip level.
Immediately after tripping, the protector will automatically reclose. This cycle repeats itself, resulting in the condition referred to as pumping. With certain protectors, pumping can result in failure of the protector closing motor, and depending on the failure mode, could result in a fault in the protector. Such a fault is in the unprotected zone in many systems, and at 480-volts this could result in massive damage to the protector. Microprocessor relays for protectors are available with anti-pump features. Network Protector Relaying identifies protector relay settings to prevent pumping.
In general, the best load division and stable protector operation is achieved when the network primary feeders come from the same electrical bus (closed bus-tie breakers). This arrangement minimizes voltage angle difference at the substation. It is further enhanced by having equal loading on the network primary feeders, especially important if there are phase reactors in the feeders at the substation, such that voltage differences between primary feeders at the substation are minimized. This is not to say that spot and area networks can’t be supplied from substations with open tie breakers, or from different substations, but operation under these conditions may be very troublesome, or impossible for large angle differences.
Substation Capacitor Bank Size to Control Voltage Drop in Transformers
When substation transformers have a very high impedance to help limit short circuit currents, it is possible that the transformer LTC range may not be sufficient to regulate the voltage due to the large voltage drop across the substation transformer. With capacitors placed on the medium-voltage bus, the voltage drop in the transformers can be reduced to a level, where the LTC can regulate the bus voltage to the desired level. Usually, the voltage drop in the substation transformers with capacitors would be determined with a power flow program, where the capacitor size is varied, iteratively, to obtain the desired voltage drop in absence of the LTC.
When the power transformers in the substation are effectively paralleled on the HV and MV side as depicted in Figure 32, and when the power transformers are identical in MVA rating and impedance (both magnitude and X over R ratio), there is a closed form solution for finding the capacitor size needed at any network load level to limit the voltage drop in the transformer to any specified value, ∆V, in per unit.
When these conditions are met, the analysis for the required capacitor size can be done considering just one transformer, and finding the capacitor size needed per transformer. In Figure 32, there are NT identical transformers, with the network total load supplied from the medium-voltage (MV) bus being ITOTAL, so the network load supplied by each transformer, IL, is simply (ITOTAL)/NT. Further, the current drawn by the capacitors connected to the MV bus is IC-TOTAL, so the capacitor current in each substation transformer, IC, is (IC-TOTAL)/NT. These relationships are valid because of the assumption that all transformers are identical, and paralleled on both the HV and MV sides. For the analysis, it is further assumed that the voltage on the medium-voltage bus, VS in Figure 33, is 1.00 per unit at an angle of zero degrees. This is shown in the per transformer model in Figure 33.

Figure 32:
Substation with NT identical transformers and
capacitor on MV bus
With reference to Figure 33, the network load per transformer, is treated as a constant current sink, IL, being in per unit on the OA rating of one substation transformer.
Further, the capacitor current per transformer is IC, being in per unit of the OA rating of one substation transformer. In effect then the analysis is done assuming the network load is a constant current sink, and the capacitor is a constant current source.
The magnitude of the voltage drop in the transformer in per unit, ∆V, by definition, is given by eq (5).
(5)
$$ \ \ \ \Delta V = |V_{P}| - |V_{S}| \text{ per unit} $$
With the secondary side voltage, VS, taken as 1.0 per unit, an equation can be written to find the capacitor current, IC, in per unit of substation transformer OA rated current to limit the voltage drop, ∆V, in per unit, to any specified value. Doing exact vector calculations, the capacitor current IC needed to limit the voltage drop to ∆V in per unit is found by solving the quadratic equation given by eq (6). Eq (7), when solved for IC, gives the capacitor size needed to maintain a specified power factor, PFHV, on the HV Side of the substation transformer. In eq. (7), “P” is defined by eq. (8).

Figure 33:
Model for determining capacitor bank size per substation
transformer to limit voltage drop to ∆V per unit.
(6)
$$ \ \ \ (R_{T}^2 + X_{T}^2)I_{C}^2 - [2I_{L}(R_{T}^2 + X_{T}^2) \sin{\theta_{L} + 2X_{T}}] I_{C} + I_{L}^2 (R_{T}^2 + X_{T}^2) + \newline 2I_{L} (R_{T} \cos{\theta_{L}} + X_{T}\sin{\theta}_{L}) - 2\Delta V - \Delta V^2 = 0 $$
(7)
$$ \ \ \ (PR_{T} - X_{T})I_{C}^2 + (-2PI_{L}R_{T}\sin{\theta_{L}} + 2I_{L}X_{T}\sin(\theta_{L})+ 1)I_{C} + \newline PI_{L}\cos{\Theta}_{L} + PR_{T} I_{L}^2 - X_{T}I_{L}^2 = 0 $$
(8)
$$ \ \ \ P = \tan{[\cos^-1 \frac{PF_{HV}}{200}]} \enspace \enspace \enspace P = \frac{\sqrt{1 - (\frac{PF_{HV}}{100})^2}}{\frac{PF_{HV}}{100}} $$
In eqs (6), (7), and (8), the terms are defined as follows.
RT = Transformer resistance in per unit on OA rating.
XT = Transformer reactance in per unit on OA rating.
θL = Angle of network load current relative to VS, being positive in sign for lagging power factor loads.
IL = Magnitude of network load current in per unit of transformer OA rating.
∆V = Desired voltage drop in per unit as defined by eq (5).
P = Tangent of the power factor angle to be maintained on the HV side of the network transformer with the capacitor applied on the MV bus, as defined by eq (8)
Recognize that the approach described here will give a good estimate of the capacitor bank size to limit the voltage drop in the substation transformer to a specified value in per unit. The drop should be limited to a value which can be corrected with the transformer LTC. Further, the analysis is approximate as it assumes the capacitor bank is a constant current sink, whereas it actually is a constant reactance. But the bank size obtained with this approach gives a good starting point for using in an exact analysis with a detailed power flow program.
The following example shows how the equations can be used. Assume the following:
Transformer Rating = 45/60/75 MVA
Transformer Impedance = 16% on 45 MVA OA rating.
Impedance X to R Ratio = 25
Network Load Power Factor will be varied from 70% to 100%
Figure 34 plots for a network load equal to 100% of the transformer OA rating (IL=1.0 pu) the capacitor bank size needed to limit the voltage drop in the substation transformer, as defined by eq (5) to 8% (∆V=0.08 per unit) with the blue-colored curve, as found from eq (6).
When the capacitor is sized to limit the voltage drop to 8%:
-
the solid green curve gives the corresponding power factor on the HV side of the substation transformer.
-
The solid red curve gives the power factor at the MV terminals of the substation transformer.
By comparison of the solid green curve and the solid red curve, it is seen that when the capacitor is sized to limit the voltage drop to 8%, the power factor on the HV side is less than the power factor on the output side of the transformer (MV) side, because the I2X losses in the substation transformer are higher than the I2R losses, by a factor of 25.
From Figure 34, if it is desired to limit the voltage drop to 8% with a transformer having 16% impedance, with the network load power factor being 85%, then the capacitor size should be about 0.11 times the OA rating of the transformer. With the OA rating being 45 MVA, the capacitor bank size per transformer is 0.11 times 45, or 4.95 MVAr.
In Figure 34, the purple-colored curve gives the capacitor bank size needed on the MV bus to have a 97% lagging power factor on the HV side of the substation transformer, an arbitrary value selected for illustration purposes. With the network load power factor being 85%, the capacitor bank size needed is about 0.43 times the OA rating of the transformer. With an OA rating of 45 MVA, the capacitor bank size is about 19.4 MVAr. Again, these values would be confirmed and fine-tuned with a power flow program.

Figure 34:
Capacitor bank size to limit voltage drop in transformer
to 8% and to maintain power factor of 97% on HV side, for network load
equal to transformer OA rating.
If the network load is greater than the MVA rating of the transformer, 1.0 per unit, the solution of eqs (6) and (7), with IL > 1.0, will reveal that larger capacitor banks are needed to limit the voltage drop to 8%, and to hold the power factor on the HV side of the substation transformer to 97%.
Network Restoration
Design of the substation that supplies the secondary networks must consider restoration of the network following a complete shutdown of the network. Although shutdown of a compete secondary network is very rare, it does occur, and it may be necessary due to the following:
-
Loss of transmission/generation feeds to the substation.
-
Loss of two or more power transformers in the substation when it is designed for a single contingency.
-
Loss of multiple network primary feeders due to manhole fires, or fires in network transformer vaults with multiple transformers and primary feeders.
-
Sustained arcing faults and fires in 480-volt spot networks, and in particular for faults in the unprotected zone, necessitating de-energizing all primary feeders in the affected spot network vault.
-
Fires in low-voltage cables, which can’t be cleared by cable limiters or cable cutting, necessitating tripping of all network primary feeders.
Whenever a secondary network is shut down by tripping of all primary feeder breakers, this should be accomplished by simultaneous tripping of all primary feeder breakers. If the breakers were tripped sequentially, the last feeder to be tripped would be carrying the entire load of the area network and all spot networks supplied from the feeder. This could cause sever short-time overloads to components on the feeder tripped last, damager or blowing of fuses in network protectors, and blowing of cable limiters in the secondary grid network mains and tie circuits. Some utilities have in the substation or at a remote-control center, a master trip switch, which when operated will trip simultaneously all primary feeder breakers to the network. Another method for de-energizing simultaneously all primary feeders to a network is to simultaneously de-energize the bus sections in the substation that supply the network primary feeders. However, this approach may not be acceptable if the bus sections for a network also supply non-network radial primary distribution feeders, or if the bus sections supply two or more independent secondary network systems.
If a network has been shut down, its restoration requires that all primary feeder to the network be energized simultaneously. This can be accomplished by closing simultaneously all primary feeder breakers at the substation. As an alternative, all primary feeder breakers can be closed with the medium-voltage buses in the substation de-energized, and then the bus sections with the primary feeders are energized simultaneously. Primary feeders should not be energized sequentially, because the first feeder energized would supply the entire load of the area network, plus the load of all spot networks supplied from the feeder.
Whenever a secondary network is restored, the entire network must be picked up. The associated cold load pickup current seen by the substation transformers are much greater than when a single radial distribution feeder is energized following an extended outage. When the network primary feeders are simultaneously energized, the feeder currents are much higher than normal, due to short duration transients, and longer duration transients due to loss of load diversity. The time period between energization of the feeders and achievement of the normal loading is the cold-load pickup period.
The short duration components result from network transformer magnetizing inrush currents, the inrush associated with equipment whose cold resistance is much less than the resistance under normal loading, and the starting or inrush current of motors which are connected when the network is energized. The long-duration component of the feeder cold load pickup current results primarily from loss of diversity among heating and cooling loads.
The magnitude and duration of the long-duration component of the cold-load pickup current are affected by:
-
Month and day of the year (temperature and time of outage)
-
Time of day
-
Duration of the outage, with longer outages producing greater loss of diversity
-
Mixture of load between commercial, industrial, and residential customers on the network. The problem is more severe on systems with mostly residential customers, because many residential customers do not disconnect heating and cooling loads on loss of power. In contrast, commercial and industrial customers frequently have maintenance personnel who open breakers and switches upon loss of continuous service, to protect their equipment upon system re-energization.
The network substation should be designed to handle the pickup of the largest network supplied from it. When the network is restored following an outage by the simultaneous closing of all feeder breakers to the network, the following measures should be considered to aid in the restoration.
-
Check network feeder breaker relay targets to ensure that none have tripped from faults on the feeder.
-
Connect all sub-transmission / transmission circuits to the HV buses in the substation.
-
Connect all generation sources, if any, to the substation medium-voltage buses.
-
Connect all medium-voltage tie circuits, if any, to other substations.
-
Connect all substation transformers to the medium-voltage buses from which the network primary feeders emanate, but maintaining fault currents within the breaker interrupting ratings.
-
Connect all capacitor banks to the substation medium-voltage buses, without exceeding maximum allowed bus voltage.
-
Close all medium-voltage bus-tie breakers, if that is the normal configuration, to minimize circulating currents in the network when the primary feeder breakers are simultaneously closed.
-
Check that the minimum number of primary feeders is available to carry the network load.
-
Check that control batteries and power supply are adequate for simultaneous closing of all primary feeder breakers. If the network is re-energized by simultaneous energization of the medium-voltage buses, check that control batteries are adequate for the task
-
Check that all network protectors are closed on feeders to be energized. If the network was dropped by simultaneous tripping of all primary feeder breakers, there is a good chance that most of the network protectors remained closed.
If some network protectors on the feeder are open when the feeder is re-energized, different protectors have different closing times when transformer side voltage is applied. This can vary from about 0.5 seconds up to almost 5 seconds. The protectors that close first will pickup a large load. Ideally all protectors are closed
-
Where suspect, check that network protector fuses are not blown.
-
Request that all large customers on the area and spot networks disconnect load by opening of the appropriate service breakers and switches.
If the re-energization of the network results in one or more primary feeder breakers tripping, and yet there are no faults on the feeder or the associated network transformers, the following measures can be considered.
-
If the feeder breaker tripped through the phase instantaneous current relay, temporarily raise the pickup setting of the instantaneous relay. Quite likely the tripping was due to the short-duration component of the cold-load pickup current. Ideally, if raised, the pickup will still be less than the fault current for a fault at the most remote point on the network primary feeder.
-
If network transformers on the primary feeder have the delta-connected primary windings, and the feeder breaker is tripping through the ground relay, either time overcurrent or instantaneous current, most likely the ground relays are seeing a false residual current from the magnetizing inrush current (dc component) saturating one or more phase current transformers. Raise but do not disable the settings of the ground relays, as there must be protection for any actual fault that occurs on the feeder during re-energization. If the feeder breaker tripped through the phase time-overcurrent relay, raise either the tap setting, the time dial, or both.
4.4 - Primary System Grounding
PRIMARY SYSTEM GROUNDING
The wye-connected LV windings of network transformers supplying four-wire services at 208Y/120-volts and 480Y/277-volts are solidly grounded. The neutral point of the wye-connected secondary windings, through the network transformer X0 bushing, is connected to the secondary neutral conductors, without intentionally inserting impedance between the X0 bushing and the secondary neutral conductors. This practice applies whether the network transformers have the delta-connected primary windings, or grounded-wye connected primary windings. In addition, connections usually are made between the secondary neutral conductor and ground, and the secondary neutral conductors typically are interconnected with the grounding conductors for the primary system.
With network transformers having delta-connected primary windings, the primary system grounding conductors include primary cable shields, lead sheaths or flat-strap neutrals, or a separate system grounding conductor if run. Primary system grounding conductors serve as the return path for ground currents for faults on the primary feeder. They also serve as a return path for ground currents for faults in the secondary system when the network transformers have the grounded-wye connected primary windings. In four-wire, low-voltage services supplied from secondary networks, the National Electric Code (NEC) requires that neutral conductor be connected to an approved grounding electrode at the service entrance. Grounding the secondary system in this fashion frequently is referred to as “solid grounding,” because no impedance (resistor or reactor) is inserted in the path to the network transformer X0 bushing.
A few spot networks supply ungrounded secondary systems. In these systems, the secondary windings of the network transformers are connected in delta. Such systems can’t supply a four-wire wye service, unless a separate grounding transformer is installed. Spot networks with ungrounded secondary systems have been used primarily in industrial plant applications.
In substations supplying the secondary network, different options are available for grounding the medium-voltage (MV) system that supplies the network primary feeders. As shown by the examples in Network Substation Design, the neutral of the wye-connected MV windings of the substation transformers (delta connected on the HV side) can be either solidly grounded, grounded through a reactor, or grounded through a resistor. This chapter reviews the characteristics, applications, and benefits of each type of system grounding.
Grounding Classes
The grounding class of the medium-voltage system supplying network primary feeders is determined from the ratio of X0 to X1, the ratio or R0 to X1, and the R0 to X0 ratio at the medium-voltage buses in the substation. R0, X0 and X1 are respectively, the zero-sequence resistance, the zero-sequence reactance, and the positive-sequence reactance at the medium-voltage buses. Table 1 lists the grounding classes and the associated sequence impedance ratios for each grounding class. These data are extracted from ANSI/IEEE C62.92-1987.
Also shown in the table is the single line-to-ground (SLG) fault current in percent of the three-phase fault current, for bolted faults, and the per unit transient voltage occurring on the unfaulted phases upon the occurrence of the SLG fault.
When the wye-connected secondary windings of the substation transformer are solidly grounded, most always the medium-voltage system satisfies the requirements for effective grounding. With two-winding substation transformers having a delta-connected primary windings and solidly grounded wye-connected secondary windings, the medium-voltage system in the substation would be classified as very effectively grounded (X0/X1 < 1 and R0/X1 < 0.10). Medium-voltage systems supplying secondary networks having a reactor between the substation transformer X0 bushing and ground in the substation most always satisfy the requirements for low-inductance grounding (3 < X0/X1 < 10). But as shown in Network Substation Design, the X0 to X1 ratio in some systems exceeds 10, in which case the system grounding is classified as high inductance (see Table 1).
When resistance grounding is selected for the medium-voltage system supplying the secondary network, a resistor is inserted between the X0 bushing of the substation transformer and ground. Most always the resistor is selected such that the system satisfies the requirements of low-resistance grounding, as defined in Table 1.
Applicability Based on Network and Non-Network Transformer Primary Winding Connections
When substation medium-voltage busses supply primary feeders where all network transformers on the feeders are connected in delta, whether the feeders are dedicated to the secondary network, supply transformers for non-network load, or supply transformers for both network and non-network systems, any of the system grounding classes in Table 1 can be used. Figure 1 shows the situation where one feeder is a dedicated network primary feeder, and the other is a non-network feeder with the primary windings of all transformers connected in delta. The X0 bushing of the substation transformers can be grounded solidly (Switch S1 closed), grounded through a resistor (Switch SR closed), or grounded through a reactor (Switch SX closed). When all transformers on network primary feeders and on non-network primary feeders have the delta connected primary windings, practically there is no current in the neutral grounding impedance at the substation under unfaulted conditions, and during faults between phases that do no involve ground. However, very small ground currents may exist due to unbalances in the feeder phase-to-ground capacitances, and small zero-sequence voltages on the substation buses.
Practically, the type of grounding for the primary system, when all network and non-network transformers have the delta-connected primary windings, affects system performance only during ground faults on the primary side.
Table 1:
Grounding Classification For The Network Primary Systems
Grounding Class and Means |
Ratio of Symmetrical Component Parameters |
Percent Fault Currenta |
Per Unit Transient LG Voltageb |
||
|---|---|---|---|---|---|
| X0/X1 | R0/X1 | R0/X0 | |||
| A Effectively | |||||
Effective |
0-3 | 0-1 | -- | >60 | <2 |
| Very Effective | 0-1 | 0-0.1 | -- | >95 | <1.5 |
| B Noneffectively | |||||
| Low Inductance | 3-10 | 0-1 | >25 | <2.3 | |
| High Inductance | >10 | <2 | <25 | <2.73 | |
| Low Resistance | 0-10 | >2 | <25 | <2.5 | |
a. SLG fault current in percent of the three-phase fault current.
b. Transient line-to-ground voltage following sudden initiation of SLG fault, in per unit of the pre-fault line-to-ground operating voltage.
When the medium-voltage buses in the substation supply network primary feeders, with network transformers having the grounded-wye connected primary windings as in Figure 2, the neutral of the substation transformer wye-connected medium-voltage windings must be solidly grounded, or grounded thru a reactor. Further, when the medium-voltage windings are grounded through a reactor, the reactance must be selected such that the medium-voltage system is effectively grounded in accordance with Table 1 (X0/X1 < 3). If resistor grounding were used, the unbalanced load currents would produce appreciable losses in the neutral grounding resistor. Resistor grounding is applicable only when all transformers on the feeders supplied from the substation have the delta connected primary windings.

Figure 1:
Substation with primary feeders having HV windings of all
transformers connected in delta.
In many systems, the substation medium-voltage buses supply dedicated or non-dedicated network primary feeders, where all network transformer primary windings are connected in delta, and three-phase four-wire multi-grounded neutral (MGN) feeders where the primary windings of the distribution transformers, either single-phase or three-phase, are connected between the phases and the multi-grounded neutral conductor. This is shown in Figure 3. Under these circumstances, the X0 bushings of the substation transformers must be either solidly grounded, or grounded through a reactor as shown. Because of the line-to-neutral connected distribution transformers on the three-phase, four-wire multi-grounded neutral feeder, all zero-sequence load current, either at fundamental frequency or at a harmonic frequency (third and its odd multiples), flows in the neutral grounding impedance at the substation. Resistance grounding of the medium-voltage system is not applicable when it serves multi-grounded neutral distribution feeders. When reactor grounding is used, it must satisfy the requirements for effective grounding as defined in Table 1

Figure 2:
Substation with primary feeders having HV windings of
network transformers connected in grounded wye.

Figure 3:
Substation supplying network primary feeders and 4-wire
multi-grounded neutral primary distribution feeders.
Benefits of Limiting Ground Fault Currents
Inserting a neutral grounding impedance at the substation limits the currents in the ground path for both the single line-to-ground (SLG) fault, and for the double line-to-ground (DLG) fault. Limiting the current for the SLG fault on the primary feeders of network and non-network distribution systems yields the following benefits.
-
Reduces the mechanical and thermal stresses on the substation transformers during the SLG fault.
-
Reduces step and touch potentials within the substation during the SLG fault.
-
Reduces the interrupting duty on the feeder circuit breakers during the SLG fault. The neutral grounding impedance, by limiting the current for the SLG fault, may prevent the SLG fault from propagating into a multi-phase fault in the time required for the circuit breaker for the faulted feeder to open. If successful, there will be a significant reduction in interrupting duty, and energy input to the fault.
-
Reduces the power input to faults in primary cables and cable splices, and reduces the arc flash hazards for the SLG fault. Many, if not most, faults in primary feeder cables and splices in medium-voltage systems start between one phase and ground (cable shield, flat strap neutral, lead sheath). By liming the SLG fault current, the probability of the fault migrating to a multi-phase fault is reduced if the SLG fault current is of sufficient magnitude to operate an instantaneous phase or ground relay (same clearing time from the station end). Preventing the SLG fault from propagating into a multi-phase fault, where significantly more power and energy can be released at the fault point, may reduce the chance of a manhole cover being ejected from the explosive effects of the high-current fault arc.
-
Reduces the voltage rise on primary cable sheaths and secondary neutral conductors relative to remote earth during SLG faults. If metallic objects such as streetlight standards, vault hatches, and vault gratings are bonded or connected metallically to primary cable sheaths/flat-strap neutrals, the potential rise of the item relative to remote earth during ground faults on the primary cable will be lower. The associated step and touch potentials will be lower
-
Reduces heating in cable sheaths and the ground return path conductors during the SLG fault.
Another advantage of limiting-current for the SLG fault is the improvement in power quality for the customers supplied from the low-voltage network, for the SLG fault on the primary feeder, when the network transformers have the delta-connected primary windings. By limiting ground fault current with resistor or reactor grounding in substations that supply dedicated feeders with network transformers, the line-to-ground voltages in the secondary network do not drop as low in the interval between the occurrence of the SLG fault on the primary feeder and the clearing by the primary feeder breaker, as when solid grounding is used. This benefit was identified back in 1959 in the paper, “Large Metropolitan Distribution Substations”, by T. D. Reimers of the Consolidated Edison Company of New York.
Substations Dedicated to Secondary Networks-Reactance Grounding
When the MV bus in the substation supplies primary feeders where all network transformers and transformers on the non-network feeders have the delta connected primary windings, as in Figure 1, the effect of reactance grounding on voltages and currents can be quantified. These calculations are done through analysis of the simplified system in Figure 4, where the single line-to-ground (SLG) fault is at the line terminals of the feeder breaker in the substation. Electrically this is the same as a fault on the medium-voltage bus in the substation.

Figure 4:
System for defining currents and voltages with reactance
grounding for the SLG fault.
The quantities determining the response for these conditions, assuming all MV bus-tie breakers in the substation are closed, are the positive- and zero-sequence Thevenin impedances looking into the substation MV bus, Z1 and Z0 respectively. These are the sequence impedances at the substation MV buses when all primary feeder breakers are open.
Furthermore, in most substations, the ratio of R1 to X1 is very low, due to the high X to R ratios of the substation transformers, and can be taken as zero. Then the effect of a neutral grounding method on ground fault currents and voltages in both the primary system and secondary system can be quantified in terms of the ratio of X0 to X1 at the substation MV bus when reactance grounding is used, and the ratio of R0 to X1 at the substation when resistance grounding is selected.
Primary Currents and Voltages With Reactance Grounding
Figure 5 gives the ratio of the magnitude of the current for the single line-to-ground (SLG) fault to the magnitude of the phase current for the three-phase fault for ratios of X0 to X1 up through 10. For systems effectively grounded (X0 to X1 ratio is less than 3), the current ratio is 0.60 or higher, and for system that meet the low-reactance grounding criteria (X0 to X1 ratio greater than 3 and less than 10), the current ratio is between 0.60 and 0.25. The values read from the curve of Figure 5 are consistent with the data in ANSI/IEEE C62.92-1987, parts found in Table 1 in this chapter.
When solid grounding is employed at the substation, the ratio of X0 to X1 at the substation MV bus can be less than 1 when the HV windings of the substation transformers are connected in delta. As shown in Figure 5, under these conditions the current for the SLG fault can exceed the current for the three-phase fault.
Network systems are installed that use solid grounding, and low-inductance grounding. Low inductance grounding (X0 to X1 greater than 3), and high-inductance grounding should be selected only when the network transformers and non-network transformers on the primary feeders fed from the substation have the delta connected primary windings.

Figure 5:
Ratio of the SLG to three-phase fault current at the
substation MV bus with reactance grounding.
For faults on the substation MV buses, Figure 6 shows the ratios of the ground and phase currents to the current for the three-phase fault, and the ratio of the ground current for the double line-to-ground (DLG) fault to the ground current for the SLG fault with inductance grounding for X0 to X1 ratios up through 20.

Figure 6:
Current ratios for faults at the substation MV buses with
reactance grounding.
With the X0 to X1 ratio greater than 1, the ground current for the DLG fault is less than the ground current for the SLG fault, with the ratio being asymptotic to 0.50 for high values of X0 to X1 (green-colored curve in Figure 6). With reactance grounding when Z0 and Z1 have the same angle, the current in the two faulted phases for the DLG fault are equal in magnitude, and the phase current for the DLG fault is asymptotic to √3/2 for the higher X0 to X1 ratios (red-colored curve in Figure 6).
When the substation supplying network primary feeders, with network transformers having the delta-connected primary windings, also supplies four-wire multi-grounded neutral (MGN) distribution feeders as in Figure 3, the MV system must meet the requirements of effective grounding. If neutral reactors are installed with the substation transformers, the X0 to X1 ratio on the MV buses should not exceed 3, with some practitioners suggesting it not exceed 2 at the substation. This requirement is to limit the voltage to ground (neutral) on the unfaulted phases of the MGN feeder during the SLG fault at the substation, and for the SLG faults on both the network feeders and on the four-wire MGN feeders on the line side of the breaker. This limitation, in turn, limits the voltage swell experienced by customers supplied from distribution transformers with the primary winding(s) connected from line-to-neutral.
Figure 7 plots for the SLG fault the unfaulted phase-to-ground voltages at the substation with the fault at the substation MV bus. The fault is on MV phase “a” in Figure 4. When the R0 to X1 ratio at the bus is zero, the voltage from unfaulted phase “b” and unfaulted phase “c” are equal for any X0 to X1 ratio as shown by the red-colored curve in Figure 7.

Figure 7:
MV system unfaulted phase-to-ground (neutral) voltages
for the SLG fault at the substation bus.
When the R0 to X1 ratio is 0.2, larger than practical values encountered with reactance grounding, the two unfaulted phase-to-ground voltages are not equal for the lower X0 to X1 ratios as shown by the blue- and green-colored curves in Figure 7. Figure 7 also shows that when the system is effectively grounded, the unfaulted phase-to-ground (neutral) voltages do not exceed about 128%. With reference to Figure 3, this means that for the SLG fault at the medium-voltage bus in the substation, or at the line terminals of the medium-voltage feeder breaker, the temporary voltages on the secondary side of distribution transformers on the MGN feeder with line-to-neutral connected primary windings will not exceed 153 volts on a 120-volt basis. This overvoltage (swell) exists for the time required to clear the SLG fault on the MV system.
Even when the supply substation is dedicated to the secondary network, having network transformers with delta-connected primary windings, consideration still must be given to the unfaulted phase-to-ground voltages on the primary system during the SLG fault. This need arises because surge arresters and potential transformers may be connected from phase-to-ground in the substation. They must be rated to withstand the temporary overvoltages from the SLG fault. Furthermore, when the SLG fault occurs on a feeder at the substation, the temporary overvoltages are applied not only to the unfaulted phases of the faulted primary feeder, but to the unfaulted phases of all primary feeders supplied from the medium-voltage buses in the substation (closed bus-tie breakers).
Secondary System Voltages and Voltage Unbalance
A significant, yet overlooked, benefit of installing a neutral reactor in the substation is that the voltage sag in the low-voltage network is reduced during the SLG fault on the primary feeder when the network transformers have the delta-connected primary windings. The neutral reactor application also reduces the voltage unbalance in the secondary system, defined as the ratio of the magnitude of the negative-sequence voltage to the magnitude of the positive-sequence voltage in the secondary system. Analysis of the system in Figure 4 gives the secondary system voltages to ground (neutral) for a bolted SLG fault on the primary feeder at the substation, in the interval between fault inception and opening of the circuit breaker for the faulted primary feeder. This analysis is valid for faults at the substation MV bus, or at the line terminals of the feeder breaker. These are the fault locations which generally produce the worst-case voltage sag in the LV network system. Faults on the primary feeders away from the substation generally produce lower voltage sags in the secondary network.
With reference to Figure 4, with the SLG fault on primary phase “a” at the substation, the voltage to ground on secondary phase “A” and secondary phase “B” in per unit are given by eq (1) and (2) respectively. The only assumption made in deriving these equations is that the ratio or R1 to X1 at the substation is zero, which is valid due to the high X to R ratio of the substation transformer leakage impedance.
(1)
$$ \ \ \ V_{A} = \frac{\sqrt{(\frac{X_{0}}{X_{1}})^2 + (\frac{R_{0}}{X_{1}})^2 + \frac{X_{0}}{X_{1}} + \sqrt{3} \frac{R_{0}}{X_{1}} + 1}}{ \sqrt{{ ( \frac{X_{0}}{X_{1}} ) ^2 + (\frac{R_{0}}{X_{1}})^2 + 4\frac{X_{0}}{X_{1}} + 4 }}} \text{ Per Unit} $$
(2)
$$ \ \ \ V_{B} = \frac{\sqrt{(\frac{X_{0}}{X_{1}})^2 + (\frac{R_{0}}{X_{1}})^2 + \frac{X_{0}}{X_{1}} - \sqrt{3}\frac{R_{0}}{X_{1}} + 1}}{\sqrt{(\frac{X_{0}}{X_{1}})^2 + (\frac{R_{0}}{X_{1}})^2 + 4 \frac{X_{0}}{X_{1}} + 4 }} \text{ Per Unit} $$
Figure 8 shows the phase-to-ground voltages in the low-voltage secondary (delta wye-grounded network transformers) during the SLG fault on primary phase “a” in Figure 4, versus the X0 to X1 ratio at the substation MV bus. Secondary phase “C” to ground voltage magnitude, as shown by the purple colored curve, VC, is 1.00 per unit, regardless of the X0 to X1 ratio at the substation bus. The voltages from secondary phase “A” and “B” to ground are a function of the X0 to X1 ratio, and the R0 to X1 ratio at the substation, as shown by eqs. (1) and (2). The magnitudes of the phase-to-ground voltages on secondary phases “A” and “B” are equal when the R0 to X1 ratio at the substation is 0.0, as shown with the red-colored curve in Figure 8. With the X0 to X1 ratio at the substation equal to 1.0, voltages in the secondary drop down to 53% and 60%, depending on the R0 to X1 ratio. But if the X0 to X1 ratio is 5, a value found in most substations of a major operator of secondary networks, the voltage drops down to just 80%. The Information Technology Industry Council (ITIC) curve, as given in Figure 9, shows that sensitive electronic utilization equipment may ride through a 20% voltage dip, but certain equipment may not function for a voltage dip of 40% to 47%.

Figure 8:
Low-voltage system phase-to-ground voltages for a SLG
fault on substation MV bus with reactance grounding.
Figure 10 shows the magnitude of the positive-sequence voltage in percent (red-colored curve), and the negative-sequence voltage in percent (blue-colored curve), and 100 times the ratio of the two sequence voltage magnitudes in the LV system as a function of the X0 to X1 ratio at the substation for the SLG fault on the medium-voltage bus. The positive-sequence voltage in per unit in the secondary for the SLG fault on the primary feeder at the substation with the feeder breaker closed is given by eq (3)
(3) $$ \ \ \ V_{1} = \frac{ \sqrt{(\frac{X_{0}}{X_{1}})^2 + (\frac{R_{0}}{X_{1}})^2 + 2\frac{X_{0}}{X_{1}} + 1 }}{ \sqrt{(\frac{X_{0}}{X_{1}})^2 + (\frac{R_{0}}{X_{1}})^2 + 4\frac{X_{0}}{X_{1}} + 4}} \text{ Per Unit} $$
And the negative-sequence voltage in per unit in the secondary for the single line-to-ground (SLG) fault on the primary feeder at the substation is given by eq (4).
(4) $$ \ \ \ V_{2} = \frac{1}{ \sqrt{(\frac{X_{0}}{X_{1}})^2 + (\frac{R_{0}}{X_{1}})^2 + 4\frac{X_{0}}{X_{1}} + 4 }} \text{ Per Unit} $$

Figure 9:
ITIC curve for sensitive electronic equipment.
One hundred times the ratio of the negative-sequence voltage to the positive-sequence voltage is the voltage unbalance in percent, which is shown with the dashed orange-colored curve in Figure 10. The benefit of reactance grounding in the MV system for improving power quality and the performance of three-phase induction motors and other equipment in the secondary system during the SLG fault on the primary system (delta grounded-wye connected network transformers) is apparent from the curves in Figures 8 and 10.
The physical reason for a neutral reactor improving power quality in the secondary, for the higher X0 to X1 ratios, is that for the SLG fault on the primary, the reactor prevents severe collapse of the voltage delta on the primary system by permitting the unfaulted phase to ground voltages on the primary system to rise above normal line-to-ground voltage, until the breaker for the faulted feeder opens. And if collapse of the primary voltage delta is prevented, then with the network transformers connected delta on the primary and wye grounded on the secondary, the secondary phase-to-ground voltages will not drop as much.
Figure 11 shows a neutral reactor installed in a substation that supplies network primary feeders. The reactor is selected such that at the substation medium-voltage bus the ratio of Z0 to Z1, which for practical purposes is the same as the ration of X0 to X1, is equal to approximately 5. For this application, Figure 5 shows that the current for the SLG fault at the substation is about 42% of the current for the three-phase fault. Figure 7 shows that when a SLG fault occurs at the substation, the unfaulted phase-to-ground voltages on the primary system rise up to about 138% of nominal.

Figure 10:
Low-voltage system sequence voltages for SLG fault on
substation MV bus.

Figure 11:
Neutral reactor with substation transformer (courtesy
Consolidated Edison Company of New York, Inc, © 2010, All
rights reserved)
Substation Dedicated to Secondary Network–Resistance Grounding
The benefits of limiting the current for the single line-to-ground fault with reactor grounding, as listed in section 1 of this chapter, can also be achieved with resistance grounding of the MV system that supplies the network primary feeders. Resistance grounding is applicable for substations supplying network primary feeders, and non-network primary feeders only if the network transformer and all non-network transformer primary windings are connected in delta. In Figure 12, the transformers on the “non-network” primary feeder could be unit substations stepping down to a lower primary voltage, such as from 13.2 kV to 4160 volts. Or these transformers could be customer owned.

Figure 12:
Substation with resistance grounding for network and
non-network primary feeders.
When resistance grounding is used, the current for the single line-to-ground (SLG) fault is limited, the extent determined primarily by the size of the neutral grounding resistor. Figure 13 shows the ratio of the SLG fault current to the three-phase fault current at the substation medium-voltage bus with resistance grounding versus the ratio of R0 to X1. Curves are given for two values for the ratio of X0 to X1 at the substation, either 0.80 or 1.0. Eq (5) was used to plot these two curves.
(5)
$$ \ \ \ \frac{|I_{G}|}{ | I_{3\phi} |} = \frac{3}{\sqrt{(\frac{X_{0}}{X_{1}})^2 + (\frac{R_{0}}{X_{1}})^2 + 4\frac{X_{0}}{X_{1}} + 4}} $$
R0, X0 and X1 are the zero-sequence resistance, zero-sequence reactance and positive-sequence reactance respectively, in ohms on the substation medium-voltage bus when the neutrals of the substation transformers in Figure 12 are grounded. With the substation transformers connected delta wye as in Figure 12, the ratio of X0 to X1 on the medium-voltage bus would be less than 1, the amount dependent upon the stiffness of the system supplying the HV windings of the substation transformers.
When the currents for the three-phase fault and SLG fault on the medium-voltage bus in the substation with solid grounding are known, the values for X1 and X0 can be found from eqs (6) and (7) respectively. These equations are valid for the situation where the X to R ratios for the Thevenin impedances on the substation medium-voltage buses are very high, which is true for most substation because of the high X to R ratios inherent in the substation transformers.

Figure 13:
Ratio of the SLG fault current to the three-phase fault
current at substation with resistance grounding.
(6)
$$ \ \ \ X_{1} = \frac{E_{LN}}{I_{3\phi}} \Omega $$
(7) $$ \ \ \ X_{0} = 3\frac{E_{LN}}{I_{SLG}} - 2\frac{E_{LN}}{I_{3\phi}} \Omega $$
In these equations, the terms are:
ELN = System line-to-neutral voltage in volts
I3ϕ = Available three-phase fault current in amperes
ISLG = Available single line-to-ground fault current in amperes
Figure 14 is a picture of a neutral grounding resistor in a substation that supplies low-voltage secondary networks. This particular resistor is rated 11,000 volts line-to-line, 6,350 volts line-to-neutral, 1200 amperes and 5.29 Ohms. For practical purposes it limits the ground current supplied by the substation transformer it is applied with to less than 1200 amperes because the impedance of the substation transformer is not zero ohms.

Figure 14:
Neutral grounding resistor in substation supplying
low-voltage secondary networks (photo by author).
From the values for X1 and X0 given by eqs (6) and (7), the zero-sequence resistance in ohms to limit the SLG fault current to a defined fraction of the three-phase fault current can be found from Figure 13. For example, if it were desired to limit the SLG fault current to 20% of the three-phase fault current, the neutral grounding resistor would be selected such that the R0 to X1 ratio at the substation were approximately 15. Also note from Figure 13 that, with resistance grounding, the phase current for the SLG fault can be higher than that for the three-phase fault at or near the substation if the X0 to X1 ratio at the substation is less than 1, which it will be if substation transformer is connected delta-wye, and the R0 to X1 ratio is small. This relationship also applies when solid grounding is used.
When resistance grounding is used in the substation, the current in the ground path for the double line-to-ground (DLG) fault at the substation is less than the current for the SLG fault at the substation for the values for the ratio of R0 to X1 found in practice (greater than 1). The ratio of the magnitude of the ground current for the DLG fault, IG-DLG, to the ground current for the SLG fault, IG-SLG , is given by eq (8).
(8) $$ \ \ \ \frac{ | I_{G - DLG} | }{ | I_{G-SLG} |} = \frac{\sqrt{(\frac{X_{0}}{X_{1}})^2 + 4\frac{X_{0}}{X_{1}} + (\frac{R_{0}}{X_{1}})^2 + 4}}{\sqrt{4(\frac{X_{0}}{X_{1}})^2 + 4\frac{X_{0}}{X_{1}} + 4(\frac{R_{0}}{X_{1}})^2 + 1 }} $$
This relationship is plotted in Figure 15. For the higher values for the ratio of R0 to X1, the ground current for the DLG fault is about 50% of that for the SLG fault. This relationship must be considered when selecting ground relay settings for the circuit breakers for the network primary feeders at the substation, as it is desired that the ground instantaneous relay picks up for the DLG fault at the most remote point on the primary feeder.

Figure 15:
Ratio of ground current with a DLG fault to that with
the SLG fault with resistance grounding.
Further, with resistance grounding at the substation, the phase currents for the double line-to-ground (DLG) fault can exceed the phase currents for the three-phase fault for the lower values of the ratio of R0 to X1. Eqs (9) gives the ratio of the magnitude of Phase B current to the magnitude of the three-phase fault current for the DLG fault.
(9)
$$ \ \ \ \frac{|I_{B}|}{|I_{3\phi}|} = \sqrt{3} \frac{\sqrt{(\frac{X_{0}}{X_{1}})^2 + (\frac{R_{0}}{X_{1}})^2 + \frac{X_{0}}{X_{1}} + \sqrt{3}\frac{R_{0}}{X_{1}} + 1}}{ \sqrt{4(\frac{X_{0}}{X_{1}})^2 + 4(\frac{R_{0}}{X_{1}})^2 + 4\frac{X_{0}}{X_{1}} + 1}} $$
Eq (10) gives the ratio of the magnitude of Phase C current to the magnitude of the three-phase fault current for the DLG fault on phases B and C. Note that these equations assume that the R1 to X1 ratio at the substation is 0.0, which is valid due to the high X to R ratio of the substation transformers.
(10) $$ \ \ \ \frac{|I_{C}|}{|I_{3\phi}|} = \sqrt{3} \frac{\sqrt{(\frac{X_{0}}{X_{1}})^2 + (\frac{R_{0}}{X_{1}})^2 + \frac{X_{0}}{X_{1}} - \sqrt{3}\frac{R_{0}}{X_{1}} + 1}}{ \sqrt{4(\frac{X_{0}}{X_{1}})^2 + 4(\frac{R_{0}}{X_{1}})^2 + 4\frac{X_{0}}{X_{1}} + 1}} $$
These relationships are shown by the curves in Figure 16, which gives the phase B and phase C currents for the DLG fault on phases B and C, in per unit of the current for the three-phase fault, for two different values for the ratio of X0 to X1. As shown by the red- and orange-colored curves, the phase B current for the DLG fault at the substation exceeds that for the three-phase fault if the ratio of R0 to X1 is less than about 5. In systems employing resistance grounding, this ratio most always is greater than 5, so this is not an issue.
For the higher R0 to X1 ratios with resistance grounding, Figure 16 shows that the phase currents for the DLG fault at the substation approaches that for the ungrounded phase-to-phase fault, which is 86.6% of the current for the three-phase fault (assumes negative-and positive-sequence impedances are equal at the substation). In contrast, when reactance grounding is used and the ratio of X0 to X1 at the substation equals or exceeds 1.0, the phase currents for the DLG fault do not exceed the phase currents for the three-phase fault.

Figure 16:
Ratio of the phase currents for the DLG fault at
substation to the three-phase fault current with resistance grounding.
When resistance grounding is applied at the substation, the unfaulted phase-to-ground voltages during the SLG fault on the primary can slightly exceed the pre-fault phase-to-ground voltages. The curves of Figure 17 give the unfaulted phase-to-ground voltages at the fault point for the SLG fault on phase “a” at the medium-voltage bus in the substation, versus the R0 to X1 ratio at the substation bus. An R0 to X1 value of 0.0 corresponds to solid grounding. The voltages are in per unit of the phase-to-ground voltages prior to the fault. Primary phase “b” to ground voltage, shown with the blue-colored curves, never exceeds 1.732 per unit, the pre-fault phase-to-phase voltage, but primary phase “c” voltage, shown with the red-colored curves, can exceed the pre-fault phase-to-phase voltage. Note that curves are given for three values for the ratio of X0 to X1 at the substations. When the substation transformers have a delta-connected HV winding and a wye connected MV winding, the X0 to X1 ratio would be 1 or less with resistance grounding. The curves in Figure 17 for the SLG fault on primary phase “a” were plotted using eqs (11) and (12) for phases “b” and “c” respectively.
(11) $$ \ \ \ |V_{b}| = \frac{ \sqrt{3} \sqrt{(\frac{R_{0}}{X_{1}})^2 + (\frac{X_{0}}{X_{1}})^2 + \frac{X_{0}}{X_{1}} - \sqrt{3}\frac{R_{0}}{X_{1}} + 1}}{ \sqrt{ (\frac{R_{0}}{X_{1}})^2 + (\frac{X_{0}}{X_{1}})^2 + 4\frac{X_{0}}{X_{1}} + 4}} \text{ Per Unit} $$
(12) $$ \ \ \ |V_{c}| = \frac{ \sqrt{3} \sqrt{(\frac{R_{0}}{X_{1}})^2 + (\frac{X_{0}}{X_{1}})^2 + \frac{X_{0}}{X_{1}} + \sqrt{3}\frac{R_{0}}{X_{1}} + 1}}{ \sqrt{ (\frac{R_{0}}{X_{1}})^2 + (\frac{X_{0}}{X_{1}})^2 + 4\frac{X_{0}}{X_{1}} + 4}} \text{ Per Unit} $$

Figure 17:
Unfaulted phase-to-ground voltages on primary system for
SLG fault on phase “a” at substation medium-voltage bus with resistance
grounding.
With either resistance of reactance grounding, when a ground fault occurs on one feeder at the substation, the unfaulted phase-to-ground voltages appear on the substation MV buses, and are impressed on all primary cables supplied from the unfaulted phases. They persist for the time from fault inception until the faulted feeder breaker opens, which could be the backup clearing time if the circuit breaker for the faulted feeder fails to open. The cables for the primary feeders must be selected to withstand these momentary overvoltages. However, these overvoltages are no higher than the voltages impressed on the cable insulation in the unfaulted phases during a backfeed to the SLG fault with the primary feeder breaker open, and a network protector failing to open (network transformer primary windings connected in delta). For this backfeed condition, the overvoltages, equal to or slightly higher than nominal phase-to-phase voltage, could persist for many hours, depending upon the time required to locate and open the stuck-closed backfeeding network protector.
When the DLG fault occurs on the primary system at the substation bus when resistance grounding is utilized, on phases “b” and ‘c”, the voltage to ground on unfaulted phase “a” will rise up, the value dependent primarily on the ratio of R0 to X1 on the substation bus. The voltage from unfaulted phase “a” for the DLG fault on phases “b” and “c” with resistance grounding is given by eq (13).
(13) $$ \ \ \ V_{a} = 3\frac{\sqrt{(\frac{X_{0}}{X_{1}})^2 + (\frac{R_{0}}{X_{1}})^2 }}{ \sqrt{ 4(\frac{X_{0}}{X_{1}})^2 + 4(\frac{R_{0}}{X_{1}})^2 + 4\frac{X_{0}}{X_{1}} + 1}} \text{ Per Unit} $$
The unfaulted phase-to-ground voltage at the fault point for a DLG fault is plotted in Figure 18 versus the ratio of R0 to X1 at the fault point, for three different values for the ratio of X0 to X1 at the fault point. In substations having transformers with a delta connected primary winding, this reactance ratio would be 1.0 or less. Notice that the upper bound on the unfaulted phase-to-ground voltages is 1.5 per unit of the pre-fault voltage.

Figure 18: Unfaulted phase-to-ground voltage on primary system for
a DLG fault on primary phases “b” and “c” at substation medium-voltage
bus with resistance grounding.
Secondary Voltages and Voltage Unbalance
Resistance grounding at the substation, for the normally used ratios for R0 to X1, also reduces the voltage sag and voltage unbalance in the low-voltage network for SLG faults on the primary system. This principle is shown by the curves in figures 19 and 20, respectively. These curves give the voltages in the secondary system for SLG faults at the substation medium-voltage bus or at the line terminals of the circuit breaker for the primary feeder. The voltage sag in the secondary for the SLG fault on the primary feeder is less than that shown by curves when the fault is remote from the substation. As indicated before, the duration of the voltage sag is from time of fault inception until the fault is cleared by opening of the circuit breaker for the faulted primary feeder.
Figure 19 reveals that when the R0 to X1 ratio at the substation is less than about 2.5, due to a small ohmic value for the neutral grounding resistor, the phase B secondary voltage (blue-colored curves) is less than the phase B secondary voltage with solid grounding (R0/X1 = 0). However, for R0 to X1 ratios found in actual systems employing low-resistance grounding, (15 in one 15-kV class system and 25-30 in another), the secondary system line-to-ground voltages do not drop below 90% of their nominal value during the SLG fault on the primary. Furthermore, note from the red-colored curve that phase “A” voltage may rise up to about 105% for the higher R0 to X1 ratios. That is, with resistance grounding of the primary system there may be small voltage swells in the secondary for the SLG fault on the primary feeder of the network. With the neutral grounding resistor for low-resistance grounding selected such that the ratio of R0 to X1 at the substation is in the range of 15 to 30, reference to the ITIC curve, given in Figure 9, shows that customer equipment supplied from the secondary network should experience no mis-operations. In contrast, equipment in the secondary may mis-operate during the SLG fault on the primary when solid grounding is used for the medium-voltage system at the substation.

Figure 19:
Secondary phase-to-ground voltages during the SLG fault
on primary at substation with resistance grounding.
Figure 19 also shows with the orange-colored curve, for comparison purposes, the secondary phase-to-ground voltages on phases “A” and “B” with reactance grounding of the primary system. The phase “A” and phase “B” to ground voltages in the secondary have equal magnitude for faults at the substation with reactance grounding. For this (orange-colored) curve, the values on the abscissa are the ratio of X0 to X1 at the substation.
Figure 20 gives the positive-sequence voltage in the secondary with the blue-colored curve, and the voltage unbalance with the red-colored curve for the SLG fault on the primary with resistance grounding at the substation. For R0 to X1 ratios at the substation greater than about 10, the voltage unbalance in the secondary does not exceed about 10% during the SLG fault on the primary, and the positive-sequence voltage does not drop below about 95%. The practical significance of this is that with resistance grounding and a SLG fault on the primary, customers served from the secondary network probably are not adversely affected.

Figure 20:
Secondary positive-sequence voltage and voltage
unbalance during SLG fault on the primary with resistance grounding.
Further, from Figure 13, with low-resistance grounding of the MV system the current for the SLG fault is in the range that allows the instantaneous overcurrent relay for the network feeder breaker to be set to pickup for all SLG faults at the substation and out on the feeder. This limits the energy into the SLG faults on the primary feeder, and reduces the chance of the SLG fault propagating into a multi-phase fault.
Low-resistance grounding of the primary system is not as effective in limiting the voltage drop in the secondary for the DLG fault on the primary at the substation. Figure 21 plots the magnitude of the voltage from secondary phase “A” to ground, and the magnitude of the voltage from secondary phase “B” to ground for the DLG fault on the primary.
The two phase-to-ground voltages are equal in magnitude, but 180 degrees displaced. And the voltage on secondary phase “C” drops down to zero volts until the fault on the primary is isolated.
In the design of new substations that serve only primary feeders for secondary network systems, the benefit of resistance grounding for the medium-voltage system should be considered. Resistance grounding not only produces the benefits discussed before, but for some faults, results in lower transient voltages than with reactance grounding.

Figure 21:
Secondary phase-to-ground voltages during the DLG fault
on primary at substation with resistance grounding.
Effect on Primary Ground Fault Current Profile
With either resistance or reactance grounding, the ground current for the SLG fault and DLG fault at the substation can be significantly limited. Further, a major part of the total zero-sequence impedance at any point along the network primary feeder is due to the resistance of the neutral grounding impedance at the substation, depending on the X0 to X1 ratio, or the R0 to X1 ratio at the substation. Therefore, insertion of a neutral grounding impedance can result in a much flatter fault current profile curve for the SLG faults. This statement is illustrated with the curves in Figure 23 for the system shown in Figure 22, where the main feeder is made with 500 kcmil single-conductor triplexed cables, and the taps to the network transformers are made with 2/0 single conductor cables, being 1000 feet in length, and resistance grounding employed at the substation.

Figure 22:
Network primary feeder for fault current profile curves
in Figure 23.
At any point along the feeder, the zero-sequence impedance is not affected by the interconnection to other network feeders through the secondary network, due to the delta-connected HV windings of the network transformers. At any point along the feeder, the zero-sequence impedance is the Thevenin zero-sequence impedance looking into the substation MV bus, plus the zero-sequence impedance of the feeder between the substation and point of fault. Rigorously, this relationship does not apply for the positive-sequence impedance at any point on the primary feeder. But for approximation purposes, the positive-sequence impedance at any point along the feeder can be taken as that on the substation MV bus (Thevenin impedance), plus the positive-sequence impedance of the feeder from the substation to the fault point. The actual positive-sequence impedance at the fault point is somewhat less than this depending on how many “backfeeding” network protectors are closed.
The red-colored and green colored curves in Figure 23 give the fault current for the three-phase fault and the SLG fault respectively when solid grounding is used, and assumes that these currents are equal (25 kA) at the substation medium-voltage bus (X0 and X1 are equal at the substation bus). The curves for the SLG fault with resistance grounding (blue- and orange-colored curves) assume that the neutral grounding resistor is selected such that the current for the SLG fault on the substation bus is 4 kA (corresponding R0 to X1 ratio at substation is 18.4). The upper blue curve is for a fault on the main feeder, and the lower orange-colored curve is for a fault at the end of a 1000-foot 2/0 tap connected to the main feeder at the distance indicated on the abscissa.

Figure 23:
Effect of resistance grounding on the SLG fault
currents.
With resistance grounding, the SLG fault current at the end of a 2/0 tap, located 15,000 feet from the substation, is about 2500 amperes, sufficiently high to allow detection with an instantaneous ground current relay (50G) for the feeder breaker at the substation. Most faults in single-conductor cables and splices, and in many three-conductor cables and splices, start from one phase to ground. By limiting the current for such faults with resistance grounding as shown in Figure 23, there is a much greater chance of clearing the fault before it propagates into a multi-phase fault, or involves another circuit if the fault is in a cable or splice in a manhole. For example, for a SLG fault 3000 feet from the substation on the main feeder, the current is 17.23 kA with solid grounding, but only 3.64 kA with resistance grounding. For either case, the clearing time from the station end would be about the same, especially with microprocessor relays for the feeder breakers. The energy input to the fault is reduced by a factor of 22.4 (assuming energy input is proportional to fault current squared), and by a factor of 4.7 if energy input to the fault is proportional to current. The difference becomes even greater as the SLG fault is moved closer to the substation.
Extension of Dedicated Network Feeder For Supply of MGN Loads
A major operator, under certain circumstances, sometimes extends an otherwise dedicated network primary feeder, with all network transformers having the delta-connected primary windings, to supply three-phase four-wire, multi-grounded neutral (MGN) feeders with distribution transformers having their primary windings connected from line-to-neutral. This situation is depicted in Figure 24, where the extension is connected to the dedicated network feeder through either a recloser of circuit breaker. With the MV system effectively grounded at the substation (X0/X1 < 3 and R0/X1 < 1), the unfaulted phase-to-ground voltages on the feeder during a SLG fault on any other feeder supplied from the substation are limited to acceptable values while the breaker for the faulted feeder is closed. This means that the temporary overvoltages on the secondary side of the line-to-neutral connected distribution transformers are no higher than in any radial feeder circuit in a typical MGN system.

Figure 24:
Extension of dedicated network feeder to supply
line-to-neutral connected loads.
When a SLG fault occurs on the network portion of the feeder in Figure 24, following opening of the feeder breaker at the substation, and before any of the “backfeeding” network protectors can open, the primary feeder becomes an ungrounded system, with line-to-neutral connected loads. Line-to-neutral loads should never be connected to an ungrounded primary feeder.
With the SLG fault on the primary feeder with the feeder breaker open and all backfeeding protectors closed, the voltages on the secondary side of the line-to-neutral connected distribution transformers, which normally are 120-volts, rise up to 208 volts until all backfeeding network protectors open. This is a temporary overvoltage of 173% of nominal, which can damage customer loads. If any backfeeding network protector fails to open for the SLG fault, for whatever reason, the overvoltages can exist for extended periods of time. The backfeed currents in the protector which fails to open for the SLG fault may not be high enough to blow the fuses in the backfeeding protector.
Furthermore, if the feeder breaker at the substation in Figure 24 opens in absence of a fault, the voltages to ground on the MGN feeder are determined primarily by the balance of the line-to-neutral load between phases when there is one or more closed backfeeding protectors. Both overvoltage and undervoltage conditions can exist in the secondary systems supplied by the line-to-neutral connected distribution transformers until all backfeeding protectors open. If a protector fails to open, the undervoltages/overvoltages can exist for a long time period. Extensive damage may result to customer loads.
To control the line-to-neutral voltages during backfeed to a SLG fault with the primary feeder breaker open as in Figure 25, a zig-zag grounding transformer can be added to the feeder. Proper selection of the grounding transformer maintains effective grounding of the primary feeder when the feeder breaker at the substation is open, and all backfeeding network protectors are closed. Figure 26 is a picture of a zig-zag grounding transformer for installation in underground vaults. It is similar in appearance to a network transformer, but has no low-voltage throat or terminals.

Figure 25:
Combination primary feeder with grounding bank and
feeder breaker open.

Figure 26:
Submersible zig-zag grounding transformer for network
primary feeder applications (courtesy Consolidted Edison).
When all backfeeding network protectors are closed and the feeder breaker at the substation is open as in Figure 25, the positive-sequence impedance looking back into the network, Z1N, can be found from system modeling. It is minimum when all backfeeding protectors are closed, and as the backfeeding network protectors sequence open, Z1N generally increases in value, reaching its largest value, near infinity, when all protectors are open. The zero-sequence impedance of the grounding bank, shown as Z0GB in Figure 25, is specified such that the system meets the requirements of effective grounding (X0/X1 < 3 and R0/X1 <1 in Table 1) when Z1N is at its minimum value (all backfeeding protectors closed) , For this analysis, X1 is the reactive part of Z1N, and X0 and Z0GB practically are the same because the X-to-R ratio of the grounding bank is very high.
In addition to specifying the zero-sequence ohms of the grounding bank, Z0GB, to limit the overvoltages during backfeed to the SLG fault, other parameters must be specified for the zig-zag grounding bank. With reference to Figure 27, when the feeder breaker at the substation is closed and the system is operating under unfaulted conditions, the voltages applied to the grounding bank, located on the network feeder, will not be perfectly balanced. The voltages will have a zero-sequence component due to unbalances in the line-to-neutral connected load on the feeder, and other system unbalances. This results in the grounding bank carrying a ground current in absence of any fault.

Figure 27:
Combination primary feeder with grounding bank and
feeder breaker closed.
Thus, the grounding transformer must have a continuous current rating adequate to handle the unbalanced load current under unfaulted conditions. The user must specify the required continuous current rating as well as the ohms for the grounding bank. The division of the total unbalanced load current (load zero-sequence current) carried by the grounding bank and the substation transformers is determined to a great extent by the zero-sequence impedance of the grounding bank and the zero-sequence impedance looking into the medium-voltage bus at the substation, shown as Z0 in Figure 27. Also, when a SLG fault or a DLG fault occurs on the primary feeder or on the substation medium-voltage bus, or on any feeder supplied by the substation, the grounding bank carries a high short circuit current until the fault is cleared. The short-circuit current rating of the grounding bank, frequently for 10 seconds, must be specified by the user.
Although addition of the grounding bank to the dedicated network feeder limits the ovevoltages during backfeed to the SLG fault with the feeder breaker open, it creates other conditions that otherwise do not exist when the primary feeder is dedicated and just supplying network transformers with delta-connected primary windings.
-
With reference to Figure 24, when the primary feeder supplies just network transformers with the delta-connected primary windings (no line-to-neutral connected load), a SLG fault results in high ground currents in the faulted feeder, the extent determined by the grounding of the MV system at the substation. With a SLG fault on any network primary feeder supplied from the MV buses in the substation, the ground currents (zero-sequence) in the unfaulted primary feeders are very low, and consequently do not cause problems with setting of ground relays for the primary feeders. The ground (zero-sequence) current in the unfaulted feeders is temporary (lasts from time of fault inception until the breaker for the faulted feeder opens), and results from application of zero-sequence voltage to the zero-sequence capacitance of the unfaulted feeder. Generally, the zero-sequence capacitive current in the unfaulted feeders is below the pickup of the ground relays. This is discussed in detail in Primary Feeder Protection.
-
With reference to Figure 27, when a grounding bank is installed on a network primary feeder with delta grounded-wye connected network transformer, a ground fault on the MV bus in the substation or any other feeder supplied by the substation MV bus, produces high ground current in unfaulted primary feeders with a grounding bank or banks. This ground current is detected by the ground relay for the unfaulted feeder, and must be considered in selecting and setting of the ground relays for network feeders that have grounding banks.
This can be seen from Figure 28 which shows a substation supplying four network primary feeders with grounding banks on each feeder.

Figure 28:
Substation supplying four network primary feeders with
grounding bank on each feeder.
For a SLG fault on one feeder at the substation in Figure 28, a high zero-sequence voltage appears on the substation bus until the faulted feed breaker opens. This causes a high zero-sequence (ground) current on each unfaulted primary feeder with a grounding bank(s). Feeder breakers on unfaulted feeders with grounding banks should not open for ground faults on another primary feeder.
- With reference to Figure 27 or Figure 28, prior to application of the grounding banks, the maximum current for the SLG fault is determined by the positive- and zero-sequence impedances at the substation medium-voltage bus, shown as Z1 and Z0 respectively in Figure 27. Placing a grounding bank on one or more otherwise dedicated network primary feeders having network transformers with delta-connected primary windings has no effect on the positive-sequence impedance at any point along the feeder. However, the grounding banks reduce the Thevenin zero-sequence impedance at any fault point, and increases the current for the SLG fault. When grounding banks are applied on multiple primary feeders as in Figure 28, the application must be analyzed to assure that the currents for the SLG fault are not increased to the level where the momentary and interrupting rating of circuit breakers in the substation are not exceeded.
Application of Spot Networks to Existing MGN Radial Primary Feeders
Extension of Dedicated Network Feeder For Supply of MGN Loads discussed the issues to consider when extending an existing dedicated network primary feeder, with network transformers having the delta connected primary windings, to supply a four-wire MGN circuit with line-to-neutral connected distribution transformers. The scenario discussed in this section is when there are two existing multi-grounded neutral (MGN) distribution feeders, with line-to-neutral connected load (distribution transformers), from which one or more two-unit spot networks are to be supplied.
From the discussion in Extension of Dedicated Network Feeder For Supply of MGN Loads of this chapter, it is clear that if the network transformers for the two-unit spot network have the delta-connected primary high-voltage windings, then during backfeed to the SLG fault on the MGN primary feeder, with the faulted feeder breaker open, the unfaulted phase-to-ground voltages rise up to near phase-to-phase voltage. The loads supplied from the secondary side of the single-phase distribution transformers with the line-to-neutral connected primary windings on the MGN feeder will be subjected to a 73% overvoltage. If all network protectors open during the SLG fault, this is a temporary overvoltage, but if a protector fails to open, the overvoltage is of long duration. This has occurred on actual systems and damaged customers load.
To prevent the overvoltages during backfeed, the network transformers for the spot network should have the grounded-wye connections for both the primary and secondary windings, as shown in the simplified system of Figure 29. With these connections and the primary feeder breaker open at the substation, the primary feeder is still effectively grounded during backfeed from the spot network. The reason for this is that the zero-sequence impedance of the wye-wye connected network transformer, looking into the HV windings, for transformers constructed on a four or five-legged core, is practically the same as the positive-sequence impedance. Considering the zero-sequence network, with the delta wye-grounded connections, the transformer is an open circuit to the HV side, but with the grounded-wye grounded-wye connections, it is a through path in the zero-sequence network. The temporary overvoltages during backfeed with the feeder breaker open are controlled to an acceptable value with wye-wye connections, and usually the voltages to ground are lower than those for a SLG fault with the feeder breaker closed.

Figure 29:
Two-unit spot network with wye-wye network transformers
applied on multi-grounded neutral distribution primary feeders.
Frequently, in non-dedicated feeder spot networks as shown in Figure 29, the network transformers are connected to the MGN feeder through HV fuses, located either at the HV terminals of the transformer, or at the connection point between the main feeder and tap to the network transformers. This could be at a riser pole, or at pad-mounted or submersible switching equipment. The purpose of the fuses is to isolated a faulted tap circuit to a network transformer from the main circuit for a fault on the tap. Otherwise, such a fault on the tap circuit to the network transformer would cause an outage to the main primary MGN circuit. Further, in such applications the network transformers with the wye-wye connections should be constructed on either a four or five-legged core to minimize the chance of tank heating. If constructed on a three-legged core, the most common unbalances on the primary system can induce currents into the transformer tank and cause severe tank heating.
Faults on HV MGN Primary Feeder
For a SLG fault on the primary feeder between the feeder breaker in the substation and the fused taps to the two-unit spot network, as in Figure 29, after the primary feeder breaker opens, the network relay in the backfeeding network protector will detect the fault, and the protector will open. With protectors having the micro-processor relay, the backfeeding protector could be open six cycles after the feeder breaker opens. During the high-current backfeed with the primary feeder breaker open, it is important that the HV fuses in the tap circuit to the network transformer do not blow, just as the fuses in the network protector should not blow during high-current backfeeds. This must be considered when selecting and applying fuses on the HV side of the network transformer in spot networks.
If the fault on the HV feeder between the station breaker and tap to the spot network is temporary in nature, the fault is de-energized when the feeder breaker and the backfeeding network protector are both open. Then, when the primary feeder breaker at the substation recloses to re-energize the feeder, if reclosing is used, the reclose should be successful. To allow the backfeeding protector time to open and de-energize the fault so that feeder breaker reclosing is successful on temporary faults, it may be necessary to delay the first reclose of the feeder breaker at the substation in these non-dedicated feeder applications.
However, if the fault on the primary feeder between the station and tap to the spot network is permanent in nature, the backfeeding protector opens after the feeder breaker opens the first time. But this does not remove the fault from the primary feeder. The primary feeder breaker would then reclose into the fault for the system of Figure 29, but the network protector on the faulted feeder that tripped would not auto reclose, due to low voltage on one or more phases of the primary feeder and on the transformer side of the open network protector. The breaker for the faulted feeder at the substation would then go to lockout for the permanent fault, but the load supplied from the two-unit spot network does not experience a permanent outage. But it would experience voltage sags due to the initial fault and reclosing into the fault.
If, for a permanent fault on the primary feeder, the backfeeding network protector fails to open, there are high backfeed currents, even for the SLG fault when the network transformers have the grounded-wye grounded-wye winding connections. These persist in the interval that the primary feeder breaker is open. In many situations these currents are high enough to blow the protector fuse(s) in the faulted phase(s), although the fuses may not blow until the breaker for the faulted feeder goes to lockout. However, the problem with a two-unit spot network, with the backfeeding network protector failing to open, the fuses in both the backfeeding network protector and in the network protector supplied from the non-faulted primary feeder experience nearly the same current, and the fuses in both protectors in the faulted phase(s) may blow. This is because it is not possible to coordinate two fuses in series that see nearly the some current. If this occurs, the load supplied from the two-unit spot network is single phased. For this reason, network protector maintenance in these applications is important, and also in any two-unit spot network.
Figure 30 shows pad-mounted equipment for a two-unit spot network supplied from multi-grounded neutral primary feeders, with line-to-neutral connected distribution transformers. For each unit the compartment on the left contains the terminations for the primary cables to the network transformer HV terminals. The center compartment contains the network protector, and the right-most compartment contains current balancing transformers to help equalize load division when the medium-voltage bus tie breaker at the substation supplying the two primary feeders is open.

Figure 30:
Two-unit spot network supplied from multi-grounded
neutral primary feeders (photo by author).
Figure 31 shows the current balancing transformers in the right-side compartment in Figure 30. Mounted on the back wall is a motor contactor, that shorts the secondary winding of the current balancing transformer when either one of the two network protectors is open. With reference to Figure 30 in Impact of Voltage Phase Angle on Spot Network Operation, the current balancing transformers present a very high impedance to the flow of circulating current, IC, but a low impedance to the flow of the load current, IL.

Figure 31:
Current balancing transformers in the right-side
compartment in Figure 30 (photo by author).
4.5 - Primary Feeder Protection
PRIMARY FEEDER PROTECTION
In most low-voltage network systems, with dedicated primary feeders, overcurrent protection for faults on the primary feeders is provided with phase and ground overcurrent relays, and instantaneous phase and ground relays for the feeder circuit breakers at the substation, and with network protectors on the secondary (LV) side of the network transformers. Fuses or other overcurrent devices normally are not installed in network primary feeders for automatically sectionalizing the main feeder or for isolating faults on the branches supplied from the main feeder. Also, fuses typically are not located at the high-voltage (HV) side terminals of network transformers. However, as discussed in Primary System Grounding, non-dedicated feeder spot network installations have been made with fuses at or near the HV terminals of the network transformers. The network transformer is the only transformer supplying utilization voltage in utility distribution systems that doesn’t have fuses applied at or close to its HV terminals.
With other distribution transformers, both overhead and pad mounted, fuses are located at the HV terminals of the transformer. One purpose is to limit the energy that can enter the faulted transformer, thereby reducing the likelihood of an internal fault causing a disruptive failure of the transformer enclosure. Another purpose is to isolate a faulted distribution transformer from the primary feeder so that a transformer failure does not cause an outage to the feeder. Figure 1 shows a three-phase pole-top transformer and the fused cutouts on the HV side for isolating a three-phase transformer with internal fault from the primary system.

Figure 1:
Fused cutouts on the HV side of a three-phase pole-top
distribution transformer (photo by author).
In the low-voltage network system, isolation of a fault within the network transformer, with fuses or other protective devices at the HV side terminals, is not necessary to maintain service continuity, as in radial systems. Isolation of a fault on the network primary feeder or in a network transformer doesn’t cause an outage to load served from the network. It should only cause a single-contingency condition, removing just one primary feeder from service, for which the network system is designed. A network transformer fault is isolated by:
-
Opening of the primary feeder breaker at the substation.
-
Opening of the network protector on the low-voltage side of the faulted network transformer.
-
Opening of all other network protectors on the secondary side of network transformers on the feeder with the faulted network transformer.
If the fault is in the HV terminal compartment or switch compartment of a network transformer, and the compartment ruptures with a resultant fire of the liquid or filling compound, only the primary feeder associated with the transformer will be removed from service. But if there are other primary feeders in the vault with a fault in the terminal or switch compartment, the fault and resultant fire may result in tripping of multiple primary feeders. This is one reason why the preferred design is to have each network transformer, or transformer/protector in a separate vault, or a vault with construction to minimize the chance of a transformer fault involving multiple primary feeders.
The feeder phase relays at the substation can’t provide sensitive protection for network transformer faults, as is possible when fuses are applied at the HV terminals of the transformer, as in Figure 1. This is because the pickup of the phase relays must be high enough to carry the load current of all network transformers on the primary feeder under normal and contingency conditions. In contrast, if fuses were applied at the HV terminals of an individual network transformer, they would be sized to carry the current of just one transformer. Further, if fuses were applied at the HV terminals of a network transformer, they must coordinate with the tripping of the network protector for backfeed to multi-phase faults on the primary feeder, just as the network protector fuse must coordinate with protector tripping during backfeed to a fault on the primary feeder.
For many faults within a network transformer, fuses at the HV terminals will clear significantly faster than a feeder circuit breaker at the substation. First, the fuses will detect lower levels of fault current than the feeder circuit breaker with overcurrent relays. Second, fuses at the HV terminals of a transformer typically would isolate the faulted transformer from the primary feeder much faster than a circuit breaker at the substation can open, where the minimum clearing time would not be less than three cycles. In comparison, expulsion-type fuses can clear high-current faults in one cycle or less, and current-limiting fuses even faster. Phase and in particular ground relays for the primary feeder should be set as sensitive as possible without incurring the risk of false trips, to maximize the protection offered for faults internal to the network transformer. Most all systems are designed such that network transformer faults are cleared from the primary by opening of the feeder breaker at the substation.
This chapter presents issues to consider when setting the phase and ground instantaneous current relays, and the time overcurrent relays for dedicated primary feeders for the secondary network, with network transformers having either the delta or grounded-wye connected HV windings. Network transformer connections have minor impact on setting of the phase instantaneous and phase time-overcurrent relays, but a significant impact on the setting of the ground relays. Much lower pickup and time settings are possible for ground relays when the network transformers have the delta connected primary windings.
In general, phase relays for the primary feeders are not set to provide overload protection for the cables of the feeder. This is provided through monitoring of the feeder load currents with SCADA systems or other means. The main purposes of the relays for the feeder breaker are to provide through-fault protection to the primary feeder cables, and rapid detection and clearing for all faults on the network primary feeders and for faults within the network transformers. The faster the clearing from the substation end of the network feeder, the lower the energy input to the fault, and the lower the probability of the fault causing a disruptive type event, such as displacement of a manhole cover, or the rupture of the main tank of the network transformer. As emphasized in Primary System Grounding, limiting the current for the single line-to-ground (SLG) fault on the dedicated network feeder, by application of neutral grounding reactor or resistor with the substation transformers, lowers the power into the SLG faults, and lowers the energy input, providing the clearing time from the substation end is the same. It also reduces the chance of a SLG fault propagating into a multi-phase fault.
Phase Relay Settings
Phase Instantaneous Current Relay Setting Criteria
Figure 2 shows a portion of a low-voltage network system, where the dedicated primary feeders supply network transformers for the 208-volt grid network, and transformers for a two-unit 480-volt spot network. Each feeder breaker has instantaneous phase relays (50ϕ), an instantaneous ground relay (50G), time overcurrent phase relays (51ϕ), and a time overcurrent ground relay (51G). The bus-tie circuit breakers at the substation are closed

Figure 2:
Portion of secondary network system including spot and
area network.
The following issues are relevant when setting the pickup of the phase instantaneous current relays (50ϕ) for each primary feeder.
- Device 50ϕ must not pick up for bolted faults at the LV terminals of network transformers in either the 208-volt grid system, or the 480-volt spot networks. If it did, these faults will cause the outage of multiple primary feeders. For example, if the phase instantaneous current relays pickup for a bolted three-phase fault at the LV terminals of either network transformer in the two-unit 480-volt spot network (or on the paralleling bus) of Figure 2, both primary feeders 2 and 3 would trip, creating a double contingency. If it were a three-or four-unit spot network three or four primary feeders would trip.
For a fault at the LV terminals of the network transformer, or on the paralleling bus of a spot network, the phase currents at the substation will be maximum for the three-phase fault. With delta grounded-wye connected network transformers, the phase current on the primary side of the transformer with the single line-to-ground (SLG) fault at the transformer secondary terminals is about 58% of that for the three-phase fault at the secondary terminals.
- Device 50ϕ must not pickup when energizing a network feeder whereon all network protectors, connected to network transformers on the feeder, are open. This condition exists when the primary feeder is re-energized following an outage of just the feeder.
When a network primary feeder is energized with all network protectors open, the magnetizing inrush current of all network transformers on the feeder is seen by the phase instantaneous current relays for the feeder. The magnetizing inrush currents can have a significant dc component, decaying exponentially with time, plus a high harmonic content. The response of electro-mechanical instantaneous current relays is influenced by the dc component, and its effect must be considered in setting instantaneous phase relay, 50ϕ. In contrast microprocessor overcurrent relays generally have filtering and are less likely to trip from transformer magnetizing inrush currents and harmonic currents.
The severity of the magnetizing inrush current depends on many factors, including the point on the voltage wave at which the poles of the feeder circuit breaker close, the residual flux in the cores of the network transformers, the design characteristics of the network transformers, and the stiffness of the MV system at the substation. The dc component of the inrush current also produces a dc voltage across the burden of the phase CT’s, which may result in saturation of the phase CT’s in one or more phases.
With reference to Figure 3, when the network transformers have the delta connected HV windings, the residual current (sum of the three phase currents) in the ground relay when energizing the feeder is very small, being due to capacitance effects, if the CT’s are perfect (no error). However, because of unequal saturation in the phase CT’s, a false residual can be generated that is seen by the ground relays. They must not trip on the false residual. Also, when the feeder breaker first closes, there can be an actual residual current due to one pole of the circuit breaker closing before the others. The duration of this actual residual would be the pole span of the feeder breaker.

Figure 3:
Feeder relays and network unit HV current paths.
When applying fuses at the HV side of transformers, as in Figure 1, a common application rule is to assume that, from a thermal perspective, the transformer magnetizing inrush current is equivalent to 12 times the full load current of the transformer, lasting for 0.1 seconds (6 cycles). Further, the first peak of the inrush current can be as high as 25 times full load current of the transformer. This latter criterion was developed to aid in selecting current-limiting (CL) fuses applied at the HV terminals of distribution transformers. With CL fuses having a very steep time-current curve (TCC), where the slope on log-log coordinates is greater than 2, the fuse could melt on the first peak of the inrush current. Figure 4 shows a single-phase pole-top transformer which has a backup current-limiting fuse on the primary side.
If the phase instantaneous current relays for a network feeder were set to not pickup on an inrush current of 25 times the full load current of all network transformers on the feeder, the resultant setting would be much higher than found necessary by experience. For example, if a 13.2 kV network feeder has 8000 kVA of connected network transformer capacity, 25 times full load current 8748 amperes. This is much higher than a typical setting for 50ϕ. Table 1 lists relay settings used by utilities for dedicated network feeders in 15-kV class systems. The highest setting in that table for the pickup of the phase instantaneous relay, 50ϕ, is 6000 amperes, considerably below 8748 amperes.

Figure 4:
Distribution transformer with a backup current-limiting
fuse applied on the HV side (photo by author).
-
Device 50ϕ must not pickup when energizing a network following complete shutdown of the network. This usually is accomplished by simultaneous closing of all primary feeder breakers at the substation for the network. For this condition, device 50ϕ sees both magnetizing inrush currents and cold load pickup currents. Network Substation Design discussed network restoration.
-
Device 50ϕ should operate for ungrounded three-phase faults and ungrounded phase-to-phase faults on the primary feeder, and for these faults within the network transformer to the point where the HV leads enter the windings. Figure 3 shows possible locations for faults within the network transformer terminal compartment, switch compartment, and main tank. This figure also shows the residual connection of the phase CT secondary windings that supply the instantaneous and time overcurrent ground relays.
Device 50ϕ should not operate for faults on another primary feeder to
the network. With reference to Figure 2, with a three-phase fault on
one network feeder, the currents in the unfaulted primary feeders are
relatively low if the substation operates with closed bus-tie breakers,
as the substation bus voltage is depressed while the faulted feeder
breaker is closed. However, after the breaker for the faulted feeder
opens, the substation bus voltage returns to near normal, and the
currents in each unfaulted primary feeder rise until the fault is
cleared by opening of all backfeeding network protectors. Device 50 ϕ
for unfaulted feeders must not reach through the network and pickup for
faults on an adjacent primary feeder. The associated current in the
unfaulted
primary feeder can be higher than that for faults on the paralleling bus
in large spot networks.
Table 1:
Representative Phase and Ground Relay Settings for 15 kV
Class Dedicated Network Feeders with Delta HV Windings.
| Utility | Phase Time Overcurrent Relay | Phase Instantaneous Amperes |
Ground Time Overcurrent Relay | Ground Instantaneous Amperes |
||||
|---|---|---|---|---|---|---|---|---|
| Type | Tap Amperes |
Time Dial |
Type | Tap Amperes |
Time Dial |
|||
| A | IAC54 | 960 | 2 | 3200 | IAC54 | 80 | 2 | 1600 |
| A | IAC53 | 720 | 3 | 3000 | IAC53 | 60 | 2 | 1200 |
| A | CO-8 | 640 | 5 | 2040 | CO-9 | 40 | 2 | 800 |
| B | IAC77B | 600 | 3 | 4800 | IAC77B | 180 | 1 | 1200 |
| C | CO-9 | 800 | 5 | 4000 | CO-9 | 200 | 4.3 | 1200 |
| D | C0-9 | 800 | 2 | 3200 | CO-9 | 640 | 3 | 1600 |
| D | CO-6 | 720 | 2 | 3000 | --- | --- | --- | 1200 |
| E | C0-11 | 960 | 2 | --- | --- | --- | --- | --- |
| F | CO-11 | 840 | 1.5 | 2040 | CO-11 | 240 | 11 | 480 |
| G | CO-11 | 1280 | 2 | 5500 | CO-11 | 320 | 1 | 2400 |
| H | NA | NA | NA | NA | CO-2 | 200 | 2.5 | --- |
| Ia | --- | --- | --- | 3200 | --- | --- | --- | --- |
| J | CO-9 | 640 | 2 | --- | --- | --- | --- | 320 |
| K | CO-11 | 960 | 2 | 6000 | CO-11 | 240 | 1 | 1800 |
| L | CO-9 | 1680 | 1 | 6000 | CO-2 | 360 | ½ | --- |
| M | ? | 720 | .5s@6X | 4800 | --- | --- | --- | 300 |
- All network transformers are connected grounded-wye grounded-wye.
NA Relay type and settings not available (not known).
—- Relay not used.
Phase Time Overcurrent Relay Setting Criteria
Issues listed below should be considered when setting the phase time overcurrent relays (51ϕ) for each primary feeder. Reference should be made to Figure 2 for the discussion.
-
The phase time-overcurrent relay should not operate from the maximum load currents for which the network primary feeder is designed. Overload protection for the feeder is provided by monitoring of the feeder load currents, via SCADA or other means.
-
The phase time over current relay should not time out for faults that are downstream from the low-voltage terminals of network protector in Figure 2 or 3. If the current in the phase time-overcurrent relay for faults in the secondary system is above the pickup of the phase time overcurrent relay, the phase time overcurrent relay should be selective with the network protector fuse, or cable limiters, whichever is faster.
The reason for this can be seen from Figure 2, by assuming a fault on paralleling bus of the 480-volt spot network. If the phase relays pickup for this fault, and the phase relays are not selectively coordinated with the network protector fuse, a fault on the paralleling bus could trip multiple primary feeders to the network. This would create a double or higher contingency condition necessitating de-energizing the entire secondary network. If not de energized, excessive overloads could cause damage to transformers, primary and secondary cables remaining in service.
-
The phase time overcurrent relays, in conjunction with the phase instantaneous current relays, must thermally protect the cables of the primary feeder between the substation and the point of fault. This principle applies not only to the main feeder cables, but also to the smaller cables of the branch lines and taps to individual network transformers.
-
The phase time-overcurrent relay should not time out for phase faults on other primary feeders to the network With reference to Figure 2, with a three-phase fault on one network feeder, with closed bus-tie breakers at the substation, the currents in the unfaulted primary feeders are relatively low because the station bus voltage is pulled down while the breaker for the faulted primary feeder is closed. However, following opening of the breaker at the substation for the faulted feeder, the substation bus voltage returns to near normal, and the currents increase in each unfaulted primary feeder. The total current in each unfaulted feeder consists of a load component, plus a portion of the backfeed current in the faulted feeder. As the backfeeding network protectors sequence open, the currents in the unfaulted primary feeders will decrease, to the level where they are carrying only load current after the last backfeeding protector opens. The phase time overcurrent relays for unfaulted feeders should not time out under these conditions. Further, should a backfeeding protector fail to open, the backfeed should be cleared by the fuses in the stuck-closed network protector on the faulted feeder. Thus, the protector fuses in the backfeeding protector should be selectively coordinated with the phase time-overcurrent relays on the unfaulted primary feeders.
Figure 5 plots the relay settings given in the sixth row of data in Table 1, the through fault withstand curve of a 1000-kVA 216-volt network transformer, and the time-current curves for two different types of network protector fuses that could be on the LV side of the network transformer, the 3000 ampere NPL silver-sand fuse with the blue curve, and the 3000 ampere tin fuse with the green curve. Also given with the orange colored curve is the time to raise the temperature of 2/0 copper primary cable from 50o C to 250o C, assuming that all heat is stored. All curves are plotted versus current at 12 kV, with the network protector fuse time-current curves reflected to the HV side of the transformer on the basis of a three-phase fault, and by assuming that the ratio of the primary current at the relay location to the current in the network protector fuse is the same as the ratio of the network transformer secondary rated voltage to the network transformer primary rated voltage. Indicated on the abscissa with the vertical black line is the maximum through-fault current in the network transformer for a fault in the secondary terminals, assuming an infinite bus on the HV side of the network transformer.

Figure 5:
Time-current curves for devices shown in the single-line
diagram in Figure 6.
The curves in Figure 5 show that selectivity exists between the network protector fuses on the 1000 kVA 12-kV to 216-volt network transformer and the phase instantaneous and time overcurrent relays for the feeder, as shown by the red-colored curve. However, for a fault in the network protector as in the schematic of Figure 6, the feeder phase relays at the substation see more current than that in the protector fuse (reflected to the HV side by the transformer turns ratio). The reasons for this are: (1) the load currents in the primary feeder at the substation during a fault at the secondary on one transformer, and (2) the presence of parallel paths around the transformer/protector with the fault as seen from the schematic in Figure 6. These phenomena must also be considered when setting the phase instantaneous current relay, 50ϕ, and evaluating coordination. From Figure 5, the pickup of the phase instantaneous relay in primary amps is (800/5*20) or 3200 amperes, significantly above the current for a bolted three-phase fault on the secondary side of the 1000 kVA network transformer.

Figure 6:
Single-line diagram for device characteristics plotted in
Figure 5
Figure 7 shows the time-current curves for the phase relays (red-colored curves) and ground relay (black-colored curve), and network protector fuses for the 13-kV system found in a large metropolitan area. Figure 8 is a single-line diagram showing the location of the devices whose time-current curves are plotted on Figure 7. The green-colored curve is for the S5 network protector fuse applied on the secondary of the 1000 kVA 216-volt network transformer, and the blue-colored curve is for a 5000-ampere current-limiting fuse on the 480-volt side of a 2500 kVA network transformer. The curves are plotted assuming that the ratio of network protector fuse current to feeder breaker current for a fault in the secondary is the same as the ratio the network transformer rated primary voltage to network transformer rated secondary voltage.
The actual ratio will be somewhat different due to the effect of load currents and other parallel paths from the secondary to the primary system as seen in Figure 8. Shown on the abscissa on Figure 7 with the vertical black lines are the currents for the bolted three-phase fault at the secondary terminals of the 2500 kVA 480-volt network transformer, and for the 1000 kVA 216-volt network transformer, in amperes referred to the HV side. For these bolted faults (infinite bus assumed at HV terminals of the network transformers), it is seen from the green colored and blue colored curves that the protector fuses will blow before the phase time overcurrent relay, red colored curve, can time out.

Figure 7: Time-current curves for the devices in the system in a
large metropolitan area.

Figure 8: Single line diagram for protective device characteristics
plotted in Figure 7.
Figure 5 showed that there is good coordination between the 3000-ampere fuses in the network protector on the secondary side of a 216-volt, 1000 kVA network transformer and the phase relays for the primary feeder. However, when the same 3000-ampere protector fuses are applied with a 2000 kVA 480-volt network transformer, the coordination between the protector fuses and the phase relays is not as good, as shown by the time-current curves in Figure 9. At the maximum through fault current as shown by the vertical black line, the 3000 ampere NPL fuse is selectively coordinated with the phase relay. However, the coordination between the 3000-ampere tin fuse (green colored curve) and the phase time-overcurrent relay is marginal. As explained later the curve for the tin fuse gives its minimum time as it assumes 100 % preload and a 40o C vault ambient.

Figure 9:
Coordination between 480-volt protector fuses and phase
relays set same as in Figure 5.
The miscoordination shown in Figure 9, for the 480-volt application, may not be as bad as suggested, because bolted three-phase faults in 480-volt secondary systems are rare. With arcing faults, the currents in the primary feeder will be lower than for bolted faults in the secondary as shown by the vertical black line on the abscissa, perhaps being below the pickup of the phase time-overcurrent relay at the station, being 800 amperes in Figure 9. Further, for the bolted SLG fault on the secondary, the short-circuit component of the current in two of the primary phases is 58% of that shown by the vertical black line in Figure 9 . If there is concern about the coordination of the larger protector fuses in 480-volt spot networks and the phase relays at the substation for the bolted three-phase fault in the secondary, higher tap setting and time dial settings can be considered for the primary feeder phase relays. Furthermore, it is desired by most practitioners that the phase instantaneous current relay will pick-up for faults at all locations on the primary feeder. As mentioned by T. D. Reimers of Con Edison in his 1959 AIEE paper 59-42, titled Large Metropolitan Distribution Substations, “The instantaneous overcurrent elements have shown considerable merit. They can be adjusted to operate only for distribution feeder cable faults or the equivalent, thereby eliminating relay selectivity problems. Their fast operation keeps equipment and cable damage to a minimum”.
Ground Relay Settings – Delta Wye Network Transformers
Ground Instantaneous Settings
On dedicated network primary feeders with delta grounded-wye connected network transformers, the pickup of the ground instantaneous current relay, device 50G, and the ground time-overcurrent relay, device 51 G, can be set much lower than the respective phase relays. The network transformer is an open-circuit in the zero-sequence network of the system, isolating the primary and secondary systems in the zero-sequence network. Consequently, load unbalances and ground faults in the low-voltage network cause, practically, no zero-sequence current in the primary feeders if the primary feeder system and substation transformers are perfectly symmetrical. In actual systems, very small zero-sequence currents flow in the primary feeders for load unbalances and faults in the LV portion of the network, due to small unbalances in the system (mutual impedances to the zero-sequence network of the HV feeder).
The following issues should be considered when selecting the pickup of the instantaneous ground relay, 50G, for network primary feeders that are dedicated to the network (delta wye-grounded network transformers).
-
Device 50G should not pickup for faults in the secondary system. Faults in the secondary system produce positive-and negative-sequence currents in the primary feeders. Because of unbalances in the primary feeder and substation transformer(s), there are small mutual impedances between the positive- and zero-sequence networks for the primary feeder and substation transformer, and between the negative- and zero-sequence networks for the primary feeder and substation transformers. The positive-and negative-sequence currents in the primary feeder and substation transformer, for faults in the secondary system, induce small zero-sequence voltages into the primary system. These voltages cause small zero-sequence currents in the network feeders, which are limited by the zero-sequence capacitive reactance of the primary feeder cables. Although these currents are seen by the feeder ground relays, there are no documented reports of these currents causing false tripping of low-set ground relays for the primary feeders. Furthermore, these zero-sequence currents are much less than those caused by the application of zero-sequence voltage to unfaulted primary feeders during a SLG fault on another (adjacent) primary feeder (discussed in item 3 below).
-
Device 50G should not operate from false residual currents for faults in the secondary system. When bolted faults occur in the secondary system, the phase currents in the primary feeder can approach several thousand ampere or more. With perfect CT’s for the feeder relays, the residually connected ground relays experience virtually no current, other than that due to system unbalances as discussed in item 1 above. However, should a phase CT saturate, a false residual is generated, and a low-set device, 50G, could false trip. Practically, false tripping from this mechanism for faults in the secondary is usually not a problem. If poor quality CT’s with high secondary burdens were used, saturation might occur for faults in the low-voltage portion of the network.
-
Device 50 G on unfaulted primary feeders should not pickup from actual zero-sequence capacitive currents resulting from a ground fault on another primary feeder of the network. When a SLG fault occurs on a primary feeder of the network, close to the substation, relatively high zero-sequence voltage appears on substation MV buses that supply the network primary feeders. The duration of this high zero-sequence voltage is from time of fault inception until the breaker for the faulted feeder opens. This phenomenon is illustrated with the zero-sequence network of Figure 10, showing one faulted feeder and an unfaulted primary feeder in just the zero-sequence network.

Figure 10:
Zero-sequence network with delta grounded wye network
transformers and SLG fault on feeder 2.
In Figure 10, the faulted feeder sees ground fault current IGF, shown in red, and the breaker for the faulted feeder would open, preferably through the instantaneous ground relay for the faulted feeder. In the time between fault inception and opening of the breaker for the faulted feeder, a zero-sequence voltage appears on the substation bus, designated in green as V0-SUB, in Figure 10. Because of the zero-sequence capacitance of the unfaulted primary feeder, this gives rise to a zero-sequence current in the unfaulted feeder. Three times the zero-sequence current, designated as IG-UF in Figure 10 and shown in blue, is detected by the ground relays for the unfaulted feeder. The magnitude of this current is given by eq (1).
(1) $$ \ \ \ I_{G-UF} = \frac{3V_{0- SUB}}{X_{C}} $$
In equation (1), XC is the total zero-sequence capacitive reactance to ground of the unfaulted primary feeder. For 15-kV class feeders with shielded cables, Table 2 lists the lower bound on the capacitive reactance for 500, 750, and 1000 kcmil cables. Newer cables with XLP or EPR insulation would have higher capacitive-reactance.
Table 2:
Capacitive reactance of primary feeder cables.
Cable Size |
500 | 750 | 1000 |
|---|---|---|---|
XC (Ω/mile) |
4260 | 2830 | 2270 |
Data from a large metropolitan utility. Capacitive reactance of certain submarine cables and gas-filled cables is lower than in table. Capacitive reactance of XLP and EPR cables is higher than table values.
The ground current on the unfaulted feeder, IG-UF, is proportional to the zero-sequence voltage on the substation bus during the single line-to-ground (SLG) fault. The zero-sequence voltage is a function of the neutral grounding method used at the substation, either solid, reactance, or resistance, and the degree of grounding as determined by the sequence impedance ratios at the MV bus (see Table 1 in Primary System Grounding).
Figure 11 plots the zero-sequence voltage on the substation bus for reactance grounded systems, as a function of the ratio of X0 to X1 at the station bus, for faults on the line side of the feeder breaker.

Figure 11:
Substation bus zero-sequence voltage for SLG fault at
substation with reactance grounding.
Figure 12 plots the zero-sequence voltage on the substation bus for resistance grounded systems, as a function of the R0 to X1 ratio at the station bus, also for faults on the line side of the feeder breaker. The curves in Figure 11 and 12 give the maximum zero-sequence voltage on the substation bus for the SLG fault. As the fault is moved out along the network primary feeder, away from the substation, the zero-sequence voltage on the substation bus generally decreases.
With resistance grounding at the substation, the zero-sequence voltage on the bus could approach 100% of the nominal phase-to-ground voltage, depending on the neutral grounding resistance.

Figure 12:
Substation bus zero-sequence voltage for SLG fault at
substation with resistance grounding.
Assuming 100% zero-sequence voltage at the substation (V0-SUB in Figure 10), and 500 kcmil paper insulated cable for the primary feeders, the ground current in the unfaulted feeders in a nominal 13.2 kV system would be 5.4 amperes per mile of feeder cable length. This is an upper bound on the ground current per mile of cable in the unfaulted primary feeder. With the total length of all cables in the unfaulted feeder not exceeding 10 miles, the ground current in the unfaulted feeder, IG-UF, would not exceed 54 amperes.
Allowing for transient ground currents in the unfaulted primary feeder during the SLG fault, from the above it can be concluded that device 50G for network primary feeders should probably not be set below several hundred amperes to avoid tripping on the capacitive current for SLG faults on other (adjacent) primary feeders.
- Device 50 G for unfaulted primary feeders should not operate for false residuals from saturation of phase current transformers (CTs) when energizing a network feeder whose protectors are open. When a network feeder with delta wye-grounded network transformers is re-energized follow an outage, the sum of the three phase currents is virtually zero. The small residual present is due to capacitive currents from unbalances in phase-to-ground cable capacitances, and pole span of the feeder breaker on closing.
However, the magnetizing inrush current from the network transformers in one or more phases may have a significant dc component. If this causes saturation of the phase CTs at the substation, it creates a false residual current that can cause operation of device 50G. Although this is believed to be a rare event in secondary networks for ground relays with instantaneous ground settings as given in Table 1, which are as low as 300 amperes, tripping from false residuals has occurred in practice.
The top half of Figure 13 shows the waveform of the inrush current in one phase to a transformer being energized in an industrial application. There is a significant dc component, which after a time period, results in saturation of the phase CT. The transformer being energized had a delta connected HV winding, and the sum of the actual three phase currents was near zero. However, the plot of the residual current from the three CTs, in the bottom half of Figure 13, shows that approximately 100 milliseconds after fault application, a false residual occurs due to CT saturation. False residuals must be considered when the instantaneous ant time-overcurrent ground relays for network primary feeders have low settings, and are supplied from the residual connection of CT secondary windings.


Figure 13:
Inrush current in one phase and false residual due to CC
saturation (courtesy of Schneider Electric).
-
Device 50G for unfaulted primary feeders should not operate from false residuals for faults on other primary feeders. With reference to Figure 2, the normal sequence when a fault occurs on a primary feeder is as follows. Upon fault inception, and before the breaker for the faulted feeder opens, the voltage on one or more phases of the substation bus is depressed, depending on fault type. High currents are in the faulted phase(s) of the faulted feeder at the substation, with much lower currents in the unfaulted primary feeders at the substation. But after the breaker for the faulted feeder opens, the voltage on the substation bus returns to near normal. The backfeed currents in the network transformers on the faulted feeder, as well as the currents in the unfaulted (adjacent) primary feeders increase significantly following opening of the breaker for the faulted feeder, the exception being for the SLG fault. As the network protectors on the faulted feeder open, the currents in the unfaulted primary feeders decrease to load current levels. Device 50 G on unfaulted primary feeders should not pickup for any false residual currents for this condition. Similarly, the phase relays on the unfaulted primary feeders must not reach through the network and must not operate for faults on another primary feeder.
-
Device 50G setting should be low enough so that it operates for all ground faults on the primary cables, and for ground faults in the HV leads within the network transformer as shown in Figure 3, up to the point where the leads enter the HV winding. When setting the pickup of 50G, the type of grounding for the primary (MV) system at the substation and its impact on available ground current at each point along the primary feeder must be considered.
Figure 23 in Primary System Grounding is a plot of the available three-phase fault current and SLG fault current along a network primary feeder, with both solid and resistance grounding at the substation. It illustrates the effect of resistance grounding on the SLG fault current profile as the fault moves out the feeder. This figure is repeated in this chapter as Figure 14.

Figure 14:
Fault current profile for solid grounding and resistance
grounding.
The system parameters are such that with solid grounding, both the three-phase and SLG fault currents at the station MV bus are 25 kA, and with resistance grounding, the current for the SLG fault at the substation bus is limited to 4 kA, the value available in one 15 kV class system that uses resistance grounding.
Comparing the curves for the SLG fault current with solid grounding (green colored curve) and with resistance grounding (blue colored curve) shows that the SLG fault current is not only much higher with solid grounding, but it decreases much faster with the distance from the substation to the fault. With resistance grounding, the zero-sequence impedance at the substation MV bus is significantly higher than the sequence impedances per unit length of the primary feeders. Thus, increasing the distance to the fault point does not have as much effect on the total impedance at the fault point, and on the SLG fault current as with solid grounding.
As mentioned in Primary System Grounding on MV system grounding, an advantage of limiting ground fault current is that it can reduce the energy into SLG faults in cables, splices, and in network transformers. But to achieve this, device 50G at the substation should pickup for all SLG faults between the substation and the most remote point on the primary feeder. This reduces the chance of a disruptive type failure in cables and splices, especially if limiting the ground fault current, in conjunction with rapid clearing, prevents the SLG fault from spreading to a second or third phase. If the SLG fault spreads to a second or third phase, greater power and energies are delivered to the fault.
Although limiting current for the SLG fault may be effective in preventing the SLG fault propagating into a multi-phase fault for faults in single conductor cables and splices, there is evidence that if the SLG fault occurs in the HV terminal compartment or switch compartment of a network transformer, it will spread to other phases before the feeder breaker can open.
Regardless, efforts should be made to set 50G such that it operates for any SLG or DLG fault on the network primary feeder, including the SLG fault in network transformer switch or terminal compartments, and in the HV leads inside the transformer tank to the point where the HV leads enter the transformer windings. Equally important, as discussed before, 50G must be set high enough so that it does not false trip. Setting of the pickup of the instantaneous ground relay, 50G, must be coordinated with the type and degree of grounding employed at the substation for the MV system. The data in Table 1 shows that the pickup of the ground instantaneous current relay can be much lower than the pickup of the phase instantaneous current relay.
-
The pickup setting of device 50G, especially when resistance grounding is used, must consider the reduction in total ground fault current on the station bus, and out on the primary feeder when one or more substation transformers are out-of-service. In the curves of Figure 15, the current for the SLG fault on the station bus is 4000 amperes. If the station had four transformers feeding the MV buses, each with its own neutral grounding resistor, and one transformer is removed from service, the current for the SLG fault on the MV bus would be about 75% of that when all four transformers are in service, or 3000 amperes.
-
The pickup setting of 50 G, especially with resistance grounding of the MV system, should consider the effect of the reduction in fault current due to arc voltage at the point of fault. The arc voltage in air at atmospheric pressure is around 40 volts per inch of arc length, plus the voltage drop at the anode and cathode. If arcs in cables, splices, and other apparatus behaved similarly, the effect of arc voltage on SLG fault current would be negligible, because arc voltage is very small in comparison to MV system line-to-neutral driving voltage, 7620 volts in a 13.2 kV system. However, for arcs in cable and splices, test data, although showing considerable variability depending on particulars, reveals that arc voltages are much higher due to the closeness of materials that reduce the arc temperature, and the higher pressure due to the confinement of the arc. Arc voltages in XLPE cables and splices typically could be in the range of 1000 volts crest, looking like a square wave. These voltages in PILC cables and splices on average have a crest voltage of about 500 volts. The rms value of the fundamental frequency component of the square wave with a 1000-volt crest is about 900 volts rms. In a 13.2 kV system, the current for an arcing ground fault would be no lower than about (7620-900)/7620, or 88.2% of the calculated current for the bolted SLG fault.
Ground Time Overcurrent Relay Settings with Delta Wye Network Transformers
The ground time overcurrent relay, device 51G, can have pickup setting much lower than the pickup of the ground instantaneous current relay, device 50G, due to the time delay. Under normal operating conditions, the residual of the phase currents, which is the ground current, is very small in a symmetrical system. For example, in a 13.2 kV system under normal operating conditions with the zero-sequence voltage on the substation MV bus being 4%, an upper limit, the ground current in the feeder breaker would not exceed 0.23 amperes per mile of cable, assuming a capacitive reactance to ground of 4000 ohms per mile. If the feeder contained 10 miles of cable, the residual (ground) current in the feeder at the substation would not exceed the 2.3 amperes. From the typical setting of 51G as given in Table 1, the pickups are at least an order of magnitude above 2.3 amperes. False tripping of a low-set 50G or 51G during unfaulted conditions is not a concern with dedicated primary feeders having delta wye-grounded connected network transformers.
The issues identified with the setting of device 50G must also be considered when setting the pickup and time delay for the ground time overcurrent relay, device 51G. But because of the time delay, the issues usually are not as critical. The issues are:
-
Device 51G should not time-out from actual zero-sequence currents in the primary feeder for faults in the secondary system, or from false residual currents for faults in the secondary system.
-
Device 51G on unfaulted primary feeders should not time-out for ground faults on other primary feeders of the network from capacitive zero-sequence currents. When the bus-tie breakers in the substation supplying the network feeders are open, or else not present as in the system in Figure 2 in Network Substation Design, a ground fault on one primary feeder of a network gives virtually no zero-sequence voltage on the other bus sections. With each primary feeder coming from a different bus section, the residual of the capacitive currents in the unfaulted primary feeders is very small, being the same as during unfaulted conditions. False tripping of feeder breakers on the bus sections supplying unfaulted primary feeders would not occur from this phenomenon. However, the unfaulted primary feeder, supplied from the same bus as the faulted feeder, will have zero-sequence capacitive currents in the time period between fault inception and opening of the breaker for the faulted feeder.
-
Device 51G for network primary feeders should not time out for false residuals from phase CT saturation when energizing a network feeder whose network protectors are open.
-
Device 51G for unfaulted primary feeders should not time out from false residuals for faults on other primary feeders, where the possibility of a false residual increases after the breaker for the faulted feeder opens.
-
The pickup setting and time delay settings of 51G, especially when resistance grounding is used for the MV system, should consider the effect of the reduction in fault current due to arc voltage at the fault point.
-
The pickup setting and time delay of 51G on dedicated primary feeders should be as low as possible to provide early detection of “high-impedance” ground faults within the delta connected HV winding of network transformers.
When a fault occurs within the HV winding of a network transformer, it may start from turn-to-turn, or layer to layer, and then progresses until it either draws sufficient current to operate the phase relays at the substation, or else goes to ground. The pickup of the phase time overcurrent relay may be 10, 20, or higher multiples of the full load current of the network transformer. The phase relays do not provide sensitive fault protection for ground faults within the HV windings of the network transformer.
A turn to turn, or layer to layer fault in the HV winding of the network transformer could result in opening of the faulted (delta connected) primary winding. If one end of the open winding would go to ground, the current to ground will be limited by the impedance of the transformer winding, and will be much less than the current for a fault from a line lead to ground in the transformer. To provide the most sensitive protection for high-impedance ground faults in the delta connected HV windings, and minimize the energy input to such faults and reduce the chance of rupture of the main tank of the transformer, the pickup and time delay setting of 51G should be as low as possible.
The data in Table 1 are representative of the settings of phase and ground relays for 15 kV class dedicated network feeders with delta wye connected network transformers. They show the low pickup and time delay settings possible for the ground relays. Figure 15 plots the time-current curves for the data in row 2, illustrating the increase in sensitivity provided by ground relays 50G and 51G for incipient high-impedance ground faults in a delta connected HV winding of a network transformer.
From these curves, an incipient high-impedance ground fault, or low-magnitude ground fault current in the HV winding of 1000 amperes would not be detected by the feeder phase relays (characteristics shown with red curves). In contrast, ground currents above 1200 amperes are detected in less than 6 cycles by device 50G, and device 51G will detect ground currents above abut 100 amperes, although the tripping time will be longer at the lower currents detected by 51G.

Figure 15:
Phase and ground relay settings from row two of Table
5-1, 12 kV system.
Further, from Figure 15, device 51G should not time out from capacitive currents for ground faults on an adjacent primary feeder. Shown in Figure 15, with the heavy green double-arrow, is the upper limit on the range for capacitive ground current in the unfaulted (adjacent) feeders in 15 kV class systems. Assuming a SLG fault on feeder 2 in the sketch on Figure 15, drawing more than 1200 amperes, the breaker for the faulted feeder would open in about 6 cycles or less. From Figure 15, if the capacitive ground current in the unfaulted feeder exceeded about 90 amperes, which is very unlikely, device 51G for the unfaulted feeders will start to time. But it will never time out, because opening of the breaker for the faulted feeder removes the zero-sequence voltage from the substation bus (see Figure 10), and stops the flow of capacitive zero-sequence current in the unfaulted primary feeders.
Even if the ground instantaneous relay for the faulted primary feeder did not pickup, the ground overcurrent relay for the faulted feeder sees a ground current at least an order of magnitude higher than the capacitive ground current in the unfaulted primary feeder. The breaker for the faulted feeder will trip through 51G before the ground relay (51G) for the unfaulted primary feeder can time out. However, should the breaker for the faulted feeder fail to open, the fault will be cleared by a backup device, resulting in a longer clearing time, and the capacitive currents in the unfaulted feeders will persist for a longer time. This also must be considered when setting the pickup and time delay for device 51G.
Ground relay settings on non-dedicated network feeders
Also shown in Figure 15 with the blue colored curves are the minimum melting and total clearing curves for a 150E ampere fuse that could be applied with non-network transformers when the primary feeders are non-dedicated. Two such transformers are shown in the schematic on Figure 15. The purpose of the fuses at the HV side of the non-network transformers is to prevent a fault in a non-network transformer from tripping the feeder breaker and causing an outage to customers served from other non-network transformers on the primary feeder.
A comparison of the fuse curves and ground relay curve show that if the ground relays (green colored curves) were set to be selective with the 150E fuse on the HV side of the non-network transformers, the pickup of the ground time overcurrent relay, and the pickup of the ground instantaneous relay must be increased appreciably. This results in a significant reduction in the protection sensitivity offered the network transformer for high-impedance ground faults in the delta connected HV winding. De sensitizing the ground relay to achieve coordination is not recommended.
Figure 7 showed the pickup of the phase time overcurrent relay (1680 amperes) and the pickup of the phase instantaneous current relay (6000 amperes), with the red colored curves for a high-capacity network feeder. For the listed CT ratio in Figure 7, the pickup of the short-time CO-2 ground relay is 360 amperes as shown with the black colored curve. Low settings such as this increase the chance of detecting incipient high-impedance ground faults in delta connected HV windings of network transformers.
Figure 16 shows how another large operator of 15 kV class networks sets the phase and ground relays for the primary feeders. The ground relay is an electromechanical-type SC instantaneous unit, set to pickup at 320 amperes. In contrast, the pickup of the phase time overcurrent relay is 720 amperes, and the pickup of the phase instantaneous relay is 4800 amperes. Shown on the curves with the heavy green arrow is the upper bound of the range for the capacitive ground current on unfaulted primary feeders, persisting from the time of fault inception until the breaker for the faulted primary feeder opens. The pickup of the ground instantaneous current relay, 320 amperes, is above the maximum capacitive ground current in the unfaulted primary feeders. The ground relay will detect much lower magnitude ground currents in the delta connected HV winding of faulted network transformers, than detected with the phase relays.
Figure 17 is another example showing how utilities can set the ground relay more sensitive than the phase relays in dedicated network primary feeders which have network transformers with the delta connected HV windings. Shown with the red-colored curves are the phase relay time overcurrent and instantaneous characteristics. Ground relay characteristics are shown with the green-colored curves. The ground relay settings shown in Figure 17 are not as sensitive as in Figures 15 and 16, but they do provide much better protection than the phase relays for incipient ground faults in the delta connected HV windings of network transformers.

Figure 16:
Network primary feeder instantaneous ground relay with
low pickup.
Figure 17 also illustrate that if the ground relays were set to coordinate selectively with the fuse in a non-dedicated feeder application, it would sacrifice the sensitive protection provided to network transformers for incipient ground faults in the delta connected HV windings.
When non-dedicated primary feeders, having network transformers with delta connected HV windings are also supplying other transformers with their primary windings connected from phase-to-ground (neutral), as discussed in Primary System Grounding, zig-zag grounding banks are applied to limit the overvoltages during backfeed to the SLG fault on the feeder with the feeder breaker open. If the grounding banks were not installed, the line-to-neutral load supplied from the transformers with the line-to-neutral connected primary winding would experience a temporary overvoltage of 173%. Although the zig-zag grounding bank prevents the overvoltages, they complicate the setting of the feeder ground relays at the substation.

Figure 17:
Network primary feeder phase and ground relay settings
for one operator of 15 kV class systems.
Ground Relay Settings, Wye-Wye Connected Network Transformers
When network transformers in systems with dedicated primary feeders have the grounded-wye connections for both the primary and secondary windings, which is the situation for the networks fed from the substation in Figure 6 of Network Substation Design, the steady-state currents for ungrounded faults (three-phase and phase-to-phase), in either the primary or secondary system, are practically the same as when the network transformers have the delta connected primary windings. The issues to consider when setting the phase relays are the same as those mentioned in Phase Relay Settings for setting the phase relays when the network transformers have the delta connected primary windings.
With the grounded wye-wye connections for the network transformers, the ground instantaneous current relay, and the ground time overcurrent relay for the primary feeder breakers can’t be set as sensitive as with delta wye-grounded network transformers. In the zero-sequence network, the wye-wye connected network transformer is a through path between the primary and secondary system. In contrast, with the delta wye-grounded connections, there is no connection between the primary and secondary systems in the zero-sequence as shown in Figure 10. With the delta wye-grounded connections, the zero-sequence networks of the primary and secondary system are isolated.
Figure 18 shows the zero-sequence network for a portion of a system with wye-wye connected network transformers, showing the primary and secondary systems. There are three primary feeders, having one network transformer on Feeder 1, two transformers on Feeder 2, and two transformers on Feeder 3. The zero-sequence networks of the primary and secondary are not isolated, but are interconnected by the leakage impedances of the network transformers.
Ground Faults in Secondary System
For a bolted SLG fault on either the spot network paralleling bus, or at the low-voltage terminals of a network transformer for the grid network in Figure 18, high ground currents flow in the primary feeders. For example, with 2500 kVA, 7% impedance network transformers in the spot network, the component of ground fault current in nominal 12 kV primary feeders 2 and 3, for the bolted SLG fault on the paralleling bus, will approach 1718 amperes in the feeder at the substation. In addition, there will be some ground current in the feeders at the substation due to unbalanced loading in the network, which adds vectorily to the fault component. Consequently, the ground instantaneous current relay, if used, must be set high enough so that it does not pickup for bolted SLG faults in the secondary system. In contrast, this is not an issue when the network transformers have the delta wye-grounded connections. See the last column of Table 1, which lists the 50G pickup settings used when the network transformers have the delta connected primary winding. Most of the settings listed in the table could not be used if the network transformers had the wye-grounded wye-grounded connections.

Figure 18:
Portion of zero-sequence network with wye-wye network
transformers, faulted feeder breaker closed.
Ground Faults on Network Primary Feeder
When the SLG fault occurs on any primary feeder of the network, and the network transformers have the delta connected primary windings, only capacitive currents flow in the unfaulted (adjacent) primary feeders. The duration is for the time from fault inception to tripping of the circuit breaker for the faulted feeder.
With reference to Figure 18, with a SLG fault on Feeder 3, the residual (three times the zero sequence) current in the breaker for faulted Feeder 3 is quite high, because the source substation must be effectively grounded (X0 / X1 <3, R0 / X1 <1) when the wye-wye connections are used for the network transformers. The ground current for a fault at the substation will be at least 60% of the current for the three-phase fault. The residual current in the unfaulted feeders will be much less with the breaker for the faulted feeder, Feeder 3, closed. In Figure 18, only two of multiple unfaulted primary feeders are shown. If there were no load on the network, the backfeed current on the faulted feeder would be distributed between the in-service unfaulted primary feeders, but not necessarily equally. The backfeeding network protectors on faulted Feeder 3 would trip out. For the unfaulted feeders in Figure 18, with the faulted feeder breaker closed:
-
The ground instantaneous relay, 50G, for each unfaulted primary feeder, Feeder 1 and Feeder 2, in the example in Figure 18, must not pick up. Practically, this means that the pickup of the feeder ground instantaneous current relay can be set no lower than the pick up of the phase instantaneous current relay. Some systems with wye-wye connected network transformers do not use ground instantaneous current relays for this reason.
-
The ground time overcurrent relay, 51G, in the unfaulted feeders must not time out. In Figure 18, when the breaker for faulted Feeder 3 opens, as shown in Figure 19, the backfeeding network protectors will trip without time delay on backfeed to the SLG fault. If for any reason a backfeeding network protector fails to open, the backfeed would be cleared by blowing of the network protector fuse(s) in the backfeeding protector. The ground time overcurrent relay for the unfaulted (adjacent) feeders must be set and selected such that they will not time-out during a backfeed that is cleared by normal opening of all protectors on the faulted feeder, or when the backfeed is cleared by blowing of the network protector fuse(s) should a protector fail to open. Evaluating this coordination requires data on the division of the backfeed current in the faulted feeder between the unfaulted primary feeders, as well as data on the current magnitudes.
-
The currents in the unfaulted primary feeders, following opening of the breaker for the faulted feeder will be higher than when the breaker for the faulted feeder is closed. The magnitude of the current in each unfaulted primary feeder will vary depending on the number of backfeeding protectors. This can be determined from a detailed short-circuit study of the system under consideration.
If a protector fails to open after the breaker for the faulted feeder opens, as in Figure 19, and if the protector that fails to open is connected to the grid network at a fringe area where the network impedance is high, the time for the fuses in the backfeeding protector to open can be quite high. In one known situation, where this happened for a fault in a manhole with multiple primary feeders, before the backfeeding protector fuses blew the fault spread to another primary cable in the manhole. The protector current for a backfeed to a SLG fault from a fringe area of the network can be quite low, as the zero-sequence impedance of the network at the backfeed location in grid networks can be much higher than the positive-sequence impedance.
Setting the ground relays for network feeders is more complex when the network transformers have the wye-wye connected windings.

Figure 19:
Portion of zero-sequence network with wye-wye connected
network transformers, faulted feeder breaker open.
Figure 20 shows the settings and time-current curves for the phase and ground relays for the 34.5 kV primary feeders in a secondary network system with wye-wye connected network transformers.
For this particular system, only two, three, and four-unit spot networks are supplied from the 34.5 kV primary feeders. Also shown in the figure is the time-current curve for a 2825-ampere NPL network protector fuse (blue colored curve) on the 480-volt side, plotted in amperes referred to the primary based upon the turns-ratio of the network transformer (19920/277 or 71.9). Detailed analysis of the system showed that for faults in the secondary, the phase instantaneous relays at the station would not pickup, yet they would pickup for all phase-to-ground faults on the 34.5 kV primary feeders. The curves in Figure 20 also show that for the bolted SLG fault in the secondary, the network protector fuses would blow before the ground relay for the feeder (green colored curve) could time out. The analysis included the effects of secondary load current on the total currents in the primary feeders at the substation.

Figure 20:
Phase and ground relay settings and curves for 34.5 kV
network having wye-wye connected network transformers.
Further, detailed analysis of the system for SLG faults on the primary feeder showed that the coordination between the tripping of the network protector on the faulted feeder and the ground time overcurrent relay on unfaulted primary feeders was very tight immediately following opening of the faulted feeder breaker with all backfeeding protectors being closed. But as the backfeeding protectors sequenced open, the total backfeed current decreased, and the coordination between protector fuse blowing in the backfeeding protector and breakers on the unfaulted feeders improved. If one backfeeding protector failed to open, the backfeeding protector fuse, which experienced the entire backfeed current, was much faster than the ground relay for the unfaulted primary feeders, which experienced the same or somewhat less current than the total backfeed current.
Limiting Energy Input From Substation To Faulted Equipment
Faults on the network primary feeder, faults in the HV terminal compartment, switch compartment, or the HV leads and de-energized tap changer within the main tank of the network transformer can’t be cleared from the substation side, any faster than the total clearing time of the feeder breaker. The total clearing time with modern circuit breakers and instantaneous current relays can be as fast as three cycles, with the total clearing time being relay time and breaker time. With older circuit breakers, total clearing time from the substation side may be five cycles or more.
For high-current ground faults as can occur with solid grounding at the substation, or for high-current faults involving two or more phases, the energy allowed into faults in primary cable splices, network transformer terminal compartments, and network transformer switch compartments may be high enough to cause a disruptive failure. This failure can result in the displacement of a manhole cover from the explosive effects of the high current arcing in a manhole, the propagation of the fault to another primary circuit in the same manhole, or the explosion and the ignition of the fluids in the terminal compartment or switch compartment on the HV side of the network transformer.
Figure 21 shows the effect of a high-current fault in a primary cable circuit in a manhole, where the explosive effects resulted in the displacement of a manhole cover, that apparently impacted a car.

Figure 21:
Displaced manhole cover from fault in primary circuit in
manhole (courtesy Bill Deal of Dominion Energy).
Figure 22 shows the results of a fault in the terminal compartment of a network transformer, where the cover plate, seen lying on the vault floor, was blown off of the terminal compartment. Reference to the EEI AC Network Operation Reports reveals that these types of failures have always occurred in network systems, due to the energy input allowed in the time required for the station breaker to open.

Figure 22:
Result of fault in terminal compartment where cover
plate was blown off (courtesy Nashville Electric).
Figure 23 shows the effects of a fault in a cable terminator on the terminal compartment of a network transformer, where the vault removable roof covers were displaced. For this particular event, the feeder breaker at the station tripped through instantaneous current relays, giving the fastest possible clearing time from the station end when circuit breakers are used.

Figure 23:
Result of fault initiated in cable terminator on
terminal compartment of a network transformer (courtesy PG&E).
Figure 24 is another example illustrating the energy release that can occur from an explosion in a manhole. A large Cadillac Escalade SUV was flipped onto its side.
To reduce the probability of disruptive occurrences from high-current arcs in the primary system, current-limiting devices have been installed by several utilities in secondary network systems with 15 kV class primary feeders. They are placed in series with the feeder breaker at the substation, as shown in Figure 25, and limit the energy supplied to the fault from the substation end. In effect, the current-limiting devices act like phase instantaneous current relays, except they perform both the detection function and the current interrupting function. They can limit the peak current to less than the prospective peak current, and interrupt the fault current from the substation side in less than a cycle. Of course, they will not limit the backfeed current from the network into the fault path.

Figure 24:
Large Cadillac Escalade SUV flipped on its side from an
explosion in a manhole (the city.nyc, 2006).

Figure 25:
Electronic current-limiting fuse installed in primary
feeder at substation.
The electronic current limiting fuse is available from at least two manufacturers. The one shown in Figure 26 is a single-phase device that is installed in each phase. It senses either the instantaneous phase current, or the rate of rise of the phase current, depending on the manufacturer. When the current exceeds the set trigger level, the sensing unit actuates a linear cutting device, which segments the heavy copper conductor into a number of fractional lengths, bending them upwards and forming multiple gaps. The resultant arc voltage across the multiple gaps causes transfer of the short circuit current to a parallel current-limiting fuse assembly. The current-limiting fuse interrupts the faulted phase current contribution from the substation in less than one cycle.
The issues that must be considered when setting 50ϕ at the substation so that it does not false trip, trip for faults in the secondary system, or for faults on other primary feeders, as discussed before in this chapter, must be addressed when applying the electronic current-limiting fuses.

Figure 26:
Basic components of the Clip®
current-limiting device (courtesy G&W Electric).
Experience to date has shown that the devices can be effective in reducing the chance of a manhole cover displacement from faults in primary cable splices, or the rupture of a terminal or switch compartments on the network transformer. Further, by limiting the energy into the fault when the available fault currents are high, they reduce the chance of a fault from phase-to-ground propagating to a second phase, or a fault on the primary feeder in a manhole from propagating to other primary feeders in the same manhole. On the negative side, the devices can be quite expensive and large in size. The size of the devices can make them hard or impossible to retrofit in existing substations. Further, when such devices are installed, it is necessary to re-evaluated work practices, grounding practices, fault locating procedures, and cable testing procedures.
Figure 27 shows the let thru current of the Clip® device of Figure 26 when the available fault current is either symmetrical, or asymmetrical where the fault is initiated at the zero point on the voltage wave.

Figure 27:
Current waveforms for both symmetrical and asymmetrical
available fault current (courtesy G&W Electric).
For either fault condition, the let-through current is much less than the available peak current, and the interrupting time is one half cycle or less.
The current-limiting device of Figure 26 is a single-phase device, and it will only open the phase which sees the high fault current. In the case of a SLG fault, only the current-limiting device in the faulted phase will operate. But the control unit has auxiliary contacts which can then be used to initiate tripping of the circuit breaker of the feeder it is applied in.
Figure 28 show the G&W Clip® current-limiting device, one in each phase, installed in the substation downstream of the circuit breaker for a network primary feeder. Since each is a single-phase device, a trip signal is issued to the feeder breaker so that all three phases are opened at the substation. When this occurs, then all backfeeding network protectors should open to isolate all sources of energy to the fault on the primary feeder.

Figure 28:
Electronic current-limiting fuse in separate compartment
within substation (courtesy of G&W Electric).
Figure 29 illustrates the reduction in I2t that is possible for the current supplied from the substation to the fault with these current-limiting devices. With a five-cycle circuit breaker, the I2t is 52*106 amp-squared seconds, but with the Clip® device the I2t is limited to 0.4*106 amp-squared seconds, or a reduction by a factor of 130. However, as can be seen from Figure 25, energy is also supplied to the fault on the primary feeder or fault in the network transformer switch or terminal compartment from the low-voltage network until all backfeeding network protectors open. The energy supplied to the fault from the network backfeed usually is much less than that supplied from the substation end. The fault energy supplied from the backfeed is dependent upon the type of fault, single line-to-ground versus multi-phase fault, and the winding connections of the network transformers. With the SLG fault on the primary feeder and the delta connection of the primary windings, the energy supplied to the fault from the backfeeding network protectors with the feeder breaker open is relatively low. But with wye connected primary windings, the energy backfed to the SLG fault will be higher. For multi-phase faults, the backfeed current and energy supplied to the fault with open feeder breaker will be higher than with the SLG fault. In evaluating the effectiveness of these devices, the energy supplied to the fault from both the substation side and backfeed from the network side must be considered.

Figure 29:
Comparison of the current let through without and with
the current-limiting device at the station (courtesy of G&W Electric)
The greatest benefit of these devices is realized in systems that employ solid grounding of the MV system at the substation, where the currents for the SLG fault on the primary feeders can be quite high. With solid grounding, the available fault current (both rms value of symmetrical component and instantaneous peak) can be much greater than the trip setting of the current-limiting device. The devices limit the energy input from the substation end in the faulted phase(s) for all high-current faults.
When resistance grounding is employed for the primary system, where current for the SLG fault is limited to 4000 amperes or less, the current for the bolted SLG fault at the substation may be less than the current needed for operation (triggering) of the current-limiting device. Thus, the device would not operate for SLG faults on the primary system, providing the fault does not propagate into a multi-phase fault in the time required to clear it with opening of the feeder breaker at the substation. Considering that most faults start as SLG faults, it can be argued that the need for electronic current-limiting fuses to prevent manhole cover displacements for faults in single-conductor primary cables and splices is not that great when ground fault currents are limited to low values with resistance grounding, or reactance grounding. The potential benefits for faults in single-conductor cables and splices is not as great when the SLG fault currents are limited to low values.
However, for faults in network transformer terminal compartments and switch compartments that start from one phase to ground, with the ground fault current limited with resistance grounding to a level where the current-limiting device does not operate, the SLG fault may propagate to another phase or phases in the time required for a conventional circuit breaker at the substation to clear. If this happens, there will be two to three cycles or more of high-current arcing. What was initially a low-current SLG fault becomes in a cycle or less a high-current phase-to-phase fault, or multi-phase to ground fault, which in the absence of the current-limiting device delivers high energy into the faulted equipment. Installation of the current-limiting device for this scenario, or if the fault starts between phases in the terminal or switch compartment, will reduce the energy input to the multi-phase fault and reduce the chance of a disruptive failure, as illustrated in Figures 22 and 23.
The current-limiting device in Figure 28 has auxiliary contacts such that when the device in any one phase operates, the breaker with which the device is used is tripped. But if the operation of the current-limiting device in any one phase does not initiate tripping of a circuit breaker, then fault conditions are created which may not be detected by the network protector relays in the backfeeding protectors This condition is shown in Figure 30, where for a SLG fault the current limiting device in just the faulted phase has opened, but the feeder breaker remains closed.

Figure 30:
Single line-to-ground fault on phase “A” with only
current limiting device in faulted phase open.
In Figure 30, the SLG fault on phase “A” has operated the current-limiting device in the faulted phase, but the circuit breaker at the substation remains closed. Although opening of the current-limiting device in faulted phase “A” interrupted the high current from the substation, there can still be a significant backfeed current to the fault path when all protectors on the feeder are still closed, shown as IF in Figure 30. This backfeed current will be interrupted if all network protectors open.
The fault condition shown in Figure 30 is a simultaneous fault condition, consisting of an open in the faulted phase, with a SLG fault on one side of the open phase. Depending upon the type of relays in the network protector and their sensitive trip characteristics, this simultaneous fault condition may not be detected with the feeder breaker closed, and the network protectors would not trip. It is for this reason that whenever a single-phase current-limiting device operates, the feeder breaker must open. If the current-limiting device doesn’t have auxiliary contacts that can be used to initiate tripping of the feeder breaker, protective relaying must be installed that will detect the unbalance due to the open phase, and trip the feeder breaker. With the feeder breaker open, then the network protectors should trip on backfeed regardless of the type of network relays in the protectors.
Limited experience suggests that when a fault occurs in single-conductor cable or their splices, the fault does not propagate to a second phase in the time required to clear the fault when the current-limiting device is at the substation.
Figure 31 shows the damage to a single-conductor cable installed in a tray in the substation when protected by the Clip® current-limiting device in a network system of Dominion Energy. The fault caused no damage to adjacent cables. In absence of the current-limiting device, the fault could have propagated to other cables or circuits when the available SLG fault current is high.
Figure 32 shows the G&W Clip devices installed in a substation of Dominion Energy that supplies large secondary networks. It can be seen that these devices take up considerable space, which may not be available if a retrofit is being considered.

Figure 31:
Damage to cable for phase-to-shield fault when protected
by current-limiting device at substation (courtesy of Dominion Energy).

Figure 32:
G&W Clip current-limiting devices installed in network
feeders at substation (courtesy of Dominion Energy).
Figure 33 shows the S&C Fault Fiter® current-limiting device installed in a network feeder at the Marion Substation of the Tampa Electric Company. The experience of this utility is that the devices have been very effective in preventing disruptive failures.
Figure 34 is an excerpt from an article in Electrical World magazine summarizing the experience that Tampa Electric has had with the S&C Fault Fiter® current-limiting device in the primary feeders of one six feeder network.

Figure 33:
S&C Fault Fiter® current-limiting devices
installed in a network feeder at substation (courtesy of S&C Electric).

Figure 34:
Excerpt from 1994 Electrical World magazine article on
experience with the S&C Fault Fiter® fuse in system with 14
kA three-phase on substation bus.
When the SLG fault is in liquid-filled apparatus, it can spread to another phase or phases in less than a cycle, regardless of the available SLG fault current. Because of the spreading, or the possibility of faults being initiated between phases in these equipment, high resistance grounding by itself must not be depended on in preventing rupture of terminal and switch compartments on network transformers. Similarly, use of high-reactance grounding at the substation can’t be depended on to prevent rupture. The feeder circuit breaker at the substation would not be expected to clear before the multi-phase fault results in the rupture of the small compartment. Limiting energy for faults in small liquid-filled compartments requires current-limiting devices at the substation.
Figure 35 shows the damage to the terminal compartment and switch compartment of a network transformer supplied from a network primary feeder with a current-limiting device at the substation. The current-limiting device was configured such that when any one phase operated, the feeder breaker was tripped. In Figure 35, the bolted-on cover plates were removed to show the internal damage. Prior to removal, external inspection showed no distortion to the compartments or cover plates, and there was no liquid expelled from either the terminal compartment of switch compartment. This finding points out that one disadvantage of the CL device is that there is minimal or no noticeable damage at the fault location, and no fire or smoke emitted from the transformer vault, making it difficult to located the faulted apparatus. The experience of this utility and others is that under similar circumstances the cover plates of the switch and or terminal compartment are blown off, and there is a fire involving the liquid or filling materials in the switch and terminal compartments.
The current-limiting devices that are installed in the substation for the network primary feeders will not be effective in preventing manhole explosions that result from arcing faults in secondary cables, just as the phase instantaneous current relays for the feeder breaker do not pickup for faults in the secondary system. Similarly, if a manhole or equipment enclosure contains an explosive gas mixture, a spark or low-current arc as allowed by a current-limiting device will not prevent ignition of the explosive gas mixture. Such explosions can dislodge manhole covers.


Figure 35:
Limited damage to terminal and switch compartment on 15
kV class network transformer from fault initiating in terminal
compartment (courtesy Siemens).
4.6 - Network Unit Equipment
NETWORK UNIT EQUIPMENT
The network unit consists of a three-phase high-voltage (HV) disconnect and grounding switch on the primary side of the network transformer, the network transformer, and the network protector on the low voltage (LV) side of the network transformer. Network units usually are located in below-grade vaults under sidewalks or streets, in vaults within buildings, and in some applications they have been mounted above ground on platforms. The HV switch is either a three-position disconnect and grounding switch inside a separate compartment that is welded to a side-wall or end-wall of the transformer main tank, or else a two-position ground switch that is inside the main tank of the network transformer with the core, coils, and tap changer if used. ANSI Standard C57.12.40 is the standard for subway and vault-type network transformers (liquid filled). The network protector frequently is bolted to a low-voltage throat on the end of the network transformer opposite the HV switch, although the network protector may be separately mounted from the network transformer, with multiple cables per phase connecting the LV terminals of the network transformer to the “transformer-side” terminals of the network protector. ANSI C57.12.44 is the standard for low-voltage network protectors.
Figure 1 shows the three major components of the network unit when the network protector is throat mounted on the end of the transformer opposite the HV switch. On the left on the end wall of the transformer main tank is the primary cable terminal compartment and the three-position disconnect and grounding switch. On the right side is the network protector, mounted on a low-voltage throat of the network transformer. Attached to the top terminals, or network-side terminals, of the network protector are cables for the secondary network. For a spot network, these cables would be connected to a paralleling bus, and for a 208-volt grid network the cables would feed a manhole with connections to secondary mains and perhaps customer services.

Figure 1:
Network unit with three-position disconnect and grounding
switch and network protector.
Figure 2 shows a network unit installed in a vault for a 480-volt spot network. On the left on the end-wall of the transformer is the terminal compartment for the primary cables, and the compartment for the HV three-position disconnect and grounding switch. On the right on the network transformer is the throat mounted network protector, consistent with the arrangement shown in Figure 1.

Figure 2:
Network unit for a 480-volt spot network (photo by
author).
Network units have also been constructed for pad-mounted installation for two-unit spot networks. Figure 3 shows a network unit for a two-unit non-dedicated feeder spot network in a suburban shopping center.

Figure 3:
Pad-mounted network unit in two-unit spot network with
current balancing transformers (photo by author).
The compartment on the left, with closed door, contains the primary cable terminations and HV current-limiting fuses, to isolate a faulted transformer from the non-dedicated primary feeder. On the right, with its door open, is a type CM-22 network protector, of special design, used with current balancing transformers to allow operation of two-unit spot networks from sources which have considerable difference in voltage magnitude and angle. Mounted below the network protector are the current balancing transformers, one in each phase. With reference to the discussion in Impact of Voltage Phase Angle on Spot Network Operation, the current balancing transformers in the two-unit spot network present a very high impedance to the circulating component of current, IC, and yet a relatively low impedance to the load component of the total current. They allow keeping both protectors closed down to low loads on the spot network, buy limiting the circulating component of current.
Spot networks with two or more network units have also been installed in the upper floors of high-rise buildings, and on the roof tops of buildings. Figure 4 (a) shows a high-rise office building, and (b) shows two network units installed on the roof of the building for a 480-volt spot network.

(a)

(b)
Figure 4:
Pad-mounted network units installed on building roof for
480-volt spot network (photos by author).
The pad-mounted network units have three compartments. In the left compartment is a three-position HV disconnect and grounding switch, in the center compartment is the network protector, and in the right compartment are the buses connected to the network protector “network-side” terminals, to which the secondary cables are attached.
Network units have also been installed on platforms in alleyways or other areas of commercial areas. In these systems the primary and secondary cables usually are below grade. Figure 5 shows a platform mounted network unit. On the right is the HV disconnect switch, and on the left is the network protector. The primary cables are in the vertical riser on the right side, and the secondary cables for the grid network are in the vertical riser on the left side.

Figure 5:
Network unit installed on a platform in a downtown area
(photo courtesy of Tom Kenny Eaton).
HV Disconnect and Grounding Switch
Most network units, for both area networks and spot networks, contain either a three-position HV disconnect and grounding switch, or else a two-position grounding switch.
Three-Position HV Switch
The three-position disconnect and grounding switch can assume one of three positions, open, closed, or ground as depicted in Figure 6. This switch, liquid filled, is usually located on one end of the network transformer main tank, and directly above the switch compartment is the terminal compartment for making connections from the primary cable to the network unit. There are bushings between the terminal compartment and the switch compartment so that the dielectric materials in the two compartments are not mixed. Similarly, there are bushings between the switch compartment and the main tank of the transformer, so that the insulating fluids in the switch and main tank are separated. Most often the switch compartment and terminal compartment have bolted-on cover plates to allow access. On some designs, the cable terminations are made directly to the switch compartment, as shown in Figure 7.

Figure 6:
Three-position disconnect and grounding switch.

Figure 7:
HV disconnect and grounding switch with 600 ampere
connectors (GE design, photo by author).
When the three-position switch is in the open position, the primary cable is disconnected from the transformer HV windings. When the switch is in the closed position, the primary feeder cable is connected to the HV windings of the network transformer. When the HV switch is in the ground position, the HV windings are disconnected from the primary feeder cables and a three-phase ground is applied to the primary feeder cables. Figure 8 shows the operating handle for a three-position disconnect and grounding switch, with the three-positions for the operating handle, open, close, and ground, clearly marked. Both compartments have bolted-on cover plates, but some users prefer designs with a welded-on cover plate as shown in Figure 9.
There are two basic types of three-position disconnect and grounding switches, either “dead break” or “mag break”.
Dead Break Switch
The dead break switch has no interrupting rating. With this design, an electrical interlock is incorporated such that if voltage is present on the secondary side of the network transformer, the switch can not be moved from any of the three positions shown in Figure 6. When the switch is in the closed position, mechanical design features are incorporated such that if voltage is on the secondary side of the transformer, a pause is enforced so that the electrical interlock can function. So, if the switch is in the “closed” position, it can not be moved to the open position, and it can’t be moved from the closed position to the ground position if there is voltage on the secondary side of the network transformer. If the switch were in the ground position, and the network protector were open such that there is virtually no voltage on the transformer side of the open protector, it can be moved from the ground position to the closed position. When the switch is in the closed position with the primary feeder energized, voltage appears on the secondary side of the transformer, and the switch can’t be moved to the ground position. But when in the open position, it can be moved to the closed position if the network protector is open as there is virtually no voltage on the secondary side of the network transformer.

Figure 8:
Operating handle for the three-position disconnect and
grounding switch with positions clearly marked - Westinghouse
design-(photo by author).

Figure 9:
Three-position disconnect and grounding switch with
welded on cover plates (photo by author).
Although the electrical interlock of the dead break switch will allow moving the switch from the open to closed position with the primary feeder energized when there is no voltage on the secondary side of the transformer (protector open), most system operators will not allow personnel to operate an energized oil or liquid filled switch in a vault, due to the possibility that if it fails during closing, there can be a violent failure with ejection of the cover plate. Closing of the switch, with the primary cable energized, from outside of the vault with a rope and pulley system may be acceptable.
Figure 10 shows another three-position disconnect and grounding switch on a Carte network transformer, with the switch being provided by Quality Switch.

Figure 10:
Three-position disconnect and ground switch on Carte
network transformer (Quality Switch design,(photo by author).
Mag Break Switch
The “mag break” switch has the capability to interrupt the magnetizing current of the network transformer, but it can not interrupt load current as would be the situation if the network protector were closed when the switch handle was moved from the closed position to the open position. It is intended to allow disconnecting the network transformer from an energized network primary feeder if the network protector is open, without taking the primary feeder out-of-service by opening of the feeder breaker at the substation.
The “mag break” switch has two electrical interlocks, as shown in Figures 11 and 12. The interlock on the left side in the figures prevents moving the switch from the closed position to the ground position when voltage exists on the secondary side of the network transformer. This interlock coil is connected to a LV phase of the network transformer. But the interlock on the left side in Figures 11 and 12 does not block moving the switch from the closed position to the open position when voltage exists on the secondary side of the transformer.
There are two basic configurations for the “mag break” switch, either locked when de-energized as shown in Figure 11, or locked when energized as shown in Figure 12.

Figure 11:
Mag-break switch interlock scheme where switch is locked
when de-energized (courtesy of GE).
With the locked when de-energized scheme in Figure 11, if the protector on the secondary side is open, the “b” switch in the network protector is closed. With the “b” switch closed, the interlock solenoid on the right-side is energized if there is voltage on the network side of the open protector, allowing the switch to be moved from the closed position to the open position to interrupt transformer magnetizing current. Note that the interlock solenoid on the left side does not block movement from closed to open. If the network protector is open and the switch is in the open position, the interlock on the right-side is energized, and will allow the switch to be moved from the open to the closed position. But if the switch is open and the network protector is closed, the right-side interlock is de-energized and will prevent moving the switch from the open position to the closed position. With this scheme, if the circuit between the “b” switch in the network protector and the right-side interlock coil were to open circuit (fail), the switch can’t be moved.
When the locked when energized scheme is employed with the “mag break” switch, as shown in Figure 12, if the protector is open, the “a” switch in the protector is open, and the interlock coil on the right-side is de-energized. This then allows moving the HV switch operating handle from the closed to open position to interrupt the transformer magnetizing current. But if the protector is closed and the network side energized, the right-side interlock solenoid is picked up, and the operating handle can’t be moved from the closed to open position. Similarly, if the switch is in the open position and the network protector is closed, the switch can not be moved from the open to closed position. The concern with the locked when energized scheme is that if the circuit between the “a” switch in the protector and the right-side interlock solenoid fails (open circuits), the switch could be moved from closed to open with the protector closed, causing the switch to interrupt load current, which it is not rated for.

Figure 12:
Mag break switch interlock scheme where switch is locked
when energized (courtesy of GE).
The magnetizing current-interrupting mechanism in the “mag break” switch is designed such that regardless of the speed at which the switch handle is moved from the closed to open position, the contacts open rapidly and there is no damage to the main contacts of the switch. And again, the “mag break” switch has a second interlock coil, located on the left-side in Figure 12, that prevents movement from the closed position to the ground position if voltage appears on the secondary side of the transformer.
Although the “mag break” switches are designed to interrupt the magnetizing current of the network transformer, with the protector open, many utilities will not allow personnel to operate the switch in the confines of a vault when the primary feeder is energized. In the event of a switch failure when breaking magnetizing current, high current arcs may be formed, which produce an explosion and ejection of the bolted-on cover plate of the switch. Utilities must understand the operation of the electrical and mechanical interlocks on both the dead break and mag break switches, and devise operating procedures that ensure that the switch will not be operated under conditions for which it is not intended, and its operation will not subject operating personnel to unsafe conditions should the switch fail.
As seen from the photos presented, the contact position of the HV disconnect and grounding switch can not be seen. Only the position of the switch operating handle is visible in the vault. Figure 13 shows a network transformer with a HV disconnect and grounding switch where there is a viewing port that allows the contact position to be seen. The switch operating handle can be seen in the bottom right of the picture.

Figure 13:
HV disconnect and grounding switch with window to view
contact position (photo by author).
The present standard for these switches, ANSI C57.12.40-2017 states, “The 60 Hz continuous rating of the switch in the closed position shall be 200 A”. At 12.47 kV, this corresponds to 4320 kVA, higher than the rated current of the largest size network transformer. But, at 4.16 kV, 200 amperes corresponds to 1441 kVA, which would allow using the switch on a 1000 kVA 4.16 kV network transformer. In the closed position, the standard states, “the network switch shall also be capable of withstanding a fault current in the closed position of no less than 5000 amperes for 2s. A minimum peak current (asymmetric value) of 9000 amps will be required”. At 12.47 kV, the maximum through fault current (symmetrical rms) with a 2500 kVA 7% impedance network transformer is 1654 amperes rms, assuming an infinite bus on the HV side of the transformer. At an X-to-R ratio of 13 for the transformer leakage impedance, the peak value of the asymmetric current wave is 2.53 times the rms value, or 4184 amperes crest.
The standard also addresses the short circuit rating, the short circuit thermal withstand, and the peak withstand rating when in the ground position. It emphasizes that when in the ground position, the switch shall function until operations occur that rely on backup relaying. This means that if a switch is in the ground position, and the feeder breaker at the substation is inadvertently closed, the feeder breaker could fail to open, and the duration of the fault current the grounding switch must withstand is that of the backup relaying time. With regards to the thermal rating, the standard indicates the switch shall withstand 15,000 amperes rms per phase for 5 seconds, with a minimum asymmetric value of 1.6 and a dc component with a decay time no longer than 45 ms.
The standard also addresses the peak withstand asymmetric current rating for the switch when in the ground position. In the ground position, it is the system that determines the current that flows for a three-phase ground. It indicates the switch shall withstand a three-phase short circuit of 45,000 amperes rms per phase, with a minimum asymmetric value of 2.38, applied for 0.2 s. The corresponding peak current of the asymmetric wave is 107 kA. An asymmetric value of 2.38 corresponds to a system X-to-R ratio of 8.0.
The requirements for the switch in the ground position, as given in the 2017 ANSI standard, are well defined. However, it must be recognized that in some systems, the available three-phase symmetrical short circuit current could exceed 45,000 amperes rms, and further the X-to-R ratio for faults close to the substation could exceed 8, in which case the peak asymmetric current seen by the switch in the ground position could exceed 107 kA The utility specifying the grounding switch must define for the supplier the maximum fault current (rms symmetrical, maximum peak current, decay rate), and the duration of its flow that is required for the switch in the ground position when cleared by backup relaying.
Mag Break Switch Interlock Coil Requirements
As shown by Figure 11 and 12, there are two interlock coil arrangements that have been used with the mag break switches on network transformers. The standard indicates that when magnetizing current interruption is required, “An electrical interlock shall be provided to prevent movement of the switch operating mechanism while the network protector is in the closed position. This interlock will permit the switch to operate from the closed to open position with the primary feeder energized and the network protector in the open position. This interlock shall lock when deenergized”. This suggests that the lock when energized scheme as in Figure 12 does not satisfy the requirements of the latest standard.
Table 1 lists for the interlock coil in the HV switch, for network transformers with secondary rated voltage of 216Y/125 volts, and 480Y/277 volts the maximum pickup voltage, the minimum dropout voltage, and the maximum excitation voltage.
Table 1:
Interlock coil requirements for HV disconnect and
grounding switch
Coil Voltage |
Maximum Pickup Voltage |
Minimum Dropout Voltage | Maximum Excitation Voltage |
|---|---|---|---|
| 125 | 90 | 15 | 140 |
| 277 | 200 | 33 | 310 |
Two Position Grounding Switch
A major user of network systems utilizes network units that have a two-position grounding switch, located inside the transformer main tank, as depicted in Figure 14. With this design, the primary cables enter the top of the network transformer main tank, with internal connections to the delta connected HV windings of the transformer. The two-position switch is in the same insulating fluid as the transformer windings, and is electrically interlocked such that it can’t be placed in the ground position if voltage exists at the secondary terminals of the transformer. Note that with this arrangement, the switch can’t be used to disconnect the transformer from the primary feeder cables. However, this is possible when the primary cables are connected to the transformer with 600 ampere separable connectors.

Figure 14:
Network unit with two-position grounding switch inside
main tank.
Figure 15 shows a portion of a network transformer in a vault, with single-conductor primary cables entering the top of the network transformer tank through lead wiping sleeves. On newer transformers, the cable connections on the primary side are made using 600 ampere dead break separable connectors. Seen on the side wall of the transformer in Figure 15 is the operating handle for the grounding switch, which can be padlocked in either the open (clear) or ground position. This particular utility also has network transformers where the switch operating handle is on the top of the transformer tank. A network protector is not throat mounted on the transformer in Figure 15, but instead is separately mounted, with cables between the low-voltage terminals of the network transformer and the network protector.

Figure 15:
Network transformer with two-position grounding switch
(photo by author).
When in the ground position, the two- position switch must be able to carry the maximum three-phase short-circuit current for the time required to interrupt from the substation end of the feeder. When the rating in the ground position is being specified, the rms value of the symmetrical current, the peak of the asymmetrical current wave, and the decay rate must be provided to the switch manufacturer. With the two-position switch, operating procedures must be developed that ensure safety to personnel who operate the ground switch, recognizing the possibility of failure of an electrical interlock with personnel operating the ground switch on a transformer that is still energized.
Although the use of the three-position and two-position grounding switches as described above is the most common practice, there are other variations. Network transformers have been installed with just 600 ampere separable connectors on the HV side, with isolation and grounding accomplished with 600 ampere dead-break connector apparatus. Such an installation was shown in Figure 2 of Introduction and Overview. Network units also have been installed where there is a separate switching device on the HV side of the transformer, such as a vacuum switch or vacuum circuit breaker. Sometimes these are installed as part of an enhanced protection scheme in 480-volt spot networks, as discussed in 480-volt-spot-network.
Network Unit Installation Environment
Network units frequently are installed in below-grade vaults, which may be subject to flooding. For these applications, the network units must be capable of operation when totally submerged. Figure 16 shows the harsh environment that the network transformer and HV switch compartment must operate in, where the switch compartment is totally submerged, and the terminal compartment for the primary cables is partially under water.
If water enters either the terminal compartment or switch compartment, high current arcs develop within the compartments, and disruptive type failures are likely, where cover plates are ejected. As discussed in Primary Feeder Protection, installation of electronic current-limiting fuses in the primary feeder at the substation reduces to possibility of a disruptive failure for faults in the terminal or switch compartment.

Figure 16:
HV end of network unit that is near total submersion
(courtesy of Torben Aabo).
The network protector at the opposite end of the transformer in Figure 6-16 is also nearly submerged, as shown in Figure 17. It is equally important that water is not allowed to enter into the network protector, in particular with 480-volt network protectors. Water-tight seals for the protector door and packing glands for operating shafts are essential.

Figure 17:
Network protector that is almost totally submerged
(photo courtesy Torben Aabo).
One problem encountered in dense urban areas is the unavailability of space for installation of network units. Vault space is at a premium. Figure 18 shows how one utility minimizes vault space requirements. The installation is for the arrangement shown in Figure 14 where the transformer has a two-position internal grounding switch with the switch operating handle on the top cover of the transformer. The network protector is throat mounted on one end of the transformer with sufficient space to allow opening of the protector door for testing and maintenance. Notice that there is very little space between the transformer cooling panels and the vault walls, making visual inspection for rust quite difficult. Also, this operator suspends the transformer to keep it off of the vault floor so that it does not rest in water, a source of rust and corrosion.

Figure 18:
Network unit in submersible vault with limited space
(photo by author).
Network Transformers
Network transformers designed in accordance with ANSI C57.12.40 are three-phase units having standard kVA ratings. Some users have banked three single-phase transformers rather than using a three-phase network transformer, with cable connections to the separately mounted network protectors. Figure 19 shows three single-phase 250 kVA transformers, connected delta on the HV side, and wye-grounded on the LV side (208Y/120-volt), supplying a separately mounted network protector in a two-bank vault. The low-voltage cable connections from the single-phase transformers to the bottom terminals of the CM-D network protector are visible in the picture. The second set of banked single-phase transformers for the network protector on the left are out-of-sight in the picture. Separate switching devices, not seen in the picture, are located on the HV side of the transformers, to allow isolating the transformer banks from the primary feeder.
The two network protectors in Figure 19 feed a paralleling bus and building load, but in addition there are low-voltage cable tie circuits to the street network. Included in this 208Y/120- volt installation are heat sensors to detect arcing faults on the load (network) side of the network protectors. Should these devices operate, they initiate trip and lockout the two network protectors shown. But with cable ties from the paralleling bus to the street network, it is necessary to open the tie to the street network. Seen on the vault wall to the right of the network protectors are molded-case circuit breakers, which are tripped to open the ties to the street network should a heat sensor detect an arcing fault in the vault.

Figure 19:
Three single-phase transformers banked for application
in a two-unit application at 208Y/120-volts (photo by author).
Network Transformer Winding Connections
When the secondary windings of the network transformers are connected in grounded-wye, the primary windings can be connected in either delta or grounded-wye. The advantages of the delta connections for the primary windings are:
-
Low-set ground relays for the network primary feeders are allowed with dedicated feeders, giving sensitive protection for incipient ground faults in the delta connected HV winding.
-
Zero-sequence currents from unbalanced loads and faults on the low-voltage side of the transformer do not flow in the network primary feeders.
-
Less voltage sag occurs in the secondary line-to-neutral voltages for the single line-to-ground (SLG) fault on the primary feeder during the time from fault inception until the breaker for the faulted feeder opens.
Some advantages for the grounded-wye connections for the network transformer primary windings are:
-
On non-dedicated primary feeder applications where there are line-to-neutral connected loads on the primary feeder (multi-grounded neutral), the voltage to ground (neutral) on each unfaulted phase during backfeed to the SLG fault are limited to acceptable values.
-
Lower probability of ferroresonance occurring in non-dedicated feeder applications during single-pole switching to energize or de-energize a cable circuit with one or more connected network transformers with open network protectors.
Three-phase network transformers are either liquid immersed or dry type. For the dielectric fluid, liquid types can include mineral oil, silicone, high-flash point liquids, esters, and vegetable-based fluids. In the past, PCBs were used because of their very low flammability, low flash point, and no fire point, because they only burn if placed in contact with open flame. However, their use has been abandoned due to toxicity concerns, in particular dibenzofurans can be formed under incomplete combustion as may occur from internal arcing in the transformer tank. Ventilated dry type network transformers have been used in above grade spot networks. Figure 20 shows a portion of a spot network installation that was in one of the World Trade Center twin towers, with ventilated dry-type network transformers and type CM-22 network protectors.

Figure 20:
Portion of above-grade network vault with dry-type
network transformers and CM-22 network protectors (photo by author).
Liquid filled network transformers may be specified as vault type or subway type. Vault types are intended for application in dry vaults, whereas subway types are intended for below or above grade applications, with a below grade application shown in Figure 14 and 16.
Network Transformer kVA Ratings
The standard kVA ratings for three-phase network transformer, recognized in ANSI C57.12.40 are given in Table 1. At the base kVA rating (number given to the left of the “/”), the winding average temperature rise above the standard ambient temperature shall not exceed 55oC when delivering continuously the rated base kVA. Standard ambient conditions are an average temperature in a 24-hour period of 30oC, with the maximum ambient temperature not exceeding 40oC.
The 65oC rating (number given to the right of the “/”) is based on the winding average temperature rise not exceeding 65oC or an 80oC hot spot temperature. The temperature rise of the liquid measured near the top of the tank shall not exceed 65oC.
Table 1:
Network Transformer Kilovolt-Ampere Ratings and Associated
LV Currents
| 216Y/125 Volts | 480Y/277 Volts | ||
|---|---|---|---|
55oC/65oC Rating (kVA) |
55oC/65oC Current (Amperes) |
55oC/65oC Rating (kVA) |
55oC/65oC Current (Amperes) |
| 300/336 | 802/898 | 500/560 | 601/674 |
| 500/560 | 1336/1497 | 750/840 | 902/1010 |
| 750/840 | 2005/2245 | 1000/1120 | 1203/1347 |
| 1000/1120 | 2673/2994 | 1500/1680 | 1804/2021 |
| 2000/2240 | 2406/2694 | ||
| 2500/2800 | 3007/3368 | ||
The dual rated transformers, as listed in Table 1, are based on utilizing an insulation system that allows continuous operation at 65oC rise and 112% of the 55oC base kVA rating. Dual rated transformers also are capable of delivering the 55oC base kVA rating continuously in a 40oC average ambient temperature, with the maximum ambient not exceeding 50oC in a 24-hour period, without exceeding an 80oC hot-spot temperature rise.
Also listed in Table 1 are the current ratings associated with the 55oC and 65oC kVA ratings, for the two most popular rated voltages for the LV windings. Note that the standard secondary voltage rating is 216Y/125 volts, but these transformers supply a secondary system where the nominal voltage is 208Y/120 volts. Some users purchase network transformers that have a rated secondary voltage of 208Y/120 volts. What matters is that the system is operated such that the service voltages stay within the range allowed by the regulatory agency having jurisdiction. Frequently the range is that specified in ANSI C84. The network transformer current ratings in Table 1, in conjunction with the transformer overloading practices of the utility, are considered when selecting the ampere rating of the network protector applied on the secondary side of the transformer. Network transformers can be loaded above their continuous rating for short time periods, but the network protector is a maximum rated device. It is for this reason that the ampere rating of the protector applied with the network transformer is higher than the continuous rating of the network transformer on the low-voltage side.
Some users purchase network transformers that are designed for a 65oC rise when delivering the base kVA rating given to the left of the “/” in Table 1.
Network Transformer Leakage Impedance & Excitation Characteristics
The standard leakage impedance (nameplate impedance) for network transformers is 5% for units with a 55oC rating of 1000 kVA and below. For units with a 55oC rating above 1000 kVA, the standard impedance is 7%. The X to R ratio of the leakage impedance ranges between a low of about 4 and a high of about 13, where transformers with the 7% impedance usually have the higher X to R ratio. The X to R ratio of the transformer affects:
-
The real and reactive power flows in the backfeeding network protectors during multi-phase faults on the primary feeders. This, in turn, affects the response of the network protector relays in backfeeding protectors, and the required sensitive trip characteristic to assure reliable detection of the backfeed with high X to R ratio transformers. This is discussed in detail in Network Protector Relaying.
-
The voltage-drop during normal loading conditions, as shown by the curves in Figure 19 in Network Substation Design. However, load power factor has an even greater effect on voltage drop in the network transformer.
-
The phasing voltage at an open network protector in spot networks, and in multi-bank network vaults for the 208-volt grid network. The phasing voltage is the voltage across the open contacts of the network protector, as discussed in Network Protector Relaying. If transformers with low impedance are used, say 2 to 2.5% for network applications, which might happen when banking single-phase transformers, the phasing voltages at open network protector will be low, and the open protector may not automatically close if standard or default close settings are used for the network relays. The reasons for this are quantified in Network Protector Relaying.
-
The transient recovery voltages during arcing faults in 480-volt systems, and the probability of an arc re-striking following a current zero. The higher the X to R ratio, the higher the transient recovery voltage following a current zero.
There are benefits to having either low or high impedances in network transformers. Benefits of a low impedance, the standard 5% are:
-
Lower voltage-drop during loading, especially during contingency conditions. Consolidated Edison network transformers for the 208Y/120-volt network, rated 1000 kVA and below, have a 4% leakage impedance, to accommodate loading under second or higher contingency conditions.
-
Higher short-circuit currents for faults in the 208Y/120-volt secondary system, to help in burning clear faults when cable limiters are not used, and to achieve faster blowing of cable limiters when they are installed.
-
Higher backfeed currents to multi-phase faults on the network primary feeder when a backfeeding protector fails to open. This is especially important if the backfeed is from a fringe area of the network. High backfeed currents are desired so that the network protector fuse(s) can blow before the backfeeding network transformer is damaged thermally.
Advantages of having a high impedance, the standard 7% are:
-
Circulating current flows are lower from differences in the primary feeder voltages, thus resulting in a more equal load division in parallel units in spot networks and in multi-bank installations for the grid network. This means that when network protectors in a spot network or multi-bank installation for the grid network are closed, they will remain closed for much lower loading levels on the spot network or multi-bank installation.
-
In spot networks and multi-bank installations for the grid network, an open network protector, with typical default close settings, will automatically reclose at lower loadings on the in-service network transformers with higher-impedance network transformers.
-
Reverse current surge magnitude is minimized if a synchronous generator is paralleled with a spot network, or during closed-transition load transfers between the spot network bus and an emergency generator bus that is supplied by synchronous generators. This statement assumes that the utility will allow synchronous machines to be paralleled with the spot network paralleling (collector) bus, either permanently or temporarily. Not all utilities allow this, and Closed Transition Switching & Distributed Generation discusses these issues.
The very early network systems of the United Electric Light and Power Company in New York City were supplied from different generation stations, having significant voltage magnitude and angle difference between them, resulting in poor protector operation (pumping, cycling, failing to close when open). Network transformer with 10% impedance were used in these early applications to limit circulating current flows.
In general, low-impedance single-phase transformers are not recommended for spot network applications because this may result in:
-
High circulating currents in spot networks, poor load division, and network protectors tripping unnecessarily at light load. Network protectors may also pump, which can cause failure of certain types of protectors. In one two-unit spot network system that had low-impedance single-phase transformers, the protector operation was very stable. But when the system was operated temporarily with open bus-tie breakers in the substation, a 480-volt protector pumped, and ultimately failed, as shown in Figure 21.
-
High short-circuit currents that may exceed the interrupting rating of the network protector during backfeed in spot networks and multi-bank installations feeding the 208Y/120-volt grid network.
-
Network protectors failing to automatically reclose in spot networks and multi-bank installations for the grid network, due to inadequate phasing voltage magnitude at the open protector. This can result in overloading of the in-service network transformers in the spot network.

Figure 21:
480-Volt network protector that experienced a fault in
the unprotected zone (courtesy Westinghouse).
Network transformer standards do not specify exciting currents and no-load losses for network transformers, just as they do not specify the X-to-R ratios for leakage impedance. The exciting current and no-load losses in a network transformer will affect the automatic tripping of the network protector, if the network transformer can be disconnected on the primary side, with no other network transformers on the disconnected section, and no faults on the disconnected section. This is illustrated with the sketch in Figure 22 where an open occurs in the primary feeder, with just one network transformer on the isolated section. Under these conditions, the excitation current and no-load losses of the transformer are supplied from the secondary side through the closed network protector.

Figure 22:
Network transformer isolated from other transformers on
the primary feeder.
With low-loss network transformers, and typical trip characteristics and default sensitive trip settings employed in both power-based and sequence-based network protector relays, a protector may not trip when supplying just its own network transformer. This problem is discussed in more detail in Network Protector Relaying. Suffice it to say that in distribution transformers on radial distribution systems, low losses are desired for energy conservation. But network protectors function better during backfeed conditions when the network transformers have high load losses (low X to R ratio for leakage impedance) and high excitation currents.
Table 2 lists, for transformers with 23 kV delta connected HV windings the no load losses (NLL), load losses (LL), excitation current (IE) in percent, and the X to R ratio of the leakage impedance. Given in the last column of this table is the angle by which the current in the network protector leads the network line-to ground voltage for backfeed to a bolted three-phase fault at the HV terminals of the network transformer. These numbers are useful in identifying the angle needed for the network relay sensitive trip characteristic (curve) to reliably detect backfeeds to multi-phase faults on the network primary feeder. For the Carte transformers listed in the last rows of Table 6-2, given is a range for the X to R ratio based on tests conducted in 2002, and the range for the current angle. The importance of current angle and the requirements it places on network relay sensitive trip characteristics (trip-tilt angle) is discussed in detail in Network Protector Relaying and Appendix 3.
Table 2:
Impedance and loss data for network transformers with 23
kV delta connected HV windings
Xfr. Mfgr. |
KVA | LV (Volts) |
ZT (%) |
NLL (watts) |
LL (watts) |
IE (%) |
R (%) |
Leakage Z X/R | Current Angle (Degree) |
|---|---|---|---|---|---|---|---|---|---|
| ABB | 500 | 216 | 5.17 | 1001 | 5266 | 0.313 | 1.05 | 4.81 | 101.7 |
| ABB | 750 | 216 | 4.96 | 1256 | 5923 | 0.217 | 0.79 | 6.20 | 99.2 |
| ABB | 1000 | 480 | 5.24 | 1633 | 5933 | 0.220 | 0.59 | 8.78 | 96.5 |
| ABB | 2500 | 480 | 7.14 | 4795 | 13312 | 0.279 | 0.53 | 13.37 | 94.3 |
| FP | 750 | 216 | 4.92 | 932 | 6939 | 0.14 | 0.93 | 5.22 | 100.8 |
| FP | 500 | 216 | 4.77 | 778 | 4949 | 0.18 | 0.99 | 4.71 | 102.0 |
| FP | 500 | 216 | 4.73 | 764 | 3846 | 0.17 | 0.77 | 6.07 | 99.4 |
| Carte | 500 | 4.98-7.41 | 101.6-97.7 | ||||||
| Carte | 750 | 5.99-8.34 | 99.5-96.8 | ||||||
| Carte | 1000 | 6.05-9.47 | 99.4-96.0 | ||||||
| Carte | 1500 | 9.87-11.13 | 95.8-95.1 | ||||||
| Carte | 2000 | 9.89-12.94 | 95.8-94.4 |
Network Transformer Core Construction
Network transformers with a delta connected HV windings can be constructed on a three-legged core as shown in the top of Figure 23. With the delta connected HV windings, the three voltages applied to the HV windings sum to zero.

Figure 23:
Core Configurations for Network Transformers.
But if the network transformer has the grounded-wye connected primary windings, and is used in a non-dedicated feeder system where single-phasing can occur on the primary feeders, the transformer should be constructed on a five-or four-legged core, as shown on the bottom of Figure 23. The five-legged core can be constructed with stacked laminations, or it can be made using four wound cores as in the figure. The four-legged core, shown on the bottom right-side of the figure, is made with stacked laminations. The purpose of the five- or four-legged core is to minimize the chance of transformer tank heating during certain unbalances in the primary system. Some network transformers with a delta connected HV windings are also made with the five-legged wound core.
Figure 24 shows the windings and leads of a three-phase network transformer with the delta connected HV windings and the wye connected LV windings. Also shown is the tap change mechanism, and the low-voltage buses that connect to the LV terminals and to the secondary neutral bushing.

Figure 24:
Construction for transformer with rectangular coils
(courtesy of Westinghouse).
From Figure 24, notice that the coils are of rectangular shape rather than circular as in early network transformers. The intent of the rectangular construction was to allow reducing the physical size of the network transformer, and consequently the required vault space, which can be difficult to obtain in dense metropolitan areas. The heavy steel plates welded to the core frame on the end are intended to prevent the rectangular coils from going circular during high-current through fault conditions.
Network Transformer Designs to Mitigate Effects of Main Tank Rupture
As discussed before, faults in the relatively small terminal compartments and switch compartments mounted on the side wall of the network transformers, have resulted in the bolted-on cover plate being ejected, as shown in Figures 22 and 23 in Primary Feeder Protection. In some failures, the cover plate is totally blown away, and in others, the cover plate is ripped away on one or more sides. Such failure may result in burning of insulating fluids.
When a fault occurs in the main tank of the network transformer, considerably more energy can be absorbed before the tank will rupture, the amount dependent upon many factors. When the tank does rupture, sometimes the failure mode is such that the tank ruptures along a portion of the welds that hold the top cover to the flanges of the tank side-walls, with either side bulging out, such that the insulation fluid, mineral oil, is blown out and upward. With gratings above sidewalk vaults as shown in Figure 25, the fluid can be expelled outside of the vault, and possibly be burning.

Figure 25:
Sidewalk grating for ventilation of vault with network
transformers.(photo by author).
Failures of main tanks have occurred, which resulted in burning fluids being ejected upward through the vault grating, as illustrated in Figure 26, taken from an article in the New York Times in 2010.

Figure 26:
Results of failure in network transformer in below
ground vault (From New York Times, Feb 11, 2010, “Transformer Blast
Damages Building in Chelsea”).
In such a failure, sometimes the tank ruptures as in Figure 27, where the weld between the tank top and the flange on the tank side-walls fails.

Figure 27:
Network transformer before and after rupture at weld
between the tank top and tank flange.
Controlled Rupture Designs
Consolidated Edison and the General Electric Company conducted extensive research to produce a network transformer tank that can withstand much higher energies from internal faults before the main tank will rupture. Further the design was such that if a rupture occurred, the rupture is controlled such that ejected fluids are directed downward in the vault, rather than upward. The design concept is illustrated in Figure 28.
Figure 28 (a) is an end view of the new transformer design under normal conditions. Should high-current electrical arcing take place within the transformer tank, producing high internal pressures, the pressure relief occurs through header pipes to the radiator, where the radiator deforms to absorb the energy and lower the internal pressure. This is illustrated in Figure 28 (b). In addition, the main tank deforms without rupturing. For excessive energy inputs to arcing that produces extremely high internal pressures, the transformer is designed such that rupture occurs along the bottom and sides of the radiator panel, as illustrated in Figure 28 (c). This design minimizes the chance of hot and burning fluids being expelled upward through the vault grating. Notice also from Figure 28 the method of attaching the cover to the tank, sometimes referred to as the “shoe-box” design.

Figure 28:
Network transformer design to mitigate effects of
high-energy inputs from fault current.
Figure 29 show the transformer designed to have the failure mode depicted in Figure 28. It is referred to as the “Safe-Net Network Transformer” by the manufacturer. Since this design was developed, other network transformer manufacturers have produced transformers which have a similar controlled failure mode for high-current faults internal to the main tank.
Gas Filled Design
Another approach for eliminating a fire hazard with liquid filled network transformers was developed by ABB for Consolidate Edison of New York, and is shown in Figure 30. It is a sealed dry-type transformer filled with nitrogen gas, that includes a two-position ground switch, with the operating handle on the top of the tank. The transformer has a 70 percent overload capability, a similar footprint to liquid filled network transformers with cooling fins, and is available up to 1,000 kVA with primary voltages in the 15 kV class. The insulation system is class F and H.

Figure 29:
Network transformer designed to mitigate the effects of
high-energy inputs from arcing faults (courtesy of General Electric)

Figure 30:
Gas filled network transformer with footprint similar to
that of liquid-filled units (courtesy ABB).
Figure 31 and Figure 32 are pictures of a cut-away of the gas filled network transformer, taken in the lobby area of the Consolidated Edison Learning Center in Long Island City, NY. Figure 31 is looking into the HV side of the transformer, showing the cast coils, and the connections making the delta connected primary winding, and leads to the HV terminals. Figure 32 is a picture looking into the LV side of the transformer. Shown is the horizontal bus connecting the neutral ends of the three wye-connected low-voltage windings, the line end of one low-voltage winding going to the X1 bushing, and the vertical bus for making the neutral connection to the transformer X0 bushing, which is welded to the tank of the transformer.

Figure 31:
View of high-voltage side of the gas filled network
transformer at the Consolidated Edison Learning Center (photo by author)

Figure 32:
Cutaway of N2 gas filled 500 kVA network transformer
(photo by author).
Network Protectors
The basic functions of the network protector were mentioned in Introduction and Overview. They are:
-
Open automatically for any short-circuit on the HV primary feeder or the associated network transformer, thereby isolating the fault from the LV network. The network protector protects the LV network from faults and disturbances on the HV primary feeders.
-
Open automatically whenever the circuit breaker in the substation for the primary feeder is opened in absence of a fault on the feeder or in any network transformer on the feeder. If the feeder remains energized because one or more network protectors fails to open, whenever the feeder breaker is opened in absence of a fault, the feeder is said to be “live-on-backfeed”.
-
When the protector is open with the HV primary feeder and the associated network transformer energized, automatically reclose if the ensuing watt and var flows will be into the network, and above the levels needed to assure stable operation of the network protector.
-
When the network transformer is energized and the network protector is open, automatically close on to a dead (de-energized) LV network.
Basic Parts
The basic parts of the network protector are shown in Figure 33, for a separately mounted type CM-22 network protector. For this protector, the cables from the network transformer are attached to the bottom terminals of the network protector, and the secondary network is fed from the top terminals above the fuses. The parts are identified by items 1 through 6.

Figure 33:
Separately mounted network protector. Indicated numbered
items 1 to 6 are identified in text (photo by author).
-
Low-voltage air circuit breaker. Seen is the insulated cross bar that mechanically connects the moving contacts for the three phases (poles), and above this is the arc chute for the right phase.
-
Network relays to control the automatic opening and reclosing of the protector. The relay on the bottom is the electro-mechanical CN-33 master relay which is used for tripping and automatic reclosing of the protector. The relay on top is the electro-mechanical CN-J phasing relay that is used in conjunction with the master relay to control auto closing of the protector.
-
Shunt trip device or mechanism that, when energized by closing of the network master relay trip contact, will result in opening of the network protector air circuit breaker. By industry standards, this mechanism must operate at voltages as low as 7.5% of the rated voltage of the protector, to ensure that the protector can trip for faults in the network transformer the protector is associated with.
-
Motor that will close the network protector when the network relay(s) close contact(s) are made. The motor either charges closing springs (which gives the protector a fault close capability), or by operating through levers and cams to close the main contacts (no fault close rating). By industry standards, the motor must be able to close the protector for voltages as low as 80% of protector rated voltage. The closing motor must be connected to the “transformer side” of the open network protector to allow closing onto a de-energized (dead) LV network.
-
Operating handle to allow manual opening and closing of the circuit breaker. The handle has three positions, “Open”, “Automatic”, and “Closed”. In the type CM-22 protector in Figure 33, the handle is in the open position. To close the protector, the operator physically forces the arcing and main contacts of the protector close when moving the handle from the automatic position to the closed position.
-
Network protector fuses, whose purpose is to backup the network protector for high-current faults on the network primary feeder, if the protector fails to open automatically. The failure to open could be from the failure of the network relay to make its trip contact, or the relay makes its trip contact but the protector circuit breaker fails to open.
-
Housing or enclosure, which is available in different types. Included are submersible enclosures, semi-dust-tight enclosures that have no intentional openings (NEMA 1A), drip-prove housings (NEMA 4) that are suitable for installations where water may drop from above but where the protector will not be submerged in water, and a ventilated housing whose purpose is to keep people away from live parts.
Figure 34 shows two network protectors in a NEMA 1A dust tight enclosures mounted on the low-voltage throat of network transformers in a spot network. The operating handles are in the “automatic” position. The cables for the three low-voltage phases are attached to the top (network side) terminals of the protector, and the low-voltage neutral cables are attached to the X0 neutral bushing of the network transformer. In this installation, a full-size neutral is used (same size as used for each phase).
Figure 35 shows a 4500-ampere drip-proof network protector in an under-sidewalk installation, installed on the low-voltage throat of a 1000/1120 kVA network transformer feeding a 208Y/120-volt grid network.
Figure 36 shows a submersible type CM-D network protector installed on the throat of the network transformer in a below grade vault. A remote monitoring system is in place for the network protectors in the vault shown in Figure 36.

Figure 34:
Type CM-22 network protectors in NEMA 1A semi-dust-type
enclosures (photo by author).

Figure 35:
Drip-proof network protector in vault located under
sidewalk for 208Y/120-volt grid network (photo by author).

Figure 36:
Submersible network protector in below grade vault
(photo by author).
Mounting Arrangements
As implied earlier, network protectors may be mounted on a low-voltage throat on the end or sidewall of a network transformer, or they may be separately mounted with cable connections from the network transformer LV terminals to the protector. Figure 37 shows an old type CM-2 network protector that is separately mounted for application in a 208Y/120-volt grid network. This protector was produced by Westinghouse, but in the middle 30’s was superseded with the type CM-22 network protector.

Figure 37:
Type CM-2 network protector separately mounted for a
208Y/120-volt grid network (photo by author).
Figure 38 is another example of a separately mounted network protector for a 208Y/120-volt grid network. The cables from the network transformer enter at the bottom, and the cables to the grid network exit the top of the protector.

Figure 38:
Type CM-52 network protector separately mounted for
208Y/120-volt grid network (photo by author).
The separately mounted network protector in Figure 39 is in a 480-volt spot network system of Consolidated Edison. The cable connections from the network transformer, in a separate vault, are into the bottom of the protector. The connections to the paralleling bus are at the top of the protector through current-limiting fuses. This protector is equipped with the GE electro-mechanical master relay. It is mounted in an open frame in the “protector compartment”.

Figure 39:
Separately mounted network protector for an isolated
480-volt spot network (photo by author).
Operating Mechanisms
Up until the mid 1960’s, all network protectors had a soft-close mechanism, that was designed for 30,000 mechanical operations. With the soft-close mechanisms, a closing motor through levers, cams and gears pushed the arcing and main contacts closed. These protectors did not have a fault close capability. Examples of this type are the Westinghouse CM-22, and the type MG-8 and MG-9, originally manufactured by GE, but since around 1996 when GE exited the network protector business, have been produced by Richards Manufacturing who acquired the rights to the GE designs.
The other type design for network protectors has a mechanism that gives the protector a fault close capability, not found in protectors with a soft close mechanism. In the mid 60’s, the Consolidated Edison Company of New York approached the two suppliers of network protectors in that time period, Westinghouse and General Electric, and requested a design for protectors that had a fault close capability, with a fault-close rating equal to the interrupting rating. One concern with protectors with a soft close mechanism was that if the protector motor failed before the arcing and main contacts were fully closed, the protector could overheat, fail, and possibly the contacts would be welded closed. The fault close mechanism, where springs are charged and then their stored energy released to close the contacts have a minimal chance of having the contacts partially closed.
Disconnection Method
Roll-Out Designs
Up through the mid 70’s, all network protectors were of the roll-out design, where the protector breaker and mechanism were on an assembly (backpanel) that could be rolled out onto maintenance rails for inspection and work. Figure 40 (a) shows the protector rollout unit in the enclosure, with bolted connections at the top between the network terminals of the protector roll-out unit and the network terminals of the protector enclosure through protector fuses. Similarly, the transformer side of the protector roll-out unit is connected at the bottom to the transformer with bolted-on disconnect links. To remove the protector roll-out unit from the enclosure requires unbolting the fuses and disconnect links with insulated tools. In the 208Y/120-volt network this frequently was done with both sides of the protector energized. Doing this in 480-volt protectors required extreme caution to avoid initiating an arcing fault.

Figure 40:
Roll-out type network protector, (a) rollout unit in
enclosure, (b) rollout unit withdrawn on maintenance rails.
After the fuses and disconnect links are removed, and the bolts holding the roll-out unit in the housing are removed, the protector roll-out unit can be pulled out onto the maintenance rails as depicted in Figure 40 (b).
When removing the network protector roll-out unit from the housing in 480-volt networks, there have been incidents where arc flashes occurred, and there were severe personnel injuries from this.
The other type of disconnection method was the draw-out type similar to that used in low-voltage air circuit breakers.
Draw-out Designs
The first draw-out type network protector was the Westinghouse type CM-D, introduced around 1975. The intent of the design was to allow removing the protector mechanism from its enclosure without having to use insulated tools to remove energized protector fuses and energized disconnect links as required with roll-out designs. The other intent of the design was to make it dead front, so that when the protector door was open, live power parts could not be contacted. Figure 41 (a) shows the type CM-D design with the door open, but the protector draw-out unit installed in its enclosure. To disconnect the protector and put it on the maintenance rails, the protector was tripped, and the crank shown on the front of the protector in Figure 41 (a) was inserted into the levering mechanism, where the protector was open, and racking it out onto the maintenance rails as shown in Figure 41 (b). Of course, the maintenance rails must be put into position before racking the protector. In Figure 41 (b) the disconnect fingers on the protector draw-out unit can be seen.

(a)

(b)
Figure 41:
Draw-out type network protector (a) installed in housing
and (b) racked out on maintenance rails (courtesy Eaton).
Note also from Figure 41 that the type CM-D network protector is dead front, in that there is a barrier on the front which covers the live parts. This protector has a fault close rating, unlike earlier network protectors. Also, the CM-D protector used current-liming fuses, installed in separate fuse enclosures on the top of the protector enclosure. Recently. Richards manufacturing developed a draw-out type network protector as shown in Figure 42. On the left side of the figure the draw-out unit is in the enclosure, and on the right side of the figure it has been withdrawn onto the maintenance rails. This protector is available in continuous current ratings up to 2250 amperes, and with fault close and interrupting rating of 30 kA. It has a transparent polycarbonate barrier in the front, making it “dead front”.

Figure 42:
Type 416 draw-out type network protector from Richards
Manufacturing (courtesy Richards Manufacturing).
Figure 43 shows a type CM-D network protector mounted on the low-voltage throat of a network transformer for a 480-volt spot network. Although this unit is in a dry vault, some users prefer to use submersible protectors in non-submersible applications as it prevents the accumulation of dust and dirt which can occur with ventilated units. Some materials, such as concrete dust, are hygroscopic, which can absorb moisture and possibly cause tracking and a fault.

Figure 43:
Type CM-D network protector throat mounted on network
transformer in 480-volt spot network (photo by author).
Live-Part Exposure
As indicated before, many network protectors, such as the MG-8 or CM-22 protectors, are live front, in that when the door is opened live (energized) power parts can be contacted. This can be seen from Figure 44 that shows a Type MG-8 separately mounted protector with the door open. And Figure 45 shows a transformer mounted CM-22 protector with the door also open. With either design, personnel can come into contact with energized power parts, hazardous at any voltage and in particular at 480-volts.

Figure 44:
Type MG-8 live-front separately-mounted network
protector with door open (courtesy Eaton).

Figure 45:
Type CM-22 live-front transformer mounted network
protector with door open (courtesy Eaton).
In Figure 45, at the bottom of the protector the bolted-on disconnect links are visible for the right and center phases. Notice that there are insulated barriers between phases, and an insulted plate on the bottom to minimize the chance of initiating a fault to ground or between phases when removing the disconnect links. Similarly, at the top there are insulated barriers to reduce the chance of a fault when removing the protector fuses.
Figure 46 shows the type CM-52 network protector, first made available in 2000. It was constructed similar to low-voltage power assembly circuit breakers, having a four-position draw-out mechanism, which included a full engaged position, test position, full disengaged position, and complete withdrawn position. Figure 47 shows the protector breaker in the complete withdrawn position.

Figure 46:
Type CM-52 draw-out network protector (courtesy Eaton).

Figure 47:
Type CM-52 protector in complete withdrawn position
(courtesy Eaton).
With the type CM-52 network protector, it can have current-limiting type network protector fuses, mounted in the fuse enclosures at the top of the protector enclosure as seen in Figure 46. or it can use tin or copper link or alloy type network protector fuses mounted internal to the submersible enclosure.
Current Path in Network Protector
In the network protectors shown up to this point, the current path is such that the connections from the protector to the network are made at the top terminals of the protector enclosure as shown in Figure 40.
In some applications, the connections to the network are made at the bottom terminals of the protector enclosure as shown in Figure 48. In protectors for these designs, there are no bus bars in the protector housing, as shown in Figure 48. To work on the protector, the fuses at the top and the disconnect links at the bottom must be removed as shown at the bottom of Figure 48.

Figure 48:
Network protector with connections to the LV grid made
at the bottom of the protector.
Figure 49 shows a network protector with the current path depicted in Figure 48. The mechanic has moved the roll-out unit onto the maintenance rails, in preparation for removing the roll-out unit from the protector enclosure. This particular roll-out unit had failed and, could not be repaired in the field. The author happened upon this while walking in New York City.
Figure 50 shows the 4500- ampere roll-out unit being lifted from the sidewalk vault, using a crane that is included with the network service truck. Sitting on the surface, although not visible in the picture, was the replacement roll-out unit.

Figure 49:
Network protector roll out unit on rails in preparation
for replacing it with a new unit (photo by author).

Figure 50:
4500-ampere network protector roll-out unit being
removed from sidewalk vault (photo by author).
Protector Continuous Current Ratings
The present standard for network protectors is IEEE C57.12.44, published in 1996 to take the place of the original NEMA Standard SG3.1 for network protectors. This standard should be consulted for data on continuous current ratings, fault close ratings, and interrupting ratings for network protectors.
Network protectors are maximum rated devices, and unlike network transformers, should not be loaded above their current rating. The rating of the current transformer in the network protector may be different than the current rating of the network protector. Table 3 list common continuous current ratings, protector current transformer (CT) ratings, interrupting rating, and fault close (close and latch) ratings. The CT rating is important when making the reverse current trip setting for the network relay, as the relay trip setting is made either as a percent of protector CT rating, or in milliamps on the secondary side of the CT.
Table 3:
Network protector current ratings
Continuous Rating (Amperes) |
CT Rating |
Interrupting Rating (kA) |
Fault Close Rating (kA) |
|---|---|---|---|
| 800 | 800/5 | 30 | 25 |
| 1200 | 1200/5 | 30 | 25 |
| 1600 | 1600/5 | 30 | 25 |
| 1875 | 1600/5 | 30 | 25 |
| 2000 | 1600 or 2000/5 | 35 | 35 |
| 2250 | 1600 or 2000/5 | 35 | 35 |
| 2500 | 2500/5 | 60 | 40 |
| 2825 | 2500/5 | 60 | 40 |
| 3000 | 3000/5 | 60 | 40 |
| 3500 | 3000 or 3500/5 |
60 | 40 |
| 4500 | 3000 or 3500/5 |
60 | 60 |
The continuous current rating of the network protector should be higher than the rated current of the associated network transformer to allow short-time overloading of the network transformer during contingency conditions, either first or second contingency depending on the design of the LV network system. How much higher depends upon the overloading practice of the particular utility, and the design requirements for their network transformers.
Table 4 lists, for 55/65oC rise dual-rated network transformers with a 216-volt rated secondary winding, the 65oC rise rated current, the rated current of a network protector that could be applied with the transformer.
Table 4:
Protector/Transformer Combinations for Dual Rated 216-Volt
Network Transformers
Transformer 55/65oC Rating(kVA) |
XFR 65oC Rated Current (Amps) |
NWP Rating (Amps) |
Ratio (NWP/XFR 65oC) |
|---|---|---|---|
| 500/560 | 1497 | 1600 | 1.07 |
| 500/560 | 1497 | 1875 | 1.25 |
| 500/560 | 1497 | 2000 | 1.34 |
| 500/560 | 1497 | 2250 | 1.50 |
| 750/840 | 2245 | 2500 | 1.11 |
| 750/840 | 2245 | 2825 | 1.26 |
| 1000/1120 | 2994 | 3000 | 1.00 |
| 1000/1120 | 2994 | 3500 | 1.17 |
| 1000/1120 | 2994 | 4500 | 1.50 |
Given in the last column is the associated overload that could be applied to the network transformer without exceeding the protector rated current.
Table 5 lists for 65oC rise single-rated network transformers with a 216-volt rated secondary winding, the 65oC rise rated current, the rated current of a network protector that could be applied with the transformer, and the associated overload, given in the last column, that could be applied to the transformer without exceeding the protector rated current.
Table 5:
Protector/Transformer Combinations for Single-Rated
216-Volt Network Transformers
Transformer 65oC Rating(kVA) |
XFR 65oC Rated Current (Amps) |
NWP Rating (Amps) |
Ratio (NWP/XFR 65oC) |
|---|---|---|---|
| 300 | 802 | 1200 | 1.50 |
| 500 | 1336 | 1600 | 1.20 |
| 500 | 1336 | 1875 | 1.40 |
| 500 | 1336 | 2000 | 1.50 |
| 500 | 1336 | 2250 | 1.68 |
| 750 | 2005 | 2500 | 1.25 |
| 750 | 2005 | 2825 | 1.41 |
| 1000 | 2673 | 3000 | 1.12 |
| 1000 | 2673 | 3500 | 1.31 |
| 1000 | 2673 | 4500 | 1.68 |
Protector Installations in Open Frame in Protector Compartment
Figure 26 in Introduction and Overview depicted the arrangement used by Consolidated Edison for some of its isolated 480-volt spot networks for service to large loads in Manhattan, Queens, and Brooklyn. Each network transformer is in its own vault below the sidewalk, with cable connections, phase isolated if less than 50 feet in length, between the LV terminals of the network transformer and the network protector. Each network protector is mounted in an open frame in its own “protector compartment” as illustrated in Figure 51, with connections from the network terminals at the top of the protector to the paralleling bus, which runs between protector compartments, made thru large current-limiting fuses seen in the picture. Although the transformers in these applications are submersible, the protectors are not. Note the type MNPR microprocessor network relay in this application.
With installations as shown in Figure 51, during hurricane Sandy in October of 2012, water levels rose to the point in some locations where protectors as in Figure 51 were submerged, even to the point where the current-limiting fuses were under water.
Richards manufacturing developed for Consolidated Edison a submersible 5000 ampere network protector for 480-volt applications where flooding was possible. Figure 52 shows the submersible unit installed in an isolated spot network. Connections to the network transformer are made with multiple cables per phase from the bottom terminals of the protector, not visible in the picture.
The connections to the network paralleling bus are made through the silver-sand fuses mounted above the protector. The paralleling bus runs above and between “protector compartments” as depicted in Figure 26 in Introduction and Overview.

Figure 51:
Network protector in protector compartment for a
isolated 480-volt spot network in New York City (photo by author).

Figure 52:
Submersible 5000 ampere network protector for isolated
480-volt spot network applications (courtesy Con Edison).
Network Transformer Through Fault Protection
Faults on the network primary feeder are intended to be isolated from the LV network by tripping of all backfeeding network protectors. This should take place before any network protector fuses or cable limiters in the secondary system can blow. That is, at the maximum possible backfeed current, the network protector must open before the protector fuses can blow. In the event that the network protector does not open, for whatever reason, the purpose of the network protector fuses is to clear high-current backfeeds before the through-fault withstand capability of the network transformer is exceeded. This situation is illustrated in Figure 53, where there is a bolted fault on the primary feeder with the station breaker open, and with all protectors open, except for the one that is backfeeding to the fault.

Figure 53:
Backfeed from LV network with stuck closed network
protector to fault on primary feeder.
With the delta wye-grounded connections for the network transformer, the backfeed current for multi-phase faults will be high, but when the backfeed is to a single line-to-ground (SLG) fault and when there are no grounding banks or shunt reactors on the primary feeder, the backfeed current is limited by the phase-to-ground capacitances of the primary feeder. Under high-current backfeed conditions, it is desired that the fuses in the backfeeding network protector blow before the through-fault withstand of the network transformer is exceeded. That is, the network protector fuses should blow and interrupt the backfeed current in sufficient time so that the network transformer is protected from thermal and mechanical damage by the fuses. Backfeed Currents for Primary Feeder Faults discusses in detail the backfeed currents in the protector for multi-phase faults on the primary feeder, and the impact of fault type on the backfeed currents in the network protector.
Network Transformer Through-Fault Protection Curve
IEEE Standard C57.109-1993, “IEEE Guide for Liquid Immersed Transformer Through-Fault Current Duration”, defines the through-fault protection curve of transformers that fall into one of four categories. The curve that applies to network transformer through-fault protection, to be used to evaluate the protection offered by fuses, is that for Category II transformers. For category II transformers, the standard gives a curve that applies for faults that occur infrequently, less than ten (10) times. In evaluating the protection that the network protector fuses offer, the network transformer curve for “infrequent fault” is selected, because in the lifetime of the transformer, it would not be subjected to more than ten incidents where the protector failed to open.
Figure 54 shows the through-fault protection curve for Category II transformers for infrequent faults, where the abscissa gives the current in multiples of rated current at a 55oC rise. That is for dual rated 55oC/65oC rise transformers, the current is in multiples of the 55oC rise rated current.

Figure 54:
Category II transformer through-fault protection curve
for infrequent faults.
The curve reflects primarily thermal damage considerations. It is not dependent upon the transformer leakage (short-circuit) impedance and may be applied for faults that occur infrequently. For the portion of the curve in Figure 54 that is a straight line on log-log paper, the I2t product is constant at 1250, where “I” is in multiples of rated current, and “t” is in seconds. When the network protector trips correctly during high-current backfeeds for multi-phase faults on the network primary feeder, the protector clearing time is well below the time given by the transformer protection curve that applies for frequent faults. For high-current backfeeds with the primary feeder breaker open, and microprocessor relays in the protector, the network relay will initiate protector opening in six (6) cycles or less in most applications. Protection provided the network transformer for normal operation of the network protector for faults on the primary side is not an issue.
The heavy dots on the curve in Figure 54 indicate the short-time thermal load capability of oil immersed transformers from C57.92-1962, “Guide for Loading of Oil Immersed Distribution and Power Transformers”. Given next to each dot is the X and Y coordinate of the dot. Note that for practical purposes these “dots” lie on the protection curve given in C57.109-1993.
The standard further states that low values of current, 3.5 or less times normal base current, may result form overloads rather than faults, and for such cases, transformer loading guides may indicate allowable time-durations different than those given in Figure 54.
To evaluate through-fault protection provided by the network protector fuse, the transformer protection curve must be plotted versus secondary amperes. This is shown in Figure 55, for a 500 kVA 216-volt network transformer, where the rated secondary current is 1336 amperes as shown with the vertical blue line. Also shown in Figure 55 with the vertical green line is the maximum through fault current possible in a 5% impedance transformer, with rated voltage applied to its terminals on one side, with a bolted three-phase fault at its terminals on the other side. Since the protector fuses see the same current as the wye-connected secondary windings, plotting the fuse and protection curves on the same coordinates allows for evaluation of the backup protection
Network Protector Fuse Types
Different types of fuses are available for installation in network protectors. Some fuses are designed to be located within the network protector housing, but generally the silver-sand type fuses can not be located within the main housing as the fuses generate too much heat.
Type Y and Z Copper Fuses
Type Y and Z copper fuses, as shown in Figure 56, have time-current characteristics that are similar in shape to those of conventional cable limiters applied in secondary mains, tie circuits, and services, and they coordinate quite well with cable limiters. These fuses can be located within the protector housing, as shown in Figure 45, or they can be located outside of the protector housing as shown in Figure 56. Coordination between protector fuses and cable limiters during high-current backfeeds is discussed in detail in Backfeed Currents for Primary Feeder Faults.
A draw back of the Y and Z copper fuses is that they have relatively high losses and increase the temperature when mounted inside the protector enclosure. But as will be seen in Backfeed Currents for Primary Feeder Faults, they provide excellent through fault protection to the network transformer.
Lead Alloy (tin) Fuses
Other fuse types such as the lead allow (tin) and type S fuses were developed that produced lower losses, allowing either lower operating temperature, or increased current ratings for the network protector. The lead alloy (tin) fuse is shown in Figure 57. Note that this user has added ammeters to the BN “dummy plate” to allow for load checks, obviously done before remote monitoring schemes were available.

Figure 55:
Through-fault protection curve for a 500 kVA 216-volt
network transformer.

Figure 56:
Type Y fuses mounted external to the network protector
main housing (photo by author).

Figure 57:
Lead alloy (tin) fuse installed inside a submersible
network protector with door open (photo by author).
Most always the lead alloy (tin) fuse and Y and Z copper fuses are mounted inside the network protector housing.
Current Limiting Fuses
Current-limiting fuses have also been used with network protectors, but they have always been mounted external to the main enclosure of the network protector, due to physical size and high I2R losses. Standard NEMA Class L current-limiting (CL) fuses have been used external to the protectors that are intended to have internal fuses. When this is done, solid links are installed in the protector in the location where the fuses would be located, with the CL fuses outside, frequently on the network terminals of the protector as shown in Figure 58. One limitation of the standard LV Class L silver sand (CL) fuse is that its time-current curve is much steeper than other type fuses applied on protectors, and making coordination with the network relay and cable limiters more difficult.
When Westinghouse developed the CM-D network protector, they also developed the NPL current-limiting fuses, to be located outside of the protector main enclosure as shown in Figure 59. The fuse designers attempted to produce a fuse with a less-steep time-current curve than that found in NEMA Class L CL fuses. The result was a better characteristic than that available from commercially available Class L current limiting fuses, but their time current characteristics were not as good as that of the Y and Z fuses. Figure 59 shows the type NPL fuses in fuse enclosures on top of a CMD protector, with the fuse enclosure covers removed.
Although silver-sand fuses, sometimes called current-limiting fuse, have been applied with network protectors, they do not operate in a current-limiting mode at the maximum possible through-fault current of the network transformer. If the CL fuses did operate in the current-limiting mode, on the maximum backfeed to a three-phase fault on the primary feeder, the fuse would be faster than the tripping time of the network relay and network protector. At high backfeed currents, the fuse can’t be faster than a properly functioning network protector.

Figure 58:
Class L current-limiting fuses, mounted external to the
network protector (photo by author).

Figure 59:
Type NPL current-limiting fuses in external enclosures
with covers removed (photo by author).
Network Protector Fuse Time-Current Curves
The time-current curves of the different types of fuses applied with network protectors have significantly different shapes. This affects not only the through-fault protection that the fuse provides to the network transformer, but it also affects the coordination between the network protector fuse and cable limiters in secondary tie circuits. Coordination of the network protector fuses with cable limiters in inter-vault tie circuits is discussed in detail in Backfeed Currents for Primary Feeder Faults.
The Y and Z type copper fuses were developed by the Burndy Corporation, who also working with Con Edison in the 30’s developed the cable limiter. As will be seen later, these fuses, having the time-current characteristics in Figure 60, provide good thru fault protection to the network transformer, and as shown in Backfeed Currents for Primary Feeder Faults, coordinate very well with cable limiters. Since the fuses are copper, they have a melting temperature above 1000oC, and their time-current characteristic doesn’t change that much with vault ambient and protector preload (current in protector prior to application of overcurrent). The time-current characteristics of the Y and Z copper fuses in Figure 60, were taken from the Westinghouse Curve listed in the upper right-hand corner.

Figure 60:
Time-current characteristics of Type Y and Z copper
fuses.
Figure 61 shows a Y copper fuse for application in network protectors.

Figure 61:
Copper fuse for application in network protectors
(courtesy of Eaton).
The low-loss alloy fuse for network protectors was developed in the middle 30’s by engineers at the Brooklyn Edison Company of New York. Brooklyn Edison had been using the copper link fuse (not the Y or Z) in its network protectors since there initial installations in 1927. The problems with these fuses were that at the high-backfeed currents, the fuse was too fast and didn’t allow sufficient time for normal opening of the network protector with electro-mechanical relays. At the lower magnitude backfeed currents, the fuse was too slow, and did not provide through-fault protection to the network transformer. The alloy fuse overcame these deficiencies. Both General Electric and Westinghouse produced these fuses, and today they are available from both Eaton and Richards Manufacturing. Figure 62 shows the time-current characteristics of the designs produced by Westinghouse.
These fuses are made from copper straps, but the fusible element is a low-loss tin alloy, with a melting temperature in the range of 230oC. Thus, the operating time of the fuse is influence by vault ambient temperature, and the load on the fuse prior to the application of the overcurrent. As indicated by the note on Figure 62, the times are plotted for a 40o C vault ambient with a 100% preload. Thus, the times given by the curves are the minimum. At lower preloads and lower vault ambient temperatures, the fuse operating times are higher than shown by the curves.

Figure 62:
Time current characteristics of Alloy (Tin) fuses.
Figure 63 shows a low-loss alloy fuse, a design which is intended for 480-volt systems. Between the copper straps at the ends is the fusible element. These fuses have a flash barrier between the copper straps to prevent flashover when interrupting at 480-volts, and they also have arc horns to assist in interrupting the current in 480-volt applications.

Figure 63:
Low-loss tin alloy fuse for application in 480-volt
network protectors (courtesy Eaton).
The type NPL fuse was designed specifically for application in the type CM-D network protector. Prior to that, CL fuses had been used with protectors. Figure 64 shows the time-current curves for the type NPL fuse. Also plotted is the curve of constant I2t with the dashed line. From this and by comparison with the curves for the Y and Z fuses in Figure 60, it is seen that the time-current curves for the silver-sand fuses are much steeper.

Figure 64:
Time-current characteristics of NPL silver-sand fuses.
Figure 65 is a picture of an NPL fuse that was developed for the type CMD network protector, and below this is a cutaway of an NPL fuse that blew under high fault currents. The fuse has multiple silver elements, all of which have melted open. The fuse is filled with a fine silica sand, whose purpose is to absorb the energy of the arcing when the fusible elements melt under high fault currents.


Figure 65:
Type NPL fuse, with cutaway showing a fuse which
operated under high fault currents (photo by author).
The type NPL fuse as shown in Figure 65 is not waterproof and intended for operations under water. Similarly, the typical NEMA class L fuse is not intended for operation under water.
Figure 66 shows the approach of one utility to use conventional low-voltage CL fuses in an underground vault subject to submersion. A rubber boot with openings at the top to allow cable connections to the fuse was developed. The boot was slipped up over the cables. Then the fuse was mounted to the protector network terminals, the cables attached to the fuse terminals, and finally the boot slipped down over the fuse. Stainless steel hose clamps were used to make water tight connections to the fuses.
One reason that utilities applied CL fuses external to the main housing of the network protector, as shown in Figures 58 and 66, was an attempt to disconnected a faulted 480- volt network protector from the paralleling bus in spot networks. If a fault occurs in a 480-volt network protector, it is in the “unprotected zone”, and will not be seen in most systems by the relays for the primary feeder. If a faulted 480-volt protector has internal Y or Z copper fuses, or internal alloy fuses, and the fault is within the protector enclosure, their blowing may not disconnect the faulted protector from the network paralleling bus. Quite likely the internal arcing would involve the bus work inside the protector on the network side of the fuses. Having the fuses external may help in disconnecting the faulted protector from the secondary in 480-volt spot networks, especially if each transformer/protector is in its own vault, with the paralleling bus in a separate vault.

Figure 66:
Submersible vault with current-limiting fuses in rubber
boot on top terminals of the network protector (photo courtesy
Westinghouse).
Type S Fuse
Another type fuse used in 216-volt network protectors is the type S fuse, developed by Chase Shawmut for the Consolidated Edison Company of New York in the 1950’s. Con Edison had been using the type Y and Z fuses in the network protectors available at this time. The factor limiting the rating of the protectors was the heat generated by these fuses. Con Edison wanted to increase the rating of these network protectors so that higher overloads could be placed on the network transformers. To accomplish this, the changes made consisted of replacing Class “A” insulation on the network protector relays (electro-mechanical), current transformers, and structural members with class “H” insulation, and utilizing a new fuse design, Type S, having approximately half the I2R losses.
Figure 67 shows the type S fuse, where the fusible element consists of multiple parallel copper leaves between heavy terminal blocks. This particular fuse is for use on the network protector shown in Figure 49 and 50. The type S fuse was made available for all size 216-volt network protector used by Consolidated Edison.

Figure 67:
Type S5 fuse for 5000 ampere 216-volt network protector
(photo by author).
In the paper titled, “ Increased Permissible Loading of Network Protectors”, by A. F. Newman and L. Falkenstein of Consolidated Edison, presented in the 1950’s, they include the curve of Figure 68 showing how on a 1000 kVA 216-volt network transformer, having a full load current of 2673 amperes, the permissible overload could be increased from 130% (3475 amperes) to 150% (4009 amperes) with the new type S fuse.
Three curves are shown in Figure 68, plotting the temperature rise in a protector mounted in a C-10 frame equipped with Class “H” insulated current transformers and relays.
The dashed curve in Figure 68 gives the temperature rise in the protector middle phase when carrying 4000 amperes (150% overload) when equipped with the Z50 copper fuse. The highest temperature rise is 160o C occurring near the fuse. With the Z50 copper fuse, at a protector current of 3500 amperes (130%) overload on the 1000 kVA network transformer, the temperature rise is about 121oC near the location of the fuses.
But with the new type S fuse, at 4000 amperes (150% overload on the 1000 kVA 216-volt network transformer, the highest temperature rise is about 114oC, less than that with the Z50 fuse at 3500 amperes. This fuse then allows 150% overload of the network transformers during a double or higher contingency condition.
When evaluating through-fault protection provided to network transformers by fuses, recognize that the different fuses have different time-current characteristics, and they do not provide the same level of protection.

Figure 68:
Temperature rise in network protector with three
different types on protector fuses (from EEI meeting).
Network Through-fault Protection
To evaluate the through fault protection provided by the network protector fuse to the network transformer, the fuse time-current characteristic and the transformer through-fault protection curve are plotted on the same graph. Because the secondary windings of the network transformer are connected in wye, the current seen by the secondary winding and the fuse is the same, thereby simplifying the comparison. As an example, the transformer protection curve and fuse curves are shown in Figure 69 for a 500 kVA 216Y/125-volt network transformer, for three different fuse types that might be used.
The heavy weight red-colored curve is the through-fault protection curve for the 500 kVA network transformer. Given by the other curves are the fuse characteristics for the Z25 copper fuse, tin alloy fuse, and the 1875 ampere NPL silver-sand type fuse.
-
The Z25 copper fuse (blue-colored curve), is made from copper that melts around 1083oC, so it’s time-current curve is not significantly affected by ambient temperature and protector preload.
-
The tin-alloy fuse (pink-colored curve) uses a low-melting temperature alloy, so its melting time is affected by preloading and ambient temperature. The curve given in Figure 69 is based on a protector that is carrying its rated current, with a 40oC vault ambient outside of the protector enclosure. As indicated before, at lower ambient temperatures and preloads, the alloy fuse curve moves to the right. That is, with no preload and lower ambient temperature, its melting time is higher than shown by the curve.

Figure 69:
500 kVA through-fault protection curve and network
protector fuse time-current curves.
To the best of the author’s knowledge, Westinghouse never published a curve showing how the alloy fuse curve did shift at lower ambient temperature and with no preload. However, in the paper, “Some Aspects of A Generalized Secondary Network”, by F. C. Van Wormer, appearing in the April 1958 GE Distribution Magazine, General Electric did present a curve showing the effect of ambient temperature on the melting time of their alloy fuse.
Effect of Ambient Temperature on Alloy Fuse
This is shown in Figure 70. It can be used to estimate the effect of lower ambient and preloads of the fuse characteristics. At 1000 seconds, the curve shifts to the right by a factor of about 1.5. At 3 seconds, the curve shifts to the right by a factor of about 1.8 or so.

Figure 70:
Impact of ambient and preload on alloy fuse time-current
characteristic (courtesy of GE).
- Returning to Figure 64, the time-current characteristic of the Type NPL fuse is the average melting curve, in accordance with standards for low-voltage current-limiting fuses, being based on 25oC ambient with no preloading. The NPL characteristic is shown by the green-colored curve in Figure 69
The accepted criterion for evaluating if the fuse protects the transformer for infrequent faults, at any given current, is to compare the fuse time with the time given by the transformer through fault protection curve. The protector fuse is considered to provide through-fault protection to the network transformer if the time given by the fuse curve is less than the time given by the through-fault protection curve. From Figure 69, it is seen that the fuses protect the transformer only if the backfeed current is above the point where the transformer protection curve and fuse curve intersect, which is about 4 kA for the Z25 copper fuse, and 8.5 kA for the 1875 ampere NPL fuse. For the tin alloy fuse in Figure 76, the intersect is at about 3 kA, but the intersect current would be much higher with no preload on the fuse and lower vault ambient temperature.
What is clear from Figure 69, is that the higher the backfeed current, the more likely the network protector fuse will protect the network transformer should the protector fail to open. In 216-volt applications, backfeed currents increase if the backfeed is from a point in the secondary network where high currents are available, and when the network transformer impedance is low. One advantage of having network transformers with 4% impedance instead of 5% impedance is that the backfeed currents for blowing protector fuses are higher should a protector fail to open. Appendix 4 shows the through-fault protection provided to different size network transformers in 480-volt spot networks with the silver-sand network protector fuses, and the Y and Z copper fuses.
Fuse Coordination with Network Protector Tripping
With the silver-sand NPL fuse shown in Figure 69, it might seem that moving the entire fuse curve to the left, parallel to itself, would lower the intersect point with the transformer protection curve from 8.5 kA to a lower value, thereby providing better through-fault protection to the network transformer should the protector fail to open. As the high-current low-voltage silver-sand fuse has many parallel elements as shown in Figure 65, removing some elements would shift the curve to the left. However, this makes the fuse too fast at high backfeed currents, where the fuse must coordinate with the tripping of the network relay and the network protector, especially when the protector is equipped with electro-mechanical relays rather than a micro- processor relay having a definite trip time. Also, with the elements removed, its temperature rise when carrying rated current of the protector may be too high. That is, the fuses continuous current rating could be less than the rating of the network protector.
Whenever silver-sand fuses are applied external to the network protector as in Figures 58 and 59, the fuse selected must coordinate with the tripping of the network protector during the maximum backfeed current for faults on the primary feeder. In spot networks, in general the greater the number of network units in the spot network, the higher the backfeed current that must be considered for coordinating protector tripping with the network protector fuse.
4.7 - Backfeed Currents for Primary Feeder Faults
BACKFEED CURRENTS FOR PRIMARY FEEDER FAULTS
When a short circuit occurs on a primary feeder of the network, after the primary feeder breaker opens and before any network protectors open, there are high currents in each protector backfeeding the fault. One exception to this is a backfeed to the single line-to-ground (SLG) fault when the network transformers on the feeder are connected delta wye-grounded. To determine the currents in each backfeeding protector, the currents in the secondary system, and the currents in unfaulted primary feeders, detailed modeling of the entire system with a digital short-circuit program is required. Currents in the secondary system may be needed to evaluate the coordination between protector fuses and cable limiters for faults on the primary feeder when a protector fails to open. Most practitioners desire that only the fuses in the backfeeding network protector blow. The currents are also required for the unfaulted primary feeders when the faulted feeder breaker is open, to evaluate settings for the feeder relays, to ensure that the relays for unfaulted feeders do not reach through the network and operate for a fault on an adjacent primary feeder. This was discussed in Primary Feeder Protection, and in particular the importance of the phase instantaneous current relay, 50ϕ, not picking up for a fault on an adjacent primary feeder.
However, detailed system modeling is not needed to determine the required interrupting rating of backfeeding network protectors for faults on the primary feeder. The interrupting rating of the protector, as normally applied, is higher than the backfeed current that is possible when the only impedance limiting the backfeed is that of the backfeeding network transformer. For network transformers with 5% impedance, the maximum backfeed is simply 20 times rated secondary current of the transformer, and for 7% impedance transformers the maximum backfeed is 14.3 times rated secondary current. For the maximum backfeed current, the network protector should open within several tenths of a second or less following feeder breaker opening.
If a network protector fails to open, for whatever reason, as discussed in Network Unit Equipment, the backfeed current should be above the current corresponding to the intersection of the protector fuse curve and the network transformer through-fault protection curve. When only one network protector is backfeeding following opening of the primary feeder breaker, the backfeed current can be found with relatively simple equations for multi-phase faults on the primary feeder. This Chapter reviews the calculation of backfeed currents under these conditions, identifies factors affecting the backfeed current magnitudes, and discusses backfeed conditions which have caused excessive heating of secondary neutral conductors when a backfeeding protector fails to open when reduced-size secondary neutrals are attached to the X0 bushing of the network transformer.
Backfeed to Three-Phase Fault or Ground
Figure 1 shows a single network protector and network transformer backfeeding a three phase-to-ground fault on the primary feeder with the primary feeder breaker open, and with every other network protector on the feeder open. For practical purposes, the positive-sequence impedance of the primary feeder between the HV terminals of the backfeeding transformer and fault is negligible in comparison to the impedance of the backfeeding network transformer. Also, for backfeed to the three phase-to-ground fault, the primary capacitances and the exciting impedances of the other network transformers on the feeder have negligible effect on the backfeed currents in the network protector.

Figure 1:
Protector currents for backfeed to a three-phase fault or
three-phase ground.
Thus, the magnitude of the backfeed currents is determined by the impedance of the backfeeding network transformer, and the Thevenin positive-sequence impedance at the terminals of the backfeeding protector looking into the network, when all protectors on the faulted feeder are open.
Designating the Thevenin positive-sequence impedance of the network as Z1N, and the network transformer impedance as ZT, both in Ohms referred to the secondary side of the network transformer as in Figure 1, the magnitude of the backfeed current in amperes for the three-phase fault are given by eq (1):
(1)
$$ \ \ \ |I_{A}| = |I_{B}| = |I_{C}| = | \frac{E_{LN}}{ Z_{1N} + Z_{T}}| \text{ Amps} $$
In eq (1), ELN is the pre-fault line-to-neutral voltage of the network at the backfeed location in volts, and ZT and Z1N are complex numbers found form eq (2) and eq (3) respectively
(2)
$$ \ \ \ Z_{T} = 10\frac{KV_{S}^2}{KVA_{T}} Z_{T ﹪ } ( \frac{1}{\sqrt{1 + (\frac{X_{T}}{R_{T}})^2 }} + j\frac{1}{\sqrt{1 + (\frac{R_{T}}{X_{T}})^2 }}) \Omega $$
(3)
$$ \ \ \ Z_{1N} = \frac{E_{LN}}{I_{3\phi - NWK}} (PF + j \sqrt{1 - PF^2}) \Omega $$
In these equations, KVS is the rated phase-to-phase voltage of the network transformer secondary winding in kV, KVAT is the rated kVA of the network transformer, ZT% is the nameplate impedance of the network transformer in percent, and XT/RT is the reactance to resistance ratio of the network transformer leakage impedance (See Network Unit Equipment, Table 2). I3ϕ-NWK is the magnitude of the available three-phase fault current in amperes from the network at the backfeed location when all network protectors on the faulted feeder are open. PF is the per unit power factor of the three-phase fault current available from the secondary network. In terms of the ratio of the positive-sequence reactance of the network, X1N , to the positive-sequence resistance R1N, of the network at the backfeed location, eq. (3) can be written as:
(4)
$$ \ \ \ Z_{1N} = \frac{E_{LN}}{I_{3\phi-NWK}}(\frac{1}{\sqrt{1 + (\frac{X_{1N}}{R_{1N}})^2}} + j \frac{1}{\sqrt{1 + (\frac{R_{1N}}{X_{1N}})^2}}) \Omega $$
Eq. (1) implies that for backfeed to a three-phase fault, the magnitude of the current in each of the three phases is the same. Although this is correct for a perfectly symmetrical system, in actual systems there will be a difference in the magnitude of the three phase currents.
To evaluate if the network protector fuses protect the network transformer for the backfeed to the three-phase fault, the engineer needs to know the current at the intersection of the transformer through-fault protection curve and the network protector fuse, that is the current corresponding to the intersection of the two curves. This was illustrated in Figure 69 of Network Unit Equipment for three different fuses that might be used in a protector applied with a 500 kVA 216-volt network transformer. Appendix 4 has more examples for fuses applied with 480-volt network protectors.
The curves in Figure 2 plot how much three-phase fault current must be available from the 208Y/120-volt network at the backfeed location, I3ϕ-MAX, on the ordinate, to have the backfeed current plotted on the abscissa. Curves are given for network transformers with either 4% or 5% leakage (nameplate) impedance, plotted for a network transformer impedance X to R ratio (XT/RT) of 8, and assuming the per-unit three-phase power factor of the available three-phase fault current from the network is 0.06097 (X1N to R1N ratio of 1.3). For example, with a 500 kVA network transformer with 5% impedance (solid red curve) and a desired backfeed current of 10 kA (on the abscissa) for the three-phase fault, the current available from the network must be at least 15 kA symmetrical (value read from the ordinate).

Figure 2:
Network short circuit capacity to achieve a required
backfeed current for the three-phase fault.
In an actual network system with a three-phase fault on the primary feeder and the feeder breaker open, the magnitude of the backfeed current in each phase will differ slightly. Furthermore, because of tolerances in the network protector fuses and different thermal conditions for each fuse in the protector, one fuse will melt and clear before the other two fuses can melt, as confirmed by tests in the field. When this happens, the conditions show by Figure 3 are created, where it is assumed that the fuse in the left phase, phase “A”, has cleared.
Prior to the blowing of the first network protector fuse as in Figure 1, the current exiting the X0 bushing of the network transformer is very small, being zero in the perfectly symmetrical system. This current is shown in green-color as IN in Figure 1. For this reason, the backfeed current to the three-phase fault on the primary is a function of only the positive-sequence impedance of the network at the backfeed location, Z1N, and the impedance of the network transformer, ZT.
However, after the first protector fuse clears as in Figure 3, the current exiting the network transformer X0 bushing, the vector sum of the “B” and “C” phase currents, designated as IN in Figure 3 , is not zero.
The current exciting the transformer X0 bushing flows in the neutral and grounding conductors of the secondary system. Consequently, the protector phase currents, after the first protector fuse blows, are a function of both the positive-sequence impedance of the network at the backfeed location, Z1N, and the zero-sequence impedance of the network at the backfeed location, Z0N, with all protectors on the faulted feeder open, as shown in Figure 3.

Figure 3:
Backfeed to the three-phase fault (ground) with a blown
fuse in phase “A” in the network protector.
The phase “B” and phase “C” currents, and the neutral current, after the blowing of the protector fuse in phase “A”, in per unit of the phase “A” current for the three-phase fault with no blown fuses, are given by eqs (5), (6), and (7) respectively.
(5)
$$ \ \ \ I_{B} = \frac{(a^2 - 1)Z_{1N} + ((a^2 - a)Z_{0N} +3a^2 Z_{T}) }{ Z_{!N} + 2Z_{0N} + 3Z_{T}} \text{pu} $$
(6)
$$ \ \ \ I_{B} = \frac{(a - 1)Z_{1N} + ((a - a^2)Z_{0N} +3a Z_{T}) }{ Z_{!N} + 2Z_{0N} + 3Z_{T}} \text{pu} $$
(8)
$$ \ \ \ I_{N} = \frac{-3(Z_{1N} + Z_{T})}{ Z_{!N} + 2Z_{0N} + 3Z_{T} } \text{pu} $$
In these equations, impedances Z1N, Z0N, and ZT are complex numbers, and can be in either Ohms referred to the secondary side of the network transformer, or in per unit on a common base. The operator “a” is:
(9) $$ \ \ \ a = e^{j120^o} = -\frac{1}{2} + j\frac{\sqrt{3}}{2} $$
From these equations:
-
When impedances Z1N, Z0N, and ZT have the same angle, phase currents IB and IC have the same magnitude, although the angle of IB and angle of IC are different. This applies even when all three impedances have a different magnitude. If the backfeed is from an isolated spot network, practically all three impedances have the same angle. When the backfeed is from a grid network where a significant part of the sequence impedances of the network is due to low-voltage cable circuits, the X to R ratio of transformer impedance ZT is higher than the X to R ratio for the network impedances, Z1N and Z0N. Currents IB and IC are not equal in magnitude when the angle of ZT is different from the angle of the network impedances Z1N and Z0N.
-
When impedances Z0N and Z1N are equal in both magnitude and angle, then IB, IC, and IN are equal in magnitude, even if the angle of ZT is different than the angle of Z1N. Again, IN as shown in Figure 3 is the current exiting the X0 bushing of the network transformer.
All Impedance Angles Equal
From equations (5) and (6), it can be shown that after the blowing of the first fuse in the protector, the backfeed current in phases B and C, IB and IC respectively, will decrease, but usually by no more than 10 % to 15%. Figure 4 plots the magnitude of the protector fuse currents in per unit of that before the first fuse blows for the three-phase fault, versus the ratio of Z0N to Z1N of the network at the backfeed location, for the case where all impedance angles (Z0N, Z1N, ZT) are equal. Under these conditions, the phase currents, IB and IC are equal in magnitude. For an isolated spot network, with delta wye-grounded network transformers, Z0N and Z1N have about the same magnitude and angle. As seen from Figure 4, this means that the magnitude of the backfeed current in phases B and C does not change much following blowing of the protector fuse in phase A for spot networks.

Figure 4:
Protector currents for backfeed to three-phase fault with
one blown fuse in per unit of current without blown fuse.
But if the backfeed is from a grid network where most of the impedance of the network is due to phase grouped low-voltage cables with a full size neutral, the ratio of the magnitude of Z0N to the magnitude of Z1N is in the range of 3 to 4. The family of curves in Figure 4 is for ratios of ZT to Z1N between 1 and 5, where the higher value (red colored curve) corresponds to backfeed from a location where higher fault currents (lower Z1N) are available from the LV network.
Impedance angle for ZT different than angle of Z1N and Z0N
When the impedance angle of the network transformer ZT is different than that for impedances Z0N and Z1N of the network, the magnitude of the current in protector phase B and C are different following the blowing of the first fuse for the three-phase fault. With the blown fuse in phase A, as in Figure 3, the current in phase B (lagging phase) is higher than that in phase C (leading phase). That is, after the fuse in the reference phase blows, the current in the phase that lags the reference phase is higher in magnitude than the current in the phase that leads the reference phase, when the angle of ZT is greater than the angle of Z1N, the normal situation when the backfeed is from a grid network.
This effect is shown by the solid red colored and green colored curves in Figure 5 for ratios of ZT to Z1N of 3.0 and 2.0. Note that these curves are plotted assuming the angle of Z0N and Z1N are the same. For comparison purposes, shown with the dashed red and dashed green curves in Figure 5 are the phase B and phase C currents when all impedance angles are equal.

Figure 5:
Protector currents with blown fuse in phase A when
impedance angle of ZT is 20 degrees larger than impedance
angle of Z1N.
After the first fuse blows for the three-phase fault on the primary feeder, the current exiting the X0 bushing of the network transformer will not exceed the largest phase current in the two phases whose fuses have not blown. This point can be seen from Figure 6, which plots the magnitude of the current in the X0 neutral bushing, IN in Figure 3, in per unit of the phase current prior to the blowing of the first fuse. The curves in Figure 6 are plotted assuming that impedances Z1N, Z0N, and ZT have the same angle. It is easily shown that, when Z1N and Z0N have the same angle, with the angle of ZT being larger than the angle of Z1N, the current exciting the X0 bushing, IN, will be lower than the value shown by the curves in Figure 6.
Following blowing of the second fuse in the protector backfeeding the three-phase fault, the magnitude of the current in the remaining phase, assumed to be phase “C”, in per unit of the magnitude of the phase “C” current for the three phase-to-ground fault prior to the blowing of any fuse is given by eq (10).

Figure 6:
Neutral current exiting transformer X0 bushing with
three-phase fault and one blown fuse in protector.
(10)
$$ \ \ \ |I_{C}| = |\frac{3(Z_{1N} + Z_{T})}{2Z_{1N} + Z_{0N} + 3Z_{T}}| \text{ pu} \ = | \frac{3(1 + Z_{T}/Z_{1N})}{2 + Z_{0N}/Z_{1N} + 3Z_{T}/Z_{1N}}| $$
Figure 7 plots the magnitude of the phase “C’ current with two blown fuses in per-unit as given by eq 10, versus the ratio of Z0N to Z1N, for the cases where all three impedances have the same angle. Curves are given for values of ZT/Z1N of 1.0 (brown colored curve) which corresponds to a backfeed from a weak location in the network, up to a value of 5.0 (red colored curve), which corresponds to a backfeed from a stiff location in the secondary network (low Z1N).

Figure 7:
Protector phase current and neutral current with backfeed
to three-phase fault with two blown fuses.
For an isolated spot network with short ties from the network protector terminals to a paralleling bus, the ratio of Z0N to Z1N would be close to 1.0. In contrast, the ratio of Z0N to Z1N would be in the range of 3 to 4 if the impedances looking into the network at the backfeed location were due mainly to 500 kcmil phase grouped cables. The stiffer the network at the backfeed location (high ZT to Z1N ratio), the higher the backfeed current. With two blown fuses, and three-phase fault on the primary, the neutral current IN exciting the X0 bushing is the same as the phase current as given by eq (10).
In summary, for a backfeed to a three-phase fault with a protector failing to open, or an intentionally applied three-phase ground, the phase currents in the protector, after blowing of the first fuse, will decrease slightly, and will decrease further following blowing of the second fuse. The current exiting the X0 bushing of the network transformer, IN, practically is zero before the first protector fuse blows, except when a large part of the secondary impedances is due to phase isolated cables. After the first protector fuse blows, the neutral current IN increases. Following blowing of the second network protector fuse, the neutral current rises somewhat from the level with one blown fuse. Finally, the last fuse will blow to clear the backfeed to the three-phase fault.
For backfeed to the three-phase fault with a protector failing to open, the current out of the X0 bushing of the backfeeding network transformer does not exceed the current in the protector fuses. If a full-size neutral is connected to the X0 bushing (same number and size of cables as used for the phase connections to the protector), overheating of the neutral path conductors has not been a problem.
Backfeed to Three-Phase Ground from Tests
Figure 8 shows the current in one (right) phase of a backfeeding network protector during test, where the protector was blocked closed and a three-phase ground applied to the primary feeder at the substation.

Figure 8:
Right-phase currents for backfeed to a three-phase ground
on primary feeder at substation.
The backfeeding protector was connected to a 208-volt grid network at a location which had other network transformers close-by, and cable ties to the grid network. With reference to the diagram in Figure 9, the current plotted in Figure 8 is for the right phase of the protector looking into the front of the protector, because this was the phase whose fuse blew last. In the system where the tests were conducted, as shown in Figure 9 the right phase was system phase “A”, the center phase was system phase “B”, and the left phase was system phase “C”.
With the current in the right phase taken as 1.0 per unit prior to the blowing of any fuse, after the fuse in the center phase cleared 809 mS after the ground was applied, the current in the right phase dropped down to 0.90 per unit. And after the fuse in the left phase cleared at 1007 mS, the current in the right phase dropped down to 0.75 per unit. The right phase fuse cleared at 1178 mS after application of the three-phase ground. Table 1 lists the right-phase current magnitudes from the field tests with no, one, and two blown fuses in the backfeeding network protector.
Table 1:
Right-phase current in per unit with backfeed to
three-phase fault
| Protector Fuse Status | Current in per unit of that with no blown fuses |
|---|---|
| No Blown Fuses | 1.00 |
| Center Phase (ϕB) Blown | 0.90 |
| Center & Left Phase (ϕB & ϕC) Blown | 0.75 |

Figure 9:
Phase designations for protector backfeed currents given
in Figure 8 and Table 1.
In the system where the tests were conducted, it was believed that at the network terminals of the backfeeding protector the ratio of Z0N to Z1N of the network was in the range of 3 to 4, as a significant part of the network impedance was due to low-voltage phase-grouped cable circuits. Thus, the angle of the backfeeding network transformer impedance was larger than the angle of the network impedances at the backfeed location.
From Figure 8, after the center phase fuse blew, which for the test system is phase “B” in Figure 9 (the phase lagging phase A where the current is being monitored), the current in the right phase (ϕA) dropped down to 0.90 per unit. If all impedance angles (Z0N, Z1N, ZT) were equal, the results of the simulations as shown in Figure 4 suggest that the current after blowing of the first fuse would drop down to 0.90 per unit only if the ratio of ZT to Z1N were about 1 (brown colored curve). However, it was believed that the angle of the impedance of the backfeeding transformer was about 20 degrees larger than that of the network impedance. Under these conditions, the curves of Figure 5, which are based on simulation with the blown fuse in phase A, show that in phase C, the current drops down to about 0.90 per unit, consistent with the test results, and the current in phase B drops down to about 0.95 per unit. Note that in the simulations phase C is leading the phase with the blown fuse phase A. And in the actual tests, the current in monitored phase A is also leading the current in the center phase (system phase B) where the first fuse blew. Thus, the test results and simulation results are in good agreement.
Thus, practically, if the current for backfeed to the three-phase fault without blown fuses is above the point (current) corresponding to the intersection of the transformer protection curve and the network protector fuse, the protector fuses will protect the network transformer from thermal damage should the protector fail to open. Further, if the network protector fuses thermally protect the phase cables in tie circuits from the network protector terminals to an adjacent manhole or vault, the network protector fuses will also protect the LV cables connected to the transformer X0 bushing if a full-size neutral is used.
Even if the circuit between the transformer vault and adjacent vault or manhole has a reduced size neutral (connected to the X0 bushing of the network transformer), the neutral conductors will be thermally protected by the protector fuses because:
-
Current does not flow in the neutral conductors connected to the X0 bushing until after the first protector fuse blows. In this time period, significant heating occurs in all three protector fuses.
-
The magnitude of the neutral conductor current is less than that flowing in the phases after the first protector fuse blows, and it flows for a much shorter duration.
However, if a network protector fails to open for a double line-to-ground (DLG) fault on the primary feeder, and a reduced size neutral is connected to the transformer X0 bushing, either bus or cable, before the protector fuses clear the backfeed, a cable fire may occur, or with bare bus there may be significant annealing of the bus.
Backfeed to Double Line-to-Ground Fault
For the double line-to-ground (DLG) fault on the primary feeder phases connected to backfeeding network transformer terminals H2 and H3 as in Figure 10, with the protector failing to open, the magnitude of protector phase “C” current, IC, the phase connected to transformer LV terminal X3, is exactly equal to the current for backfeed to the three-phase fault if the effects of primary cable capacitance are neglected. And with reference to Figure 10, the magnitude and angle of the current in protector phases “A” and “B” are equal, and equal in magnitude to one half of the current in protector phase “C”, shown as IC. Also, the current exiting the X0 busing, IN, is zero with no blown fuses. These relationships apply rigorously only if the effects of primary cable capacitance and the exciting impedance of other network transformers on the faulted feeder whose protectors are open, are neglected. But practically the two to one relationship applies for most systems, the exception being for primary feeders with excessive cable charging current.

Figure 10:
Protector currents for backfeed to a double
line-to-ground fault with no blown fuses in the protector.
Prior to the blowing of the first fuse, the phase currents in the protector are given by eqs (11) and (12), where the effects of primary cable capacitance are not included. All terms in these equations have been defined earlier.
(11)
$$ \ \ \ I_{C} = \frac{aE_{LN}}{Z_{1N + Z_{T}}} \text{ Amps} $$
(12)
$$ \ \ \ I_{A} = I_{B} = -\frac{1}{2} \frac{aE_{LN}}{Z_{1N} + Z_{T}} \text{Amps} = -\frac{1}{2} I_{C} \text{Amps} $$
For the DLG fault with the protector failing to open, the first fuse to blow is the one in the phase seeing twice the current as in the fuses in the other two phases. For the system of Figure 10, the fuse in phase “C” connected to transformer terminal X3 blows first, giving the conditions shown in Figure 11.

Figure 11:
Double line-to-ground fault on primary with protector
fuse in phase “C: blown.
With the protector fuse in phase “C” blown, the current in protector phases A and B are equal in both magnitude and angle when the effects of primary cable charging and transformer magnetizing current are neglected. The magnitude of the current in protector phases “A” and “B” in amperes is given by eq (13) where ELN is the pre-fault line-to-neutral secondary voltage in volts, and the impedances are in Ohms referred to the secondary side of the transformer.
(13)
$$ \ \ \ |I_{A}| = |I_{B}| = \frac{3}{2} | \frac{E_{LN}}{Z_{1N + 2Z_{0N} + 3Z_{T}}} | \text{ Amps} $$
The current in the protector fuses in per unit of the current for the three-phase fault is given by eq (14).
(14)
$$ \ \ \ |I_{A-PU}| = |I_{B-PU}| = \frac{3}{2} | \frac{Z_{1N} + Z_{T}}{ Z_{1N} + 2Z_{0N} + 3Z_{T}} | \text{ PU of } I_{3-PHASE} $$
Note from eq (13) that if Z0N and Z1N are equal at the backfeed location, after the fuse in phase “C” blows, the magnitude of the current in phases “A” and “B” of the protector is the same as that before the fuse in phase “C” blew, or one half of phase C current. However, when the backfeed is from a protector in a grid network, Z0N usually is greater than Z1N, so the magnitude of the current in phases “B” and “C” decrease after the first fuse blows.
Figure 12 plots, using eq (14) the magnitude of the current in the protector fuses for the DLG fault on the primary after the first protector fuse blows, in per unit of the fuse current magnitude for backfeed to a three-phase fault, as a function of the ratio of the magnitude of Z0N to Z1N of the network at the backfeed location. It is assumed that all impedance angles are the same for the curves, but plots made with the angles of Z0N and Z1N equal, and the angle of ZT as much as 30 degrees higher than the angle of Z1N are indistinguishable.

Figure 12:
Current in protector phases for DLG fault with one blown
fuse, in per unit of current for three-phase fault.
The magnitude of the current in two of the phases of the protector backfeeding the DLG fault, both before and after the blowing of the first fuse in the backfeeding protector, will not exceed 50% of the current for backfeed to the three-phase fault. Further, after the first fuse blows, the current in the other two phases can be significantly less than 50% of the backfeed current for the three-phase fault. If the backfeed is from a location in the secondary system where the system is weak (a fringe area where the ratio of ZT to Z1N is low), and where the ratio of Z0N to Z1N is high, the backfeed current after blowing of the first fuse can be much less than 50% of the backfeed current for the three-phase fault.
In summary, the current in two of the phases of the protector backfeeding the DLG fault, with the feeder breaker open, is one half of that in the third phase before any fuse blows in the backfeeding protector. Following blowing of the first fuse in the backfeeding protector, the current in the two unblown fuses drops from 50% down to a lower level in most systems, as the ratio of Z0N to Z1N is greater than 1.0. The amount of the drop following blowing of the first fuse can be found or estimated from the curves in Figure 12.
With reference to Figure 69 in Network Unit Equipment, the significance of these relationships is that, if the protector fuses are to protect the network transformer for backfeed to the DLG fault, with the protector failing to open, and if the current following blowing of the first fuse remains at 50% in the two phases with unblown fuses, the backfeed current for the three-phase fault should be at least twice (double) the current at the intersection of the transformer through-fault protection curve and the network protector fuse curve. But with the current in the two unblown fuses dropping below 50% following blowing of the first protector fuse, the protection analysis must consider the fuse heating and transformer heating at the 50% level prior to blowing of the first fuse, and the transformer heating and fuse heating at the reduced current following blowing of the first fuse in the protector. Such an analysis is doable, but will not be discussed in this chapter.
Also notice from Figure 11 that after the first fuse blows in the protector for backfeed to the DLG fault, the current in the X0 bushing is twice that in each unblown protector fuse. From this it can be hypothesized that if the number of conductors attached to the neutral (X0) bushing of the network transformer is smaller than the number used for the phase path, the protector fuses may not protect the “reduced size neutral” which sees twice the current in the protector fuses.
Secondary Neutral Conductor/Path Overheating
In grid networks having a reduced size neutral (one end connected to the network transformer X0 bushing) in the tie circuit from the network transformer vault to an adjacent vault or manhole is normal practice for some operators. Introduction and Overview and Network Unit Equipment had photos of network transformers with reduced size neutrals. Reduced size neutrals are also found in spot networks and multi-bank installations for the grid network. During normal loading and with faults in the secondary system, the reduced-size neutral usually has adequate capacity. Furthermore, during faults on the primary feeder, the secondary neutral connected to the X0 bushing only has to carry the unbalanced load current on the secondary providing no fuses have blown in the network protector, and that the network transformer has the delta connected primary windings.
But experience has shown that with a DLG fault on the primary feeder with the feeder breaker open, and the protector failing to open, neutral conductor temperatures, with reduced size neutral, can reach the level that causes cable fire when the neutral path uses insulated cable. And when bare copper bus is connected to the X0 bushing, this has also caused severe annealing when the copper bus has a much lower cross-sectional area than the insulated phase conductors attached to the network protector terminals.
Figure 13 shows a network transformer which experienced severe overheating of the reduced size neutral attached to the X0 bushing of the transformer. The insulation is gone, but in the service where the neutral was located, there was a significant fire due to overheating of the neutral conductors.

Figure 13:
Reduced size neutral conductors with insulation burnt
off from backfeed to DLG fault where protector failed to open (photo by
author).
There are two major factors causing neutral conductor overheating for backfeed to the DLG fault when a protector fails to open. First, after the first fuse blows, the current in the neutral path is twice that in each of the two unblown protector fuses. Second, after the first fuse blows, the current in each unblown protector fuse can drop significantly below the 50% level as shown by the curves in Figure 12, and before a second fuse blows the neutral conductor temperature reaches the level where the insulation burns.
The two configurations shown in Figure 14 will be analyzed to show the effect of the size of the neutral conductor on its temperature at the time the second protector fuse blows for the DLG fault.

Figure 14:
Backfeeding protector configuration with one blown fuse
and either two or four 500 kcmil cables connected to X0 bushing.
Detailed thermal analysis of the temperature rise of the conductors in the neutral path following blowing of the first network protector fuse is quite complex. However, by assuming that all heat is stored in the neutral conductors connected to the X0 bushing of the transformer, the temperature of the neutral conductor at the time the second protector fuse blows can be calculated.
For a given copper conductor, having initial temperature T1, having a cross sectional area of ACMILS, with a current of IAMPS flowing for time t, where t is the time for the network protector fuse to blow, the temperature of the conductor at time “t”, T2, is given by eq (15).
(15)
$$ \ \ \ T_{2} = (T_{1} + 234)10^{(\frac{I_{APMS}^2 t}{0.0297 \enspace A_{CMILES}^2})} -234 \enspace \degree C $$
In the system of Figure 14, the protector on the 500 kVA 216Y/125-volt backfeeding network transformer is assumed to have the type S fuse, with clearing time give by the curve in Figure 15.

Figure 15:
S2 fuse clearing time versus fuse current (courtesy of
Con Edison)
Note that on this curve the abscissa is the current in the protector fuse. Further, as stated before, the total current in the neutral conductors connected to the X0 bushing of the network transformer is twice the current in the protector fuse during backfeed to the DLG fault with one blown fuse.
With a reduced size neutral, where there are only two 500 kcmil conductors connected to the X0 bushing as on the left-hand side in of Figure 14, and assuming that the total current exiting the X0 bushing divides equally between the two neutral conductors, the current in each neutral conductor is the same as in the protector fuse. The orange colored curve in Figure 16 plots, using eq (15), the temperature of the neutral conductor when the second S fuse melts.

Figure 16:
Conductor temperature at time the second fuse in the
protector melts for backfeed to a DLG fault.
When a full size neutral is used as shown on the right-hand side of Figure 14, four 500 kcmil cables, and assuming the total current exiting X0 is twice that in the protector fuse, the current in each neutral conductor is one half of that in the protector fuse. The green colored curve in Figure 16 plots the temperature of the neutral conductors at the time the protector fuse clears, as given by the fuse cure in Figure 15.
What is clear from the orange colored curve in Figure 16, where the neutral is half size (half of the phase conductor size), and the backfeed current following blowing of the first protector fuse for the DLG fault on the primary, the temperature of the neutral conductor rises to a level where the cable insulation could melt and burn, as experienced in practice.
As shown by the curves in Figure 12, the magnitude of the backfeed current following blowing of the first protector fuse is influenced by the stiffness of the network system at the backfeed location, and also by the ratio of Z0N to Z1N at the backfeed location. From Figure 16, if the backfeed current in the protector fuse were limited to 5000 amperes following blowing of the first fuse, the temperature of the neutral conductor with reduce size would be about 600o C when the second protector fuse melts. Another factor lowering the backfeed current for the conditions in Figure 14 is the increase in the resistance of the secondary neutral cables and phase cables during the backfeed when the protector fuse clearing time is high.
But when a full-size neutral is used, when the backfeed current in the protector fuse is 5000 amperes, the temperature of the neutral conductor is about 150o C when the second fuse melts, well within the short circuit allowed temperature rise for most insulations on LV cables.
Also shown in Figure 16 with the red-colored curve is the temperature of each phase conductor at the time the second protector fuse melts. It is assumed that the current in each of the four phase conductors, for the final temperature calculation, is one fourth of that in the protector fuse.
Although the analysis presented for the conductor final temperatures at the time that the second protector fuse melts, is approximate as it assume all heat stored, it does provide an explanation why reduced size neutrals may not be protected by blowing of the protector fuses for backfeed to a DLG fault when the protector fails to open. Further, the results given in Figure 16 will be different for protector fuse types other than the S2 fuse.
Considering backfeed to a DLG fault, and a protector failing to open, a conservative design practice is to use, as a minimum, a full-size neutral connection to the network transformer X0 bushing.
Backfeed Damaging Bare Neutral Bus
Backfeeds to the DLG fault condition, with a protector failing to open, have also resulted in damage to bare buses attached to the X0 neutral bushing of the network transformer. Figure 17 shows the parameters of a system where this happened. The backfeed was from a 1000/1120 kVA 216-volt network transformer whose protector failed to open. Attached to each phase terminal of the network protector were six 750 kvmil copper cables (total cross-sectional area of 4500 kcmils), and attached to the X0 bushing was a ¼ inch by 6 inch copper neutral bar (cross sectional area of 1910 kcmils), or something less than a 50% neutral. As shown in the figure there was a three-phase ground on the primary feeder at the substation, but one of the primary phases was open due to the initial fault, so it appeared to the backfeeding protector as a DLG fault. The network protector had the S5 low loss protector fuses.

Figure 17:
System where bare copper neutral bus was badly damaged
during backfeed to a DLG fault on the primary with the network protector
failing to open
Figure 18 plots with the red colored curve the melting time of the S5 fuse in the protector versus the current in the protector fuse. The blue colored curve plots the time to raise the temperature of the six 750 kcmil phase cables from 25 degree C to 260 degree C, where it is assumed that the protector fuse current divides equally between the six phase cables. From this and the protector fuse curve, it is seen that the S5 protector fuse will clear for any backfeed current before the phase conductor temperature exceeds 260-degree C.

Figure 18:
Network protector Fuse time-current curve and time to
raise temperature of neutral bus to indicated temperature
The green, orange, and purple colored curves in Figure 18 show the time to raise the temperature of the ¼ by 6 inch copper neutral bus attached to the X0 bushing from 25oC to the indicated temperatures of 250o C, 500o C, and 750o C respectfully, assuming that the current in the neutral bar is twice that in the protector fuse indicated on the abscissa. The calculations further assume that the current density in the neutral bar is uniform, whereas there would be some skin affect making the current density non-uniform. Regardless, from Figure 18 it is seen that if the backfeed current is high enough for the DLG fault with the blown fuse, the S5 fuse in the second phase would clear before the temperature of the neutral bus exceeds 250oC.
The temperature of the neutral bus at the time the second S5 fuse melts can also be plotted, using eq (15), assuming that the current in the neutral bus is twice that in the protector fuse, the current in the neutral bus is uniformly distributed, and that all heat is stored. Certainly, for the longer times there would be some heat loss from convection and radiation. Regardless, Figure 19 plots the temperature of the neutral bus bar at the time the protector S5 fuse melts. From this it can be seen that if the backfeed current following blowing of the first protector fuse for the DLG fault is not high enough the temperature of the neutral bar could reach a level which causes annealing and damage before the second S5 protector fuse melts.

Figure 19:
Temperature of neutral bus at time the second protector
fuse melts for backfeed to a DLG fault.
Figure 20 shows the S5 fuses that were removed from a network protector that failed to open for backfeed to the DLG fault. Compare these with the picture of a new S5 fuse shown in Figure 67 of Network Unit Equipment. From Figure 20, it is clear that only one fuse interrupted, but that the other two fuses did experience high temperatures, but not sufficient to completely melt the fusible element.

Figure 20:
Network protector fuses from protector backfeeding a DLG
fault with just one fuse blown (courtesy Consolidate Edison).
Figure 21 shows the damaged copper neutral bus associated with the backfeed to the DLG fault that blew the protector fuse shown in Figure 20. Clearly the bus temperatures reached a very high level.
Figure 22 shows damage to a bolted joint in an aluminum neutral bus that occurred during backfeed to a DLG fault where the network protector failed to open.
The neutral bus in Figure 22 was in a five-unit 480-volt spot network with 2500 kVA network transformers. The protectors were equipped with 4000 Ampere Form 480 current-limiting fuses. The aluminum neutral bus size is ½ inch by 6 inch.


Figure 21:
Damage to copper neutral bus during backfeed to DLG
fault where protector failed to open (courtesy Consolisated Edison).

Figure 22:
Damage to aluminum neutral bus during backfeed to DLG
fault where protector failed to open (courtesy Consolidated Edison).
Regardless, whether insulated cable or bus, reduced size neutrals on the X0 bushing can be damaged during backfeed to a DLG fault after the first fuse in the backfeeding protector opens. Remember that for backfeed to the DLG fault, the first fuse to blow basically sees the same current as for backfeed to a three-phase fault, with the current in the other two phases being approximately 50%. Following blowing of the first fuse, the current in each of the other two phases drops down below the 50% level, and the time to blow a second fuse can be very high, allowing overheating of the conductors connected to the transformer X0 bushing.
If a second fuse clears during backfeed to the DLG fault on the primary, as illustrated in Figure 23, the backfeed current in the unblown fuse will be of relatively low magnitude. It will be determined primarily by the capacitance to ground of the primary cable circuits and the magnetizing impedances of all network transformers connected to the faulted feeder whose breaker is open at the substation.

Figure 23:
Backfeed to the DLG fault on the primary with two blown
fuses in the network protector.
Whether a third fuse blows is difficult to determine, recognizing that before the second fuse blew, the second and third fuse saw nearly the same current, approximately 50% of that for a three-phase fault, as shown in Figure 11.
Transformer Internal Neutral Path Current
This section describes an incident in a utility system where a SLG fault occurred on a network primary feeder, and following opening of the station breaker, all but one network protector opened. Before the backfeeding network protector could be opened, a second ground fault occurred on the same feeder, but on a different phase, producing in effect a DLG fault on the primary feeder.
Figure 24 is a simplified single line diagram of the system where the incident occurred. The vault contained two 500 kVA 216Y/125-volt network transformers and 1875 ampere network protectors. The protectors fed a bus which served a load, and in addition there were four sets of 500 kcmil cable from the bus to an adjacent manhole for the street network.
At approximately 1:30 AM, a single line-to-ground fault occurred on primary feeder 1 in Figure 24, and the station breaker opened. All network protectors associated with the faulted feeder opened, except for network protector 1 (NWP 1) in the subject vault. Since the network transformers had the delta connected primary winding, following opening of the feeder breaker the voltage to ground on the two unfaulted phases of the primary feeder rose up to full phase-to-phase voltage, stressing the line-to-ground insulation of all components on the unfaulted phases to full phase-to-phase voltage or higher. As discussed in Impact of Arcing Ground Faults on Network Primary Feeder During Backfeed, if the SLG fault were arcing in nature, voltages much higher than full phase-to-phase voltage could have appeared on the two unfaulted primary phases.
Prior to this these components were stressed at nominal phase-to-ground voltage. At approximately 3:30 AM, a terminator on an unfaulted phase at another network transformer failed, creating in effect a double line-to-ground fault on the primary feeder whose breaker was open, as shown in Figure 24.

Figure 24:
Simplified single-line diagram of system where network
transformer internal neutral path failed.
When the DLG fault developed on Feeder 1 in Figure 24, the backfeed current in one of the phases of network protector 1 (NWP 1) was the same as that for a three-phase fault, and the fuse in the right phase of the protector blew as shown in Figure 25. The fuses (tin alloy) in the left phase and center phase did not blow as seen in Figure 25.

Figure 25:
Network protector 1 with blown fuse in right phase only
(courtesy United Illuminating Co).
Note in Figure 24 that there is a tie from the paralleling bus to the street network, consisting of four sets of 500 kcmil phase-grouped cables with full size neutrals. The effect of this is to make the currents in the phases of network protector 1 (NWP 1) backfeeding the DLG fault higher than those in network protector 2 (NWP 2) on the unfaulted primary feeder, so only the fuse in NWP 1 cleared. If there had been no tie to the street network, it is possible that a fuse in NWP 2 would also have cleared as, neglecting load current, it sees the same current as the fuse in NWP 1.
After the first fuse in NWP 1 blew, the current in the X0 bushing of transformer 1 was approximately twice the current in each unblown fuse of NWP 1. Similarly, for network transformer 2 on feeder 2, there was a high current in the X0 bushing, XO2 in Figure 24, but less than that in the X0 bushing of transformer 1, X01 in Figure 24 due to the infeed from the grid network through the four sets of 500 kcmil phase-grouped cables.
Figure 26 is a photo of the external of network transformer 1 following the event, showing the X0 bushing to which neutral cables were attached, and a hole in the transformer tank below the X0 bushing.

Figure 26:
Exterior of transformer 1 following incident depicted in
Figure 24 (courtesy United Illuminating Co).
To help understand what caused this, Figure 27 is a photo of the inside of transformer 2, showing how the connection is made from the neutral point of the wye connected secondary windings to the X0 bushing of transformer 2.
From Figure 27, the horizontal copper bus from the neutral point of the wye connected windings was bolted to the X0 bushing that passes thru the transformer tank wall and is welded thereto. The connection was made with two bolts, nuts and appropriate washers.

Figure 27:
Internal neutral connection to X0 bushing of network
transformer 2 in Figure 24 (courtesy United Illuminating Co).
Figure 28 shows the interior of network transformer 1 at the completion of the incident. What happened is that with the DLG fault on primary feeder 1 in Figure 24, before a second fuse in NWP 1 could melt, which never happened, the bolted connection to the X0 bushing inside network transformer 1 failed, allowing the horizontal copper bus bar that was bolted to X0 to make contact with the transformer tank. This resulted in arcing to the transformer tank from the horizontal copper bar, that burnt the hole in the transformer tank, as seen in both Figures 7-26 and 7-28. This ultimately resulted in the burning of low-voltage cable insulation in the vault. Eventually, the cable fire in the vault caused a fault on primary feeder 2 in the vault, and primary feeder 2 tripped at the substation.

Figure 28:
Internal view of network transformer 1 following
incident depicted in Figure 24 (courtesy United Illuminating Co).
Subsequent forensic analysis by experts in joining dissimilar metals, copper to the stainless steel X0 bushing, revealed that the connection in the original design for the transformer was inadequate. The transformer manufacture developed a means to retrofit, in the field, the internal connection to the X0 bushing of these network transformers with stainless steel tank and X0 bushing. The redesigned connections were short circuit tested in a high-power lab to confirm the design.
Further, the DLG fault condition on feeder 1 was simulated with a short circuit program, both without a blown fuse in network protector 1, and with a blown fuse in network protector 1. From the currents and voltages existing at the backfeeding protector on feeder 1, it was determined that the MPCV network relay sensitive trip criteria were satisfied and it made its trip contact. Subsequent investigation showed that network protector 1 failed to trip due to a mechanical issue.
What was learned from this event is that when a short circuit design test is performed on a three-phase network transformer, as prescribed by transformer standards, it does not test the low-voltage neutral connections inside the transformer. A three-phase short is placed on either the HV or LV terminals of the transformer, with the other terminals energized to give the desired short circuit current. Such test does not stress the internal secondary neutral path or connections to the X0 bushing.
Cable Limiter Applications
Cable limiters are used in many 208Y/120-volt secondary network systems. Figure 29, taken from an AIEE conference paper, CP56-433 titled “Typical Applications of Non-Leaded Cable on LV AC Systems, shows the various methods for installing limiters.

Figure 29:
Typical applications for cable limiters in 208-volt grid
systems.
Limiters are included in “fusible crabs” as in the upper left-hand corner of Figure 29. Figure 30 shows a three-way by three-way fusible crab in a service box in New York City.

Figure 30:
Fusible crab in service box (photo by author)
Figure 31 shows five-way by five-way fusible crabs installed in a manhole. The center conductor of the crab does not have a limiter, but is used to form a ring bus within the manhole. With fusible crabs as in Figures 30 and 31, if the limiter blows, it can’t be replaced.

Figure 31:
Fusible crabs installed in a manhole with a ring bus
(courtesy of Consolidated Edison of NY)
Cable limiters can also be used with moles, where they are referred to as molimiters, as shown in the lower left-hand corner of Figure 29. Figure 32 shows moles in a network transformer vault, with cables joined to the mole, either with or without a limiter, called a molimiter as it is intended for use with the mole. With moles, the cables and limiters can be disconnected as the connection from the molimiter or the cable to the mole is mechanical.

Figure 32:
Moles in a transformer vault with cables connected both
with and without limiters (photo by author).
Cable limiters are also available for attaching insulated low-voltage cables to bus, such an application shown on the right-hand side of Figure 29. Figure 33 shows cables of different size connected to copper bus bars with lug-limiters in a 208-volt system. Figure 34 shows the components of the lug limiter, where in the upper half is seen the rubber insulting boot placed over the entire assembly. In the bottom half of the figure is seen the insulating shell that is placed around the conducting parts, intended to absorb the energy when the fusible section of the limiter melts from a high current.

Figure 33:
Cable attached to low-voltage bus using “lug type
limiters (courtesy of Consolidated Edison of NY)


Figure 34:
Components of a lug limiter (courtesy of Richards
Manufacturing)
For the limiter in Figure 34, the conductor of the cable is inserted into the cable socket on the left-hand side, and crimp connections made. The shell is attached to the limiter with small bolts and nuts on each side of the fusible section, to prevent the cable from moving when the fusible section melts. Cable limiters are also available with cable sockets on both ends so that the limiter can be placed “in-line” with the low-voltage cable.
The types of cable limiters shown in this section do not have a current rating, but are designated by the size of the copper cable that they are to be used with. Furthermore, the cable limiters shown in Figures 30 through 34 are intended for use only in 208-volt systems. They can not be used in 480-volt spot network systems as they will not successfully interrupt current at the higher recovery voltages.
Silver-sand type cable limiters are available for use in 480-volt spot network systems. Figure 35 is a cutaway of such a limiter showing the construction. It is similar to that of a low-voltage current-limiting fuse, in that there are multiple silver elements having notches cut in them. At very high available fault currents, each element melts at the areas of reduced cross section, and the resultant arc voltage is higher than the system driving voltage. Because of this, the limiters will limit the peak let-thru current to a value which is much less than the available peak current. That is, they act in a current limiting fashion. At the lower current levels, they have a time-current characteristic curve just like other fuses.

Figure 35:
Cutaway of a silver-sand type cable limiter for use in
systems with voltages up to 600 vols.(photo by author)
The interrupting rating of the conventional cable limiter is said to be around 30 kA. Although this is less than the available fault current on many secondary networks, there doesn’t seem to have been problems with the limiter operations on the 208Y/120-volt systems due to prospective fault currents being above 30 kA.
In an article appearing in the December 12, 1966 Electrical World magazine, by Martin R. Smith of the Bussmann Manufacturing Company, it is stated that “Tests of conventional link-type limiters by a mid-western utility, show external damage to the limiter or housing is common under heavy faults. This ranges from venting and cracking of the housing at 125 V, 30,000 amp, to a violent explosion at 500 V, 10,000 amp”. The point is that conventional cable limiters can not be used at 480-volts as they will not interrupt current at a current zero at the higher system (higher recovery) voltage.
In comparison, the silver-sand type cable limiters can have interrupting ratings as high as 100 kA or 200 kA, depending on the design. Later the time-current characteristics of the conventional cable limiter are compared with those of the silver-sand type limiter, from which it is seen from a log-log plot that the time-current curve of the silver-sand type limiter is much steeper than that of the conventional limiter.
One of the concerns with the conventional or current-limiting cable limiter is that the connection to one or both ends is made with a crimp connection. Thus, if the limiter blows its replacement means cutting the cable on the crimped end, which might not leave sufficient cable for installing a replacement limiter. Furthermore, when the limiter blows, there may not be visual indication of its operation.
A replaceable cable limiter which gives a visual indication of operation is shown in Figure 36, where the manufacturer’s literature indicates that it has been tested up to 25 kA for use on 208-volt systems. With this limiter, the bare conductor of the cable is inserted into the socket on the end, and then two shear bolts tightened until they shear. Should the limiter fusible element blow, the limiter can be disconnected by unbolting the bottom portion of the shear bolt. The bottom half of Figure 36 shows two of these limiters installed in a manhole with conventional in-line limiters.


Figure 36:
Replaceable cable limiter with visual indication of its
operation (courtesy Tyco Electronics).
Coordinating Protector Fuses and Cable Limiters
As can be seen from the limiter applications illustrated in Figure 29, between the network terminals of the network protector and either a bus or adjacent manhole, there are multiple cables per phase with limiters. If a network protector for the grid network fails to open during backfeed to a multi-phase fault on the primary feeder, or for the intentional application of a three-phase ground, the backfeed should be cleared by blowing of network protector fuses, and not cable limiters in secondary inter-vault tie circuits or in secondary mains. This is because it is much easier to replace a network protector fuse than to replace a cable limiter, especially when the limiters are in a fusible crab.
A common arrangement with single-transformer installations is to have the network transformer and protector in one vault, with multiple cables per phase in the tie circuit from the protector terminals to an adjacent vault, manhole, of bus hole, from which loads are supplied and to which secondary mains are connected. Figure 37 depicts this arrangement where there are four cables per phase in the tie circuit between the network protector and the adjacent manhole. Cable connections in the adjacent manhole may be made with bus, moles, or crabs.

Figure 37:
System for evaluating coordination between network
protector fuse and cable limiters during backfeed.
With four cables per phase in the vault tie-circuit between the network protector terminals the adjacent manhole, and a multi-phase fault on the primary feeder, the network protector fuse sees the total backfeed current, shown as INWP in red, with the total current in each phase dividing between the four parallel cables. If the current divided equally, the cable limiter in each phase would see 25% of the total backfeed current in the protector fuse. A conservative practice used in the past for evaluating the coordination between the protector fuse and cable limiters, for the configuration of Figure 37, was to assume that the current in a cable limiter with the largest current would not exceed 40% of the total backfeed current seen by the protector fuse.
A series of field measurements were made on one system of a large operator of secondary networks, after this criterion was developed, revealed that when there are four cable per phase, either phase-grouped or phase-isolated in inter-vault tie circuits, there was just one chance in a hundred that the current in a cable limiter would exceed 35% of the current in the protector fuse. To determine this, measurements were made at 17 different installations, on all three phases, so in effect measurements were made on 51 different phases. Table 2 shows the smallest cable current, the largest, and the mean for all of the measurements. The cables were all 500 kcmil.
Table 2:
Lower and upper limits for cable currents with four cables
per phase, from field measurements.
| Cable Limiter Current | Percent of total Backfeed |
|---|---|
| Smallest | 15.2% |
| Largest | 35.2% |
| Mean | 25.0% |
Field measurements were also made in inter-vault tie circuits which had six 750 kcmil cables per phase, with the results summarized in Table 3. Measurements were made in all three phases at 12 installations, so measurements were made on 36 different phases. From a statistical analysis of the data, there was one chance in a hundred that a cable current, with six per phase, would exceed 23.8%.
Table 3:
Lower and Upper limits for cable currents with six cables
per phase from field measurements.
| Cable Limiter Current | Percent of total Backfeed |
|---|---|
| Smallest | 10.3% |
| Largest | 23.8% |
| Mean | 16.7% |
Figure 38 shows how the currents in parallel cables were measured when there were four cables per phase. A split core current transformer was placed around each cable, and its output supplied to a high-frequency current transformer, the green colored devices on top of the network protector in the figure.

Figure 38:
Spit-core current transformers placed around the phase
cables on a network protector, with high-frequency CT’s to supply
measuring equipment (photo by author)
The outputs of the high-frequency current transformers were supplied to four-channel digital oscilloscopes that were mounted in a van located at the street level, where both magnitude and waveshape of cable currents were measured, and then stored on floppy disks. Figure 39 shows the digital oscilloscopes and the floppy disk recorders in the measurement van.
Four Cables Per Phase
Ideally, when there are four cables per phase in the tie circuit as in Figure 37, the network protector fuse seeing 100 % of the total backfeed current is faster than the cable limiter seeing 35% of the total backfeed current. Whether this is achieved with four cables per phase is dependent upon the type of fuse in the network protector, and the type of cable limiter.
Figure 40 shows the coordination between the Z-25 network protector fuse (red-colored curve), as selected by some operators for protectors on 500 kVA 216-volt network transformers, and the conventional cable limiter with four 500 kcmil cables per phase.

Figure 39:
Digital oscilloscopes for recording of currents in
parallel cables in intervault tie circuits (photo by author).

Figure 40:
Coordination between the Z25 network protector fuse and
the conventional cable limiter.
The curves in Figure 40 are plotted versus the current in the network protector fuse. The Z-25 characteristic is shown with the red-colored curve. The blue-colored curve shows the cable limiter characteristic if it sees the same current as the protector fuse, and obviously a cable limiter is faster than the protector fuse when it sees the same current as the protector fuse.
When the protector current splits equally between the four parallel cable limiters, the cable limiter time versus the current in the protector fuse is shown by the green-colored curve. The pink-colored curve in Figure 40 shows the cable limiter time versus the current in the protector fuse when the cable limiter sees 35% of the current in the protector fuse. There is only one chance in a hundred that the limiter current will exceed 35%. From Figure 40, the Z-25 fuse will blow and clear for a high-current backfeed before any cable limiter will melt.
Notice from Figure 40 that the shapes of the type Z protector fuse curve and the cable limiter curve are similar, which allows for good coordination. This similarity is not accidental, because the Y and Z fuses and conventional cable limiters were developed by the same manufacturer.
If instead, the fuse in the protector on the 500 kVA network transformer were the silver-sand type NPL fuse, with characteristics as given by the red-colored curve in Figure 41, the network protector fuse will coordinate with the cable limiter if the largest current in the cable limiter is 25% (green-colored curve) of that in the NPL protector fuse. But if the cable limiter current is 35% of that in the network protector fuse, the pink-colored curve in Figure 41 shows that at the lower backfeed currents, a cable limiter could blow. This has been confirmed by one system operator from actual field experience.

Figure 41:
Coordination between the silver-sand NPL fuse and
conventional cable limiters with four cables per phase.
To obtain selectivity with this type of fuse, silver-sand NPL, one approach is to install an additional set(s) of cables in the tie circuit from the network protector terminals to the adjacent manhole, providing spare ducts are available.
Silver-sand type fuses applied with network protectors do not coordinate as well with conventional cable limiters as the Y and Z fuses, and also the type S fuse. But the silver-sand fuses have other advantages, such as higher interrupting ratings, and they do not emit gasses or molten copper upon operation.
Another type fuse applied with 500/560 kVA 216-volt network transformers is the type S2.25 in protectors rated 2250 amperes. In these applications there are typically four 500 kcmil cables per phase from the protector to the adjacent vault or manhole. Plotted in Figure 42 versus the current in the network protector fuse are the S2.25 fuse characteristics with the red-colored curve, and the limiter characteristic when it sees the 100% of the protector current (blue-colored curve), 25% of the protector current (green-colored curve), and 35% (pink-colored curve) of the current in the protector fuse.

Figure 42:
Coordination between the type S2.25 fuse and
conventional cable limiters with four cables per phase.
Also shown on Figure 42 is the through-fault protection curve for the 500 kVA network transformer with the dashed-black-colored curve. It would seem from this that as long as the backfeed current is high enough to allow the S2.25 fuse to protect the network transformer, the S2.25 fuse should clear before a cable limiter could melt. However, there is a range of backfeed currents where, if the current in a limiter were 35% of the current in the protector fuse, both the protector fuse and a cable limiter could melt and open.
When there is concern about coordination of cable limiters and protector fuses during high-current backfeeds if the network protector fails to open, it builds a good case for thorough maintenance and testing practices to assure that the network protectors will open during high-current backfeeds. One method used by some utilities to check protector operation is the drop test. In this test, the feeder breaker at the substation is opened, and the voltage on the feeder side of the breaker monitored. If all protectors open, there should be very little to no voltage on the feeder side of the breaker.
The coordination examples given for the different network protector fuses have considered just the conventional cable limiter applicable only at 216-volts. If the silver-sand type cable limiters are used, the time-current characteristics are considerably different than those of the conventional cable limiter as shown in Figure 43. This must be taken into account when evaluating coordination when the current-limiting cable limiters are applied.

Figure 43:
Comparison of time-current characteristics of
conventional cable limiters and silver-sand cable limiters.
Multi-Transformer Vaults With Ties to Street Network
Although the coordination between the protector fuse and cable limiters in the tie circuit between the network protector and adjacent vault may be difficult for the configuration given in Figure 37, where there are four cables per phase, the situation improves significantly for the multi-bank installations that supply from the paralleling bus both customer load, and a tie circuit to the grid network as shown in Figure 44.
In this configuration, there are two network units in the vault and a tie circuit to the street network consisting of four sets of phase-grouped cables with limiters at both ends of each cable.
The connections from the throat mounted network protectors to the paralleling bus frequently are very short, use phase isolated cables located in air between the protector terminals and the bus. Cable limiters are not used in these short phase-isolated connections, but are installed in both ends of each cable from the paralleling bus to the street network.
In Figure 44, there is a multi-phase fault on HV feeder 1, with the backfeed current in the protector for the faulted feeder designated as IF. The current in the fuse in the other network protector on HV feeder 2 is designated as K*IF, where K in general is a complex number with a magnitude less than 1.0. The total current in the four parallel cables of the tie circuit to the network is (1-K)*IF. With there being “N” sets of phase-grouped cables in the tie circuit, the current in each cable is (1-K)*IF / N if the current divides equally between the N sets of cable. This arrangement improves the coordination between the protector fuse backfeeding the fault, seeing current IF, and the limiters in the tie circuit cables. The division of the backfeed current IF between the adjacent transformer seeing current K*IF , and the tie circuit, (1-K)* IF, is best found with a short circuit program.

Figure 44:
Two-unit multi-bank installation with tie-circuit to
grid network from paralleling bus
An approximate value of K is given by eq (16) when there are four cables per phase in the tie circuit, where the terms in the equation are:
KVAT = kVA rating of the transformer on HV feeder1 & 2
ZT% = Impedance in % of transformer on HV feeder 1& 2
MVA3ϕ-FLT = Three-phase fault MVA available from the network at the paralleling bus excluding the contribution from the two-network transformer connected to the bus.
The other assumption made for eq (16) giving “K” is that the impedance angle of the network transformer on feeder 2, and the impedance angle of the positive-sequence impedance of the network at the paralleling bus is the same.
(16) $$ \ \ \ K = \frac{KVA_{T}}{KVA_{T} + 10 * Z_{T ﹪} * MVA_{3\phi - FLT}} $$
With four cables per phase between the paralleling bus and the limiter, the maximum current in any one cable limiter, ILIM-MAS, is:
(17)
$$ \ \ \ I_{LIM - MAX} = 0.35(1 - K) I_{F} $$
Figure 45 plots the distribution of the total backfeed current, IF, between the network transformer on the unfaulted feeder, KIF, with the purple curve, the total current in the tie circuit (1-K)IF, with the orange colored curve, and the maximum current in a cable limiter, green colored curve, where with four sets of cable this is 0.35 times the total current in the tie circuit, or 0.35 (1-K) IF, as given by eq (17). The curves are plotted versus the three-phase fault current in kA available on the network paralleling bus

Figure 45:
Distribution of total backfeed current with two 500 kVA
5% impedance network transformers and street tie.
From Figure 45, the following observations should be made.
-
If there is no tie circuit to the network (abscissa value of 0), K is 1.0, and the current in the fuses of the protector on the unfaulted feeder is the same as that in the backfeeding protector. This just points out that in two-unit spot networks, the network protector fuses can’t be coordinated during backfeed. If a protector fails to open the fuses in the protector on the unfaulted feeder may also blow.
-
In order to prevent the fuse in the protector fed from the unfaulted feeder from blowing, the current in the backfeeding protector, IF, must be sufficiently higher than the current in the protector connected to the unfaulted feeder, K*IF. How much higher depends upon the type of fuses in the protector and their time-current characteristics,
-
With the 500 kVA 5% impedance transformers, if the available short circuit current from the network were 26.73 kA, as indicated by the heavy black arrow, the current in the protector supplied from the unfaulted feeder is 50% of that in the backfeeding protector, the total current in the tie circuit is also 50% of that in the backfeeding protector. In effect, with 26.73 kA available from the tie circuit, and two 500 kVA 5% impedance network transformers, it looks like a three-unit spot network. And for the three-unit spot network, the current in the two protectors on each unfaulted feeder is 50% of that in the backfeeding protector, and fuse coordination is achievable.
-
The maximum current in a limiter in the tie circuit, as shown by the green colored curve, will not exceed about 28% of the current in the backfeeding network protector if the current available from the tie circuit does not exceed 80 kA. The fuse in the backfeeding protector will clear before a cable limiter in the tie circuit can melt.
In summary, from Figure 45, if the current available from the tie circuit, with 500 kVA 5% impedance network transformers is above 26.73 kA, the fuses in the backfeeding network protector will blow before the cable limiters or the fuses in the protector supplied from the unfaulted feeder. Further, if there are more than two transformers feeding the paralleling bus with the street tie as in Figure 44, the coordination between protector fuses and cable limiters is even better.
Coordination of Protector Fuse With Limiters for Street Secondary Mains
Even when the network protector fuse is faster than the cable limiters in the tie circuit between the network protector vault and adjacent manhole, the network protector fuse also should be faster than any cable limiters in secondary mains feeding into the adjacent vault during high-current backfeeds. This is to avoid blowing of cable limiters in secondary mains for faults on the primary feeder should a network protector fail to open. Figure 46 shows a portion of a system where the tie circuit from the network protector to the adjacent manhole (bus hole, crab vault, etc.) has four cables per phase. In the adjacent manhole there are two sets of secondary mains running in three-different directions, with the currents in each set of secondary mains designated as ISM1 through ISM6, during backfeed. The protector fuse seeing current INWP should be faster than cable limiters in secondary mains seeing current ISM1 through ISM6.

Figure 46:
Coordination between network protector fuse and cable
limiters in secondary mains for backfeed to multi-phase fault on primary
feeder.
Generally, the larger the number of secondary mains terminating in the manhole or vault adjacent to the network transformer vault, the more likely that the protector fuse will be faster than the cable limiters in the secondary mains. Unfortunately, there is no easy way to determine the split of the total backfeed current, IF, in the secondary mains, other than through detailed modeling with a short circuit program.
When the backfeeding protector is located at a weak point in the secondary grid where there are not a sufficient number of secondary mains to allow for coordination between protector fuses and limiters in secondary mains, and the current available from the grid is not high enough, sometimes a faster network protector fuse is applied to obtain selective coordination. This practice is referred to, by one major operator of secondary networks, as “fringe area fusing”. It not only allows for coordination between the protector fuse and limiters in the secondary mains, but that it provides better through fault protection to the backfeeding network transformer should its protector fail to open for the three-phase fault or application of a three-phase ground.
Cable Limier Protection For Cable Insulation During Solid Faults
Figure 47 shows the cable limiter time-current characteristics with the solid lines, and with the dashed lines the insulation damage curves for L260 cable insulation.
What is gleamed from these curves is that the limiter will protector the cable insulation only when the fault current is above the intersect point of the limiter curve and the cable damage curve. For the 500 kcmil copper cable, the intersection point is shown with the heavy red dot. This is discussed in more detail in Secondary Grid Design Considerations.

Figure 47:
Cable limiter time-current characteristics and cable
insulation damage curves.
4.8 - Network Overvoltages During Backfeed
NETWORK OVERVOLTAGES DURING BACKFEED
A multi-phase fault on the network primary feeder produces, after the primary feeder breaker opens, high currents in the backfeeding network protectors, resulting in the opening of all protectors on the faulted primary feeder. Typically, this happens in several tenths of a second or less, depending on the type of relays in the network protectors and their sensitive trip time. As discussed in Backfeed Currents for Primary Feeder Faults, if a protector fails to open for a multi-phase fault, it is desired that the backfeed be cleared by blowing of the network protector fuses. Backfeeds to multi-phase faults on the primary feeder generally do not cause overvoltages in the secondary network.
When the primary feeder breaker at the substation is open for a network dedicated primary feeder that has delta-grounded wye connected network transformers, the primary feeder is energized by the delta connected HV windings of the network transformers whose network protectors are closed. Prior to opening of the primary feeder breaker at the substation, most always the primary system and feeders are part of a grounded system, as determined by the system grounding employed for the medium-voltage system at the substation. The primary system may be effectively grounded, or non-effectively grounded, depending on the system positive-and zero-sequence impedances at the medium-voltage buses that supply the primary feeders. Primary System Grounding discusses grounding for the primary system of the secondary network. Upon opening of the primary feeder breaker, the primary feeder changes from a grounded system to an ungrounded system when all network transformers have the delta connected HV winding. With the feeder breaker open, the primary feeder is grounded through the capacitances of the feeder cables and capacitances of connected equipment, due mostly to network transformer primary windings.
If the network transformers have the grounded-wye connected primary windings, then the primary feeder remains a grounded system when the feeder breaker is opened and a closed network protector(s) is backfeeding the primary feeder.
This chapter considers overvoltages which can occur during backfeed when the network transformers have the delta-connected primary windings. At the instant that the primary feeder breaker is opened in the absence of a fault, or with a single line-to-ground (SLG) fault on the primary feeder, all network protectors are closed. As discussed in Introduction and Overview, the network protectors on the feeder then open in a sequential manner, until the last protector has opened to de-energize the feeder. However, after all backfeeding protectors open, and with the feeder breaker open, there may still be low-level voltages on the primary feeder, from feedback through the control circuits and relays of the open network protectors. The magnitude of the feedback voltages is determined by the type of network protector, the type of relays installed in the network protector, the network transformer characteristics, and the capacitance of the primary feeder. This phenomenon was mentioned in Introduction and Overview, and is discussed in Network Protector Relaying. Because of voltages on the primary feeder during backfeed with all protectors open, the primary feeder must be treated as energized until tested and grounded.
If the last network protector fails to open, the situation is that shown in Figure 1, where the effect of the magnetizing impedances of the network transformers on the feeder, whose protectors are open, and the magnetizing impedances of the backfeeding transformer are neglected. With the primary feeder breaker open, the feeder is energized from the delta connected windings of the backfeeding network transformer, and the primary cable looks like a grounded-wye capacitor bank, assuming shielded cable where all capacitance is from phase-to-ground. Rigorously, the capacitance to ground is distributed, but for most situations it can be treated as a lumped capacitance from each phase to ground as in Figure 1, except for extremely long feeders. That is, the voltage from any phase-to-ground on the primary feeder during backfeed without a fault, or with the SLG fault, is practically the same along the entire length of the feeder.

Figure 1:
Model for screening analysis for network overvoltages
during backfeed with feeder breaker open.
As revealed by the circuit of Figure 1, in absence of a fault (switch S1 open), the capacitive charging current of the primary cable is supplied by the network transformer through the impedance of the secondary network at the point of backfeed. The capacitive charging current in the secondary network and network transformer causes a voltage rise on the primary feeder, and also a voltage rise in the secondary network at the point of backfeed.
The size of the backfeeding network transformer and the capacity (stiffness) of the secondary network supplying the backfeeding network protector and transformer are independent of the voltage level of the primary feeder. However, the capacitive charging kVAr per mile of cable for the primary feeder rises with increasing primary voltage level, and the feeder charging kVAr increases with longer lengths of primary feeder. In general, the potential for objectionable overvoltages in the secondary network during backfeed does not exist with 5-kV class primary circuits, and usually is not a problem with systems having nominal voltage levels between 5 kV and 15 kV. However, in systems with primary voltages of 23 kV and higher, with delta wye-grounded network transformers, the potential for overvoltages during backfeed should be investigated.
The starting point to determine if overvoltages will occur during backfeed is to perform a simple linear analysis as discussed in this chapter. If the linear analysis shows there are no objectionable overvoltages, no further investigation is needed. But if the linear analysis shows unacceptable overvoltages, a detailed non-linear analysis should be done modeling the non-linear magnetizing impedances of all network transformers on the backfed primary feeder.
The voltage in the network during backfeed, in absence of a fault (switch S1 open in Figure 1), and with the SLG fault (switch S1 closed), can be determined through a linear analysis of the circuit in Figure 1. In Figure 1, the total capacitance to ground on each phase of the primary feeder (shielded cable assumed) is connected from each HV terminal to ground of the backfeeding network transformer. This is represented with impedance ZC in the figure. The exciting impedances of the backfeeding and all other network transformers on the feeder are neglected. The effect of neglecting these exciting impedances is that the steady-state voltages, obtained through analysis of the linear circuit of Figure 1, are higher than those that result when the network transformer exciting impedances are included.
If the screening analysis of the linear circuit in Figure 1 shows that objectionable overvoltages do not occur in the secondary, then further analysis is not required. If the screening analysis shows the overvoltages are objectionable, and/or above the level producing saturation of the network transformers, then an analysis should be conducted to take into account the magnetizing impedance of the backfeeding transformer, and the magnetizing impedances of the other network transformers on the feeder being backfed.
If this analysis shows that objectionable overvoltages still occur, shunt reactors can be installed on the primary feeders to limit voltage rise. Expanded Linear Circuit Analysis discusses the modeling of the magnetizing impedances and the shunt reactor. Thus, the analysis discussed in the next three sections of this chapter is a conservative procedure to determine if there is a potential overvoltage problem.
Balanced Backfeed
From the circuit of Figure 1, in the absence of a fault on the primary feeder (Switch S1 open), the capacitive charging current of the primary feeder cable flows through the equivalent impedance representing the LV network system at the backfeeding network transformer. The low-voltage system at the backfeeding transformer is represented by the positive-sequence impedance ZS inserted in each phase, and the impedance in the neutral path, (ZS0 - ZS)/3, where ZS0 is the zero-sequence impedance looking into the network. The balanced capacitive cable charging current flowing back through the positive-sequence impedance of the network, ZS, causes a voltage rise on the network. Similarly, a voltage rise occurs on the primary feeder due to the capacitive current flowing through the network positive-sequence impedance ZS and the network transformer impedance ZT. The voltage-rise on the LV network and on the primary feeder increases as the capacitive charging current of the primary feeder increases. The voltage rise also increases as the impedance of the network, ZS, at the backfeed location increases. That is, the voltage rise is higher when the backfeed is from a weak point (fringe area) in the secondary network.
In Figure 1 and in the following equations, voltages to ground on the primary feeder are designated with capital letter subscripts, “A”, “B”, and “C”, and the voltages to ground on the secondary at the backfeeding network protector are designated with lower-case letter subscripts, “a”, “b”, and “c”.
Primary System Phase-to-Ground Voltages
For a balanced backfeed, the voltages from phase-to-ground on the primary feeder, in per unit of the network transformer rated voltage are given by:
(1)
$$ \ \ \ V_{A} = \frac{Z_{C}}{Z_{S} + Z_{T} + Z_{C}} E_{PU} \enspace \text{pu of nwk xfr rated} $$
(2)
$$ \ \ \ V_{B} = \frac{Z_{C}}{Z_{S} + Z_{T} + Z_{C}} a^2 E_{PU} \enspace \text{pu of nwk xfr rated} $$
(3)
$$ \ \ \ V_{C} = \frac{Z_{C}}{Z_{S} + Z_{T} + Z_{C}} a E_{PU} \enspace \text{pu of nwk xfr rated} $$
In these equations, impedances ZS, ZT, and ZC are in per unit on the rated kVA and rated voltage of the network transformer, and EPU is the magnitude of the network open-circuit voltage at the backfeeding network transformer. Voltage EPU is in per unit of the rated voltage of the network transformer secondary winding. If the open-circuit voltage were 208 volts or secondary system nominal voltage, then EPU is 208/216 or 0.963 per unit when the backfeeding network transformer rated secondary voltage is 216 volts. For the balanced backfeed, the voltages are not a function of the zero-sequence equivalent impedance of the network, ZS0, in Figure 1, unless one or more of the fuses in the network protector were blown. That case is not considered in this chapter. Further, the three phase-to-ground voltages are balanced. Primary Feeder Protection describes calculations for finding the impedances in the above equations from basic data that usually is readily available.
Network Phase-to-Ground Voltages Balanced Backfeed
During the balanced backfeed, the phase-to-ground voltages at the terminals of the backfeeding network protector in per unit of network transformer rated secondary voltage are:
(4)
$$ \ \ \ V_{aN} = \frac{Z_{T} + Z_{C}}{Z_{S} + Z_{T} + Z_{C}} E_{PU} \angle -30\degree \text{ pu of nwk xfr rated} $$
(5)
$$ \ \ \ V_{bN} = \frac{Z_{T} + Z_{C}}{Z_{S} + Z_{T} + Z_{C}} E_{PU} \angle -150\degree \text{ pu of nwk xfr rated} $$
(6)
$$ \ \ \ V_{eN} = \frac{Z_{T} + Z_{C}}{Z_{S} + Z_{T} + Z_{C}} E_{PU} \angle 90\degree \text{ pu of nwk xfr rated} $$
In these equations, phase “a” network line-to-ground open-circuit voltage is at an angle of -30o. With this assumption, primary system phase “A” to ground voltage , when ZC is large in comparison to the other impedances, is at angle 0o for network transformers with the standard phase shift of 30o from the LV to the HV side (HV side leading) when positive-sequence voltage is applied to network transformer LV terminals X1, X2, and X3.
The voltages found with equations (4) to (6) give the upper bounds on the voltages applied to the customer loads in the network, and are the voltages applied to any loads fed directly from the protector terminals during the balanced backfeed, because transformer magnetizing impedances are neglected. Further, they are the voltages applied to electronic equipment in the network protector such as the microprocessor network protector relay, and equipment for remote monitoring and control of the network protector.
As shown in Backfeed to SLG Fault, the magnitude of the network line-to-ground voltages during the balanced backfeed is the same as the magnitude of phase “c” network line-to-ground voltage, VcN,, in Figure 1, when there is a backfeed to the SLG fault on primary phase “A”. Furthermore, the magnitude of network phase “a” and phase “b” line-to-ground voltages during backfeed to the SLG fault are higher than those during the balanced backfeed. Similarly, the voltages to ground on the two unfaulted phases of the primary cable are higher during backfeed to the SLG fault than for the balanced backfeed.
Backfeed to SLG Fault
Primary Phase-to-Ground Voltages
With a backfeed to the bolted SLG fault on primary phase “A” in Figure 1 (Switch S1 closed), the voltage from primary phase “B” and “C” to ground, in per unit of the phase-to-neutral voltage corresponding to the rated phase-to-phase voltage of the network transformer, are given by eq (7) and eq (8), respectively. The magnitude of the term in front of the parentheses is the magnitude of the primary system phase-to-ground for the balanced backfeed, as given by eqs. (2), and (3). Within the parentheses, the first term, either “a” or “a2) has a magnitude of 1.0, and an angle of either +120o or -120o, respectively (See Network Unit Equipment). The second term also has a magnitude and angle associated with it, but is such a relationship that, when subtracted from either “a” or “a2”, the unfaulted phase-to-ground voltages at the fault point on the primary during the SLG fault are higher than for a balanced backfeed. From either eq (8-7) or eq (8-8), when the magnitude of ZC is much greater than the magnitudes of ZS and ZT, which is when primary cable charging is very small, the term inside the parentheses has a magnitude of √3 [ (a2-1)], such that the magnitude of phase “B” and phase “C” voltages to ground on the primary are √3 (1.732) times that for a balanced backfeed. A practical significance of this is that the primary cables, splices, and other equipment on the primary feeder must be able to withstand phase-to-ground voltages of at least nominal phase-to-phase voltage of the primary system, for extended periods of time when a network protector fails to open under backfeed to the SLG fault.
(7)
$$ \ \ \ V_{BF} = \frac{Z_{C}}{Z_{S} + Z_{T} + Z_{C}} (a^2 - \frac{Z_{C}}{3Z_{S} + 3Z_{T} + Z_{C}}) E_{PU} \text{ pu of nwk xfr rated} $$
(8)
$$ \ \ \ V_{CF} = \frac{Z_{C}}{Z_{S} + Z_{T} + Z_{C}} (a - \frac{Z_{C}}{3Z_{S} + 3Z_{T} + Z_{C}}) E_{PU} \text{ pu of nwk xfr rated} $$
Network Phase-to-Ground Voltages Backfeed to SLG Fault
The voltages to ground at the terminals of the backfeeding network protector for the SLG fault on phase “A” of the primary feeder are given by eq (9), eq (10), and eq (11). For the “a” and “b” phase network line-to-ground (neutral) voltages, VaN and VbN respectively, the first term is the same as that for a balanced backfeed without a fault on the primary, and the second term represents the effect of the SLG fault. From eq (11), the phase “c” network line-to-ground (neutral) voltage, VcN, for backfeed to the SLG fault is the same as during a balanced three-phase backfeed in absence of a fault.
(9)
$$ \ \ \ V_{aN} = \frac{(Z_{S} + Z_{T}) E_{PU} \angle -30\degree }{ Z_{S} + Z_{T} + Z_{C}} - \frac{ \sqrt{3} Z_{S}Z_{T}E_{PU}}{(Z_{S} + Z_{T} + Z_{C}) (3Z_{S} + 3Z_{T} + Z_{C})} \text{ pu nwk xfr rated} $$
(10)
$$ \ \ \ V_{bN} = \frac{(Z_{S} + Z_{T}) E_{PU} \angle -150\degree }{ Z_{S} + Z_{T} + Z_{C}} + \frac{ \sqrt{3} Z_{S}Z_{T}E_{PU}}{(Z_{S} + Z_{T} + Z_{C}) (3Z_{S} + 3Z_{T} + Z_{C})} \text{ pu nwk xfr rated} $$
(11)
$$ \ \ \ V_{eN} = \frac{(Z_{S} + Z_{T}) E_{PU} \angle + 90\degree }{ Z_{S} + Z_{T} + Z_{C}} \text{ pu nwk xfr rated} $$
The two parameters with the greatest effect on the network voltages during a backfeed, either balanced or with a single phase-to-ground fault, are:
-
Cable charging kVAr of the primary feeder, which determines impedance ZC.
-
Three-phase short circuit current available from the LV network at the point of backfeed, which determines impedance ZS, the Thevenin positive-sequence impedance looking into the LV network.
Figure 2 plots the network line-to-ground voltages at the backfeeding network protector as a function of cable charging kVAr at the rated voltage of the transformer primary winding, when the backfeeding network transformer is a 500 kVA unit with a secondary winding rated 216Y/125 volts. The voltages plotted are in per unit of the secondary system nominal line-to-ground voltage taken as 120 volts. Furthermore, in the equivalent circuit of Figure 1, at the backfeed location, the open circuit phase-to-ground voltage is assumed to be 120 volts. This means that the open-circuit network voltage at the backfeed location, EPU, in per unit of the network transformer rated voltage is 208/216 or 0.963 per unit.
In Figure 2, the series 1 curves (solid lines) apply when the available three-phase fault current from the low-voltage network at the location of the backfeeding transformer is 20 kA. Low values occur when the backfeed is form a protector/transformer located in a fringe area or weak area of the grid network. Series 2 curves (dashed lines) in Figure 2 apply when the available three-phase fault current from the network at the backfeed location is 100 kA, which corresponds to a backfeed from a transformer/protector in a multibank installation with ties to the street network. This would be a rather stiff point for the backfeed to originate.

Figure 2:
Network phase-to-ground voltages at protector terminals
in pu on 120-volt base for backfeed to SLG fault.
In Figure 2, the curve for phase “c” voltage, green colored curves, at the backfeeding protector apply not only for backfeed to the SLG fault on phase “A” of the primary feeder in Figure 1, but also with a balanced backfeed. From the red and blue colored curves in Figure 2, the network line-to-ground voltages on two of the phases during backfeed to the SLG fault on the primary are always higher than during a balanced backfeed. The circuit in Figure 1 and the curves in Figure 2 help in identifying situations where objectionable overvoltages may occur when the backfeed is from a 500 kVA, 5% impedance network transformer.
Figure 3 plots the unfaulted phase-to-ground voltages on the primary feeder for a SLG fault on phase “A”, in per unit of the network transformer rated phase-to-phase voltage for the same parameters that apply to the curves in Figure 2. Specifically, the pre-fault voltage was 208 volts, or 0.963 per unit of the network transformer rated voltage.

Figure 3:
Unfaulted phase-to-ground voltages on primary feeder in
per unit of network transformer rated phase-to-phase voltage.
In Figure 3, the voltages are in per unit of the rated phase-to-phase voltage of the network transformer. That is, the voltages plotted are those given by eq (7) and eq (8) respectively, divide by √3. The curves give an indication of the overvoltage applied to the two legs of the delta connected HV winding of the backfeeding network transformer and all other network transformers on the feeder, from which a judgement can be made on whether the other network transformers on the feeder, with open protectors, will saturate, and the validity of the linear screening analysis neglecting magnetizing impedances.
The curves in Figure 3 show that the unfaulted phase-to-ground voltages on the primary during backfeed to the SLG fault can be considerably higher than rated phase-to-phase voltage, and that with the fault on primary phase “A”, phase “C” to ground voltage is higher than phase “B” to ground voltage. With reference to the transformer quasi-phasor diagram in Figure 1, this relationship is consistent with secondary phase “a” to ground voltage being higher than secondary phase “b” to ground voltage, as shown in Figure 2.
Other parameters such as the size of the backfeeding network transformer, the X to R ratio of the transformer, and the X to R ratio of the network positive-sequence impedance ZS, at the backfeed location also affect the network line-to-ground voltages at the backfeed location, but not to the extent of primary cable charging kVAr, and the stiffness of the network at the backfeed location, quantified by impedance ZS in Figure 1. Everything else being the same, the network voltages are a little higher with a smaller backfeeding transformer. This is shown by the curves in Figure 4 which give the network line-to-ground voltages when the backfeed is from a point in the network where the available three-phase fault current is 20 kA. The solid curves give the network voltage when the backfeed is from a 300 kVA network transformer, and the dashed curves are for a backfeed from a 500 kVA network transformer.

Figure 4:
Effect of size of backfeeding network transformer on the
network line-to-ground voltages for SLG fault with 20 kA available from
network.
Figure 5 shows the effect of the network transformer X to R ratio on the network line-to-ground voltages when backfeeding a SLG fault on the primary. The size of the backfeeding transformer is 500 kVA, with 20 kA available from the network at the backfeed location. The solid curves are for an X to R ratio of 8, and the dashed curves are for an X to R ratio of 4. The voltages are somewhat higher with the higher X to R ratio transformer.

Figure 5:
Effect of the X to R ratio of backfeeding 500 kVA network
transformer for SLG fault on the secondary network line-to-ground
voltages with 20 kA available from the network.
Figure 6 shows the effect of the X to R ratio of the LV network system (positive-sequence impedance ZS) at the backfeed location on the network line-to-ground voltages for backfeed to the SLG fault. The size of the backfeeding network transformer is 500 kVA with the X to R ratio of the transformer being 8.0. The solid curves in Figure 6 are for a network X to R ratio of 6, and the dashed curves are for a network X to R ratio of 2. The voltages are higher with the higher X to R ratio for ZS, being significantly higher for network phase “B” voltage as shown by the blue colored curves.

Figure 6:
Effect of the X to R ratio of the network on network
line-to-ground voltages. at the backfeed location for SLG fault
The size of the backfeeding transformer also affects the magnitude of the primary system phase-to-ground voltages for the SLG fault on the primary, with the voltages being higher with the smaller size transformers. This is because with the smaller transformers, the voltage rise caused by the capacitive current in the transformer leakage impedance, ZT in Figure 1, is higher, which makes the cable charging current larger.
However, generally in determining if the overvoltages in the network or on the primary feeder during backfeed, both balanced and for the SLG fault, will be acceptable, the calculations must be done for the smallest size backfeeding transformer, which on most systems today is a 500 kVA unit. Further, it should consider the backfeed being from a fringe area of the grid network, where the available fault current from the secondary system is low (impedance ZS high).
Similar curves can be prepared for other network transformer sizes and circumstances using equations presented in this chapter. In conducting this analysis, the network line-to-ground voltage at the backfeed location (Thevenin open-circuit voltage in the equations, EPU), in per unit of the network transformer rated secondary voltage, usually 216Y/125 volts, must be properly selected. For example, if the open-circuit line-to-ground voltage on the network at the backfeed location were 120 volts, then EPU is 120/125 or 0.96 per unit in the equations.
A voltage of 1.06 per unit of the nominal voltage of the network (208 volts phase-to-phase, 120 volts phase-to-neutral) during backfeed to the SLG fault, with a protector failing to open, should be acceptable in most systems. This is 127 volts to neutral, which is the upper limit for ANSI C84 range B voltages. The ITIC curve, formerly the CBEMA curve, indicates that sensitive electronic equipment rated for 120-volts can operate at 110% of rated voltage continuously, and at 120% of rated voltage for up to 0.5 seconds (30 cycles). The ITIC curve appears in Figure 9 of Primary System Grounding.
Thus, during the sustained backfeed with a protector failing to open, voltages of 110% of network nominal should be acceptable in most systems. Higher voltages may be acceptable if customer equipment is not fed directly from the terminals of the backfeeding network protector, and if electronic components (microprocessor relay, remote monitoring equipment, etc.) supplied directly from the network protector buses are rated for voltages above 132 volts to ground.
Further, with a network voltage to ground of 1.06 per unit of system nominal voltage, the backfeeding network transformer would not saturate or draw excessive magnetizing kVA. And if the primary side phase-to-ground voltages are limited to 1.06 pu of network transformer rated voltage (Figure 3), the other network transformers on the feeder being backfed whose protectors are open also should not saturate. In most systems, the network transformers will not draw high magnetizing kVA for network voltages of 1.10 per unit of system nominal voltage, which is 1.059 per unit of the voltage rating of the 216Y/125-volt network transformer. Thus, neglecting magnetizing kVA is not overly conservative at these voltage levels.
Assuming the network voltages are to be limited to 1.06 per unit of system nominal voltage, the curves of Figure 2 provide an estimate of the maximum cable charging kVAr that can be backfed for a 5% impedance 500 kVA transformer. In Figure 2, series 1 curves (20 kA available from the network) suggest cable charging should not exceed about 150 kVAr, and series 2 curves (100 kA available from network) suggest about 630 kVAr can be backfeed during the SLG fault without network voltage rising more than 0.06 per unit. Assuming a 10% voltage rise in the network at the backfeed location, the cable charging for the series 1 and series 2 conditions of Figure 2 are 240 kVAr and 920 kVAr, respectively. If the magnetizing reactances of the network transformers were included, these values would be slightly higher.
Charging kVAr of the primary feeder is a function of cable size, insulation dielectric constant, feeder length, and nominal voltage of the primary system. At 13 kV, typical values are between 30 and 65 kVAr per mile, and at 27 kV, typical values are between 95 and 175 kVAr per mile, depending on cable size. This suggests that, with backfeed from a fringe location with series 1 characteristics (20 kA available) as in Figure 2, the voltage rise on the network with a 13 kV feeder (assuming 50 kVAr per mile charging), will not exceed 10 % if the total length of the primary cable in the feeder (main and all branches) does not exceed about 4.8 miles. But at 27 kV, voltage rises above 10 % could occur (assuming 150 kVAr per mile charging) if the total cable length exceeded about 1.6 miles under the conditions defined in Figure 1.
Network Negative-Sequence Voltage
When the SLG fault occurs on the primary feeder, and the protector fails to open, in addition to the potential for line-to-ground overvoltages in the network, significant negative-sequence voltage will appear in the network at the backfeed location. When the backfeed is from a 500 kVA 5% impedance transformer, Figure 7 plots the negative-sequence voltage for two conditions. The solid curve applies when the three-phase fault current available from the LV network is 20 kA, and the dashed curve when the available three-phase fault current from the LV network is 100 kA. One reason this is of importance is that some network relays will change their trip characteristic when the negative-sequence voltage exceeds a threshold. For example, the MPCR relay (see Network Protector Relaying) had an adaptive watt-var straight-line trip characteristic that changed from watt to watt-var when the negative-sequence voltage equaled or exceed 6% (0.06 per unit). From Figure 7, when the backfeed is from a week location, the negative sequence voltage could exceed 6%, and the trip characteristic changed for the SLG fault. But with the watt-var straight line-trip characteristic, the MPCR relay would not detect the capacitive backfeed corresponding to the SLG fault.

Figure 7:
Network negative-sequence voltage during backfeed to SLG
fault from 500 kVA transformer.
Potential Problem Areas
In systems with network transformers connected delta wye-grounded, operating at nominal primary voltages of 23 kV, 27 kV, and 34.5 kV, the potential for overvoltages during backfeed should be evaluated. The evaluation should be made with the backfeed location being the point in the secondary system where the available fault current from the network, excluding the contribution from the backfeeding transformer/protector, is the lowest of all possible backfeed locations. The transformer size should be the smallest that is used for the 208Y/120-volt grid network. That could be as small as 300 kVA in some systems.
Screening for Potential Overvoltages With Linear Analysis
If the simplified linear analysis with the circuit of Figure 1, where transformer magnetizing impedances are neglected, shows that the network voltages during backfeed from the weakest point in the network are acceptable, typically in the range of 1.06 per unit of 120 volts, no further analysis is required. Voltage rises of 10 % may be acceptable for certain topologies and system conditions. Otherwise, the analysis should be made, including magnetizing impedances of all network transformers on the feeder whose protectors are open, and that of the backfeeding network transformer. The first stage for this is to model the transformer excitation with a constant impedance based on rated voltage exciting current. This can be further refined by modeling of the non-linear characteristics of the transformer exciting impedances. Expanded Linear Circuit Analysis of this chapter discusses techniques for performing an analysis where transformer exciting impedances are represented, and where the effects of shunt reactors can be represented.
Fault Path Current for SLG Faults On Primary Feeder
When a single network transformer/protector is backfeeding a SLG fault with the feeder breaker open, and there are no grounding banks or shunt reactors on the primary feeder, the current in the fault path is limited primarily by the phase-to-ground capacitances of the primary cables, just as in any ungrounded system. The fault-path current is not high as when the feeder breaker is closed, but it is of a level that, if arcing, can deliver significant power into the fault path. Analysis of the linear circuit in Figure 1, the current in the fault path for the bolted SLG fault is given by eq (12).
(12)
$$ \ \ \ I_{F-PU} = \frac{E_{PU}}{(R_{S} + R_{T}) + j(X_{S} + X_{T} - \frac{X_{C}}{3})} \text{ per unit pf xfr rated line current} $$
In eq (12), RS and XS are the resistive and reactive parts of impedance ZS, and RT and XT are the resistive and reactive parts of transformer impedance ZT, all in per unit on the rated kVA and rated secondary voltage of the backfeeding network transformer. XC is the capacitive reactance to ground of the primary cable, also in per unit on the ratings of the backfeeding network transformer. And as in all equations for the linear analysis, EPU is the pre-fault voltage in per unit of the network transformer rated secondary voltage.
The current in the fault path in actual amperes is given by eq (13).
(13)
$$ \ \ \ I_{F-AMPS} = I_{F-PU} \frac{KVA_{T}}{\sqrt{3} KV_{HV}} amperes $$
In this equation, KVAT is the kVA rating of the backfeeding network transformer, and KVHV is the rated phase-to-phase voltage of the network transformer primary winding in kV.
Figure 8 is a plot of the fault path current in amperes for backfeed from a 500 kVA 13.8 kV to 216Y/125-volt network transformer to a SLG fault, assuming that the pre-fault voltage, EPU, is the transformer rated secondary voltage, or 1.0 per unit. Two curves are given for different short circuit currents available from the network, plotted against the nominal three-phase charging kVAr of the primary feeder. The curves show that the current in the fault path, although much less than the current for the SLG fault with the feeder breaker closed, is not negligible. The limitations of the linear analysis discussed in this chapter for voltages also apply to the results for fault path current.
Currents of the magnitude in Figure 8 will release considerable energy at the fault point if arcing, which could result in the SLG fault propagating into a multi-phase fault, depending on the proximity of other phases, if not rapidly cleared by opening of the network protector.

Figure 8:
Fault path current in amperes for backfeed to bolted SLG
fault from 500 kVA 13.8 kV to 216- V transformer.
Protector Currents during Backfeed to SLG Fault
When voltages at the backfeeding protector at the weakest point in the network do not exceed 110%, the linear analysis, neglecting magnetizing impedances of the network transformers, usually shows that the currents in the network protector for backfeed to the SLG fault are not high enough to blow the protector fuses. Further, when the backfeed is form a weak point, the linear analysis shows that, for network voltages significantly above 110%, the network protector fuses may not blow, or will blow only after a long time. From the circuit of Figure 1, the following equations give the current in the backfeeding protector in per unit of network transformer rated secondary current. All terms in these equations have been defined. The backfeed currents, in per unit of network protector rating, will be less because the rated current of the protector is always greater than the rated current of the network transformer LV winding with which it is applied.
(14)
$$ \ \ \ I_{aN} = \frac{E_{PU} \angle -30\degree}{Z_{S} + Z_{T} + Z_{C}} + \frac{\sqrt{3} Z_{C}E_{PU}}{(Z_{S} + Z_{T} + Z_{C})(3Z_{S} + 3Z_{T} + Z_{T})} \text{ per unit of xfr rated} $$
(15)
$$ \ \ \ I_{bN} = \frac{E_{PU} \angle -150\degree}{Z_{S} + Z_{T} + Z_{C}} - \frac{\sqrt{3} Z_{C}E_{PU}}{(Z_{S} + Z_{T} + Z_{C})(3Z_{S} + 3Z_{T} + Z_{T})} \text{ per unit of xfr rated} $$
(16)
$$ \ \ \ I_{cN} = \frac{E_{PU} \angle + 90\degree }{ Z_{S} + Z_{T} + Z_{C}} \text{ per unit of xfr rated} $$
In these equations, as in the equations for the voltages:
EPU = secondary network open-circuit phase-to-neutral voltage at the backfeeding network transformer in per unit of the rated voltage of the transformer, normally 216Y/125.
The first term on the right-hand side of each equation is the backfeed current in absence of a fault, and the second term for phase “a” and phase “b” current, represents the effect of the SLG fault on the total phase current. From eq (16), the current in phase “c” of the protector during a balanced backfeed and backfeed to a SLG fault is the same. That is, when the SLG fault is applied, the current in phase “c” of the backfeeding transformer/protector does not change. This is consistent with network phase “c” to ground voltage not changing upon application of the SLG fault, as shown by eq (11).
Figure 9 plots the current in the backfeeding transformer/protector in per unit of the protector rated current, assumed to be an 1875 ampere protector installed on a 500 kVA 216-volt network transformer, for the same conditions used to plot network voltages in Figure 2. From this, the backfeed current in protector phases “a” and “b” are nearly equal, regardless of the stiffness of the network at the backfeed location. However, for a given charging kVAr for the primary feeder, the backfeed currents with the stiffer secondary system (series 2 conditions - dashed curves in Figure 9) are less than those with the weaker secondary system (series 1 conditions - solid curves in Figure 9). Also, for a given cable charging kVAr, the backfeed current in phase “c” is significantly less than in phases “a” and “b”, regardless of the stiffness of the network at the backfeed location.
From the curves for network voltage in Figure 2 and the protector current curves in Figure 9, it can be seen that for backfeeds from locations with low available fault current from the network, that do not result in network voltages above 110%, the currents in the protector will not result in protector fuse blowing, or they will blow only after a long time period. For example, with the available fault current from the network being 20 kA (series 1 conditions), and the cable charging being 240 kVAr, Figure 2 shows the network voltage is limited to 110%. From Figure 9, at 240 kVAr, the backfeed current in the protector will not exceed rated current for the 1875 ampere protector. And the protector fuses will not blow at rated current.
Further, the linear analysis shows that, when the backfeed is from a weak point in the network, where the network voltages at the backfeed location are considerably above 110%, the network protector fuses will not melt to protect the secondary system from high overvoltages, or else one or more fuses will melt only after an extended time period. For example, when the nominal charging is 400 kVAr, and the available fault current from the network is 20 kA, Figure 2 shows that the voltage at the backfeed location are about 120 % of nominal. At 400 kVAr, from Figure 9 the largest current in the 1875 ampere protector is two times the protector rated current.
Figure 10 plots the characteristics of the network protector fuses that might be used in the 1875 ampere protector. Shown with the black-colored vertical dashed lines are the currents corresponding to 1.0, 1.5, and 2.0 times protector rated current. At 2.0 times protector rated current, the time for the fuse to melt could be between 100 and 1000 seconds, depending on protector fuse time. The ITIC curve given in Primary System Grounding, Figure 9, indicates that voltages above 120% should not be allowed for more than 0.5 seconds.

Figure 9:
Network protector currents in per unit of protector rated
current of 1875 amperes for backfeed to SLG fault.

Figure 10:
Time-current characteristics of fuses for application on 500 kVA
216-volt transformer with 1875ampere protector.
If instead the cable charging were 600 kVAr, the voltage at the backfeed location would be 1.34 per unit, and the current in the 1875-ampere network protector is about 3.5 times protector rated current, or 6560 amperes. From Figure 10, at a current of 3.5 times protector rated current, the shortest melting time of any protector fuse is about 10 seconds for the Z25 copper fuse, and for the 1875 ampere NPL fuse, it is about 200 seconds.
Depending on cable charging kVAr, backfeeds to the SLG fault causing harmful overvoltages may not be cleared by blowing of one or more fuses in the backfeeding protector.
Controlling Overvoltages during Backfeed to SLG Faults
To prevent overvoltages when primary cable charging kVAr is high, three-phase shunt reactors have been installed on network primary feeders. This has been done in some systems operating at nominal primary voltages of 23 kV, 27 kV, and 33 kV with long primary feeders, which have high cable charging kVAr per mile. Most always, as illustrated through examples in this Chapter, shunt reactors are not necessary in systems operating at 13.8 kV and below, because primary feeder cable charging kVAr is not high enough, unless the feeder length is extremely long. However, if shunt capacitor banks were installed on network primary feeders, and connected in grounded wye, high overvoltages can occur in the secondary network during backfeed in primary systems with 5 and 15-kV class voltages. For this reason, in general, shunt capacitor banks should not be placed on network primary feeders on the feeder side of the feeder circuit breaker at the substation. The capacitors can be connected to the substation medium-voltage buses that supply the network primary feeders, to realize the benefits discussed in Network Substation Design.
Shunt Reactor Characteristics
The windings of the three-phase shunt reactor are connected in wye, with the neutral point of the wye grounded through a switch. The switch is closed during normal operation, but can be opened to allow testing of the primary cables, and to allow for fault location. As can be visualized from Figure 1, under a balanced backfeed, in absence of a SLG fault, the reactor’s inductive current cancels out the balanced cable charging current in part or full, depending on reactor size, thereby limiting the voltage rise on the network and the primary feeder during a balanced backfeed.
In order for the voltage rise on the secondary under a balanced backfeed and the backfeed to the SLG fault on the primary feeder to be about equal, the three-phase shunt reactor should have a zero-sequence impedance that is less than its positive-sequence impedance. Reactors have been produced for network applications where the zero-sequence impedance impedances are in the range of 25% up to 90% of the reactors’ positive-sequence impedance. Reactors with kVA ratings up to 1500 kVA have been developed. Table 1 lists the characteristics of reactors used on the 27 kV feeders of Consolidated Edison, and Table 2 list characteristics of reactors applied on 33 kV systems of Consolidated Edison.
Table 1:
Characteristics of shunt reactors for application on
network 27 kV primary feeders.
Voltage (kV) |
27 | 27 | 27 | 27 | 27 |
|---|---|---|---|---|---|
Size (kVA) |
300 | 600 | 600 | 1000 | 1000 |
| Z0 (%( | 25 | 90 | 50 | 62.5 | 50 |
Table 2:
Characteristics of shunt reactors for application on
network 33 kV primary feeders.
Voltage (kV) |
33 | 33 | 33 |
|---|---|---|---|
Size (kVA) |
600 | 1000 | 1500 |
| Z0(%) | 50 | 50 | 50 |
Expanded Linear Circuit Analysis of this chapter discusses a linear analysis that models the effects of the transformer magnetizing impedances and shunt reactor (positive-and zero-sequence) on the primary feeders.
As mentioned before, the positive-sequence series impedance of the primary feeder cable is very small in comparison to the impedance of the backfeeding network transformer, such that the voltage to ground on each primary phase does not change that much along the feeder, during a balance backfeed, or the backfeed to the SLG fault. Thus, the location of the shunt reactor on the primary feeder is not critical from the standpoint of its effect on limiting voltage rise. Another significant benefit of the shunt reactor is that it also limits the unfaulted phase-to-ground voltages on the primary feeder during the SLG fault when a protector fails to open. Figure 3 shows that, in absence of a shunt reactor, when the cable charging kVAr is high, the unfaulted phase-to-ground voltages can go significantly above nominal phase-to-phase voltage. Such overvoltages can overstress primary cable and splice insulation, possibly precipitating failure of an already deteriorated cable or splice on an unfaulted phase.
One complication caused by the shunt reactor is that it does serve as a high-impedance ground source for the primary feeder. This means that a ground fault on one primary feeder of the network results in ground fault current in any unfaulted feeder that has a shunt reactor and is supplied from the same medium-voltage bus in the substation as the faulted feeder. The duration of this ground fault current in the unfaulted primary feeder is the time required for the circuit breaker for the faulted feeder to open. Lowering the zero-sequence reactance of the shunt reactor raises the ground fault current on the unfaulted feeder during the SLG fault. This must be considered when setting the ground relays for the network primary feeders, just as when zig-zag grounding banks are installed on network dedicated primary feeders, as discussed in Primary System Grounding.
The main difference between the grounding bank and three-phase shunt reactor is that the shunt reactor has a finite positive sequence impedance. In contrast, the positive-sequence impedance of a zig-zag grounding transformer is very high, approaching infinity. For example, the positive-sequence impedance of a 1000 kVA 27 kV shunt reactor is about 729 Ohms. That of a grounding bank is basically the exciting impedance, yet the zero-sequence impedance of a grounding bank may be less than 5 Ohms, depending on design.
Impedances for Linear Circuit Analysis
This section has useful formulas for finding the impedances needed for the equivalent circuit of Figure 1. All impedances are expressed in per unit using the rated voltages and kVA of the backfeeding network transformer as the base quantities.
To find the impedance ZC for the primary feeder cables, several approaches are possible. If the total cable-charging kVAr is known, the impedance in per unit on the kVA rating of the network transformer is
(17)
$$ \ \ \ Z_{C} = 0.0 - j\frac{KVA_{T}}{KVA_{C}} \text{ per unit on network transformer rating} $$
In Eq (17):
KVAT = nameplate rating of the backfeeding network transformer in kVA
KVAC = three-phase cable-charging kVA of the entire primary feeder at the rated voltage of the primary winding of the network transformer. If the cable-charging kVAr is given at a voltage other than the rated voltage of the backfeeding network transformer, the charging kVAr is proportional to the square of the applied voltage.
An alternate method for finding ZC is to determine the total capacitance of the cable segments that make up the primary feeders, convert this to ohms, and divide by the base impedance of the backfeeding network transformer. For a shielded cable, the capacitance in microfarads per 1000 feet is:
(18)
$$ \ \ \ C_{1000-ft} = \frac{0.00736 \enspace K}{ \log_{10}{ \frac{D}{d}} } \mu F \text{ per 1000 feet} $$
In eq (18):
K = dielectric constant of the cable insulation. Representative values for K for varnished cambric, solid-type paper, cross-linked polyethylene, and ethylene propylene rubber are 5.0, 3.7, 2.3, and 3.0.
D = diameter over cable insulation
d = inside diameter of the cable insulation = D-2*insulation thickness. The units of “D” and “d” must be the same in the equations.
The total capacitance of the primary feeder is the arithmetic sum of the capacitances of all cable segments in the primary, including the main feeders and all branches. Designating the total capacitance of the primary feeders as CTOTAL-μF, the value for ZC in ohms at 60 Hz is:
(19)
$$ \ \ \ Z_{C-\Omega} = 0.0 - j\frac{ 10^6 }{377C_{Total-\mu F}} \text{ Ohms} $$
This impedance in per unit on the rating of the backfeeding network transformer is:
(20)
$$ \ \ \ Z_{C - PU} = \frac{Z_{C-\Omega}}{1000 * \frac{KV_{HV}^2}{KVA_{T}}} \text{ per unit on network transformer rating}$$
In eq (20), the term in the denominator is the base impedance in ohms, and:
KVHV = rated phase-to-phase voltage of the HV winding of the backfeeding network transformer in kV.
KVAT = nameplate rating of the backfeeding network transformer in kVA.
The impedance of the network transformer in per unit on its rating is:
(21)
$$ \ \ \ Z_{T-PU} = \frac{Z_{T ﹪}}{100} (\frac{1}{\sqrt{1 + (\frac{X_{T}}{R_{T}})^2 }} + j\frac{1}{\sqrt{1 + (\frac{R_{T}}{X_{T}})^2}}) \text{ per unit on network transformer rating} $$
In eq (21):
ZT% = backfeeding network transformer nameplate impedance in percent.
XT/RT = X to R ratio of the backfeeding network transformer.
The positive-sequence impedance of the network in Figure 1, ZS, in per unit on the rating of the backfeeding network transformer is:
(22)
$$ \ \ \ Z_{S-PU} = \frac{KVA_{T}}{ \sqrt{3} V_{TS-\phi \phi} KI_{3 \phi}} (\frac{1}{\sqrt{1 + (\frac{X_{S}}{R_{S}})^2 }} + j\frac{1}{\sqrt{1 + (\frac{R_{S}}{X_{ST}}^2)}}) \text{ per unit on network transformer rating} $$
In eq (22), the terms are:
KVAT = rating of the backfeeding network transformer in kVA.
VTS-ФФ = rated phase-to-phase voltage of the backfeeding network transformer on the secondary side (usually 216 volts, but may be 208 volts).
XS/RS = X to R ratio of the secondary network (Thevenin positive-sequence) at the location of the backfeeding network transformer.
KI3Ф = available three-phase fault current from the secondary network at the backfeeding transformer in kilo amperes when the pre-fault phase-to-phase voltage is VTS-ФФ.
Expanded Linear Circuit Analysis
With the simple linear model shown in Figure 1, where transformer magnetizing impedance were not included, relatively simple equations were developed for the network line-to-ground voltages, the line-to-ground voltages on the primary feeder, the fault path current for the SLG fault, and the currents in the backfeeding network protector. The linear analysis, used for screening purposes, can be expanded to include the effects of network transformer exciting impedances, and the effect of the shunt reactor on the primary feeder, but simple equations for phase currents and voltages do not result. Two approaches for looking at the effect of transformer magnetizing reactance, and shunt reactor will be considered.
Symmetrical Components Model
Figure 11 shows the positive-, negative-, and zero- sequence networks when there is a single backfeeding network transformer, where all impedances are in per unit on the rated voltage and kVA of the backfeeding network transformer. As before, ZS, ZT, and ZC are respectively the Thevenin positive-sequence impedance looking into the network, the network transformer leakage impedance, and the impedance representing the cable charging kVAr. Included in the positive-and negative- sequence networks are the ideal phase-shifting transformers that account for the +/- 30o degree phase shifts between the LV and HV side of the delta-wye-connected network transformer.
Added to the positive- and negative-sequence networks is impedance ZMAG, which represents the magnetizing impedance of the backfeeding transformer, and of all other network transformers on the feeder being backfed and whose protectors are open. This impedance does not appear in the zero-sequence network, because the network transformer HV windings are connected in delta. The shunt reactor, when installed, is represented in the positive- and negative-sequence networks with impedance Z1REAC and with Z0REAC in the zero-sequence network, where in general the zero-sequence reactance is less than the positive-sequence reactance. See Tables 1 and 2.
For a balanced backfeed, switch S1 in Figure 11 is open, and only positive-sequence currents and voltages exist in the system if it is perfectly symmetrical. Rigorously this is not correct, because the network transformer exciting impedances are not perfectly balanced, so there are mutual impedances between the positive-and negative-sequence networks. From the positive-sequence network, the effect of including the magnetizing impedances of the network transformers is to cancel some of the capacitive charging current of the primary cable, and lower the voltage rise during a balanced backfeed. However, on 23-, 27-, and 34.5 kV systems, where primary cable charging current can be very high, the transformer magnetizing kVA is not high enough to effectively cancel the cable-charging kVAr. For example, if there were 20,000 kVA of network transformer connected to the feeder, with the average exciting current being 0.50 %, the transformer magnetizing kVA would be only 100 kVA. This is not sufficient to prevent overvoltages in systems with long primary feeders where the capacitive charging kVAr can be in the 150 to 200 kVA per mile of cable. It is for this reason that shunt reactors are applied.

Figure 11:
Positive-, negative-,and zero-sequence networks with
backfeeding network transformer.
For the model of Figure 11, when the single line-to-ground fault is applied to the HV feeder, switch S1 in Figure 11 is closed, and the interconnected sequence networks are analyzed to find the sequence currents and voltages on the secondary side of the backfeeding transformer, and on the primary side, all in per unit. With the sequence quantities available at any point in the system, the phase quantities are found from the basic relationship.
(23)

In eq (23), V0, V1, and V2, respectively are the zero-, positive-, and negative-sequence quantities, and VA, VB, and VC are the corresponding phase quantities, and:
(24)
$$ \ \ \ a = e^{j120\degree} = - \frac{1}{2} + j \frac{\sqrt{3}}{2} $$
When the sequence networks of Figure 11 are analyzed for a balanced backfeed, and for a backfeed to a SLG fault, neglecting the effects of transformer magnetizing impedance, ZMAG, and when there is no shunt reactor, simple equations can be developed for the phase-to-ground voltages on the primary and secondary side and the network protector phase currents. The results are the equations given in Balanced Backfeed, Backfeed to SLG Fault, and Protector Currents During Backfeed to SLG Fault of this chapter, where the voltages and currents are a function of just impedances ZS, ZT, and ZC. If objectionable overvoltages do not result under these circumstances, modeling the transformer magnetizing kVA is not necessary, and shunt reactors are not required.
By including transformer magnetizing impedance, ZMAG, in the linear analysis, its effect on voltages and currents during backfeed can be found. Initially, the transformer magnetizing impedance can be represented with a constant impedance, ZMAG in Figure 11, based upon the total connected kVA of network transformers, and the nominal exciting current at rated voltage. Note from Figure 11 that transformer magnetizing impedance has no effect on the zero-sequence network. If desired, the effects of the nonlinear characteristics of the transformer magnetizing impedances can be included by use of iterative procedures. This requires that the transformer magnetization curves giving rms voltage vs rms current are available. If objectionable overvoltages still exist when transformer magnetizing impedances are included, then shunt reactors are required. The positive-and zero-sequence impedances of shunt reactors of different kVA ratings can be obtained from manufacturers of shunt reactors.
Analysis Using Phase Frame of Reference.
In this subsection is presented a model that the author has used to study in more detail the effects of transformer magnetizing impedance and the shunt reactor on the voltages during backfeed to a SLG fault. It models the system on a phase basis rather than using symmetrical components as in Figure 11. Figures 12 and 13 show the phase model for finding the currents and voltages during backfeed to a SLG fault on the primary feeder. Analysis of the model gives directly the phase-to-ground voltages in both the secondary and primary system, the currents in the network protector, and the currents in the shunt reactor when applied. With this model, it is possible to look at the effect of blown fuses in the protector backfeeding the SLG fault, or during a balanced backfeed.
Figure 12 shows the model for the secondary system and the backfeeding network transformer. All impedances are in ohms, and all voltages and currents are in volts and amperes respectively At the network bus, the secondary system is represented with the positive-sequence impedance in each phase, Z1, and in the neutral path an equivalent impedance equal to (Z0 – Z1)/3, where Z0 is the zero-sequence impedance of the network at the network bus (backfeed location). Between the network bus in Figure 12 and the terminals of the network transformer, there are two tie circuits, Tie Circuit 1 and Tie Circuit 2, on opposite sides of the network protector to allow modeling of a separately mounted network protector.
Each tie circuit is represented with a series impedance inserted in each phase, and mutual impedances between phases. For example, for Tie Circuit 1, the series impedances are ZAATC1, ZBBTC1, and ZCCTC1, and the mutual impedances are ZABTC1, ZBCTC1, and ZACTC1. These impedances can be found with classical methods whether the tie circuit uses phase-grouped configuration, or phase isolated configuration. The network transformer is represented with impedance ZT in each phase in ohms referred to the secondary, and ideal transformers having a turns ratio of N to 1, or the ratio of the rated phase-to-phase voltage on the HV side, to the rated phase-to-neutral voltage on the low-voltage side.

Figure 12:
Phase model for secondary system and the backfeeding
network transformer.
In Figure 12, the fuses in the network protector are located between tie circuit 1 and tie circuit 2. The fuses are modeled as a resistor, having zero resistance when unblown, and a resistance approaching infinity when blown. This allows simulating the backfeed, balanced or with a SLG fault, without blown fuses in the protector, or with a blown fuse in one or more phases.
Figure 13 shows the model for the primary feeder, which includes the magnetizing impedances of all transformers on the feeder, the capacitive reactance to ground on each phase, and the model for either the shunt reactor or a grounding transformer. Further, there is a single line-to-ground fault on primary phase A, with the current in the fault path being IFA in amperes.

Figure 13:
Phase model for primary feeder, transformer magnetizing
kVA, primary cable capacitance, and shunt reactor or grounding bank.
The primary feeder between the HV terminals of the network transformer and the fault location has positive-sequence impedance Z1P, and zero-sequence Z0P, both in ohms. The primary feeder is broken into two segments, one from the HV terminals of the backfeeding network transformer, being “K” per unit of the total length, and the second segment being of length “(1-K) per unit to the fault point.
The magnetizing kVA of the backfeeding network transformer and all network transformers on the feeder whose protectors are open is represented with impedance ZM in ohms, which is found from the total kVA of network transformer on the feeder and assuming a rated voltage exciting current, IE, in percent. An X to R ratio must be assumed for the magnetizing impedances. In the model the exciting impedances are connected to the feeder at a per unit distance of “K” from the backfeeding transformer, so the impedance from HV terminals of the transformer to the capacitances to ground is “KZ1P as shown in Figure 13.
The capacitance to ground of the primary cable is represented with impedances ZC, also connected to the primary feeder at the same point as the equivalent magnetizing impedances. In reality the capacitance is distributed along the feeder, and the magnetizing impedances are also distributed along the feeder. But since the feeder voltage to ground doesn’t change that much during a balanced backfeed, or a backfeed to a SLG fault, the model is more than adequate.
Shunt Reactor or Grounding Bank
The shunt reactor is represented with impedance ZG connected from each phase-to ground (neutral) and mutual impedances ZGM between phases as shown in Figure 13.
(25)
$$ \ \ \ Z_{G} = \frac{2Z_{1R} + Z_{0R}}{3} \text{ Ohms} $$
(26)
$$ \ \ \ Z_{GM} = \frac{Z_{0R} - Z_{1R}}{3} \text{ Ohms} $$
In these equations:
Z1R = Positive-sequence impedance of the shunt reactor in ohms
Z0R = Zero-sequence impedance of the shunt reactor in ohms
Between the shunt reactor and the SLG fault on primary phase “a’ is the phase impedance (1-K)*Z1P, and in the neutral path is the impedance (1-K)*(Z0P – Z1P)/3.
With the impedances in the models of Figure 12 and 13, the circuit can be analyzed by writing loop voltage equations, and solving simultaneously for the currents and voltages on both the secondary and primary side of the backfeeding network transformer.
Results of Example Calculation
This sub-section presents the result of calculations to show the effect of shunt reactors on the network voltages at the backfeed location. With reference to the model in Figure 12, it is assumed that the lengths of tie-circuit 1 and tie-circuit 2 are zero, so in effect the backfeeding network protector is throat connected to the network transformer. Pertinent Data are:
LV Network:
20 kA. X/R = 2.0
Open circuit voltage = 208 V Ф-Ф = 120.1 V Ф-N
Backfeeding Network Transformer
500 kVA, 5%Z, X/R =8, 216Y to 26,400 Delta
Primary Feeder Connected Network Transformer Capacity
12,500 kVA, IE = 0.45%, X/R = 0.74
Primary Feeder Charging kVAr
1200 kVAr @ 26.4 kV
Primary Feeder Series Impedance
Z1P = 0.31 + j0.35 Ohms
Z0P = 2.20 +j0.72 Ohms
Per Unit Distance to Capacitance and Shunt Reactor
K = 0.50 per unit
Table 3 gives the phase-to-ground voltages at the terminals of the backfeeding network transformer/protector during backfeed to the SLG fault on phase A. Values are given when there is no shunt reactor, and with three different shunt reactors as indicated in the third, fourth, and fifth column of the table.
Table 3:
Network phase-to-ground voltages during backfeed to SLG
fault, without and with shunt reactors, 20 kA available from network.
| Phase | Network Phase-to-Ground Voltage (Volts) | |||
|---|---|---|---|---|
| No Reactor | 600 kVAr 50% Z0 |
1000 kVAr 62.5% Z0 |
1000 kVAr 50% Z0 |
|
| A | 239.9 | 128.4 | 112.5 | 105.4 |
| B | 157.9 | 128.4 | 116.9 | 112.8 |
| C | 140.1 | 128.4 | 122.1 | 122.1 |
Clearly, from Table 3, the overvoltages during backfeed without a shunt reactor are excessively high, and could damage equipment in the LV system. But when the reactor is added, especially the 1000 kVAr reactor, voltages at the backfeeding protector do not exceed the upper limit of range “A” given in ANSI C84.
If instead the available three-phase fault current from the network were 50 kA rather than 20 kA, the network phase-to-ground voltages at the backfeeding network protector are those given in Table 4. From the second column, the voltages at the backfeeding protector without a shunt reactor are significantly lower than when the available fault current from the network is 20 kA, but they are still above the upper limit of ANSI C84 range “A”
From the last three columns of data in Table 4, the shunt reactors keep the voltages at the backfeeding network protector below the upper limits of range “A” in ANSI C84.
Table 4:
Network phase-to-ground voltages during backfeed to SLG
fault, without and with shunt reactors, 50 kA available from network
| Phase | Network Phase-to-Ground Voltage (Volts) | |||
|---|---|---|---|---|
| No Reactor | 600 kVAr 50% Z0 |
1000 kVAr 62.5% Z0 |
1000 kVAr 50% Z0 |
|
| A | 157.6 | 123.3 | 116.9 | 113.7 |
| B | 139.4 | 123.3 | 118.7 | 116.9 |
| C | 127.5 | 123.3 | 120.9 | 120.9 |
Higher Voltage Primary Feeder Spot Networks
In the early 1950’s, the Consolidated Edison Company of New York considered supplying a four-unit spot network with 2000 kVA network transformers from 69 kV pipe-type gas-filled cables. One concern with using the higher-voltage primary feeders was overvoltages during backfeed with the primary feeder breaker open. Westinghouse performed studies with an analog computer (ANACOM) to determine if excessive overvoltages would exist on the 465-volt bus in the spot network during backfeed. The study showed that the overvoltages on the spot network bus and on the 69 kV primary feeder were excessively high due to the high charging kVAr of the 69 kV cable.
Figure 14 is the cover of the report prepared on the studies. The 69 kV primary feeders were never used for the spot network supply, due to high overvoltage during backfeed.

Figure 14:
Cover of 1955 report that investigated overvoltages
during backfeed with 69 kV primary feeders.
Impact of Arcing Ground Faults on Network Primary Feeder During Backfeed
In previous sections of this chapter, equations were presented for the steady-state voltages and currents for the single line-to-ground (SLG) fault on the primary, where the SLG fault is bolted (zero-impedance in the fault path, no arcing). When the backfeed is from the delta-connected winding of one or more network transformers, whose network protectors have failed to open, the SLG fault is on an ungrounded primary system.
The technical literature contains many papers and articles on SLG faults on ungrounded primary systems, typically 15-kV class, that have been applied in industrial facilities. Through various mechanisms, it has been shown that if the SLG fault is arcing in nature, where the low-current arc extinguishes at a current zero, and then restrikes, extinguishes at another current zero, restrikes, with the cycle repeating until de-energized, there can be an escalation in the magnitude of the phase-to-ground voltages on the unfaulted and faulted phases. With the arcing ground fault, the voltages can be much higher than those which occur when the SLG fault is bolted. When the arcing ground fault persists in the ungrounded system, it can result in insulation failure of other equipment especially those with lower-voltage withstand, such as dry-type transformers and medium-voltage motors. It is for this reason that ungrounded medium-voltage systems are infrequently used, and are not recommended by most practitioners. Either high-resistance grounding or low-resistance grounding is selected.
The interconnected sequence networks of Figure 15 can be used to explain the basic mechanism whereby the arcing ground fault causes an escalation of the overvoltages. In (a), the SLG fault current is flowing as switch S1 is closed, and it deposits a charge on the zero-sequence capacitance, shown as V0 in red. If the arc in the fault path extinguishes at a current zero, simulated by opening of switch S1 as in (b), it leaves a trapped charge on the zero-sequence capacitance, shown as V0 in green. If the arc restrikes, the switch S1 in (b) is closed, and with a trapped charge on the zero-sequence capacitance, this can increase the voltage on the zero-sequence capacitance as shown in (c). This process can result in phase-to-ground voltages which are 3 or 4 times normal during the arcing ground fault.

Figure 15:
Interconnected sequence networks for the single
line-to-ground arcing fault.
With high transient voltages occurring on the primary feeder during backfeed to the arcing single line-to-ground fault, these voltages are applied to the delta-connected HV winding of the network transformers whose network protectors are open. And this results in high transient voltages from phase-to-ground on the secondary side of the network transformers whose protectors are open.
Impact on Network Protector Microprocessor Relays
There have been failures of microprocessor network protector relays in open network protectors following backfeed to SLG faults on the primary, which could have been arcing in nature. It is believed that some of the failures may have been due to the high transient overvoltages from the arcing ground faults on the primary. There is some evidence that the failures are more common in microprocessor relays used in 216-volt network protectors than in relays in 480-volt protector. One possible explanation for this is that in 216-volt network protectors, the microprocessor relay is connected directly to the power buses in the protector, but in the 480-volt protector the relay is connected to the secondary side of relay auto-transformers. With the relay on the secondary side of the relay auto-transformer, the energy that the surge suppression devices in the microprocessor relay must absorb during an arcing fault on the primary feeder is much less than in 216-volt applications, and failure is less likely.
Controlling Overvoltages From Arcing Ground FaultIs On Primary Feeder
In industrial ungrounded power systems, to eliminate voltage escalation from arcing ground faults, frequently the systems are operated as high-resistance-grounded systems, or as low-resistance grounded systems. With reference to Figure 15 (b), with high-resistance grounding, resistance is placed into just the zero-sequence network, in parallel with XC0. With resistance in parallel with XC0, when switch S1 is open as in Figure 15 (b) to simulate extinction of the arc, the trapped charge on the zero-sequence capacitance discharges through the resistance, thereby preventing the buildup of high voltage when the arc restrikes. With the high resistance grounded medium-voltage system, frequently the system is not de-energized for the SLG fault, until an opportune time that the system can be shut down without adverse effect on the processes being performed in the system.
In power plants where large generators are unit connected to the transmission system with a generator step-up transformer, with the generator connected to the delta winding of the step-up transformer, high-resistance grounding is used for the generator, to limit ground fault current and control the overvoltages.
The other option for preventing overvoltages in industrial systems is to use low-resistance grounding. In these systems, the grounding is selected such that the current for the SLG fault is high enough to operate ground relays, or if fuses are used, to blow fuses. So, unlike the ungrounded and resistance grounded systems which may remain energized for the SLG fault, in the low-resistance grounded system the faulted portion is de-energized by breaker tripping or fuse blowing.
The network primary feeder operates 99.99+ % of the time as a grounded system (feeder breaker at substation closed), and with delta-wye connected network transformers as an ungrounded system only when the primary feeder breaker is open and one or more network protectors are closed. With a stuck-closed protector, there have been incidents where it is known that the initial fault on the primary feeder was a SLG fault, resulting in opening of the feeder breaker. Before the backfeed could be cleared, a second ground fault occurred on a different primary phase of the faulted feeder at a different location. It can be hypothesized that one reason for this is that, if the first ground fault is arcing in nature, the voltages from the unfaulted phases to ground after the breaker for the faulted feeder opens, can be much higher than those for the bolted SLG fault. The high overvoltages associated with the arcing ground fault cause dielectric failure of cable, cable splices, terminations, or a network transformer at another location. Unfortunately, it appears that no tests or studies have been conducted on this phenomenon in network systems during backfeeds, but the high overvoltages from the arcing ground fault most likely are accountable for a second failure, occurring after the breaker for the faulted feeder opens.
The author has investigated applying high-resistance grounding on network primary feeders with delta-wye connected network transformers to limit overvoltages during backfeed to the arcing SLG fault. This has shown that grounding resistors, applied with wye-delta connected grounding transformers, with the resistor in the broken delta secondary, can be sized to prevent the escalation of overvoltages during backfeed to the SLG fault. Single-phase distribution transformers of standard rating can be used for the grounding bank in many applications. As long as all network protectors open without time delay during backfeed to the SLG fault, the grounding resistor thermal limits will not be exceeded.
But if a network protector fails to open, the fuses in the backfeeding network protector will not protect the grounding resistor. If it were not for this concern, applying high-resistance grounding on dedicated network primary feeders would be feasible and effective in preventing high transient overvoltages from arcing ground faults during backfeed.
In contrast, in network systems with dedicated primary feeders having network transformers with the grounded-wye connections for both the HV and LV windings, the primary feeder remains effectively grounded during backfeed to the SLG fault. Under these conditions, conventional wisdom is that the overvoltages produced during backfeed to the SLG fault will be no higher than when the primary feeder breaker at the substation is closed. Also, with the grounded-wye connections for primary and secondary windings of the network transformers, the backfeed current in a stuck-closed network protector are high enough to blow the protector fuses in the faulted phases.
4.9 - Secondary Grid Design Considerations
SECONDARY GRID DESIGN CONSIDERATIONS
This chapter provides information to help plan and design the low-voltage portions of the grid (area) network. Included are materials on phase-isolated and phase-grouped cable circuit sequence impedances, required capacity of secondary mains, currents needed to burn clear solid faults when cable limiters are not used, cable limiter time-current characteristics and cable insulation damage curves, currents for bolted and arcing faults, measures to increase fault currents to help in blowing of cable limiters, and a discussion of why faults in secondary cable circuits may result in fires, even when cable limiters are applied extensively in the low-voltage grid.
Cable Configurations
In secondary networks, insulated low-voltage cables are used for:
-
Connecting the network transformer/protector (phases and neutral) to either rigid bus, moles, crabs, or ring buses in the transformer/protector vault or in adjacent manholes.
-
Connecting the customer’s service entrance equipment to either rigid buses, moles, crabs, or ring buses in manholes or transformer/protector vaults, or directly to the network protector terminals in transformer/protector vaults.
-
The secondary main circuits that are connected to rigid bus bars, cable bus, moles, crabs, ring buses, and in some situations to the network protector terminals.
-
Connecting the low-voltage terminals of the network transformer to the network protector (phases only) when the network protector is mounted separately from the network transformer.
These connections are made with either single or multiple cables per phase, with either a full-size or reduced size neutral. As discussed in Backfeed Currents for Primary Feeder Faults, use of a reduced size neutral connection to the network transformer X0 bushing can result in neutral conductors overheating during backfeed to the double line-to-ground (DLG) fault should a protector fail to open. figure 1 shows three basic configurations for low-voltage cable circuits with multiple cables per phase.
The configurations in figure 1 have four cables per phase, the number used by some utilities when connecting a 500/560 kVA network transformer/protector to the secondary in a manhole adjacent to the transformer vault. figure 2 shows a layout where multiple cables per phase connect the network transformer/protector in a transformer vault to a bus in an adjacent manhole. Such circuits are sometimes referred to as “vault tie circuits”.
With phase-grouped cable configurations as at the top of figure 1, one cable per phase and a neutral cable are placed in each duct. The neutral cable is either the same size as the phase cables (full size) or reduced size, being either bare or insulated. For the layout shown in Figure 2, where the network transformer/protector is connected to an adjacent vault, bus hole/manhole, reduce size neutrals should not be used as they may overheat and burn during backfeed to the DLG faults should the network protector fail to open.

Figure 1:
Phase-grouped and phase-isolated configurations four
cables per phase.

Figure 2:
Vault tie circuit between transformer/protector vault and
adjacent manhole.
Some phase-grouped arrangements will place one insulated cable from each phase and an insulated neutral inside a duct. Another configuration used for secondary mains is shown in figure 3, where there are three insulated phase cables, but two reduced size bare copper neutral conductors. For example, the phase conductors are 500 kcmil copper, and each neutral is 4/0 copper. Having two reduce-size neutrals has virtually no effect on the positive-sequence impedance of the phase grouped cable circuit. However, with two reduced size neutrals, the zero-sequence impedance is lower than with the full-size insulated neutral, due primarily to the lower zero-sequence reactance with the two smaller neutrals. The difference is quantified later.
With the phase isolated configuration shown in the middle of figure 1, the cables for each phase are in the same duct, and all cables for the neutral path are in the same duct. One utility utilizes the phase isolated configuration for ties from the network transformer to the compartment with the separately-mounted network protector, with either rigid bus bar for the neutral, or else multiple cables per phase depending on the circumstances. With the phase isolated configuration, the neutral may be either full-size or reduced size. When there are more than four cables per phase with the phase isolated configuration, two ducts may be required for each phase, or a total of eight ducts for the circuit. The sequence impedances of circuits with this configuration are considered later in Phase Isolated Circuits with Two Ducts Per Phase and Neutral
Whether cable or bus is used for the neutral with the phase isolated configuration, nonmetallic ducts are required to avoid heating that would occur with metallic ducts. Also, as with phase-grouped configurations, phase isolated tie circuits between a network transformer vault and adjacent manhole should have a full size neutral to avoid overheating during backfeed to the DLG fault on the primary feeder if the backfeeding network protector fails to open.
At the bottom of figure 1, the phase cables have the phase grouped configuration, but the neutral cables are placed in a separate duct. With this arrangement, the neutral path can be either full-sized or reduced size, with the neutral cables occupying one or more ducts. Metallic ducts must not be used for phase isolated neutral cables to avoid the possibility of duct heating from zero-sequence currents, either at fundamental frequency or at harmonic frequencies.

Figure 3: Phase-grouped cables with two bare reduced-size neutral
conductors.
Cable Circuit Impedances
The sequence impedances of low-voltage cable circuits are needed for system modeling in load-flow programs under normal and contingency conditions, and for modeling the system in short-circuit programs. For balanced load-flow studies, and when calculating currents for three-phase faults, only positive-sequence impedances are needed. But to calculate currents for single line-to-ground (SLG) faults in the secondary system, or the currents for faults on the primary feeder with blown fuses in the backfeeding network protector, both the positive-and zero-sequence impedances are required.
Table 1 compares qualitatively the positive-and zero-sequence impedances of low-voltage cable circuits with the configurations shown in figure 1. Given in the fifth column of Table 1 is a qualitative comparison of the magnetic fields produced by the different cable configurations. Magnetic field external to the circuit are high with the phase isolated configurations.
Table 1:
Qualitative Comparison of Low-Voltage Cable Configurations
ROW # |
CABLE CONFIGURATION |
POSITEVE- SEQUENCE IMPEDANCE |
ZERO- SEQUENCE IMPEDANCE |
EXTERNAL MAGNETIC FIELDS |
|---|---|---|---|---|
| 1 | Phase-grouped with full-size neutral | Lowest | Lowest | Low |
| 2 | Phase-grouped with reduced-size neutral | Lowest | Low | Low |
| 3 | Phase-isolated with full-size neutral | High | High | High |
| 4 | Phase-isolated with reduced-size neutral | High | Highest | High |
| 5 | Phase-grouped with isolated reduced-size neutral | Lowest | High | Low for positive-sequence currents, high for zero-sequence currents |
The positive-sequence impedance of a low-voltage cable circuit, with cables of a given size, is lowest when the cables are phase grouped, as in the top and bottom configurations in figure 1 (rows 1, 2 and 5 of Table 1). The size or number of neutral conductors affects the positive-sequence impedance only if the position of the neutral cables affects the spacing between the phase cables. With the phase-isolated configuration, as in the middle of figure 1, the positive-sequence impedance of the circuit is significantly higher than with the phase-grouped configuration, due to the wider separation (higher reactance) between phases. Thus, the X to R ratio of the positive-sequence impedance of circuits with phase-isolated configuration is much higher than that of circuits with the phase grouped configuration. For this reason, when two circuits are paralleled between the same two points (buses), they should be of the same type. If one circuit were phase isolated, and one were phase grouped with the same number of conductors per circuit, the phase-grouped circuit carries a disproportional amount of the total current between the two points.
One situation where it is acceptable to have both phase-isolated and phase-grouped circuits connected to the same bus is shown in figure 4. Here there are four network units, each in a separate vault, supplying a low-voltage paralleling bus in a bus compartment. The circuit from each outermost transformer/protector to the bus is greater in length than that from each of the innermost transformers to the bus. To help obtain an equal or nearly equal load division in the four network transformers, the phase-grouped configuration (lower impedance per unit length) is selected for the longer connections between the two outermost transformers and the bus. The phase isolated configuration (higher impedance per unit length) is selected for the shorter connection between the innermost transformers and the bus.
The particular multibank installation in figure 4 also has
cable ties to the street network/adjacent vaults, such ties having the
capacity of a fifth network transformer. With this tie circuit capacity,
the load that can be supplied from the bus compartment during a double
contingency corresponds to the rating of three network transformers.
The zero-sequence impedance of low-voltage cable circuits is lowest with the phase-grouped configuration shown at the top of figure 1 (Rows 1 and 2 in Table 1). With the neutral cable for each set of cables in close proximity to the phase conductors, the zero-sequence return current in the neutral is close to the outgoing zero-sequence current in the three phase conductors, resulting in a low zero-sequence reactance. In contrast, with the phase-isolated configuration shown in the middle of figure 1, or with the phase-grouped configuration with the neutrals in a separate duct as at the bottom of figure 1, the neutral return path for the zero-sequence current is far from the phase conductors, and the zero-sequence reactance can be quite high. Regardless of the configuration, phase isolated or phase-grouped, employing a reduced size neutral rather than a full-sized neutral, will increase the zero-sequence impedance.

Figure 4:
Multi-bank installation utilizing both phase-grouped and
phase-isolated circuits for connections from the network protectors to
the paralleling bus in the bus compartment.
Sequence Impedances of Phase-Grouped Cables
The positive- and zero-sequence impedances of phase-grouped cables in nonmagnetic duct can be found with classical equations used for overhead circuits. The results of such calculations are in close agreement with the impedances determined from measurements on actual circuits in nonmetallic ducts (Brieger 1938). Equations are given for circuits, operating at 60 HZ, made with both nonleaded and lead-sheath low-voltage cables. Most operators of secondary networks install low-voltage cables with only copper conductors. In the past, some aluminum conductor low-voltage cables were installed (Xenis 1966), but over time corrosion problems and problems with terminations developed, resulting in discontinued use of aluminum conductors for secondary network LV circuits. figure 5 is a picture of aluminum cable that failed in service.

Figure 5:
Remains of aluminum conductor cable removed from service
(courtesy National Grid)
Nonleaded Cables
figure 6 shows a single set of phase-grouped cables in a duct, defining the spacing from conductor center to conductor center. Although shown as full size, the insulated neutral may be smaller than the phase conductors, and it may be bare. With the center-to-center spacings, and the ac resistance and the geometric mean radius of the phase conductor and neutral conductor, the positive- and zero-sequence impedances can be found from the equations given in this section. The equations assume that the same size cable is used for each phase, but the neutral conductor can be a different size. Further, the equation for the zero-sequence impedance assumes that all zero-sequence current for the LV circuit returns in the neutral conductor.

Figure 6:
Distances between conductor centers with phase-grouped LV
cables.
The positive- and zero-sequence impedances for one set of phase-grouped cables are given by eq. (1) and eq (2) respectively.
(1)
$$ \ \ \ Z_{1} = R_{\phi} + j0.0529 \log{\frac{GMD_{\phi}}{GMR_{\phi}}} \Omega /1000 \text{ ft} $$
(2)
$$ \ \ \ Z_{0} = R_{\phi} + 3R_{N} + j0.1588 \log{\frac{GMD_{\phi N}^2}{GMR_{N} \sqrt[3]{GMR_{\phi} GMD_{\phi}^2}}} \Omega /1000 \text{ft} $$
In these equations, the terms are defined as follows:
(3)
$$ \ \ \ GMD_{\phi} = \sqrt[3]{d_{AB} d_{BC} d_{AC}} $$
(4)
$$ \ \ \ GMD_{\phi N} = \sqrt[3]{d_{AN} d_{BN} d_{CN}} $$
GMD stands for “geometric mean distance”, giving the geometric mean distance between the centers of the three phase conductors (GMDϕ) or between the centers of the three-phase conductors and the neutral conductor (GMDϕN). Other terms appearing in the equations are:
Rϕ = Resistance of phase conductor(Ω/1000 ft)
RN = Resistance of neutral conductor (Ω/1000 ft)
GMRϕ = Geometric mean radius of phase conductor (inch)
GMRN = Geometric mean radius of neutral conductor (inch)
dij = Distance between centers of conductors i and j (inch)
The resistance and geometric mean radius of the phase conductors and neutral conductor are found from conductor data tables. These tables frequently give the resistance as a function of conductor temperature and frequency, and the geometric mean radius is a function of conductor stranding. Because conductor resistance is a function of conductor temperature, the user must decide what temperature is to be used as the basis for the resistance in the impedance calculations.
Eqs (1) and (2) reveal that both the positive-sequence reactance and the zero-sequence reactance are affected by the geometric mean distances, which in turn, are determined by the position of the cables in the duct. In the real world, the position is not known and will change along the length of the circuit within the duct line. To show the sensitivity of the sequence impedance (reactance) to cable configuration within the duct, the three configurations of figure 7 are considered.

Figure 7:
Possible cable positions within duct with full-size
neutral.
Assuming a 4-inch duct, and 500 kcmil copper cables with the parameters listed below, the positive- and zero-sequence impedances for each configuration in figure 7 are given in Table 2. Listed at the bottom of the table is the average for both the inductive part and magnitude of the impedance.
Cable outside diameter = 1.08 inch
Conductor resistance = 0.02468 Ω/1000 ft
Conductor GMR = 0.312 inch
The difference between the magnitude of the smallest and largest positive-sequence impedance, relative to the smallest, is 13.8%. This difference for the zero-sequence impedance is 21.3%. The data in Table 2 show that the zero-sequence impedance with full size neutral, using the average values, is about 3.8 times the positive-sequence impedance. Practically, this has two important effects.
-
If a single phase-to-neutral fault occurs in the low-voltage secondary at a point where the Thevenin impedance at the fault point is due mainly to cable circuit impedance, the current for the bolted phase-to-neutral fault will be only 52% of that for the bolted three-phase fault (for cable data in Table 2). With the fault at the low-voltage terminals of the network transformer, the current for the phase-to-neutral fault could be as high as or slightly greater than that for the three-phase fault (with delta wye-grounded connections for the network transformer). Consequently, for the phase-grouped configuration for the low-voltage network cables, the currents for the bolted single phase-to-neutral faults lie between about 50% and 105% of those for the three-phase fault at the same location.
-
As discussed in Backfeed Currents for Primary Feeder Faults, should a network protector fail to open for backfeed to a three phase-to-ground or a double line-to-ground fault, the backfeed current is
not affected by the zero-sequence impedance of the network in symmetrical systems (delta wye-grounded network transformers). However, after the first network protector fuse blows, the zero-sequence impedance of the LV network can result in a significant reduction in the backfeed current for the double line-to-ground fault on the primary feeder.
When a set of phase-grouped cables has two bare neutrals rather than one insulated neutral conductor as shown in figure 8, the sequence impedances can be calculated with simple equations if the neutrals are assumed to be located as shown in the figure. The positive-sequence impedance is calculated with eq (1) and the zero-sequence with eq.(5). Rigorously, with two neutrals in the circuit, the positive-sequence will be slightly higher than the phase conductor resistance, due to currents induced into the two parallel neutral conductors, but practically the positive-sequence resistance and reactance are not affected by the induced currents in the two bare neutral conductors.
Given in the last row of Table 2 are measured values for the positive-and zero-sequence impedances of phase-grouped cables (500 kcmil phase and neutral) in non-metallic duct, from tests run by Consolidated Edison Company, as reported in a paper presented in February of 1938 at the EEI Transmission and Distribution Committee meeting in Louisville KY. There is good agreement with the average values from the calculations given in orange. The significance of this is that the values calculated with classical equations are in good agreement with measured values.
Table 2:
Positive- and zero-sequence impedances for Cable
Configurations in figure 7
CONFIG- URATION |
POSITIVE- SEQUENCE | ZERO-SEQUENCE | ||||
|---|---|---|---|---|---|---|
R (Ω/1000 ft) |
X (Ω/1000 ft) |
Z (Ω/1000 ft) |
R (Ω/1000 ft) |
X (Ω/1000 ft) |
Z (Ω/1000 ft) |
|
| CONFIG 1 | 0.0247 | 0.03505 | 0.0429 | 0.0987 | 0.1010 | 0.141 |
| CONFIG 2 | 0.0247 | 0.02854 | 0.0377 | 0.0987 | 0.1394 | 0.171 |
| CONFIG 3 | 0.0247 | 0.03270 | 0.0410 | 0.0987 | 0.1057 | 0.145 |
| AVERAGE | 0.0247 | 0.0321 | 0.0405 | 0.0987 | 0.115 | 0.152 |
| FIELD MEASUREMENTS | 0.0236 | 0.0320 | 0.102 | 0.107 | ||
(5)
$$ \ \ \ Z_{0} = R_{\phi} + \frac{3}{2} R_{N} + j0.1588 \log{\frac{\sqrt[3]{d_{AN1}^4 d_{AN2}^2}}{\sqrt[3]{GMR_{\phi} OD_{\phi}^2} \sqrt{GMR_{N}d_{N1N2}}}} \Omega/1000 \text{ ft} $$
Figure 8:
Cable circuit with two bare reduced size neutrals
In eq (5), the terms are defined as follows:
Rϕ = Resistance of phase conductor (Ω/1000 ft)
RN = Resistance of each neutral conductor (Ω/1000 ft)
GMRϕ = Geometric mean radius of phase conductor (inch)
GMRN = Geometric mean radius of each neutral conductor (inch)
ODϕ = Outside diameter of phase cable (inch)
dij = Distance between the centers of conductors i and j (inches). These are determined from the outside diameter of the insulated phase cables and the outside diameter of the bare neutral conductor
With the configuration of figure 8, the zero-sequence impedance can be les than that with a full-size neutral due to the lower zero-sequence reactance. For example, when the phase conductors are 500 kcmil copper, with the parameters given before, and the two neutrals are 4/0 copper (RN = 0.05739 Ω/1000 ft, GMRN = 0.1895 inch, ODN = 0.522 inch, ODϕ = 1.08 inch), the spacings between conductor centers are:
dAN1 = 0.801 inch
dAN2 = 1.5269 inch
dN1N2 = 1.5647 inch
Placing these values into eq (5) gives the zero-sequence impedance with 500 kcmil phase cables and two bare 4/0 neutrals. The results of evaluating eq (5) are given in the first row of Table 3. Given in the second row of data in the table is the calculated average value for the zero-sequence impedance when there is a full size neutral, as taken from Table 2.
Table 3:
Zero-sequence impedance with two 4/0 copper neutrals and a
full-size neutral with 500 kcmil phase cables.
| Neutral Arrangement | Zero-Sequence Resistance (Ω/1000 ft) |
Zero-Sequence Reactance (Ω/1000 ft) |
|---|---|---|
| Two 4/0 | 0.111 | 0.0642 |
| One 500 kcmil | 0.102 | 0.115 |
From the data in Table 3, the zero-sequence reactance with the two 4/0 neutrals is significantly lower than with the full size neutral. But the zero-sequence resistance with the two 4/0 neutrals is higher than that with the full size 500 kcmil neutral.
Impedances of Multiple Sets of Phase Grouped Cables
When phase-grouped cables are used for secondary mains, or for tie circuits between adjacent vaults and manholes, frequently there are multiple sets. When performing a power flow or short-circuit study, each set of cables can be represented as a separate branch, or they can be combined into a single branch. For practical purposes, when the positive-and zero-sequence impedances of a single set of phase-grouped cables (three phase cables and neutral in the same duct), the positive-and zero-sequence impedances of a circuit made with more than one set of cables in parallel and of equal length, can be found with the following equations.
(6)
$$ \ \ \ Z_{1 - MULTIPLE} = \frac{Z_{1 - ONE SET}}{\text{NUMBER OF SETS}} $$
(7)
$$ \ \ \ Z_{0 - MULTIPLE} = \frac{Z_{0 - ONE SET}}{\text{NUMBER OF SETS}} $$
In these equations:
Z1-ONE\ SET = Positive-sequence impedance of one set of phase-grouped cables.
Z0-ONE\ SET = Zero-sequence impedance of one set of phase-grouped cables.
When the neutral conductors are not in the same duct as the phase cables, as for the configuration in the bottom row of figure 1, eq (6) still applies for the positive-sequence impedance of multiple sets. But eq (7) is not applicable for the zero-sequence impedance of multiple sets of cable. Software must be used to find the zero-sequence impedance for this arrangement.
Lead Sheath Cables.
Today, most system operators are not installing low-voltage cables with lead sheaths, but there are numerous installations with this type of cable still in service. figure 9 shows six sets of phase-grouped lead-sheath cables in a tie circuit from a vault with the network transformer and protector to an adjacent manhole in the street. The neutral conductor in each set is leaded copper, and is of reduced size.

Figure 9:
Six sets of phase-grouped lead-sheath LV cables with
reduced size neutral (photo by author).
When the phase-grouped cables have a lead sheath, the sheath affects not only the zero-sequence impedance, but also the positive-sequence impedance. If it is assumed that the three phase cables are in contact with one another with their centers at the vertices of an equilateral triangle, as in figure 10, and further assumed that the neutral conductor spirals around the phase conductor such that, over the length of the circuit, the average distance from the center of the neutral conductor to the center of each phase cable is the same, then equations for the self-sequence impedances can be developed.

Figure 10:
Phase-grouped lead sheath cables with separate neutral
conductor.
In developing the equations, it is further assumed that the separate neutral conductor is bonded to the lead sheaths of the three phase cables at both ends of the circuit.
The positive-sequence impedance, Z1, has a resistive component, R1, and a reactive component, X1, as shown by eq (8).
Eq (9) gives the resistive component, R1, in Ohms per 1000 feet, and eq (10) gives the reactive component, X1, in Ohms per 1000 feet.
(8)
$$ \ \ \ Z_{1} = R_{1} + jX_{i} \enspace \Omega/1000 \text{ ft} $$
(9)
$$ \ \ \ R_{1} = R_{\phi} + \frac{R_{S}(0.0529 \log{\frac{OD}{GMR_{S}}})^2}{R_{S}^2 + (0.0529 \log{\frac{OD}{GMR_{S}}})^2} \Omega/1000 \text{ ft} $$
(10)
$$ \ \ \ 0.0529 \log{\frac{OD}{GMR_{\phi}}} - \frac{(0.0529 \log{\frac{OD}{GMR_{S}}})^2}{R_{S}^2 + ( 0.0529 \log{\frac{OD}{GMR_{S}}})^2} \Omega/1000 \text{ ft} $$
In these equations, Rϕ and GMRϕ are the resistance and geometric mean radius of the phase conductor as defined before, and the geometric mean radius of the lead sheath is:
(11)
$$ \ \ \ GMR_{S} = \frac{OD}{2} - t_{j} - \frac{t_{S}}{2} $$
Where:
GMRS = Geometric mean radius of the lead sheath in inches.
OD = Outside diameter of phase cable in inches
tJ = Thickness of the outer jacket on the phase cable in inches = 0.0 if no outer jacket
tS = Thickness of the lead sheath on the phase cables in inches
RS = Resistance of the lead sheath on one phase cable in Ω per 10000 feet
Eq. (9) shows that the effect of the lead sheath on the phase cables is to make the positive-sequence resistance, R1, higher than the resistance of the phase conductor, Rϕ, which is the positive-sequence resistance in absence of the lead sheath. Eq (10) shows the effect of the lead sheath on the positive-sequence reactance, X1, is just the opposite of the sheaths effect on the positive-sequence resistance, making the reactance, X1, less than the positive-sequence reactance when the phase cables do not have a lead sheath. Note that the first term on the right-hand side of eq (10) is the positive-sequence reactance if the lead sheaths were not present.
The reasons for these effects on the positive-sequence resistance and reactance is that with balanced (positive-sequence) currents in the three phase conductors, balanced currents are induced into the three lead sheaths. The induced currents in the lead sheaths create I2R losses in the sheaths, which are reflected back to the phase conductors via transformer action. That is, the bonded lead sheaths, with balanced currents in the phase conductors, are analogous to a shorted secondary winding on a transformer. The resistance looking into the primary winding of a transformer with the secondary winding shorted is the resistance of the primary winding plus the resistance of the secondary winding reflected to the primary side. For the cable circuit, the positive-sequence resistance looking into the phase conductors is Rϕ, plus the reflected resistance of the lead sheaths, which is represented by the second term on the right-hand side of eq (9). Considering the positive-sequence reactance, the induced currents in the three-lead sheaths, with positive-sequence currents in the phase conductors, reduce the flux linkages between the phase conductors, and consequently reduce the positive-sequence reactance.
Zero-Sequence Impedance Lead Sheath Cables
For the zero-sequence impedance of lead sheath cables, two cases are considered. The first is when a separate neutral conductor is not present. Under these conditions, all zero-sequence current returns in the three lead sheaths, and:
(12)
$$ \ \ \ Z_{0} = R_{0} + jX_{0} \enspace \Omega/1000 \text{ ft} $$
(13)
$$ \ \ \ Z_{0} = (R_{\phi} + R_{S}) + j0.0529 \log{\frac{GMR_{S}}{GMR_{\phi}}} \Omega/1000 \text{ ft} $$
From eq (13), the zero-sequence resistance, R0, is simply the sum of the resistance of the phase conductor, Rϕ. and the resistance of one lead sheath, RS.
The expression for the zero-sequence reactance of the circuit when there is a separate neutral conductor bonded to the lead sheaths and in parallel with the sheaths is quite complex, but is included for completeness. First, with reference to figure 10, when the current in each of the phase conductors is 1.0 amperes zero sequence, the total phase conductor current, 3.0 amperes, returns in the three lead sheaths and the separate neutral conductor. For the reference directions in figure 10, the current in each sheath is the same, due to the assumptions of asymmetry and spiraling of the separate neutral conductor around the three lead-sheath phase cables.
The current in each lead sheath, IS1, IS2, and IS3 shown in figure 10 are equal, and are given by eq (14), and the current in the separate neutral conductor, IN, is given by eq (15), where most of the terms in these equations, have been defined before. After eqs. (14) and (15) have been solved for IS1 and IN respectively, the values are substituted into eq (16) to find the numerical value for the zero-sequence impedance with return in both the lead sheaths and the separate neutral. These calculations are easily done with a programable calculator that handles complex number arithmetic, or with software such as MathCad or Excel.
In these two equations, the terms which have not been defined are RN, GMRN, and dϕN.
RN = Resistance of the separate neutral conductor in Ω/1000 feet
GMRN = Geometric mean radius of the separate neutral conductor in inches
dϕN = Average distance from the center of the phase conductors to the center of the neutral conductor in inches.
(14)
$$ \ \ \ I_{S1} = I_{S2} = I_{S3} = -1.0 \frac{3R_{N} + j0.1588 \log{\frac{d_{\phi N}^2 }{ GMR_{N} \sqrt[3]{GMR_{S} OD^2 }}}}{ R_{S} + 3R_{N} + j0.1588 \log{\frac{d_{\phi N}^2 }{GMR_{N} \sqrt[3]{GMR_{S}OD^2}}}} \text{ Ampere} $$
(15)
$$ \ \ \ I_{N} = -1.0 \frac{3R_{S} }{ R_{S} + 3R_{N} + j0.1588 \log{\frac{d_{\phi N}^2 }{GMR_{N} \sqrt[3]{GMR_{S}OD^2}}}} \text{ Ampere} $$
In these two equations, the sheath current, IS1, and neutral conductor current, IN, are complex numbers. Then these values are substituted into eq (16) to find the zero-sequence self-impedance when the return for the zero-sequence is in both the separate neutral conductor and lead sheaths.
(16)
$$ \ \ \ Z_{0} = R_{\phi} + j0.1588 \log{\frac{d_{ \phi N}}{ \sqrt[3]{GMR_{\phi} OD^2}}} + j(0.1588 \log{\frac{d_{\phi N}}{\sqrt[3]{GMR_{S} OD^2}}})I_{S1} - (R_{N} + j0.0529 \log{\frac{d_{\phi N}}{GMR_{N}}}) I_{N} \enspace \Omega/1000 \text{ ft} $$
Sequence Impedances of Phase-Isolated Cables
Usually, the phase isolated configuration is not used for secondary mains, but it is used by some operators for short tie circuits between transformer vaults and manholes, between network transformers and separately mounted network protectors, or between the network protector “network terminals” and a paralleling bus. figure 11 shows phase-isolated cables between the network protector network terminals and a paralleling bus in a spot network. With phase isolated cables, when the cables are suspended in air, or if they are in nonmetallic ducts, the probability of a fault is significantly reduced because all insulated cables in contact with one another are at the same potential.

Figure 11:
Phase-isolated cables between network protector
terminals and the paralleling bus (photo by author).
The inductive reactance and impedance of phase isolated circuits with multiple cables per phase can be considerably greater than that of circuits with phase-grouped cables. Given in this section are equations for finding both the positive-and zero-sequence impedances of the phase isolated configuration, considering different arrangements for the cables in each phase and neutral path.
Calculation Procedure With Multiple Cables per phase
With the phase isolated configuration, where there are multiple cables per phase, and multiple cables for the neutral path, the equations developed for finding the sequence impedances when there is just one cable per phase, and just one neutral cable are used. Let:
Nϕ = Number of cables in each phase.
NN = Number of cables in the neutral path
Rϕ = Resistance of each phase conductor in Ω/1000 feet
RN = Resistance of each neutral conductor in Ω/1000 feet
The approach used is as follows:
-
Calculate an equivalent resistance for each phase, Rϕ-EQ-, with eq (17). This equation assumes that the total current in each phase divides equally between the Nϕ phase conductors.
-
Calculate an equivalent resistance for the neutral path, RN-EQ, with eq (18). This equation assumes that the total current in the neutral path divides equally between the NN neutral conductors.
(17)
$$ \ \ \ R_{\phi - EQ} = \frac{R_{\phi}}{N_{\phi}} \Omega/1000 \text{ ft} $$
(18)
$$ \ \ \ R_{N-EQ} = \frac{R_{N}}{N_{N}} \Omega/1000 \text{ ft} $$
-
Calculate an equivalent geometric mean radius for the Nϕ phase conductors, designated as GMRϕ-EQ.
-
Calculate an equivalent geometric mean radius for the NN neutral conductors, GMRN-EQ.
In the following subsections, equations will be given for calculating the equivalent geometric mean radius when there are multiple cables per phase and multiple cables in the neutral path. Once this is done, the sequence impedances are calculated with eqs (19) and (20) for the positive-and zero-sequence impedances respectively.
(19)
$$ \ \ \ Z_{1} = R_{\phi - EQ} + j0.0529 \log{\frac{GMD_{\phi}}{GMR_{\phi - EQ}}} \Omega /1000 \text{ ft} $$
(20)
$$ \ \ \ Z_{0} = R_{\phi - EQ} + 3R_{N-EQ} + j0.1588 \log{\frac{GMD_{\phi N}^2}{ GMR_{N-EQ} \sqrt[3]{GMR_{\phi - EQ} GMD_{\phi}^2}}} \Omega/1000 \text{ ft} $$
Note that eq (19) is identical to eq (1) where the later applies when there is just one cable per phase. And eq (20) is identical to eq (9-2) where the later gives the zero-sequence impedance when there is just one cable per phase and one cable per neutral. So, in effect, when there are multiple cables per phase and multiple cables in the neutral path, each is represented by an equivalent resistance, and an equivalent geometric mean radius. The next two subsections discuss the calculation of the equivalent GMR when there are multiple cables per phase or for the neutral path.
Cable Arrangements One for Equivalent GMR Calculations
figure 20 shows the first six cable arrangements that will be considered for calculation the equivalent GMR of each phase and the equivalent GMR of the neutral path. There are from one to six conductors per phase or per neutral. When there is more than one cable per phase, the spacing between their centers is “S” as shown in the figure 20. With three cable per phase, their centers are at the vertices of an equilateral triangle. With four per phase, their centers are at corners of a square. With five per phase, their centers are at the vertices of an equilateral pentagon. And with six conductors per phase, their centers are at the vertices of an equilateral hexagon as shown in Figure 20 (f).

Figure 20:
Phase isolated circuits with one to six conductors per
phase. S is the spacing between conductor centers.
To find the equivalent GMR for the configurations in figure 20 (b) through figure 20 (f), where all conductors are the same, and arranged symmetrically as shown, and each having a geometric mean radius, GMRC, whether a phase conductor or a neutral conductor, the following equations are used. N in these relationships is the number of conductors per phase or number of conductors for the neutral.
(21-b)
$$ \ \ \ N = 2, \enspace GMR_{EQ - 2} = \sqrt{GMR_{C} S} $$
(21-c)
$$ \ \ \ N = 3, \enspace GMR_{EQ - 3} = \sqrt[3]{GMR_{C} S^2} $$
(21-d)
$$ \ \ \ N = 4, \enspace GMR_{EQ - 4} = \sqrt[4]{GMR_{C} S^3 \sqrt{2}} $$
(21-e)
$$ \ \ \ N = 5, \enspace GMR_{EQ - 5} = \sqrt[5]{GMR_{C} S^4 2(1 - cos{108\degree})} $$
{(21-f)
$$ \ \ \ N = 6, \enspace GMR_{EQ - 6} = \sqrt[6]{GMR_{C} S^4 4(1 - cos{120\degree})} $$
For the configurations in figure 20 with five and six conductors per phase or neutral, the configurations are more like those found in an overhead transmission line with bundled conductors. But the configurations in figure 20 for two, three, or four conductors per phase or neutral are representative of that in low-voltage network phase isolated circuits.
In using eq (19) and eq (20) to find the positive-sequence self-impedance and zero-sequence self-impedance, and with reference to figure 20, some engineering judgement must be applied in determining the geometric mean spacing between phases (GMDϕ) and the geometric mean spacing from the conductors in the three-phases and the neutral return path (GMDϕN).
To show the effect of phase isolation on the positive- and zero-sequence impedances when there are four cables per phase, and four cables in the neutral path, the configuration of figure 21 will be used.

Figure 21:
Configuration for example calculation of sequence
impedances with phase isolated construction.
Each phase conductor, and each neutral conductor is 500 kcmil copper, with the spacing between sub-conductors, “S” taken as 1.2 inches, slightly larger than the cable outside diameter. Other parameters are:
RN = Rϕ = 0.2468 Ω/1000 feet.
GMRN = GMRϕ = 0.312 inch
For the arrangement shown in figure 21, the geometric mean distance between the phases (GMDϕ), the geometric mean distance between the phases and neutral (GMDϕN) are given by eqs (22) and (23). The distances between the phases and the neutral, as given in eq (23), are found with the Pythagorean Theorem.
(22)
$$ \ \ \ GMD_{\phi} = \sqrt[3]{d_{AB} d_{BC} d_{AC}} = \sqrt[3]{8 * 8 * 16} = 10.079 \text{ inches} $$
(23)
$$ \ \ \ GMD_{\phi N } = \sqrt[3]{d_{AN} d_{BN} d_{CN}} = \sqrt[3]{17.89 * 11.31 * 8} = 11.74 \text{ inches}$$
Substituting the values for the parameters into eq (19), the positive-sequence impedance for the phase isolated circuit, Z1-PHASE-ISOLATED, is given by eq.(24):
(24)
$$ \ \ \ Z_{1 - PHASE \enspace ISOLATED} = 0.00617 + j0.0546 = 0.0549 \enspace \Omega/1000 \text{ ft} $$
In contrast, as given in Table 2, the average value for the positive-sequence impedance of one set of phase-grouped 500 kcmil cables is given by eq (25):
(25)
$$ \ \ \ Z_{1 - AVERAGE} = 0.0247 + j0.0321 \enspace \Omega/1000 \text{ ft} $$
With four sets of 500 kcmil phase grouped cables in parallel, the positive-sequence impedance of the circuit would be one fourth of the impedance of one set as given by eq (26).
(26)
$$ \ \ \ Z_{1 - CIRCUIT \enspace PHASE \enspace GROUPED} = 0.00617 + j0.00803 = 0.01013 \enspace \Omega/1000 \text{ ft}$$
From eqs (24) and (26), the positive-sequence resistance of the phase isolated circuit and the phase-grouped circuits is the same. But the positive-sequence reactance of the phase isolated circuit is about 6.8 times that of the phase-grouped circuit, and the positive-sequence impedance of the phase isolated circuit is about 5.4 times that of the phase-grouped circuit with the same number of cables per phase.
The zero-sequence impedance of the phase-isolated circuit in figure 21 is found using eq (20), where values are available for all terms in this equation. Evaluating eq (20) gives the following for the zero-sequence impedance of the phase isolated configuration.
(27)
$$ \ \ \ Z_{0-PHASE \enspace ISOLATED} = 0.02468 + j0.2397 = 0.2409 \enspace \Omega/1000 \text{ ft}$$
In contrast, as given in Table 2, the average value for the zero-sequence impedance of one set of phase-grouped 500 kcmil cables is given by eq (28):
(28)
$$ \ \ \ Z_{0-AVERAGE} = 0.0987 + j0.1150 \enspace \Omega/1000 \text{ ft} $$
With four phase-grouped sets in parallel, the zero-sequence impedance of the circuit would be one fourth of the zero-sequence impedance of one set of phase-grouped cables.
(29)
$$ \ \ \ Z_{0 - CIRCUIT \enspace PHASE \enspace GROUPED } = 0.0247 + j0.0288 = 0.0379 \enspace \Omega/1000 \text{ ft} $$
From the above, the zero-sequence resistance of the phase-isolated circuit and the zero-sequence resistance of the phase-grouped circuit is the same. But the zero-sequence reactance of the phase-isolated circuit is 8.3 times that of the phase-grouped circuit. And the zero-sequence impedance of the phase-isolated circuit is 6.4 times that of the phase-grouped circuit. Table 3 compares other characteristics of the phase-isolated and phase-grouped circuits when there are four cables per phase.
Table 3:
Properties of phase-isolated and phase-grouped circuits
with full size neutrals (4-500 kcmil cables per phase and neutral)
Circuit Type 4-500 kcmil/ϕ |
Z0/Z1 | X1/R1 | X0/R0 | X0/X1 |
|---|---|---|---|---|
| Phase Grouped | 3.75 | 1.30 | 1.165 | 3.59 |
| Phase Isolated | 4.39 | 8.85 | 9.71 | 4.39 |
It is emphasized that the positive- and zero-sequence impedances for the phase-isolated configurations found with the above equations are the “self-sequence impedances.” Calculations for the self-sequence impedances with computer software gives values that practically are the same as found with the equations presented herein. However, because the phase-isolated configurations are not symmetrical, as true with most phase-grouped configurations, some of the mutual impedances between the sequence networks are not negligible in comparison to the self-sequence impedances. When representing the impedances of the phase-isolated circuits in power flow and short-circuit programs, most often the mutual impedances between the sequence networks are not included in the model. This practice usually is acceptable, because phase-isolated circuits typically are short in length. Under certain conditions, it may be necessary to model the unbalances created by the phase-isolated circuits.
Other Cable Arrangements For Equivalent GMR Calculations
The cable arrangements for five or six cables per phase shown in Figure 20, although applicable for transmission circuits with bundled conductors, are not representative of arrangements for low-voltage cable circuits. This sub-section gives expressions for calculating the equivalent GMR of bundled low-voltage cables in terms of the OD of the insulated cable, and the GMR of the conductor in each insulated cable, GMRC.
Four Cables Per Bundle
figure 22 shows the two configurations, 4-1 and 4-2, with four cables per bundle. For these two configurations, the equivalent GMR is given by eqs. (30) and (31).
(30)
$$ \ \ \ GMR_{EQ4-1} = \sqrt[4]{GMR_{C} * OD * 2^{\frac{1}{2}}} $$
(31)
$$ \ \ \ GMR_{EQ4-2} = \sqrt[4]{GMR_{C} *OD * 3^{\frac{1}{4}}}$$
With four conductors in the bundle, the ratio of the GMR calculated with eq (31) to that calculated with eq (30) is 0.9822 as shown by eq (32).
(32)
$$ \ \ \ \frac{GMR_{EQ4-2}}{GMR_{EQ4-1}} = 0.9822 $$
So practically, it doesn’t matter which equation is used to calculate the equivalent GMR when there are four cables in the bundle.

Figure 22:
Four bundled LV cables.
Five Cables Per Bundle
figure 23 shows two configurations, 5-1 and 5-2, with five cables per bundle. For these two configurations, the equivalent GMR is given by eqs. (33) and (34).
(33)
$$ \ \ \ GMR_{EQ5 - 1 } = \sqrt[5]{ GMR_{C}*OD^4 * 2 * 5^{\frac{1}{5}} } $$
(34)
$$ \ \ \ GMR_{EQ5 - 2 } = \sqrt[5]{ GMR_{C}*OD^4 * 2^{\frac{2}{5}} * 3^{\frac{2}{5}} } $$
With five conductors in the bundle, the ratio of the GMR calculated with eq (34) to that calculated with eq (33) is 0.9421 as shown by eq (35). Thus, practically it doesn’t matter which equation is employed to find the equivalent GMR when there are five cables in the bundle.
(35)
$$ \ \ \ \frac{GMR_{EQ5-2}}{GMR_{EQ5-1}} = 0.9421 $$

Figure 23:
Five bundled LV cables.
Six Cables per Bundle
figure 24 shows three configurations, 6-1, 6-2, and 6-3 with six cables per bundle. For these three configurations, the equivalent GMR is given by eqs. (36), (37). and (38).
(36)
$$ \ \ \ GMR_{EQ6-1} = \sqrt[6]{CMR_{C} * OD^5 * 2^{\frac{4}{3}} * 5^{\frac{1}{3}}} $$
(37)
$$ \ \ \ GMR_{EQ6-2} = \sqrt[6]{CMR_{C} * OD^5 * 2^{\frac{2}{3}} * 3^{\frac{1}{2}} 7^{\frac{1}{6}}} $$
(38)
$$ \ \ \ GMR_{EQ6-3} = \sqrt[6]{CMR_{C} * OD^5 * 2^{\frac{2}{3}} * 3^{\frac{1}{2}}} $$
With six conductors in the bundle, the ratio of the GMR calculated with eq (37) to that calculated with eq (36) is 0.9794 as shown by eq (39), and the GMR calculated with eq (38) to that calculated with eq (36) is 0.9279 as shown by eq (40). Thus, practically it doesn’t matter which equation is employed to find the equivalent GMR when there are six cables in the bundle.
(39)
$$ \ \ \ \frac{GMR_{EQ6-2}}{GMR_{EQ6-1}} = 0.9794 $$
(40)
$$ \ \ \ \frac{GMR_{EQ6-3}}{GMR_{EQ6-1}} = 0.9279 $$

Figure 24:
Six bundled LV cables
Seven Cables per Bundle
figure 25 shows three configurations, 7-1, 7-2, and 7-3 with seven cables per bundle. For these three configurations, the equivalent GMR is given by eqs. (41), (42). and (43).
(41)
$$ \ \ \ GMR_{EQ7-1} = \sqrt[7]{GMR_{C} * OD_{6} * 2^{\frac{11}{7}} * 3^{\frac{2}{7}} * 5^{\frac{3}{7}} * 7^{\frac{1}{7}}} $$
(42)
$$ \ \ \ GMR_{EQ7-2} = \sqrt[7]{GMR_{C} * OD_{6} * 2^{\frac{6}{7}} * 3^{\frac{6}{7}} * 7^{\frac{2}{7}}} $$
(43)
$$ \ \ \ GMR_{EQ7-3} = \sqrt[7]{GMR_{C} * OD_{6} * 2^{\frac{6}{7}} * 3^{\frac{6}{7}}}$$
The ratio of the GMR calculated with eq (42) to that found with eq (41) is 0.9609, and the ratio of the GMR calculated with eq (43) to that calculated with eq (41) is 0.887, so practically it doesn’t matter which equation is used to find the equivalent GMR with the seven conductor bundle.

Figure 25:
Seven bundled LV cables.
Eight Cables per Bundle
With eight conductors in the bundle, four configurations are considered for finding the equivalent GMR as shown in figure 26. For these four configurations, the equivalent GMR of the bundle is found with eqs. (44), (45), (46), and (47),
(44)
$$ \ \ \ GMR_{EQ8-1} = \sqrt[8]{GMR_{C} * OD^7 * 3^{\frac{1}{2}} * 4 * 5^{\frac{3}{4}}}$$
(45)
$$ \ \ \ GMR_{EQ8-2} = \sqrt[8]{GMR_{C} * OD^7 * 2 * 3^{\frac{9}{8}} * 7^{\frac{3}{8}} * 13^{\frac{1}{8}}} $$
(46)
$$ \ \ \ GMR_{EQ8-3} = \sqrt[8]{GMR_{C} * OD^7 * 2^{\frac{9}{4}} * 5^{\frac{3}{4}}} $$
(47)
$$ \ \ \ GMR_{EQ8-4} = \sqrt[8]{GMR_{C} * OD^7 * 2^{\frac{5}{4}} * 3^{\frac{7}{8}} * 7^{\frac{1}{4}}} $$
The ratios of the equivalent GMR’s calculated with eqs (45), (46), and (47) to that calculated with eq (44) are respectively 0.9798, 0.9541, and 0.9015. So practically it doesn’t matter which equation is used to find the equivalent GMR with eight conductors in the bundle

Figure 26:
Eight bundled LV cables
Phase Isolated Circuits with Two Ducts Per Phase and Neutral
figure 27 shows an inter-vault tie circuit where there are six cables per phase, with two ducts per phase. Calculation for the self-sequence impedances for phase-isolated tie circuits having either eight or six conductors pre phase and neutral, with two ducts for the cables of each phase, and two ducts for the neutral cables is given in this section.
The approach used is to:
-
Calculate an equivalent geometric mean radius for each phase, in terms of the GMR of each phase conductor, GMRC, and the spacing between the centers of the phase conductors, Sϕ.
-
Calculate an equivalent geometric mean radius for the neutral path conductors in terms of the GMR of each neutral conductor, GMRN, and the spacing between the centers of the neutral conductors, SN.
-
Calculate an equivalent geometric mean distance between the phases, designated as GMDΦEQ .
-
Calculate an equivalent geometric mean distance between the phases and the neutral, designated as GMDϕNEQ.
-
Calculate and equivalent resistance for each phase, designated as RϕEQ.
-
Calculate an equivalent resistance for the neutral path, designated as RNEQ.

Figure 27:
Phase isolated circuit with two ducts per phase and
neutral (courtesy Consolidated Edison).
Eight Cables Per Phase, Two Ducts per Phase
Two configurations are considered. The first is when there are eight cables per phase, and eight cables in the neutral path, with the cables and ducts arranged as shown in figure 28. With reference to this figure, the formulas assume that the two ducts for each phase are vertically aligned, and that the two rows of ducts are separated by distance “dij” in inches.
With eight cables per phase, the equivalent GMR of the eight phase conductors, GMREQ8ϕ, is given by eq (48), where the terms in the equation are:
GMRC = Geometric mean radius of one phase conductor in inches
Sϕ = Spacing between the centers of the phase conductors in inches, where it is assumed their centers are at the corners of a square. This is equal to the OD of the phase cables, ODϕ.
dij = Distance between the two duct rows in inches.
(48)
$$ \ \ \ GMR_{EQ8\phi} = \sqrt{\sqrt[4]{GMR_{C} * S_{\phi}^3 * \sqrt{2} } * d_{ij}}$$
The equivalent GMR of the eight neutral conductors is given by eq (49), where SN is the spacing between the centers of the neutral conductors, which is the OD of a neutral cable.
(49)
$$ \ \ \ GMR_{EQ8N} = \sqrt{\sqrt[4]{GMR_{N} * S_{N}^3 * \sqrt{2} } * d_{ij}} $$
In these equations, all dimensions are in inches, and:
GMRC = Geometric mean radius of the phase conductor in inches
GMRN = Geometric mean radius of the neutral conductor in inches
The geometric mean distance between the three phases, with the phase conductors in two ducts per phase, is given by eq. (50). This equation applies whether there are eight cables per phase, or six cables per phase. The distances in this equation are defined in figure 28.
(50) $$ \ \ \ GMD_{EQ\phi} = \sqrt{\sqrt[3]{d_{AB} * d_{BC} * d_{AC}} * \sqrt[3]{d_{AB’} * d_{BC’} * d_{AC’}}} $$
And the equivalent geometric mean distance between the three phases and the neutral return path is given by (51). This applies whether there are eight cables per phase/neutral or six cables per phase/neutral. The distances appearing in eq (50) and (51) are identified in Figure 28, and are in inches.
(51)
$$ \ \ \ GMD_{EQ\phi N} = \sqrt{\sqrt[3]{d_{AN} * d_{BN} * d_{CN}} * \sqrt[3]{d_{AN’} * d_{BN’} * d_{CN’}}} $$

Figure 28:
Cable arrangements with eight cables per phase and for
the neutral, two ducts per phase/neutral.
With eight cables per phase as in figure 28, the expressions for the positive- and zero-sequence self-impedances are given by eqs (52) and (53) respectively.
(52)
$$ \ \ \ Z_{11} = \frac{R_{C}}{8} + j0.0529 * \log{\frac{GMD_{EQ\phi}}{GMR_{EQ8\phi}}} \Omega/1000 \text{ ft} $$
(53)
$$ \ \ \ Z_{00} = \frac{R_{C}}{8} + 3\frac{R_{N}}{8} + j0.1588 * \log{\frac{GMD_{EQ\phi N}^2}{ GMR_{EQ8N} \sqrt[3]{GMR_{EQ8\phi} * GMD_{EQ\phi}^2}}} \Omega/1000 \text{ ft} $$
Six Cables Per Phase, Two Ducts Per Phase
figure 29 shows the cable arrangements when there are six cables per phase, with three cables in each duct. The approach for finding the self-sequence impedances is the same as when there are eight cables per phase. The equivalent GMR of the six phase conductors, GMREQϕ, is given by eq (54), where, as before, Sϕ is the spacing between the centers of the phase cables.
(54)
$$ \ \ \ GMR_{EQ6\phi} = \sqrt{\sqrt[3]{GMR_{C} * S_{\phi}^2} * d_{ij}}$$
And the equivalent GMR of the six neutral conductors, GMREQ6N, is given by eq (55)
(55)
$$ \ \ \ GMR_{EQ6N} = \sqrt{\sqrt[3]{GMR_{N} * S_{N}^2} d_{ij}}$$

Figure 29:
Cable arrangements with six cables per phase and for the
neutral, two ducts per phase/neutral.
With six cables per phase, the expressions for the positive-and zero-sequence self-impedances are given by eqs. (56) and (57).
(56)
$$ \ \ \ Z_{11} = \frac{R_{C}}{6} + j0.0529 * \log{\frac{GMD_{EQ\phi}}{GMR_{EQ6\phi}}} \Omega/1000 \text{ ft} $$
(57)
$$ \ \ \ Z_{00} = \frac{R_{C}}{6} + 3\frac{R_{N}}{6} + j0.1588 * \log{\frac{GMD_{EQ\phi N}^2}{ GMR_{EQ6N} \sqrt[3]{GMR_{EQ6\phi} * GMD_{EQ\phi}^2}}} \Omega/1000 \text{ ft} $$
The geometric mean distances in these two equations are given by eqs (50) and (51), and are a function only of the distances between duct centers, and are independent of the number of cables in the duct, either eight or six.
Comparison, Phase Isolated versus Phase Grouped, Eight Cables per Phase
The self-sequence impedances with eight cables per phase as in Figure 28 is significantly higher than when there are eight sets of phase-grouped cables in parallel. This will be illustrated with 500 kcmil copper cables for both the phase and neutral paths. The outside diameter of the cables is 1.105 inches, so Sϕ and SN are both 1.105 inches for calculation of the equivalent geometric mean radius for the phase and for the neutral. Other data for the comparison are:
RC = RN = 0.2517 Ω/1000 ft
GMRC = GMRN = 0.2146 inch
Table 4 gives the positive- and zero-sequence impedances for different vertical spacings of the ducts (dij) in figure 28, and for horizontal separation of the ducts, shown in figure 28 as dAN, dAB, and dBC.
Note that the positive-sequence resistance and the zero-sequence resistance is not affected, practically, by the spacings between ducts. But the duct spacing does affect both the positive-sequence reactance given in the fourth column of the table, and the zero-sequence reactance given in the last column of the table.
Table 4:
Sequence impedances with 8 500 kcmil cables per phase and
neutral with two ducts per phase.
Duct Horizontal Spacing (inches) |
Duct Vertical Spacing (inches) |
Positive Sequence | Zero-Sequence | ||
|---|---|---|---|---|---|
R1 (Ω/1000 ft) |
X1 (Ω/1000 ft) |
R0 (Ω/1000 ft) |
X0 (Ω/1000 ft) |
||
| 6 | 6 | 0.003146 | 0.03044 | 0.01259 | 0.1656 |
| 6 | 8 | 0.003146 | 0.03593 | 0.01259 | 0.1899 |
| 6 | 10 | 0.003146 | 0.04043 | 0.01259 | 0.2093 |
| 8 | 8 | 0.003146 | 0.03375 | 0.01259 | 0.1788 |
If instead, the circuit were made with eight sets of phase-grouped cables, each set in a separate duct, having the configuration shown in figure 30, the positive-and zero-sequence impedances of the circuit (eight sets of phase-grouped in parallel) are:
(58)
$$ \ \ \ Z_{1} = 0.003146 + j0.003608 \enspace \Omega/1000 \text{ ft} $$
(59)
$$ \ \ \ Z_{0} = 0.01259 + j0.01759 \enspace \Omega/1000 \text{ ft} $$

Figure 30:
Arrangement of 500 kcmil cables for one set of
phase-grouped cables.
From eq (58) and the data in Table 4, the positive-sequence reactance of the phase-isolated configuration with two ducts per phase is about 9.4 times that with eight sets of phase-grouped cables in parallel. And the zero-sequence reactance is about 10.2 times that with eight sets of phase-grouped cables in parallel, each set in a separate duct. Thus, although there are benefits of the phase-isolated configurations, their positive-sequence reactance and zero-sequence reactance are much higher than with multiple sets of phase grouped cables in parallel.
Cable Tie-Circuit Impedances Relative to Network Transformer Impedances
As discussed in Backfeed Currents for Primary Feeder Faults, the impedance of 25 feet of primary cable is negligible in comparison to the impedance of a network transformer, but the same does not apply to the impedance of 25 feet of a 208Y/120-volt tie circuit connected to the network-side terminals of the network protector. The point is that in modeling of the secondary network system for power flow or short circuits, short secondary inter-vault, or vault-to-manhole tie circuits should not be neglected.
figure 31 shows a 500 kVA 216-volt 5% impedance network transformer with a 25-foot tie circuit from the transformer vault to an adjacent manhole.

Figure 31:
Impedance of 25 foot tie circuit from 500 kVA 208-volt
network unit to adjacent manhole/vault.
The positive-and zero-sequence impedances of the network transformer in ohms referred to the secondary side are Z1T and Z0T respectively:
(60) $$ \ \ \ Z_{1PG} = Z_{0T} = 0.000767 + j0.0046 = 0.00467 \enspace @80.5\degree $$
If the 25-foot tie circuit in figure 31 is phase grouped, consisting of four sets of 500 kcmil phase-grouped cables, the self-sequence impedances in ohms are:
Z1PG = 0.000154+j0.000201 = 0.000253 @ 52.5o
Z0PG = 0.000617+0.000720 = 0.000948 @49.4o
But if the 25-foot tie circuit is phase isolated with four 500 kcmil cables per phase with the spacings shown in figure 21, the positive-and zero-sequence impedances in ohms are:
Z1PI = 0.000154+j0.001365 = 0.00137 @ 83.6o
Z0PI = 0.000617+0.005993 = 0.00602 @84.1o
The resistance part of the sequence impedances of the phase-isolated and phase grouped circuits are practically the same, but sequence reactance’s of the phase isolated and consequently the sequence impedances are much higher. For the phase grouped tie circuit, the positive-and zero-sequence impedances of the 25-foot tie circuit are 5.4% and 20.3% respectively of the impedance of the network transformer. For the phase-isolated tie circuit, the positive-and zero-sequence impedances of the 25-foot tie circuit are 29.3% and 129% of the impedance of the network transformer. The impedances of both the 25-foot phase-grouped and 25-foot phase isolated tie circuits are not negligible in comparison to the 500-kVA network transformer impedance.
To highlight the importance of secondary circuit impedance, the positive-sequence impedance of 100 feet of a secondary main, phase grouped with 500 kcmil cables, is about equal to that of a 500 kVA 5% impedance network transformer.
From a practical standpoint, the phase isolated cable configurations can be used to:
-
Help equalize the impedance of network transformers/protectors and their tie circuits that are connected to the same bus, where the distance between each transformer/protector and the bus is significantly different, as in the system of figure 4.
-
Increase the impedance of a tie circuit from a network protector to a paralleling bus, to reduce the fault currents so that the interrupting rating of customer breakers are not exceeded.
The policy of one major operator of 208-volt networks is to allow phase-isolated cables for inter-vault tie circuits providing the circuit length does not exceed 25 feet. In 480-volt installations where network protectors are separately mounted, the phase-isolated configuration is permitted for tie circuit lengths up to 50 feet. At 480-volts, longer phase-isolated circuits can be used for the connections to network protectors, because the impedance of a circuit of a given length, relative to the impedance of the network transformer, is less at 480 volts. For example, many operators will use four 500-kcmil cables per phase with a 500 kVA 216-volt network transformer, and also with a 1000 kVA 480-volt network transformer. With a 500 kVA 216-volt 5% impedance transformer, the impedance referred to the secondary side is 0.00466 ohms. For a 5% impedance 1000-kVA 480-volt transformer, the impedance referred to the secondary side is 0.0115 ohms, or 2.47 times that of the 500 kVA 216-volt transformer.
Secondary Main Capacity
General Design Consideration addressed secondary main capacity and its importance under normal and contingency conditions. Normal practice is to install single or multiple network transformers and protectors at the locations of the larger loads. The protectors may be connected with cables to rigid bus, moles, or crabs located in the same vault as the transformers and protectors, from which connections are made to larger services and secondary mains. Or the protectors may be connected with tie circuits to buses, moles, crabs, or ring buses installed in an adjacent vault, compartment, or manhole from which services and secondary mains terminate. These junctions at different locations are then connected together through secondary mains, which serve two purposes.
-
Supply the smaller loads form intermediate handholes, service boxes, or manholes under normal and emergency conditions. Many utilities have a limit on the maximum size load to be supplied from the secondary mains; for loads above this limit a transformer and protector are installed at the site.
-
Serve as a path or circuit to pickup load when a primary feeder is out of service, for maintenance or due to a fault on the primary feeder. The function of the secondary mains is similar to that of transmission lines in the HV power system.
figure 32 is a portion of a grid (area) network system for illustrating these two purposes.

Figure 32:
Portion of a grid network with secondary mains.
If there were an outage of primary feeder 3 supplying the transformer in vault 3 in figure 32, the secondary mains terminating in manhole 3 must have the capacity to supply the portion of the load fed from manhole 3 that was supplied by the network transformer in vault 3. Similarly, if there were an outage of either primary feeder 1 or primary feeder 2 supplying transformer vault 1 or vault 2 respectively, the secondary mains plus the transformer remaining in service that terminates in manhole 1 must be able to supply some of the load fed from manhole 1 that previously was supplied by the transformer that is out-of-service.
The secondary mains should be sized such that, during normal conditions and a single- or double contingency condition, depending on the design philosophy, the mains can supply the peak load without exceeding ratings, and be able to maintain voltages within the allowable range. An old guideline for sizing secondary mains, when there was just one network transformer at each location, was that the main capacity in each direction should be between one half and two thirds of the capacity of the network transformer. This guideline further assumed that the transformer fed mains in at least two directions, and part of the transformer capacity was to supply load at the transformer location. And in network systems designed to operate under a second contingency for the primary feeders, with any two primary feeders out of service, the secondary mains must not be overloaded.
Recognizing the complexity of the secondary grid network, and as mentioned in Chapter 2, the adequacy of the secondary mains should be confirmed with power flow studies, unless there is evidence that the installed transformer capacity and mains are sufficiently overbuilt to handle normal and contingency conditions. The secondary grid network topology of many systems can be as or more complex than the transmission system of the utility. It would be very difficult for the transmission planning engineer to determine power flows during normal and contingency conditions without a power flow study. The same applies to the secondary network.
Relative Voltage Drop In Secondary Mains
Different size phase cables are used for secondary mains. Data in the last published EEI AC Network Operations Report (EEI 1959-61) shows that the most common sizes are 4/0 up to 500 kcmil. Larger cables such as 750 kcmil are used for inter-vault tie circuits.
A secondary main connecting two points can be made from one set of phase-grouped cables located in one duct, from two sets of phase-grouped cables installed in two ducts as illustrated at the top of figure 33, with both circuits having the same rating. The advantages of using two smaller sets are:
-
The impedance and in particular the reactance of the two smaller sets in parallel is lower, providing less voltage drop during normal and contingency conditions.
-
The available currents are higher for burning clear cable faults when cable limiters are not used., or for blowing of cable limiters, increasing the likelihood of a fault in a secondary main being cleared.
-
Cables may be more easily trained in manholes and handholes.
-
When cable limiters are installed, selective coordination is improved with the two smaller sets of cable.
figure 33 shows the voltage drop in two secondary mains, one made with one set of 500 kcmil cables (blue-colored curves), and the other made from two sets of 250 kcmil phase-grouped cables in parallel with each set installed in a separate duct (red-colored curves). The voltage drop in mV per ampere per circuit foot is plotted versus power factor for mains carrying balanced currents. The phase cables in each circuit are assumed to be in triplex configuration, with the cable parameters affecting the impedance given in the figure. When the power factor is 100% (1.0 per unit), for practical purposes the voltage drop with one set of 500 kcmil cables is the same as that with two sets of 250 kcmil cables in parallel.
Notice that two curves are given for each cable size. For the circuit with one set of 500 kcmil cables, one curve applies when the OD of the cable is 1.08 inch, and the other applies when the OD is 1.01 inch. Similarly, for the circuit with two sets of 250 kcmil cables, one applies when the cable OD is 0.84 inch, and the other when the cable OD is 0.77 inch. With the smaller diameter cable, the positive-sequence reactance is less, and the voltage drop is less than the voltage drop with the larger diameter cable.


Figure 33:
Voltage drop in secondary mains
The disadvantages of using two smaller sets of cable in separate ducts are:
-
More ducts are required between the vault/manholes connected with the circuit.
-
More joints must be made and usually a greater number of cable limiters are required.
-
More time is required to install the two sets of cables in the duct bank.
In the past, utilities have installed secondary mains of either seven or eight 4/0 cables located in the same duct. When lead sheath cables were installed, there were two 4/0 cables per phase and just one bare 4/0 neutral, with the neutral bonded to the six lead sheaths of the phase cables. The lead sheaths of the phase cables helped to carry the neutral current due to load unbalances. When non-leaded cables were adopted, two 4/0 bare neutrals were included. The mains made from seven or eight 4/0 cables had about the same rating as a main made from one set of 500 kcmil cables, but generally the mains made with 4/0 cables had less voltage drop, other than at unity power factor.
figure 34 compares the voltage drop in secondary mains made with three 500 kcmil cables, and in a secondary main made with seven 4/0 non-leaded cables. The cable configurations are given at the top of the Figure. Both the cradled and triplexed configurations are considered for the 500 kcmil cables with outside diameter of 1.04 inch, with the voltage drop shown by the red-colored and orange-colored curve respectively.


Figure 34:
Comparison of voltage drop (mV/ampere/foot) with three
500 kcmil and seven 4/0 rope assembly.
Two configurations are considered for the six 4/0 cables making up the three phases as shown at the top of figure 34. In configuration 1 as shown in blue, adjacent conductors are from different phases. In configuration 2 as shown in green, two conductors of the same phase are adjacent to each other. For both configurations, the cable OD is 0.70 inches. This makes the positive-sequence impedance higher, and therefore the voltage drop is higher with the 4/0 conductors in configuration 2. The effect of having two 4/0 versus three 500 kcmil cables shown in figure 34 is the same as that shown by Brieger (1938).
LV Cable Burn Clear
In early 208-volt secondary network systems, low-voltage cables were joined together without any fusing devices. It was believed that faults would self-clear at the fault location before the cables remote from the fault, carrying the fault current, would be damaged, such damage allowing the fault to spread to another location. From tests described in (Sutherland and MacCorkle 1931), it was concluded that:
-
“Faults included in the class of point contacts and occurring in single-conductor a-c low-voltage network cables, operating at voltage values of the order of 120/208 volts, will usually clear within a period of several seconds if a minimum value of current of approximately 3,000 amperes is available, irrespective of the conductor size. Tests and operating data show that ground faults between copper conductor and the sheath of lead covered cables have been cleared in all cases with voltage values of 115/199 to 243/420 volts inclusive”. An interpretation of this is that in lead-sheath cables, a fault between the copper conductor and lead sheath will clear at 120 volts. Of course, this would not apply to non-metallic sheath LV cables.
-
“Copper-to-copper faults in single-conductor ac low-voltage (120/208 volts) network cables. made by taping the bared conductors overall and thereby obtaining a contact length of approximately three inches between conductors, will clear at the location of the fault within the period of the order of one minute (usually less) providing the following minimum values of short-circuit current are maintained during the period of the short.”
figure 35 depicts the test conditions described in #2 in the above list. Such a fault is sometimes referred to as a solid or welded-type fault, versus an arcing fault. A solid fault would also result if there were significant melting of the copper conductors at the fault location, such that a solid mass of molten metal freezes at the fault path. A solid fault could be produced if heavy metallic construction equipment penetrated a duct with phase-grouped cables. If the thermal capacity of the solid or welded-type fault is greater than that of the cables supplying it, before the fault burns clear, the conductors supplying the fault current can reach a temperature where the cable insulation is damaged remote from the fault, or the conductors actually burn apart. This reaction allows the fault to spread.

Figure 35:
Fault between two bared non-metallic sheathed LV cables.
Although solid or welded faults are not common in most systems, should they occur and not burn clear, the fault spreads. Table 5 (EEI, 1957) lists the current that must be supplied from both sides of the solid or welded fault if it is to burn clear. These values, were derived from the tests described in (Sutherland and MacCorkle 1931). They are referenced by some utilities to determine if cable limiters are required in the 208Y/120-volt secondary system. The logic is that if the currents exceed those in Table 5, cable limiters are not required. However, some have suggested that, for some welded faults, even with currents listed in the table, the fault will not burn clear before it can spread (Heller and Matthysse 1955).
Table 5:
Minimum Current in Amperes Required from Each Side of
Fault to Burn Clear
Conductor Size |
1/0 | 2/0 | 3/0 | 4/0 | 250 | 350 | 500 |
|---|---|---|---|---|---|---|---|
| Amperes | 1800 | 2100 | 2500 | 2900 | 3200 | 4000 | 5000 |
In using the data of Table 5 to determine if there is sufficient current to burn clear, it is prudent to consider that the current values should be maintained for all fault types, which includes three-phase, phase-to-phase, and phase-to-neutral if the neutral is in the same duct as the phase conductors. This means that the available three-phase fault current from both sides of the fault should be greater than the values given in the table. Considering the phase-to-phase fault, the available three-phase fault current should be 115% of the values in the table. Considering the phase-to-neutral fault, the available three-phase fault current should be in the range of 150% to 170% of the values in the table.
Cable Limiters and Cable Damage Curves
Although it was believed in early 208-volt secondary network systems that all faults in secondary cable would burn clear without spreading, extensive experience showed this was not always the case. C. P. Xenis, developer of the cable limiter, wrote in 1937 (Xenis 1937) that “Companies operating extensive distribution networks have experienced cases of cable failures spreading beyond the initial point of fault, and the prevention of extensive damage in such cases depends on the prompt arrival of the operating crews who cut network cables around the faulted area. This type of fault frequently is accompanied by fires and explosions from apparent reasons.” The cable limiter was developed in the 1930’s to isolate solid or welded faults that do not burn clear and can result in the fault spreading from the initial location. The cable limiter not only acted as a fuse, but incorporated features needed to connect the cables at junction points.
The intent of the limiter is to prevent damage or roasting of cable insulation remote from the fault. As shown in figure 36, and assuming cable limiters are not installed, if a solid fault on a secondary main between the two bus holes does not burn clear at the fault location from both ends, the fault current continues to flow into the fault through the conductors on either side of the faulted main. This raises the temperature of the copper phase conductors and the insulation of the cables in the faulted main at points remote from the fault. Before the copper melts at 1083oC, the insulation can be severely damaged. Also, as the conductor temperature rises, its resistance increases, resulting in a lowering of the current, reducing the likelihood of the fault burning clear. This can damage the insulation and cause a fault at another location on the faulted main. If this occurs in or near the bus hole or manhole feeding the faulted secondary main, the fault can spread to other cables in the bus hole.

Figure 36:
Portion of a 208-volt grid network with cable limiters.
The purpose of the cable limiter is to blow and interrupt the flow of high fault current before the temperature of the phased conductor and insulation of the faulted main, remote from the fault, reach levels where another fault develops. This confines the fault to the set of cables where it originated. For a fault in a set of a phase-grouped secondary main in figure 36, the blowing of cable limiters in the faulted phases at both ends, L1 and L2, is necessary to isolate the fault and prevent it from spreading, unless the fault is self-clearing.
The effectiveness of the limiter for isolating solid faults was discussed by Xenis and Williams, in the Electrical World article in 1939 titled, “Operating Record Proves Value of Limiter”. In that article they wrote, “In all cases where limiters were installed and a fault occurred the insulation of the cable on both sides of the fault was found to be in good condition. Furthermore, all faults were confined to that section of the cable in which they originated”. It was also indicated in the article that even with limiters installed, in some cases the fault would burn clear before the limiters would blow.
figure 37 shows the total clearing characteristics of the conventional cable limiters, and the insulation damage curves for cables, taken from Figure 3 of AIEE paper 55-473 (Heller and Matthysse 1955). The insulation damage curves, shown with the dashed curves, are based on balanced currents in all three phases of the cable in the duct, and are for cables with L260 insulation, where damage starts to occur at 260oC. If there is fault current in just two of the cables in the duct, the insulation damage curves are pessimistic, because the watts loss in the two faulted conductors feeding the fault at the same current is two-thirds of that when fault current is in all three phases.

Figure 37:
Characteristics of cable limiters and L260 cable
insulation damage curves.
As indicated in Backfeed Currents for Primary Feeder Faults, the limiter does not have a current rating, but is designated by the size of the copper cable it is to be used with. As the name implies, the purpose of the cable limiter is to limit the damage to the cable insulation under fault conditions.
At the lower currents in figure 37, the limiter curve and cable damage curve cross over, the implication being that if the fault current is not high enough, the limiter may not prevent damage to the cable insulation. As indicated before in Backfeed Currents for Primary Feeder Faults, limiters with the characteristics in figure 37 can’t be used in cable circuits operating at 480-volts, because they will, upon melting of the fusible section, not interrupt the current at the higher voltage.
Another benefit of the cable limiter is that when it does blow, it removes voltage from the limiter side of the fault, thereby reducing the possibility that the fault will re-establish at a later time. In contrast, without cable limiters, if the fault does burn clear, voltage is still present on the phase conductors at the fault point, possibly on both sides of the fault, and the fault is more likely to re-establish itself at a later time due to tracking, especially if contaminants and moisture enter the duct with the faulted cable.
Although cable limiters should operate for faults on the cable they are connected to, they should not operate or blow for:
-
Faults on the primary feeder. If a network protector fails to open during a high-current backfeed, the limiters in tie circuits and secondary mains should be coordinated with the network protector fuse as discussed in Backfeed Currents for Primary Feeder Faults. Only the protector fuse should blow if the protector does not open on backfeed.
-
Currents resulting from the outage of any one primary feeder in systems designed for single contingency, and for the outage of any two primary feeders for systems designed for a double contingency.
-
Inrush currents from motor starting, or the inrush currents associated with picking up the entire network following its being dropped.
-
Faults in other secondary cables. That is, the cable limiters should be selectively coordinated so that only the limiters on the faulted section blow.
When cable limiters are installed in secondary mains, they cannot be coordinated selectively when more than two are in series. figure 38 shows two manholes that are connected with a secondary main, with an intermediate service box. In this figure, impedance ZEQ1, ZEQ2, and ZEQ3 are equivalent impedances for representing the remainder of the system. The coordination concerns presented here were disclosed to the author by Mr. Elie Chebli, retired manager of network engineering at Consolidated Edison.
For the configuration in figure 38 (a), manhole 1 and manhole 2 are connected with a single set of cables, with a service box at an intermediate point, and cable limiters at both ends of each segment. For a fault between manhole 2 and the service box, only limiters L3 and L4 should blow, but limiters L1 and L2 experience nearly the same or more current than limiter L3 due to load at the service box, and they also can blow. For this configuration, limiters should not be installed at the service box as shown in figure 38 (b).
In Backfeed Currents for Primary Feeder Faults were pictures of the lug limiter, both conventional and silver sand. and crabs with limiters. At the top of figure 39 is a picture of an in-line cable limiter with a cable socket at both ends. At the bottom is a molimiter with a cable socket on the left end, and on the right side is the conductor that is inserted into the mole and the connection made using a cone/socket assembly (not shown).
As indicated in Backfeed Currents for Primary Feeder Faults, one limitation of the conventional cable limiter is that its condition (blown or not blown) can’t usually be determined from visual observation. Detecting a blown limiter requires making clamp-on ammeter readings in the vault or manhole. However, as shown in Backfeed Currents for Primary Feeder Faults, limiters with visible fusible elements are now available.

Figure 38:
Conditions where cable limiters can and cannot be
coordinated.


Figure 39:
Cable limiter for joining cable to cable (top) and cable
limiter for connection to mole (molimiter).
Backfeed Currents for Primary Feeder Faults showed a picture of a silver-sand cable limiter (lug type) and crabs with non re-fusible limiters inside the crab. figure 40 shows how one utility uses silver-sand limiters to attach cables to bare copper bus in a 480-volt spot network.
Note from the application in figure 40 that lug type limiters are not used to attach the cables to the bus as there is not sufficient room on the bus. In-line limiters with short pieces of cable with a separate lug at one end of the cable allows staggering the limiters in this application. If lug limiters were used at the connections to the bus, the limiters would have to be spaced further apart at the connections to the bus.

Figure 40:
Silver-sand cable limiters for making connections to bus
in 480-volt spot network (photo by author).
Limiter Applications on Services
Cable limiters are sometimes installed on service cables from the manhole or service box to the point of service. When this is done, and there is either one or two cables per phase, the limiters should be installed only at the manhole end of each cable. When there are two cables per phase as in the bottom of figure 41, if limiters are installed at both ends of each cable, the limiters can’t be coordinated.

Figure 41:
Services with one or two cables per phase.
Assuming the fault is at the manhole end of one set of cables in Figure 41, the current in the limiter at the manhole end of the faulted cable, IF2, will be much greater than in the other limiters, shown as IF1, where the effect of load current is neglected. Then the cable limiter in the faulted cable at the manhole end will blow giving the condition shown at the bottom of figure 41, where now the current in all unblown limiters is IF3, which would be different than the current IF1. The three limiters seeing current IF3 can’t be coordinated, and no benefit is obtained by placing limiters at both ends of the service when there are just two cables per phase.
Similarly, it can be shown that if the fault is at the service end of one cable, the cable limiters can not be coordinated with two cables per phase.
But when there are three or more cables per phase in the service, as in figure 42, cable limiters should be installed at both ends of each cable as they can be coordinated for a fault in a single set of cables. With three or more sets of cable and the fault at the manhole end in figure 42, current IF2 in the limiter at the manhole end of the faulted set is much greater than that at the service end of the faulted set, shown as IF1. After the limiter in the faulted set at the manhole end blows, the current in the unblown limiter of the faulted set at the service end is IF3, and the current in each unblown limiter of the unfaulted sets is IF3/(N-1), where N is the total number of sets. Limiter coordination should be possible with 3 or more sets in the service.

Figure 42:
Service with three or more cables per phase.
Appendix 1 contains a detailed analysis of the fault current distribution in the limiters in radial services (reaches) consisting of two or more sets of phase-grouped cables. Given first are equations for finding the currents in the fault path and at each end of the faulted set of cables with no blown limiters. Included are curves showing the current in the limiters at each end of the faulted set, as the fault is moved from the manhole end to the service end before any limiters blow. Also included are curves showing the current in the limiter at the service end if the limiters at the manhole end have blown, and the current in the limiter at the manhole end if the limiter at the service end has blown.
Measures to Increase Currents For Bolted Faults
The higher the currents for faults in phase-grouped LV cable circuits, the more likely they will burn clear when cable limiters are not used. Or when cable limiters are installed, the more likely the cable limiter will interrupt, with the interrupting time decreasing as available fault current increases. Contained in this section is a simplified example, taken from the Westinghouse Distribution System Reference Book (1959) to illustrate measures to increase currents for faults in secondary phase-grouped cable circuits.
Considered are four configurations in a portion of a simple secondary system.
Base Design, One Set 500 kcmil Cables
figure 43 (a) shows the base design for illustrating the effectiveness of measures to increase the current for cable faults. There are two 300 kVA 5% impedance network transformers connected by 500 feet of 500 kcmil secondary main. The fault is at the end of the main near Source 2, and it is assumed that it burned clear if limiters are not used, or it melted the limiter at the end near Source 2. Regardless, the current into the fault from Source 1, IF, is 4250 amperes. From the burn-clear currents listed in Table 5, for 500 kcmil cable 5000 amperes should be available on both sides of the fault. The burn-clear criterion is not met.

Figure 43 (a):
Currents for bolted three-phase fault at Source 2
end with burn clear or blown limiter.
figure 43 (b) shows the time-current curve for the 500 kcmil cable limiter, from which it is seen that at 4250 amperes the cable limiter at source 1 end in figure 43 (a) has an operating time of 4.0 seconds at 4250 amperes, as indicated on figure 43 (b).
The Y15 fuse in the protector at Source 1, seeing 4250 amperes, should coordinate with the blowing of the 500 kcmil cable limiter at Source 1 end. Further, before the limiter at Source 2 end blew, or the fault burned clear, the current in the Y15 protector fuse at Source 2 was 16.7 kA, so the limiter at Source 2 end would clear the bolted fault in about 0.16 seconds.

Figure 43 (b):
Time-current curves for Y15 NWP fuse and 500 kcmil
cable limiter.
Alternated Design 1, Two Sets of 4/0 Cables
An alternate design for the system in figure 43 (a) is to install two sets of 4/0 phase grouped cables as shown in figure 44 (a).
Listed on the left-hand side of figure 44 (a) are the currents in the protector fuses and cable limiters before the fault at source 2 end on one set of cables is cleared from Source 2 end. figure 44 (b) shows the time-current curves for the Y15 protector fuse and the 4/0 cable limiter, with the currents in the protector fuses, after the cable limiter at source 2 end blows, and cable limiters marked with vertical lines. With cable limiters in the faulted set at Source 2 end, the cable limiter seeing 19.05 kA should clear before the protector fuse at Source 2 seeing 16.67 kA, and before the cable limiters in the unfaulted set seeing just 2.39 kA.
Assuming that cable limiters are not used at Source 2 end of the faulted cable set, the current on the Source 2 side, 19 kA, is way above the burn-off current of 2900 amperes for 4/0 cable (Table 5). Assuming either burn clear or blowing of the cable limiter in the faulted set at Source 2 end, the currents in the protector fuses and cable limiters are given on the right-hand side of figure 44 (a). These currents are marked on the time-current curves for the Y15 protector fuse, and 4/0 cable limiter curve in figure 44 (b). From this, it is seen that the 4/0 cable limiter in the faulted set at Source 1 end, seeing 2.852 kA will clear before the protector fuses at Source 1 and Source 2, seeing 2.444 kA and 0.408 kA respectively.

Figure 44 (a):
Two sets of 4/0 for secondary main, left side no
opens, right side open at Source 2 on faulted set.
Alternate Design 2, Two Sets of 4/0 Cable with Mid-Point Tie
Alternate Design 2, as shown in figure 45 (a), is very similar to that in figure 44 (a), except at an intermediate manhole between Sources 1 and 2 the cables are joined together with either buses, moles, or crabs. The effect of this is to increase the current for burn-off, or to reduce the clearing time when cable limiters are installed.
The left-hand side of figure 45 (a) gives the currents in the limiters and the network protector fuses for a fault on one set of cables at Source 2 end, before burn clear or limiter blowing. The current into the fault on the Source 2 side is 19.05 kA, which is above the 2900 amperes needed for burn-off, and would result in rapid limiter blowing if installed. figure 45 (b) shows with the blue-colored curve the 4/0 limiter time-current characteristic.

Figure 44 (b):
Fuse and limiter currents after burn clear or
blowing of limiter at Source 2 end.

Figure 45 (a):
Fuse and limiter currents, left side before and
right side after burn clear or limiter operation.
The right-hand side of figure 45 (a) lists the currents in the cable limiters and cables after the limiter for the faulted cable near Source 2 end blows, or if limiters are not installed, the current after the fault burns clear from Source 2. First, if limiters are not used, the current into the fault from Source 1 is 4318 amperes, which is significantly above the burn-off current of 2900 amperes (Table 5) for 4/0 copper cable.
figure 45 (b) shows the time-current curves for the Y15 network protector fuse, and the 4/0 cable limiters. Shown with the vertical blue lines are the currents in the cable limiters after the limiter on Source 2 end of the fault has opened. From this and figure 45 (a), it is seen that the melting time of the limiter at the intermediate manhole end of the faulted cable at 4318 amperes is 1.2 seconds. The current in the two limiters at the 4/0 cables at Source 1 end is 1314 amperes, with a corresponding melting time of about 30 seconds from figure 45 (b).,
Thus, it is clear from the time-current curves in figure 45 (b) that by having the cables tied at an intermediate manhole, it results in a significant increase in current to allow the fault to burn clear if cable limiters are not installed. And when cable limiters are used, selective coordination is possible so that the only limiters to blow would be those at opposite ends of the faulted section.

Figure 45 (b):
Fuse and limiter currents after burn clear or
blowing of limiter at Source 2 end.
Currents for Bolted, Arcing, and Intermittent Faults
When using most short-circuit programs to find the currents for faults on secondary cable circuits, the programs usually give the currents for a bolted or zero-impedance fault. The currents obtained are the maximum currents that can flow in the fault path and in cables on opposite sides of the fault. But experience has shown that many faults in secondary cable circuits with phase-grouped cables are not bolted, but arcing and intermittent in nature. The current associated with arcing faults have an rms value that is much less than the rms value for a bolted fault, and may not blow the cable limiters. However, with the arcing at the fault point, tremendous energy is released at the fault point which can produce explosive gases through pyrolysis of cable insulation and duct material, which can migrate to manholes and explode, resulting in displacement of manhole covers.
This is a problem which has always existed in 208Y/120-volt secondary networks. Back in the early 1960’s, one solution proposed for detecting the intermittent arcing fault was the half-section limiter, as shown in figure 46. The conventional full-section limiter is shown on the left-hand side of the figure. The full section limiter in figure 46 (a) was made from a tubular copper conductor, where the fusible section was formed by flattening of the center section and forming the fusible portion as shown. So, in effect the fusible portion consisted of two halves. The half-section limiter on the right-hand side in figure 46 (b) was made by removing one half of the fusible section of the full limiter.

Figure 46:
In-line limiters (A) conventional and (B) half section.
The thought behind the half section limiter was that some faults, which are arcing in nature, start as high current faults, so by having less copper in the fusible section the half-section limiter might detect and clear the fault in its early stages. At the time of its development (Weed and Matthysse), it was recognized that it would not coordinate as well with the network protector fuse during backfeeds to faults on the primary feeder where the protector failed to open. Another concern with the half section limiter was that it was not as strong physically as the full-section limiter, and could be damaged during handling and installation. Other concerns with the faster acting limiter are found in (Weed and Matthysse). The existence of this work more than 50 years ago just highlights that the problem of detecting and clearing arcing faults in 208Y/120-volt cable circuits is not a new one.
Bolted Fault Currents
At any point in the low-voltage portion of the system, the current in the fault path for the bolted three-phase fault, I3ϕ, is given by eq (60).
(60)
$$ \ \ \ I_{3\phi} = \frac{E_{LN}}{Z_{1-THEV}} Amperes $$
Where:
ELN = Line-to-neutral voltage at fault point prior to fault, in volts, typically 120 volts or 277 volts.
Z1-THEV = Thevenin positive-sequence impedance at the fault point in ohms.
For a bolted fault between any two phase-conductors, the current in the fault path, Iϕ-ϕ, is 86.6% of the current for the three-phase fault.
(61)
$$ \ \ \ I_{\phi - \phi} = \frac{\sqrt{3}}{2} \frac{E_{LN}}{Z_{1-THEV}} Amperes $$
For the bolted single line-to-ground, SLG, (neutral) fault in the secondary system, the current in the fault path, ISLG, is given by eq (62).
(62)
$$ \ \ \ I_{SLG} = \frac{3E_{LN}}{2Z_{1-THEV} + Z_{0-THEV}} Amperes $$
Where:
Z0-THEV = Thevenin zero-sequence impedance at the fault point in ohms.
With a phase-grouped cable circuit having a full-sized neutral in the same duct with the phase conductors, using 500 kcmil cables, the ratio of the zero-sequence to the positive-sequence impedance of the cable circuit is about 3. If the Thevenin impedances at the fault point were due just to cable impedance, eqs (60) and (62) show that when Z0-THEV equals three times Z1-THEV, the current in the fault path for the bolted SLG fault, ISLG, is 60% of the current for the bolted three-phase fault, I3ϕ. The SLG fault current can be even less than 60% of the three-phase fault current.
The significance of this, when determining cable limiter response, is that fault type has a big impact on the currents in the cable limiters, and the time for the limiter to melt for bolted faults, and for arcing faults.
Arcing Fault Currents in LV Systems
Many faults in low-voltage secondary networks are not bolted. Or, if the fault starts as a bolted fault, it quickly changes into an arcing fault, where interspaced with the periods of arcing are periods where there is no current flow due to arc extinction. The effect of the arc voltage at the fault point is to reduce the rms value of the current during periods of arcing, and the effect of intermittency of the arcing is to cause a further reduction in the rms value of the arcing fault current compared to that for a bolted fault. With intermittent arcing, during the arcing periods, there can be significant energy released at the point of fault, being equal to the time integral of the arc voltage and the current in the arc path. The arc energy produces temperatures that result in pyrolysis of cable insulation and duct material, and burning of insulation. The gases produced from this can be explosive.
Table 6 lists some of the gasses produced when cable insulation is decomposed in air at 500oC, which is below the flame temperature of most combustible gases (L. Zhang, et.al, 2009).
Table 6:
By Products of cable insulation decomposed in Air at
500oC
| By Product | Percentage | Comment |
|---|---|---|
| H2O – Water | 26.08% | |
| H2 - Hydrogen | 27.98% | Highly flammable, burns in air in concentrations of 4% to 75% by volume |
| CO2 – Carbon Dioxide | 41.78% | |
| CH4 - Methane | 3.84% | Lighter than air, flammable in concentrations between 5.4% to 17% in air at atmospheric pressure |
| C2H4 - Acetylene | 0.14% | Highly flammable, can decompose explosively if absolute pressure exceeds 29 psi |
| C2H6 - Ethane | 0.17% | Flammable at room temperature, explosive mixture with air at 3.0% to 12.5% by volume. |
The basis for the approach for estimating the rms value of the sustained arcing fault is found in a 1941 paper by O. R. Schurig titled, “Fault Voltage Drop and Impedance at Short-Circuit Currents in Low-Voltage Circuits” (Schurig 1940).
figure 47 shows an equivalent circuit for finding the current for both a bolted fault, and a sustained arcing fault, where the arc voltage is assumed to be a perfect square wave, and that following each current zero the arc re-strikes. Schurig developed an expression for the current for a sustained arcing fault in terms of the rms value of the system voltage, ES, in figure 47, the circuit resistance, R, the circuit inductive reactance, X, and the rms value of the fundamental frequency component of the arc voltage, where it is assumed the arc voltage is a perfect square wave having a peak value of VP-ARC, with the fundamental frequency component of the arc voltage having an rms value of VA-RMS as shown in Figure 47

Figure 47:
Equivalent circuits for bolted fault and sustained
arcing fault.
From the calculated current in the fault path for the bolted fault, as found from short circuit programs, the current for the sustained arcing fault can be estimated by applying a factor to the bolted fault current when the arc voltage is known. This is a theoretical approach, which is based on the factors affecting current during sustained arcing between electrodes in air, and gives some insight and an upper bound on the currents for sustained arcing faults in cable circuits.
The assumptions listed below are made in the theoretical analysis.
-
The arc voltage at the point of fault is a perfect square wave as shown in figure 47, having a peak value of VP-ARC, as shown by the red-colored square wave in figure 47. The arc is very non-linear, but tests show that, with sustained arcing where the arc restrikes following each current zero, the arc does appear similar to a square wave (Hamel et. Al 2004)
-
During periods of arcing, the arc immediately restrikes following each current zero. That is, the transient recovery voltage across the arc space after current zero is sufficiently high to immediately cause a restrike.
-
The arc is purely resistive, such that it only absorbs energy.
What is done in this section is to take the expression Schurig developed for the rms value of the arcing fault current, and divide this by the expression for the rms value of the bolted fault current. This gives an expression for the ratio of the rms value of the sustained arcing fault current, IARC, to the rms value of the bolted fault current, IB.
Whenever the current in the fault path is known for either the three-phase bolted fault, the single line-to-ground (neutral) bolted fault, or the phase-to-phase bolted fault, the system at the fault point can be represented with the Thevenin equivalent shown in figure 47. With reference to figure 47, if the fault were a bolted fault, the current would be:
(63)
$$ \ \ \ I_{B} = \frac{E_{S}}{\sqrt{R^2 + X^2}} Ampheres \enspace rms $$
The values to use for R, X, and ES in eq (63), as a function of fault type are given in Table 7. These values should be in ohms, and ES in volts.
Table 7:
Thevenin voltage and impedances for fault calculations
with Equation (63).
FAULT TYPE |
THEVENIN VOLTAGE ES (Volts) |
THEVENIN RESISTANCE R (Ω) |
THEVENIN REACTANCE X (Ω) |
|---|---|---|---|
| 3-Φ | Φ-TO-NEUTRAL Ie (120 V, 277 V) |
R1 (“+” Sequence) |
X1 (“+” Sequence) |
| SLG | Φ-TO-NEUTRAL Ie (120 V, 277 V) |
2(R1 + R0)/3 | 2(X1 + X0)/3 |
| Φ- Φ | Φ-TO- Φ Ie (208 V, 480 V) |
2R1 | 2X1 |
Note:
R0 and X0 are the Thevenin zero-sequence resistance and zero-sequence reactance at the fault point
R1 and X1 are the Thevenin positive-sequence resistance and positive-sequence reactance at the fault point
When the perfect square wave voltage is introduced into the circuit of figure 47, the total arcing fault current consists of the fundamental frequency component, plus the odd harmonics. The fundamental frequency component of the arc voltage is “in-phase” with the “IR” drop in the circuit. It can be shown that the rms value of the fundamental frequency component of the total arcing current is not less than 95% of the rms value of the total arcing current. Practically, the effects of the harmonics on the rms value of the arcing current can be neglected.
From the circuit of figure 47, it can be shown that, for the sustained arcing fault, where the arc restrikes following each current zero, and the arc voltage is constant, the ratio of the rms value of the fundamental frequency component of the sustained arcing fault current, IARC, to the rms value of the current for a bolted fault, IB, is given by eq (64).
Equation (64) is the same as the equation found in (Schurig 1941), except that eq (64) gives the rms value or the fundamental frequency component of the arcing fault current, (IARC) in per unit of that for the bolted fault (IB). The other terms appearing in eq (64) are:
X/R = Ratio of the reactance to the resistance of the equivalent circuit in figure 47 (See Table 7).
ES = RMS value of the source voltage in the equivalent circuit in figure 47 (See Table 7)
VA-RMS = RMS value of the fundamental frequency component of the square-wave arc voltage shown in figure 7. In terms of the peak arc voltage, VP-ARC, this is equal to:
(64)
$$ \ \ \ \frac{I_{ARC}}{I_{B}} = \frac{V_{A-RMS}}{E_{S}} \frac{1}{\sqrt{1 + (X/R)^2}} * [-1 + \sqrt{\frac{E_{S}^2}{V_{A-RMS}^2} (1 + (({X/R})^2)) - ({X/R})^2}] $$
(65)
$$ \ \ \ V_{A-RMS} = \frac{2\sqrt{2}}{\pi} V_{P-ARC} $$
From eq (65), for practical purposes the rms value of the fundamental frequency component of the arc voltage, VA-RMS, is 0.90 times the peak value of the square-wave arc voltage, VP-ARC.
Equation (64) predicts that the ratio of the rms value of the sustained arcing fault current, IARC, to the rms value of the bolted fault current, IB, is independent of the available fault current. Furthermore, given the current for the bolted fault, it gives an upper bound of the rms value for the sustained arcing fault current. The reason that it is an upper bound is it was assumed that the arc restrikes following each current zero. Everything else equal, the higher the available bolted fault current the higher the sustained arcing fault current, assuming that the available fault current has no impact on arc length and arc voltage. For a fuse or cable limiter of a given size, the higher the available bolted fault current the more likely it will blow for an arcing fault.
It is emphasized that eq (64) assumes that the arc restrikes following each current zero, so that, in effect, steady-state conditions exist during the arcing. In 480-volt circuits when arcs are established between electrodes in air with narrow electrode separation, tests have shown this can be true. Furthermore, results of arcing faults in 480-volt circuits in air, where the arc voltage is measured, show that the theoretical analysis provides a good estimate of the effect of the arc on the rms value of the sustained arcing fault current (Stanback 1977).
In single-phase circuits operating at 120-volts rms, 170-volts peak, if an arc is established between electrodes in air, there is insufficient recovery voltage to re-establish the arc following a current zero (Browne 1965). This might be interpreted to mean that arcing faults could not occur in 120/208-volt phase-grouped cable circuits in ducts. However, when a fault occurs in cable circuits in ducts, the position of the electrodes (cable conductors) between which arcs are formed is not fixed. When a fault current is established, perhaps due to contact between phases, or insulation tracking, magnetic forces between conductors can cause the conductors to move apart, producing the arc. Or the arc may be formed by fusing of the fault initiator. If the current in the arc is interrupted, the conductors can then move back together to re-establish the arc. Or insulation surfaces between the separated conductors may track, and re-establish the arc. Furthermore, with arcing in 208Y/120-volt cable circuits in ducts, molten copper, copper vapor, or other materials are generated that may help to sustain the arc and allow re-ignition following current zero.
Tests have shown that when arcing is intermittent, the current during the different arcing periods is not the same, due to different arc voltage. The conditions for faults in cables in conduit are not those of the laboratory where the arc is between electrodes in air. Regardless, eq (64) yields an estimate of the effect of arcing on fault currents in 208Y/120-volt cable circuits in ducts, consistent with values given in the literature (Weed and Matthysse).
figure 48 plots the ratio of the rms value of the sustained arcing fault current, IARC, to the rms value of the bolted fault current, IB, as a function of the peak arc voltage, shown as VP-ARC, in figure 47. It applies when the circuit driving voltage, ES in figure 47, is 120 volts rms. Curves are included for different X to R ratios. For a given peak arc voltage, the lower the circuit X to R ratio, the lower the rms value of the sustained arcing fault current.

Figure 48:
Ratio of the rms value of the sustained arcing fault
current, IARC, to bolted fault current, IB, as
function of circuit X to R ratio and peak arc voltage, system
line-to-neutral voltage ES = 120 volts rms.
The fundamental frequency component of the square-wave arc voltage, which acts as a back voltage to limit the current, is always in-phase with the IR drop of the circuit, or in quadrature with the IX drop in the circuit for sustained arcing. As the arc voltage drop opposes the system driving voltage attempting to cause current flow, an arc voltage of given magnitude has more effect in reducing fault current in circuits with a low X to R ratio.
To estimate arcing fault current with the curves of figure 48, requires assuming a value for the peak arc voltage at the fault point.
The total arc voltage, for arcs between metal electrodes in air at atmospheric pressure, consists of a drop at the anode and cathode region, plus the voltage drop in the arc column. For metal electrodes, the sum of the voltage drop at the anode and cathode regions is in the range of 20 to 40 volts peak (Browne 1965). The voltage drop in the arc column of longer arcs, in air at atmospheric pressure, is also in the range of 30 to 40 volts per inch of arc length (Strom 1946). For arcs in air between fixed electrodes, estimates can be made for the arc voltage if the separation of the electrodes is known. The minimum is when the arc length is the separation between electrodes, but arc length can be longer due to magnetic effects. For arcs between conductors in the confines of a duct, arc lengths are limited because of physical spacing and constraints imposed by the duct. In estimating peak arc voltage, the arc length can be greater than the distance separating the two electrodes where the arc terminates.
With arc length limited to less than an inch, figure 48 suggests that current for the sustained arcing fault may be between 60% and 90% of the bolted fault current, assuming it restrikes after each current zero. Sustained arcing faults may blow cable limiters, but experience and tests show arcing faults typically are intermittent in nature, with short periods of arcing, and rather long periods where there is little to no current flow.
Intermittent Arcing Faults
Such a fault condition is represented in figure 49 where it is assumed that the arc exists for time TARC, and is extinguished for time, TTOTAL-TARC. With IARC being the rms value of the current during the arcing period, TARC, the rms value of the total current wave in figure 49 is:
(66)
$$ \ \ \ I_{Total} \sqrt{\frac{T_{ARC}}{T_{TOTAL}}} I_{ARC} $$

Figure 49:
Current wave for intermittent arcing fault.
From eq (66), intermittency in the arcing can significantly reduce the effective value of the arcing fault current. This, combined with the effect of arc voltage in lowering current, and the lower current associated with the SLG faults versus the three-phase fault, suggests why arcing faults in 208Y/120-volt cable circuits may not blow cable limiters, or they blow only after extensive arcing. Or the fault may possibly burn clear before the cable limiters blow.
System to Illustrate Effect of Arcing on Fault Current
To provide a basis as to why cable limiters may not blow for intermittent arcing faults, the system in figure 50 will be analyzed. It is assumed that a fault has occurred close to Manhole 2, and all three cable limiters at the Manhole 2 end have blown. To clear the fault requires that the cable limiters at Manhole 1 blow.
The secondary main from Manhole 1 to Manhole 2 is made with 500 kcmil phase-grouped cables with a full size neutral. After the circuit opens at Manhole 2 end, the available three-phase and single line-to-ground (SLG) fault currents available at Manhole 1 are 25 kA and 20 kA respectively. The X1 to R1 ratio is 2.0, and the X0 to R0 ratio is 1.2. The distance from Manhole 1 to the fault will be varied for the different fault conditions. The resistance of the 500 kcmil conductor is 0.02468 Ω/1000 feet at 50o C, but for the fault current calculations the resistance was corrected for a conductor temperature of 250o C, to give a lower bound on the fault currents.

Figure 50:
Circuit for bolted and arcing fault current
calculations.
figure 51 shows the time-current characteristic of 500 kcmil cable limiters that could be installed at Manhole 1 end. With the conventional limiter as shown by the red-colored curve, the limiter blowing time is over 1000 seconds at 1.5 kA.

Figure 51:
Time-current characteristics of 500 kcmil limiters,
figure 52 plots the current in the cable limiters at Manhole 1 versus the distance from manhole 1 to the fault (at Manhole 2) for different fault types, and for both solid faults, continuously arcing faults, and intermittently arcing faults. For the arcing faults, it is assumed that the voltage drop at the anode and cathode regions is 35 volts, and the length of the arc in the column is 0.5 inches.
The solid red-colored curve in figure 52 plots the current for the bolted three-phase fault versus distance, and the solid green-colored curve plots the current for the bolted SLG fault at Manhole 2. For either bolted fault, the 500 kcmil limiter would blow, but at the longer circuit lengths the time is quite high. The solid blue curve shows the rms value of the current for an arcing single line-to-ground fault, where the arcing is continuous with a restrike following each current zero. For a circuit length of 400 feet, the rms value of the continuous arcing current is slightly above 1.5 kA, and the limiter at Manhole 1 end most likely would not melt in 1000 seconds.
But if the arcing SLG fault were conducting just 50% of the time, the rms value of the current seen by the cable limiter is that shown by the orange-colored curve in figure 52. For a circuit length of 400 feet, the limiter would never blow for this fault condition. Finally, the purple-colored curve gives the rms value of the arcing fault current when the conducting time is 10% of the total period (TARC over TTOTAL in figure 49 is 0.10). For this condition, if the circuit length were 150 feet, the cable limiter in the faulted phase at Manhole 1 would never blow.

Figure 52:
RMS vaule of fault currents versus circuit length, for
35 volts drop at anode and cathode, and arc column length of 0.5 inch.
The intent of this exercise is to provide an analytical basis to demonstrate why cable limiters may not blow for intermittent arcing faults in 208Y/120-volt cable circuits in ducts. And with these arcing faults not being cleared by blowing of cable limiters at both ends of the circuit, explosive gases are produced, as listed in Table 6, from pyrolysis of cable insulation and duct material, with the result that explosions can develop in manholes with the ejection of the manhole cover.
figure 53 is a picture of the effects of such an event which occurred on the Hydro-Quebec system. This was not a conventional low-voltage network system, but a system with radial secondaries. Quoting from this article, “In certain conditions, the gases generated by materials adjacent to the arcing fault can result in violent explosions. Although these events are relatively infrequent on Hydro-Quebec’s low-voltage distribution systems, their consequences could be serious for public safety and for the installations. The protection systems installed on the network, such as fuses and circuit breakers, are ineffective at eliminating this type of fault, which is often intermittent, develops randomly and may occur over a long period”.

Figure 53:
Manhole event on the Hydro-Quebec System (from tdworld
magazine, November 2013)
The last sentence also applies to faults in 208Y/120-volt low cable circuits in secondary network systems which are protected with cable limiters, which are a type of fuse. And as mentioned before, one approach considered back in the 1960’s to clear these faults was the half-section cable limiter.
Slotted Manhole Covers
One approach selected by some utilities is to install slotted manhole covers rather than solid manhole covers. The benefits of the slotted cover are that, if explosive gasses accumulate in the manhole from sustained arcing in secondary circuits, some of the gasses are lighter than air and will vent from the manhole. Also, if an explosion does occur, the venting in the manhole cover will reduce the pressure and force exerted on the slotted cover, and limit its displacement. Figure 54 shows pictures of four slotted manhole covers, being on the systems, from top to bottom, of Consolidated Edison in New York, Potomac Electric Power Company (PEPCO) in Washington DC, Hawaiian Electric Company (HECO) Honolulu, and National Grid in Albany NY.
One concern with the use of slotted manhole covers versus solid covers is that more contaminates can enter manholes with slotted covers, possibly increasing the chance and the establishment of low-current arcing faults in secondary cables. This is a concern in northern climates where snow melting salts are used on roadways in winter months. One large user of secondary networks has observed a direct correlation between the amount of salts put on roadways by the city and the number of faults in secondary cables.
One manufacturer of slotted covers, Novinium, developed a slotted cover with features designed to limit the flow of liquids into the manhole, especially to control the ingress of saltwater. figure 55 shows a cover without water control features on the left, and the cover design intended to limit the ingress of saltwater into the manhole.


Figure 54:
Examples of slotted manhole covers (top 3 photos by
author, bottom courtesy of Dan Durbak).

Figure 55:
Slotted manhole cover, and cover with water control
features (From Eaton’s 2017 Electrical Network Systems Conference,
courtesy Novinium).
Manhole Cover Designs to Prevent Ejection
Manhole cover designs have been developed to help prevent ejection of the cover for all but the most violent explosions in the manhole. In a collaborative effort, EPRI and the Detroit Edison Company developed a novel manhole cover design that will vent high pressures from explosions, without the manhole cover being raised from its frame by more than several inches. The design includes a locking mechanism consisting of two latches: a fixed latch and an adjustable breakaway latch equipped with two shear pins. In the event of a minor explosion, the mechanism allows the cover to rise about 2 inches to relieve the pressure of the explosion, and then fall back into its frame. In the event of a powerful event, the primary pin may shear and allow the cover to rise another inch or so to provide additional relief. In a rare major explosion in the manhole, the secondary pin may shear to release the cover from its frame, in which case unavoidable collateral damage may result, according to the EPRI document describing the cover system (EPRI 2008).
figure 56 shows three pictures of the design, installed on three different systems. At the top is a cover on the Detroit Edison system, in the middle is a cover in the system of Pacific Gas and Electric, and on the bottom is cover in the Indianapolis Power and Light system. Not only are these covers designed to minimize the chance of being ejected, but these designs minimize the entrance of air into the manhole following the initial explosion, thereby preventing a secondary explosion within the manhole. As seen from the pictures, these covers are the SWIVELOC design.
Another manhole cover design intended to eliminate the inherent dangers of flying covers is shown in figure 57. During an explosive event the upward travel of the cover, as illustrated in the bottom half of the figure, is limited to a maximum of 4 inches by an engineered lug and latch. With the help of specially designed exhaust ports the pressure is released 360o downward around the perimeter of the manhole cover.
Utilities looking at steps to take to reduce the chance of manhole covers being ejected from explosions in manholes from arcing in secondary cables, should consult the many references available on this subject, including literature of manufacturers of manhole covers.


Figure 56:
Manhole cover designs intended to limit displacement for
all but the most powerful explosions (bottom two photos by author, top
courtesy Swiveloc).
Determination of Secondary Main Currents During Line End Faults.
When short-circuit programs provide currents for a three-phase bus fault in the secondary network (fault at a junction point), typically they give the current in the fault path, and in secondary mains connected to the faulted bus (node), and in secondary mains connected to unfaulted buses (nodes) that are nearby. In figure 58 (a), the fault is on a cable circuit connecting buses 1 and 2, with the fault at the end adjacent to bus 2. IF is the current in the fault path, and Icable is the current in a cable circuit between buses 1 and 2. There may be other circuits between nodes 1 and 2, but they are not shown. The short-circuit program would give IF, and the current in the cable between buses 1 and 2, Icable. The current in the segment between bus 2 and the fault is IF – Icable. This is the current for burn-off from bus 2, or the current to blow cable limiters at bus 2 end of the faulted cable.


Figure 57:
Controlled pressure release manhole cover (courtesy
Neenah Foundry).
Assuming that the fault either burns clear from bus 2, or blows limiters between bus 2 and the fault, as determined from the value of current, IF – Icable , the fault is still supplied from bus 1, as shown in figure 58 (b). The current in the cable from bus 1 is designated as Icable-LE. The condition shown in figure 58 (b) is sometimes referred to as a line-end (LE) fault.
In the following, it is shown that the current in the cable following clearing from bus 2, Icable-LE , is equal to or greater than the current in the cable between bus 1 and bus 2 prior to clearing from bus 2, Icable. Thus, if Icable prior to separation from bus 2, either by burning clear or blowing of the cable limiters at bus 2 end, is high enough to burn clear from bus 1 end or gives satisfactory operation of limiters at bus 1 end, there is no need to determine the current in the cable for a line-end fault, Icable-LE. But if Icable is not high enough to burn clear or provide satisfactory limiter operation at bus 1 end, then the line-end fault current, Icable-LE, is required for evaluation.
The following describes a methodology and equations for determining the ratio of Icable-LE to Icable, when the currents and voltages are available for bus faults at both ends of the cable circuit of interest.
The actual system modeled in the short-circuit program consisting of “N” buses, can be reduced to a two-bus equivalent, where the retained buses are those between which the cable circuit of interest is connected, bus 1 and bus 2 as in figure 59. The exact short-circuit equivalent (neglecting load impedances) is given in figure 59 (c) where there are three equivalent impedances, Z11eq, Z22eq, and Z12eq, and the pre-fault voltage, EF, where it is assumed that the pre-fault voltage at each bus in the secondary system is the same. This is valid when the effects of load are neglected. From the exact equivalent circuit of figure 59 (c), it can be shown that Icable-LE is always greater than Icable. An expression for the ratio of Icable-LE to Icable is given below.

Figure 58:
(a) Fault on cable between buses 1 and 2, adjacent to
bus 2, before the fault burns clear or blows limiters at bus 2; and (b)
after fault burns clear or blows limiters between bus 2 and fault.
To obtain the equivalent of figure 59 (c), the short circuit results from two faults on the actual network are required. First, a short circuit is plased on bus 1, as shown in Figure 59 (a), and the current in the fault path, I11, and the voltage on bus 2, V2, are obtained. Second, a short circuit is placed on bus 2, as shown in Figure 59 (b), and the current in the fault path, I22, and the voltage on bus 1, V1, are obtained.
With these two currents and voltages from the short-circuit on the actual system (all branches modeled including the cable circuit of interest between buses 1 and 2 having impedance Z12cable. Equation (66) is solved to find equivalent admittances Y11eq and Y22eq. These are the admittances of equivalent impedances Z11eq and Z22eq respectively in figure 59 (c).

Figure 59:
(a) and (b) Voltages and currents needed from
short-circuit study of the actual system to generate equivalent in (c),
and exact short circuit equivalent with buses 1 and 2 retained.
(66)

In eq (66): test
I11 = Current in fault path for fault on bus 1
V2 = Voltage on bus 2 for fault on bus 1
I22 = Current in fault path for fault on bus 2
V1 = Voltage on bus 1 for fault on bus 2
After admittances Y11eq and Y22eq are found from solution of eq (66), admittance Y12eq for the equivalent circuit in figure 59 (c) is found from solution of either eq (67) or eq (68).
(67)
$$ \ \ \ Y_{12eq} = \frac{(E_{F} - V_{2})Y_{22eq}}{V_{2}} $$
(68)
$$ \ \ \ Y_{12eq} = \frac{(E_{F} - V_{1})Y_{11eq}}{V_{1}} $$
The impedances in the equivalent circuit of figure 59 (c) are found from the equivalent admittances as follows:
(69)
$$ \ \ \ Z_{11eq} = \frac{1}{Y_{11eq}} , \enspace Z_{22eq} = \frac{1}{Y_{22eq}} , \enspace Z_{12eq} = \frac{1}{Y_{12eq}} $$
To generate the equivalent circuit of figure 59 (c), the impedance of all elements in the system, and all impedances between buses 1 and 2 in figure 59 (a) or (b) must be included in the short-circuit calculations to find the currents (I11 and I22) and voltages (V1 and V2). That is, equivalent impedances Z11eq, Z22eq, Z12eq include the effect of all impedances in the system and the impedance of the cable circuit between buses 1 and 2 that is of interest, Z12cable.
With the exact equivalent for the entire system between buses 1 and 2 as in figure 59 (c), the equivalent circuit of figure 59 (c) can be modified to include the impedance of the actual cable circuit between buses 1 and 2, Z12cable, and a modified equivalent impedance, Z12eq-MOD between buses 1 and 2 as shown in figure 60 (a) (a). In figure 60 (a), the modified equivalent impedance, Z12eqMOD is found from solution of eq (70)
(70)
$$ \ \ \ Z_{12eq} = \frac{Z_{12eq-MOD} Z_{12cable}}{ Z_{12eq-MOD} + Z_{12cable}} $$
Solution of eq (70) gives:
(71)
$$ \ \ \ Z_{12eq-MOD} = \frac{Z_{12eq} Z_{12cable}}{Z_{12cable} - Z_{12eq}} $$
From the equivalent circuits in figure 60 (a) and (b), equations can be written for the current in the cable circuit between buses 1 and 2 before separation from bus 2 (Icable), and for the cable circuit current after separation from bus 2 (Icable-LE). From these equations, a ratio is formed between the current in the cable circuit after separation from bus 2, Icable-LE, and the current in the cable circuit prior to separation, Icable, of the cable circuit from bus 2. Equation (72) gives this ratio.

Figure 60:
Fault on cable circuit adjacent to bus 2 (a) before
limiter blows or cable burns clear from bus 2, and (b) after limiter
blows or burns clear from bus 2.
If the magnitude of the right-hand side of eq (72) is greater than 1.0, then the current in the cable circuit increases following separation from bus 2, such separation occurring because of either burn clear or cable limiter blowing at the bus 2 end of the cable circuit.
(72)
$$ \ \ \ \frac{I_{cable-LE}}{I_{cable}} = \frac{(\frac{Z_{12eq-MOD}}{Z_{11eq}} + \frac{Z_{12cable}}{Z_{11eq}})(1 + \frac{\frac{Z_{12eq-MOD}}{Z_{11eq}} \frac{Z_{12cable}}{Z_{11eq}}}{ \frac{Z_{12eq-MOD}}{Z_{11eq}} \frac{Z_{12cable}}{Z_{11eq}} } )}{\frac{Z_{12eq-MOD}}{Z_{11eq}} (\frac{Z_{12cable}}{Z_{11eq}} + \frac{ \frac{Z_{12eq-MOD}}{Z_{11eq}} \frac{Z_{22eq}}{Z_{11eq}} }{ 1 + \frac{Z_{22eq}}{ 11eq } + \frac{Z_{12eq-MOD}}{Z_{Z_{11eq}}} } )} $$
In eq (72), all of the equivalent impedances in the circuit of Figure 60 (a) and the impedance of the cable circuit of interest between bus 1 and 2, Z12cable, are divided by the impedance of the equivalent source connected to bus 1, Z11eq. This allows plotting the current ratio given by eq (72) in the cable between buses 1 and 2 as a function of the impedances in the equivalent circuit in figure 60 (a) in per unit of Z11eq.
figure 61 plots the cable current ratio versus the ratio of Z12cable to Z11eq for the case where the “equivalent sources” connected to bus 1 and bus 2 are of equal strength (Z22eq = Z11eq). Curves are given for different ratios of Z12eq-MOD to Z11eq. In plotting the curves, it is assumed that all impedance angles are equal, although this assumption would not be required when making the calculations with specific data from short-circuit studies.

Figure 61:
Ratio of cable current after clearing from bus 2 to
cable current before clearing from bus 2, with Z22eq =
Z11eq.
With a very strong tie between buses 1 and 2, excluding the effect of the actual cable circuit having impedance, Z12cable in Figure 60, the current in the cable circuit following separating from bus 2 , Icable-LE, will rise significantly, which will help to either burn clear from bus 1, or blow cable limiters at bus 1.
With a very weak tie between bus 1 and bus 2, excluding the effect of the actual cable circuit, the current in the cable circuit following separation from bus 2 does not change significantly. However, the current ratio is always greater than 1 as shown in figure 61.
Designs to Increase Available Fault Currents
If studies show there is inadequate current available to burn clear when limiters are not present, or if there is insufficient current to blow cable limiters, the following measures can be evaluated to increase fault currents and obtain the desired operation.
Install additional secondary mains if duct space is available.
-
If cable limiters are not installed, install them. However, when some secondary mains have limiters and others do not, it is difficult or impossible to coordinate cable burn clear on solid faults in circuits without limiters with the limiters in adjacent circuits. That is, for a solid fault on secondary main without limiters, the clearing time of limiters in adjacent secondary mains can be determined, but there is uncertainty in the burn-clear time for the faulted secondary main
-
Install additional network transformer capacity, or increase the size of the network transformer if the vault space is available. For example, replace a 500-kVA transformer with a 750-kVA transformer. This approach usually is the most costly.
4.10 - Network Protector Relaying
NETWORK PROTECTOR RELAYING
In the paper titled, “Evolution of the Automatic Network Relay,” published in 1926 (Parsons 1926), Parsons stated that, “The a-c network unit has been developed to connect these transformers to the network, and the brains of the unit, which is the automatic network relay, is described in this paper. This relay not only opens the network breaker whenever there is trouble in any of the high-tension equipment or when the power feeds back into the high-tension feeder but also recloses the breaker when conditions are restored to normal and the feeder is in condition to supply power to the network.” Although significant changes have been made to the network relays for controlling the automatic tripping and reclosing of the network protector, network relays still perform the same basic functions and are still the brains of modern network protectors.
Background
Early LV network systems with automatic network units were not for the three-phase four-wire network systems as operated today, but for single-phase three-wire systems operating at 110/220 volts, with the network unit having just two poles. The relay controlling the network unit was designed with a potential coil connected on the network side of the main contacts, two current coils, and two phasing coils (Parsons 1926). Current was supplied to the relay current coils, not with current transformers, but with resistive shunts. These shunts were designed to allow the relay to operate under low-magnitude reverse-magnetizing currents, yet they would saturate under normal load currents and high-magnitude backfeed currents, so that the current coils of the relay were not damaged. Further, it was recognized that under normal conditions the relay would have to operate with phasing voltages (voltages across open contacts of the protector) of very small magnitude, in the range of 1 volt, yet the phasing coils would have to be able to withstand twice normal line-to-ground voltage in the event that phases were reversed on the primary side (Parsons 1925).
Parsons further stated a cardinal principle needed to understand the basis for the close characteristics of relays that control the operation of the network protector. “The current which flows in the protector after the network breaker closes lags the phasing voltage (the voltage across the open contacts of the protector before it closes) by an angle approximately equal to the impedance angle of the system.” The basis for this and its importance is discussed in Time Delay Tripping of Network Protectors of this chapter.
When the three-pole network protectors were first developed, they were controlled with three single-phase network relays, similar to those used on single-phase two-pole network protectors. Various closing and tripping characteristics were possible (Parsons 1926) in the single-phase relays controlling the polyphase network protector. It was noted that, when there were three single-phase relays controlling the protector, “it is necessary for only one relay to open its contacts to open the breaker, but the contacts of all relays must be closed before the breaker will close.” However, it was pointed out by Blake in 1928 (Blake 1928b) that if single-phase relays with watt tripping characteristics were used in polyphase systems, the relay would trip the network protector for ungrounded line-to-line faults in the secondary system. For this reason, subsequently developed electromechanical network relays where three-phase devices, which basically looked at the direction of the net three-phase power flow in the protector to make the tripping decision. However, it is interesting to note that when the first solid-state relay was developed for network protectors in the 1960’s, the earliest versions would trip the protector if there were a reverse power flow in any one phase of the protector. Subsequently this design flaw was identified, and the solid-state relay modified to require the net three-phase power flow in the protector to reverse before the relay made its trip contact.
Blake’s discussion (Blake 1928b) recognized both the master relay close and trip characteristics, and the close characteristics of the single-phase phasing relay as used today. Contained in his paper are extremely important observations, which are still applicable today and are very helpful to understanding network relay close characteristics and settings. Some of the more important observations are listed below, and are discussed in detail later in this chapter.
-
“It is also desirable, but not necessary to have the relay protect against reclosing when phases are crossed or reversed by workmen during installation or repair work.” He goes on to say that it is the master relay characteristic that protects against reclosing on crossed or rolled phases, because the phasing voltages would lead or lag the network voltages by 120o or 180o.
-
“At unity power factor, it (the phasing voltage at the open protector) leads the network voltage (line-to-ground) at an angle equal to the system impedance angle.”
-
“It is necessary to design the relay with reclosing characteristics so that it will be certain to close on the impedance voltage which does not exceed the impedance voltage corresponding to full current.”
-
“The total impedance voltage across the breaker is the resultant of the primary feeder voltage, transformer, and secondary main impedance voltages. It is advisable to use only the transformer impedance voltage in the relay design because it is possible for one breaker to close ahead of another, leaving only the transformer impedance voltage for the remaining breaker in cases where two or more transformers are located at the same point or close together.”
Blake also presented discussions pointing out the following:
-
The phasing relay is needed to prevent automatic reclosing on lagging phasing voltages, but it is only needed on one phase. When the primary feeder breaker is open, and the capacitive charging current of the primary feeder is much larger than the magnetizing current of the network transformers, the transformer voltage at those locations whose protectors have opened can be greater in magnitude than the network voltage at that location, and could auto-close the protector before the last closed protector opens if a phasing relay is not used. This see-saw action can be prevented with the phasing relay.
-
The phasing relay contact is in series with the close contact of the standard (master) relay.
-
Rotating the master relay close line about 3o counter-clockwise from the perpendicular position will significantly reduce the loading on the in-service transformers at unity power factor, and the master relay close line should be advanced much more than 3o if it is desired to have the relay close the protector for leading power factor loads on adjacent network transformers.
-
The range of overvoltage adjustment in the master relay should be in the range of ½ to 2 volts in-phase with the network line-to-ground voltage.
When the three-phase electromechanical network relays were first developed, the relays of the two manufacturers that produced them, Westinghouse and General Electric, used line-to-neutral potential coils when applied in three-phase four-wire systems. The three-phase induction disk and induction cylinder relays of both manufacturers had three elements acting on a common shaft, and exhibiting basically a watt trip characteristic, with the trip condition occurring when the net three-phase power flow was in the reverse direction. Figure 1 shows the General Electric type ID-2 network master relay, where the three watt-elements are connected to a common shaft.

Figure 1:
General Electric Type ID-2 network master relay (photo
by author).
When General Electric developed its electromechanical single-element induction cylinder relay (Beeman 1941) in the early forties, it selected line-to-line connected potential coils, because it was purported that these connections provided greater torque under unbalanced primary feeder faults (line-to-line, double line-to-ground) than possible in network relays with line-to-neutral connected potential coils. Under balanced three-phase conditions, the relay described by Beeman basically looked at the direction of the net three-phase power flow, and tripped when the net flow was in the reverse direction and above a threshold. Under unbalanced conditions, the torques on the rotating element were not proportional to the network real power (watt) flow, but were in the tripping direction for faults on the primary feeder, and in the non-tripping direction for faults in the LV network.
Beeman (1941) pointed out that having fast opening of the network protector during backfeeds to high-current faults on the primary feeder gave greater flexibility in selecting the network protector fuse to be applied with the protector. For backfeeds to high-current faults on the primary feeder, the network protector must open before the network protector fuse(s) can blow or be damaged.
In some early networks of the New York Edison Company and the United Electric and Power Company, it was reported in 1933 (Searing and Powers 1933) that the average number of switch (network protector) operations are at the rate of 3 to 5 thousand per year, and in certain locations where switches were set to operate on reverse-magnetizing current, the maximum rate was as high as 10 to 15 thousand operations per year. Searing and Powers (1933) indicated that the large number of operations were due to:
-
Periodic heavy shunt load drawn from substation buses from which network feeders emanate.
-
Individual feeder loading and induction regulator action.
-
Phase angle and voltage differences in individual generating sources due to loading, etc.
-
Starting of large induction-synchronous motors.
-
Elevator regeneration during braking periods.
Of the five causes identified above, the first four are basically eliminated when the primary feeders to the network emanate from the same substation with all bus-tie breakers closed, the preferred configuration to achieve stable operation of network protectors. Use of time-delay tripping on low-magnitude reversals that are momentary in nature is effective in reducing protector operations from elevator regeneration during periods of braking (Edson and Bostwick 1941). Regardless, to help eliminate the large number of network protector operations when the system was operating under the conditions of items 1 through 4 above, a network relay was developed that operated from the positive-sequence component of the network line-to-ground voltage, the positive-sequence component of the phase currents, and the positive-sequence component of the difference (phasing) voltage at the open protector (Orcutt and Bostwick 1933).
The positive-sequence quantities were supplied to a single-phase electromechanical relay element having a potential coil, a current coil, and a phasing coil. Positive-sequence voltage was applied to the potential coil at all times when the network protector was open, or when the protector was closed, if either the positive-sequence component of the protector current was above a threshold, or the negative-sequence current was above a threshold. These characteristics allowed detection of high-current balanced and unbalanced backfeeds on the primary feeder, yet the relay would not trip for low-magnitude reversals under unfaulted conditions. That is, with low-magnitude reversals, the relay potential coil was not energized, and the protector would not trip. This allowed low-magnitude reversals under unfaulted conditions and would eliminate the large number of protector operations from circulating currents. However, it was recognized that the relay with these operating characteristics would not detect an open primary feeder breaker in absence of a fault, because the positive- and negative-sequence currents in the protectors would be below the circulating currents for which it was desired to not trip. To allow tripping when the feeder breaker was opened in absence of a fault, it was proposed that a negative-sequence generator be connected to the primary feeder, producing sufficient negative-sequence current to energize the relay potential coil.
Another option to generate negative-sequence current with the feeder breaker open and without a fault on the primary feeder was to apply a single-phase ground (network transformers with a delta connected primary), because this could generate sufficiently high negative-sequence current if the capacitive charging current of the primary feeder was high enough.
Although network relays with these characteristics were produced and placed into service, they did not become the standard adopted by the utility industry. However, when the first microprocessor network protector relay was developed, it used the positive-sequence components of voltage and current to generate its trip and close characteristics.
Up through the mid 60’s, only electromechanical relays were available for network protectors. The master relays were the type CN-33 from Westinghouse, and the type CHN from General Electric (GE). The phasing relays were the type CNJ from Westinghouse and the type CHL from GE. The first solid-state relay for network protectors was developed by Tempo Instruments for the Consolidated Edison Company of New York in the middle 1960s. It included both the tripping and reclosing functions in a hermetically sealed package, with the tripping based primarily on the direction of the net-three phase power flow. Its closing characteristics were similar to those of the electromechanical master and phasing relay. A version of the solid-state relay was also produced and offered to utilities for use with General Electric network protectors when GE discontinued making electromechanical relays for network protectors. It was designated as the type SSNPR by GE.
The first microprocessor relay for network protectors was the Westinghouse type MPCR. It was sequence-based and used positive-sequence components of the network line-to-ground voltages, protector phase currents, and phasing voltages to generate the trip and close characteristics. It contained both watt and watt-var trip characteristics, time delay tripping to allow momentary backfeeds, and non-sensitive tripping. Further, its trip characteristic could be adaptive, with the change from watt to watt-var based upon the magnitude of the negative-sequence voltage on the network. High negative-sequence voltages were an indicator of unbalanced faults on the network primary feeder or in the secondary network. It exhibited the conventional straight-line close characteristics described later.
Second generation microprocessor relays were introduced in the mid 1990’s by both Eaton (type MPCV) and Electronic Technology Incorporated (type MNPR). The MPCV relay characteristics were based on sequence currents and voltages, whereas the type MNPR characteristics were based on power calculations using phase-to-ground voltages and phase currents. These relays have communications and data logging capabilities, and exhibited either the straight-line or circular close characteristics. For a short time period, Schweitzer Engineering Laboratories (SEL) produced a power-based microprocessor relays for network protectors, type SEL 632-1. The instruction book for the SEL relay had a section on Theory of Operation that clearly defined the relay logic for generating the trip characteristic. Microprocessor relays are now also available from DigitalGrid Inc, which can be programed to do either power-based calculations or sequence-based calculations. To learn all of the capabilities and features of the microprocessor relays, the manufacturer’s literature should be consulted.
Network Relay Trip Characteristics
The network relay should trip the network protector for faults on the network primary feeder and for faults in the network transformers on the primary feeder. Ideally, the network relay would detect the fault on the primary feeder before the primary feeder breaker at the substation opens, but this usually does not occur in network systems where the primary feeders for the network come from the same substation with closed medium-voltage bus-tie breakers. However, in systems where the primary feeders come from different substations, or from substation with open bus-tie breakers, the network relay may detect some faults on the primary feeder before the faulted feeder breaker opens, depending on feeder breaker opening time. Figure 4.2-2 in Chapter 2 shows system conditions where the network relay may detect the fault on the primary feeder before the breaker for the faulted feeder opens.
Network relays should not trip the network protector for faults in the 208Y/120-volt secondary grid network. As discussed in Introduction and Overview, faults in the secondary grid network are cleared by either:
-
Burning clear
-
Blowing of cable limiters
-
Blowing of network protector fuses
-
Manual cutting of faulted cables
-
Combination of the above measures
In 480-volt spot network systems as discussed in 480-volt-spot-network, some operators have installed enhanced protection systems for detecting low-magnitude arcing faults downstream from the network protectors, and clearing of such faults by opening and lockout of all network protectors in the spot network. However, the detection function is accomplished with other protective devices as described in 480-volt-spot-network.
Power Based Electro-Mechanical Relay-Watt Trip Characteristic
The Westinghouse type CN-33 electromechanical network relay has essentially a power-based watt trip characteristic as described in this section. From this, the relay response for voltage and current conditions during faults on the primary and secondary systems can be determined. Some power-based solid-state and some microprocessor relays functionally are similar to the CN-33 electromechanical relay. A review of the basic relationships between phase power flows, and net three-phase power flow helps in understanding some differences between microprocessor relays that have power-based algorithms, and those that have sequence-based algorithms.
Figure 2 shows the construction for the type CN-33 electromechanical master relay. For each phase the relay has an electromagnet assembly with a potential coil connected from phase-to-ground, a current coil, and a phasing coil which is connected across the open contacts of the protector. Three such electromagnet assemblies are in the relay, one for each phase. On this diagram, the actual current in the protector is designated with the lower-case subscripts, and the current in the relay current coil designated with the upper-case subscript, the two differing by the current transformer ratio, NCT. Shown in Figure 2 are the connections from phase ”a” of the protector to the relay potential coil and current coil for phase “A”. The connections for phase “b” and phase “c” of the protector are similar to those for phase A, and these connections to the relay are shown at the bottom of the figure.
If the electromagnet assembly for each phase had a perfect watt characteristic, the flux from relay phase “a” potential coil and the flux from relay phase “A” current coil would produce a torque on the moving element (drum) that is proportional to the power (watt) flow in phase “a” in the protector, with the direction of torque corresponding to the direction of the power flow, either into or out of the LV network. The same applies to the potential coil and current coils for phase “b” and phase “c”. Because the electromagnets for the three phases act on the same moving element (drum), the net torque on the relay moving element would be proportional to the net three-phase power flow in the protector, and the direction of the torque corresponds to the direction of the net three-phase power flow in the protector. This assumes perfect CTs with no saturation, that the electromagnet assembly for each phase has a perfect watt characteristic, and that there is no interaction between phases in the relay.
With reference to Figure 2, when the electromagnet in each phase does not have a perfect watt characteristic, the net torque on the moving element, from the current and potential coils is proportional to:
(1)
$$ \ \ \ T_{NET} \approx V_{a}I_{A} \cos(\theta_{IA} - \theta_{Va} - \theta_{M}) + V_{b}I_{B} \cos{(\theta_{IB} - \theta_{Vb} - \theta_{M})} + V_{c}I_{C} \cos{(\theta_{IC} - \theta_{Vc} - \theta_{M})} $$
In eq (1), Vi is the voltage applied to the relay potential coil for phase “i”, and angles θIi and θVi are respectively the angle of phase “i” current and voltage relative to the same reference. Angle θM accounts for electromagnet designs where the maximum torque on the moving element is produced not when the current is in-phase (or 180o degree out-of-phase) with the network voltage, but when the current is leading the potential coil voltage by angle θM. If the electromagnet for each phase had a perfect watt characteristic, then angle θM in eq (10-1) is 0o. Angle θM determines the angle of the relay trip curve relative to the network relay line-to-ground voltage under balanced three-phase conditions, as discussed later.

Figure 2:
Connections to the type CN-33 electromechanical master
relay for watt trip characteristic.
Attached to the moving element (drum) of the CN-33 relay of Figure 2 is a single-pole double throw contact. Figure 3 is a front view of the CN-33 relay showing the stationary trip contact on the left, the stationary close contact on the right, and the moving contact attached to the shaft of the relay drum. Shown with the light-green colored arrow is the direction of the torque on the moving element when the net three-phase power flow is in the reverse direction. Shown with the red-colored arrow is the direction of the torque on the drum when the net three-phase power flow is in the forward direction, or into the network. Also shown are the direction of two other torques acting on the relay moving element. There is a spiral spring attached to the moving element, whose torque is towards the relay close contact, such that when the relay is totally de-energized, the moving contact makes with the stationary close contact. Similarly, there is a voltage only torque from the three potential coils acting on the moving element, being towards the stationary trip contact as shown by the dark green arrow. With no current in the relay current coils, for most adjustments the voltage only torque and the spiral spring torque are such that the moving contact floats between the stationary trip contact and the stationary close contact.

Figure 3:
Direction of torques on CN-33 master relay when network
protector is closed.
The actual net three-phase power flow in the network protector under any voltage and current conditions, faulted or unfaulted, is the sum of the power flows in the three phases. With reference to Figure 4, the power flow in phases “a”, “b”, and “c” are given by
(2)
$$ \ \ \ P_{a} = V_{a}I_{a} \cos{(\theta_{Ia} - \theta_{Va})} \text{ watts} $$
(3)
$$ \ \ \ P_{b} = V_{b}I_{b} \cos{(\theta_{Ib} - \theta_{Vb})} \text{ watts} $$
(4)
$$ \ \ \ P_{c} = V_{c}I_{c} \cos{(\theta_{Ic} - \theta_{Vc})} \text{ watts} $$
In these equations, Vi and Ii are the protector phase “i” line-to-ground voltages in volts, and the protector current in amperes, respectively. The convention selected and the reference directions for the currents are shown in Figure 4 is such that real power flows into the network are positive in sign, and real power flows out of the network are negative in sign.

Figure 4:
Reference directions for phase currents and
phase-to-ground voltages for defining power flows.
The net three-phase power flow in the network protector, PNET, is the sum of the power flows in the three phases as given by eq (5), which also shows that PNET is three times the sum of the zero-sequence power flow (P0) plus the positive-sequence power flow (P1) plus the negative-sequence power flow (P2). The usefulness of this relationship is if the sequence currents, voltages, and sequence powers in the network protector are available from system analysis under fault conditions, either balanced or unbalanced, the magnitude and direction of the net three-phase power flow can be found without having to obtain the actual phase currents and voltages. If the relay has a true watt trip characteristic, then the relay will make its trip contact when PNET is negative in sign, and the magnitude of PNET is greater than the trip threshold.
(5)
$$ \ \ \ P_{NET} = P_{a} + P_{b} + P_{c} = 3(p_{0} + p_{1} + p_{2}) $$
However, the trip curve of the electromechanical CN-33 master relay is rotated counterclockwise from the position corresponding to a true watt trip characteristic, such that the relay will make its trip contact when the following is negative in sign
(6)
$$ \ \ \ V_{a}I_{a} \cos{(\theta_{Ia} - \theta_{Va} - \theta_{M})} + V_{b}I_{b}\cos{(\theta_{Ib} - \theta_{Vb} - \theta_{M})} + V_{c}I_{c} \cos{(\theta_{Ic} - \theta_{Vc} - \theta_{M})} < P_{TRIP} $$
The symbols in eq (6) and the reference direction for the phase currents are defined in Figure 4. The voltages are the line-to-ground voltages in volts at the protector, and the currents are the protector phase currents in amperes. PTRIP in eq (6), a negative number, is the net three-phase reverse power flow in the protector needed, under balanced conditions, to make the trip contact for a current that leads the network line-to-ground voltage by 180o, with the line-to-ground voltage being rated. PTRIP is found from eq (7).
(7)
$$ \ \ \ P_{TRIP} = -3V_{RATED - LG} I_{TRIP-180} \enspace watts $$
In eq (7):
VRATED-LG = rated line-to-ground voltage in volts, typically either 125 volts or 277 volts
ITRIP-180 = current magnitude in amperes leading the network line-to-ground voltage by 180 degrees required to make the relay trip contact
Rigorously, eq (6) applies when only fundamental frequency currents and voltages are present in the protector relay. With electromechanical relays, the average power flow and torque caused by voltage of one frequency and current of another frequency are zero, producing zero net torque on the moving element. When significant harmonic currents are present, yet the voltages applied to the relay are low in harmonics, the major torques in the electromechanical master relay are produced by the interaction of the fluxes from the fundamental frequency voltages and currents.
However, certain microprocessor relays that are power based may include the effects of harmonic power flows in the algorithm that determines direction and whether the trip criteria are satisfied. The trip algorithm used in the SEL 632-1 power-based relay is described in detail later.
From eq (5), microprocessor relays that have a directional characteristic derived from just the positive-sequence currents and voltages, in effect filter out the zero-sequence and negative-sequence power flows under unfaulted and faulted conditions. Examples of this are the Eaton MPCV relay, and the DigitalGrid network relay when programed to operate on sequence quantities. When faults occur on the network primary feeder which have delta wye-grounded connected network transformers, as in Figure 4, there is very little zero-sequence power flow in the protector due to the fault, but there will be some zero-sequence power flow in the protector due to unbalanced loading in the secondary system. Further, there is negative-sequence power flow in the protector during unbalanced faults on the primary feeder, both before and after the breaker at the substation for the faulted feeder opens.
Although a power-based relay such as the CN-33 electromechanical can trip when the power-flow criteria, as in eq (6), is satisfied, the trip characteristic of the network relay is defined under balanced three-phase conditions at rated voltage. Under balanced three-phase conditions, eq (6) reduces to
(8)
$$ \ \ \ 3V_{a}I_{a}\cos{(\theta_{Ia} - \theta_{Va} - \theta_{M})} < P_{TRIP} $$
The trip characteristic gives the current required to make the trip contact with rated balanced voltages, as a function of the angle between the current in the protector and the network line-to-ground voltage. Letting the difference between the phase “a” current angle, θIa and phase “a” voltage angle θVa be θa, eq (8) simplifies to:
(9)
$$ \ \ \ 3V_{a}I_{a}\cos{(\theta_{a} - \theta_{M})} < P_{TRIP} $$
Eq (9) can be rearranged as:
(10)
$$ \ \ \ I_{a} \cos{(\theta_{a} - \theta_{M})} < \frac{P_{TRIP}}{3V_{a}} $$
With rated voltage applied to the relay, and balanced three-phase conditions, the trip criteria of eq (10) becomes:
(11)
$$ \ \ \ I_{a} \cos{(\theta_{a} - \theta_{M})} < \frac{P_{TRIP}}{3V_{RATED-LG}} $$
Placing the expression for PTRIP given by eq (7) into eq (11) gives:
(12)
$$ \ \ \ I_{a} \cos{(\theta_{a} - \theta_{M})} < \frac{-3V_{RATED-LG}I_{TRIP-180}}{3V_{RATED-LG}} $$
Eq (12) simplifies to the inequality that is the basis for plotting the relay trip curve at rated voltage.
(13)
$$ \ \ \ I_{a}\cos{(\theta_{a} - \theta_{M})} < I_{TRIP-180}$$
When the relay has a perfect watt trip characteristic, angle θM is zero degrees. To be consistent with the designation used on the relay trip characteristic under balanced conditions, ITRIP-180 is the reverse current trip setting at rated voltage, designated as RT, so eq (13) becomes:
(14)
$$ \ \ \ I_{a}\cos{(\theta_{a})} < - RT $$
Eq (14) is the basis for plotting the CN-33 relay sensitive trip characteristic shown in Figure 5, when the relay has a perfect watt trip characteristic (trip curve perpendicular to network line-to-ground voltage VN).

Figure 5:
CN-33 relay trip curve under balanced conditions
corresponding to perfect watt characteristic.
The network line-to-ground voltage, VN, is the reference phasor at an angle of 0o. Ia is the magnitude of the current in the protector, as given by the pink phasor, with the reference direction indicated in Figure 4. Angle θa is the angle by which the current Ia leads the network line-to-ground voltage, VN, which in Figure 4 is θIa – θVa. Note that under balanced three-phase conditions, the angle between the current and the voltage in each phase is the same. And RT is the current required to make the trip contact under balanced three-phase conditions with rated voltage applied to the relay. Designating the current needed to make the trip contact Iatrip:
(15)
$$ \ \ \ I_{atrip} = \frac{RT}{\cos{(\theta_{a})}} $$
Notice that in Figure 5, indicated for current Ia lying in each quadrant is the direction of both the real and reactive power flow in the network protector. When current Ia is in the I or II quadrant, the real power flow is into the LV network. And when current Ia is in the III or IV quadrant, the real power flow is out of the LV network back towards the primary feeder. With the relay trip curve in Figure 5, shown with the heavy green colored line perpendicular to the network line-to-ground voltage, VN, the reverse power needed to make the trip contact of the relay is independent of the angle between VN and Ia, shown as θa.
It is emphasized that for the CN-33 electromechanical relay, the current needed to make the trip contact as given on the trip curve of Figure 5 is with rated voltage applied to the relay. At lower voltages, the current needed to make the trip contact increases if the torque on the moving element is proportional to real power flow. The same would apply if the inequality of eq (6) were incorporated in a trip algorithm for microprocessor relay.
Whenever the phase currents, phase-to-ground voltages, and angles between the current and voltage on each phase are known in the network protector, eq (6) can be used to determine if the relay will make its trip contact under the fault conditions for which the currents and voltages apply.
The actual trip curve of several electromechanical network relays was rotated about 5o counterclockwise from the true watt position as shown in Figure 6. For the CN-33 electromechanical relay, this means that the electromagnets with the current and potential coils on each phase are positioned so that maximum torque is produced in each phase when the current in the current coil is leading the voltage applied to the potential coil by either 185o, or by 5o.
The reason for rotating the trip curve about 5 degrees counterclockwise from the true watt position, as shown in Figure 6 where θM is +5o, was to allow the relay to make its trip contact on large capacitive backfeed currents when the feeder breaker at the substation is opened in absence of a fault. Under these conditions the current angle θa in Figure 6 can be slightly less than 270o, and if the relay had the perfect watt characteristic as in Figure 5, it may not trip on the capacitive backfeed.
With the trip curve rotated θM degrees as in Figure 6, the trip line can be intersected by the current for positive current angles θa that are slightly larger than 90+θM and slightly less than 270+θM. For current angles in this range, the magnitude of the current required to intersect the trip curve, at rated voltage and balanced three-phase conditions, is given by eq (16).

Figure 6:
Relay trip curve rotated 5o counter clockwise
from the watt position (θM = +5o)
(16)
$$ \ \ \ I_{atrip} = RT \frac{\sin{(90 + \theta_{M})}}{\sin{(\theta_{a} - \theta_{M} - 90)}} = -RT\frac{\cos{(\theta_{M})}}{\cos{(\theta_{a} - \theta_{M})}} amperes $$
In this equation, RT is a positive number and is frequently referred to as the sensitive reverse current trip setting in amperes (current in the protector, not on the secondary side of the CT). Also, current Iatrip is a positive number when angle θa is in the range where the current phasor can intercept the sensitive trip line.
The range of adjustment for RT in % of protector CT rating depends upon the type and vintage of the network relay. In dedicated feeder networks, where it is desired that the protectors open when the feeder breaker is opened in absence of a fault, most operators set RT between 0.1% to 0.2% of the protector CT rating. Table 1 lists, for different CT ratings, the current at 180o required to make the relay trip contact when RT is set to 0.15% of protector CT rating, as well as the corresponding three-phase reverse power (watt) needed to make the trip contact when the current is leading the network voltage by 180 degrees.
Table 1:
Trip amperes and reverse Watts at 180o for
trip setting of 0.15% RT Setting at 125 Volts
NWP CT Rating |
Trip Amps @ 180o |
3ϕ Watts to Trip @ 125 V and 180o |
|---|---|---|
| 1200 | 1.8 | 675 |
| 1600 | 2.4 | 900 |
| 2000 | 3.0 | 1125 |
| 2500 | 3.75 | 1406 |
| 3000 | 4.5 | 1688 |
| 3500 | 5.25 | 1969 |
The reverse power needed to make the sensitive trip for current at an angle of 180o is very small. For example, on a 500 kVA 216-volt network transformer, frequently the protector has CTs with 1600 to 5 rating. So, on a 500 kVA transformer, the protector can trip for reverse powers as low as 900 watts, which is less than the power drawn by a typical hand-held hair dryer. If the trip curve is perpendicular to the network line-to-ground voltage as in Figure 5, this is the reverse power needed for trip whenever the current phasor is in the III or IV quadrant, regardless of the angle, θa, between the phase current and the line-to-ground voltage, VN.
The three-phase reverse power flow in watts needed to make the trip contact, under balanced three-phase conditions, as a function of current angle θa, in Figure 6 is given by eq (17), when the network line-to-ground voltage is 125 volts, the rating of most relays, and the voltage at which the electromechanical relays are frequently calibrated.
(17)
$$ \ \ \ W_{TRIP} = 3 * 125 * \text{RT} \frac{ -\cos{(\theta_{M})}}{\cos{(\theta_{a} - \theta_{M})}} \cos{(\theta_{a})} watts $$
In eq (17), a negative value for WTRIP corresponds to a reverse power flow in the protector. Further notice that when angle θa equals 180o, the watts needed to trip is independent of trip curve angle θM. It is seen from Table 10-1 that network protectors with a sensitive trip setting will trip on relatively low values of reverse power. This is necessary in dedicated feeder networks to assure that:
-
The network protector will open when the primary feeder breaker at the substation is opened in absence of a fault. As discussed in Introduction and Overview, when the feeder breaker at the substation is opened in absence of a fault, there are circulating flows through the network transformers on the feeder with the open breaker, with some protectors seeing a reverse power flow, and other protectors seeing a forward power flow. The protectors open sequentially, with the circulating flows changing in both magnitude and direction following the opening of each network protector on the feeder.
-
The network protector on delta wye-grounded network transformers will open for the single line-to-ground (SLG) fault on the primary feeder. If the network transformers on the feeder have the wye-grounded connection for both the primary and secondary windings, the backfeed current in at least one phase of the protectors will be high after the feeder breaker at the substation opens for the SLG fault.
With the relay trip curve rotated 5o counter clockwise (θM = 5o) as in Figure 6, the watt flow needed to make the trip contact is a function of current angle θa as defined in Figure 6. Figure 7 plots the watts needed to make the trip contact of the relay in per unit of the watts that make the trip contact when the current leads the network line-to-ground voltage, VN, by 180o (θa= 180o). This shows that under balanced conditions the watts needed to make the trip contact is affected by current angle θa. Furthermore, with the trip curve being a straight-line and rotated counterclockwise by 5o, a trip-tilt angle of 95o, the relay will trip the network protector for lagging power factor loads (both P and Q) into the network if the power factor is less than 8.72% (cos 85o).

Figure 7:
Per unit watts required for trip with trip curve slope
θM of +5o. One per unit = watts at θa =
180o.
Electromechanical Power Based Relay Watt-Var Trip Characteristic
Network relays with a power-based straight-line trip characteristic have been utilized successfully in grid and spot networks where the primary feeders have only three-pole circuit breakers between the substation and network transformers. That is, there are no single pole interrupters on the primary feeder between the substation and network transformers. However, as discussed later in this chapter, application of network transformers with reduced losses (high X to R ratios for the leakage impedance) produces conditions during certain faults where the performance of the relay with straight line trip characteristic, as in Figure 6, where the trip curve is rotated 5o counterclockwise, is marginal. This applies to both power-based and sequence-based microprocessor relays.
Extension of Dedicated Network Feeder For Supply of MGN Loads discusses problems that can occur if an existing dedicated network feeder, with delta wye connected network transformers is extended to supply a three-phase four-wire multi-grounded neutral feeder with line-to-neutral connected distribution transformer. As shown in that discussion, a zig-zag grounding transformer(s) must be installed on the primary feeder to prevent overvoltages to ground on the MGN feeder during backfeed to the single line-to-ground (SLG) fault with the feeder breaker open. Otherwise, customer loads will be damaged during backfeed to the SLG fault.
Application of Spot Networks to Existing MGN Radial Primary Feeders discusses application of two-unit spot networks to existing three-phase four-wire multi-grounded neutral (MGN) feeders with distribution transformers having their primary windings connected from phase-to-neutral. In these applications, the network transformers should have their primary windings connected in grounded-wye in order to prevent overvoltages during backfeed to SLG faults on the primary feeder with the feeder breaker open. Figure 8 shows such an application of a two-unit spot network on MGN primary feeders, with line-to-neutral connected distribution transformers. With the station breaker closed, or with it open and a backfeed from the spot network, the primary feeder will be effectively grounded, thereby limiting overvoltages during backfeed to the SLG fault.
As depicted in Figure 8, when the spot networks are supplied from the MGN distribution feeders, frequently fuses are used in the tap circuits from the feeder to the network transformers. Usually the tap circuits use single-conductor concentric neutral cables, connected to the MGN radial feeder with fuses at the junction point. The purpose of the fuses is to prevent tripping and lockout of the MGN radial primary feeder for a fault on the tap circuit to the network transformer.

Figure 8:
Two-unit spot network with wye-wye network transformers
applied to four-wire MGN primary feeder.
With reference to Figure 8, should a single line-to-ground (SLG) fault occur on the cable circuit for one of the network transformers, the fuse in the faulted phase at the junction between the main circuit, frequently an overhead (OH) line and the cable circuit, blows. Following blowing of the fuse, the network protector fed from the faulted cable circuit must open. Figure 9 shows this condition where the SLG fault on the cable circuit to network transformer has blown the fuse in phase “A” at the junction point. Following this, the network relay in network protector 1 (NWP 1) must detect this fault and open NWP 1.
In Figure 9, the SLG fault on the cable circuit blows just the fuse in faulted phase “A”. In the faulted phase, the watt flow in the protector, Pa, is in the reverse direction from the network back towards the primary feeder. With the SLG fault being bolted, the power flow in phase “a” of the protector, Pa, is due mainly to the I2R losses in phase “a” of the network transformer and in phase A primary cable between the transformer and the fault. However, phase current Ia1 in the protector relative to network phase “a” voltage, Va, can be nearly parallel to the zero-torque line of the CN-33 electromagnet for phase “a”, when θM in Figure 6 is 5o, the extent depending on primarily the X to R ratio of the leakage impedance of the network transformer. With θM set to 5o and a high X to R ratio, it is possible that the torque produced by the electromagnet for phase “a” of the relay will not be in the tripping direction. Further, in phase “b” and in phase “c” of network protector 1, the watt flow may be into the network, due to the network load, such that the net torque on the moving element of the CN-33 relay with “watt” trip characteristic in protector 1 is in the non-tripping direction.

Figure 9:
Simultaneous fault condition difficult to detect with
network relay having a straight-line watt trip characteristic as in
Figure 6.
With the CN-33 electromechanical relay in network protector 1 not making its trip contact, the backfeed current in just faulted phase “a”, current Ia1, is cleared by blowing of network protector fuse(s) in phase “a”. Because NWP 1 and NWP 2 in the two-unit spot network in Figure 9 have nearly the same current in faulted phase “a”, the fuse in phase “a” of NWP 2 may blow, resulting in single-phasing of the network load.
If this were a three-unit spot network, the fuses in the protector could be coordinated during backfeed to the SLG fault with the wye-wye connected network transformers.
When this problem was first identified, the only relays available for network protectors were the electromechanical relays, such as the Westinghouse type CN-33. A protector relaying scheme was needed to allow detecting backfeed to the SLG fault with a blown fuse in the faulted primary phase.
To detect this fault condition with the CN-33 electromechanical relay having electromagnets with nearly a watt trip characteristic as shown in Figure 2, the connections from the network protector current transformers (CTs) to the relay current coils were changed, as indicated in Figure 10. To relay phase “A” electromagnet, protector phase “a” line-to-ground voltage is applied to the potential coil, but the current injected into phase “A” electromagnet current coil is the negative of protector phase “b” current. Similar connections are made to the electromagnets for relay phase “B” and relay phase “C” as shown in Figure 10. The effect of this is that the net torque on the moving element (drum) of the CN-33 relay, where θM is the angle by which the current coil current must lead the potential coil voltage to produce maximum torque is given by:
(18)
$$ \ \ \ T_{RELAY} \approx V_{a}I_{b} \cos{(\theta_{Ib} - 180 - \theta_{Va} - \theta_{M})} + V_{b}I_{c} \cos{(\theta_{Ic} - 180 - \theta_{Vb} - \theta_{M})} + V_{c}I_{a} \cos{(\theta_{Ia} - 180 - \theta_{Vc} - \theta_{M})} $$
When the phase currents in the protector, and the phase-to-ground voltages at the protector are inserted into eq (18), for the various fault conditions that occur on the primary feeder with the wye-wye connections for the network transformer as in Figure 9, the CN-33 relay response for different faults can be determined. Doing this reveals that the watt-var connections to the CN-33 relay watt elements will detect with great margin the single line-to-ground fault on the primary feeder with blown primary fuse in the faulted phase as shown in Figure 9. Furthermore, the CN-33 with watt-var connections provides much higher tripping torques for all other faults on the primary feeder than with the watt connection, found from eq (6).


Figure 10:
Connections to CN-33 master relay for the watt-var
tripping characteristic.
The watt-var connection also provides for faster tripping time of the protector for faults on the overhead feeder in Figure 9, thereby increasing the chance of successful reclosing of the primary feeder breaker at the substation for temporary faults on the overhead feeder. The faster clearing time also reduces the duration of the voltage dip on the spot network paralleling bus for faults on the OH primary feeder.
Under balanced three-phase conditions, the power seen by the electromechanical relay with the watt-var connections is proportional to:
(19)
$$ \ \ \ P_{RELAY} \approx V_{a}I_{a} \cos{(\theta_{Ia} - \theta_{Va} + 60 - \theta_{M})} $$
Letting θa. = θIa – θVa which is simply the angle between phase “a” current and phase “a” voltage, eq (19) becomes:
(20)
$$ \ \ \ P_{RELAY} \approx V_{a}I_{a} \cos{(\theta_{a} + 60 - \theta_{M})} $$
The trip characteristic of the CN-33 electromechanical relay with the watt-var connections, assuming electromagnets with watt characteristics (θM = 0o), is the same as with the watt connections, except that the trip curve is rotated 60 degrees in the clockwise direction. This is shown in Figure 11, where the reverse current trip setting, RT, is now at 120 degrees rather than at 180 degrees, with the straight-line trip curve assumed to be at an angle of 30 degrees.

Figure 11:
Trip-characteristic of CN-33 watt-var relay under
balanced three-phase conditions.
With the CN-33 trip curve, shown with the heavy green-colored line in Figure 11 being at an angle of 30o, plus rotated counterclockwise an additional θM degrees to account for the electromagnets having a characteristic that is not perfect watt, the magnitude of the current required to intercept the trip curve, Iatrip, under balanced three-phase conditions is given by eq (21).
(21)
$$ \ \ \ I_{atrip} = RT \frac{cos{(\theta_{M})}}{\sin{(\theta_{a} - 30 - \theta_{M})}} amperes $$
In eq (10-21), RT is the trip setting in amperes at 120o. When angle θa is 120o, the current required to intercept the trip curve is independent of angle θM.
The watt-var connections for the CN-33 electromechanical relay resulted in a trip characteristic that was superior for detecting faults on the primary feeder, both with and without blown fuse in the faulted phases on the primary feeder. This is seen best for the three-phase fault on the primary feeder with the faulted feeder breaker open, where Figure 12 shows the current for this fault with the orange-colored phasor, lying in the III quadrant. Although the current phasor is not parallel to the maximum torque line of the relay, it is far from the zero-torque line, thereby providing positive tripping torque much higher than that obtained with the watt connections for the CN-33 electromechanical relay. Also shown in Figure 12 with the purple-colored phasor is the current for a lagging power factor load on the network, located far from the trip region of the trip curve.

Figure 12:
Currents during balanced three-phase conditions with
the CN-33 watt-var relay trip curve.
It should be noted that with the electro-mechanical CN-33 relay, going from the watt to watt-var connections, under balanced conditions the straight- line trip curve is rotated 60 degrees in the clockwise direction. This is the only possible shift that can be made by changing connections between the protector CT’s and the CN-33 relay current coils. That is, shifts of a lesser amount are not possible.
With the General Electric CHN electromechanical network relay, watt-var connections were also developed for use in spot networks where fuses were installed on the primary feeder (Potochney 1985).
However, for a leading power factor load with the power factor less than 86.6%, the current phasor lies in the trip region of the CN-33 watt-var relay, as shown by the dark purple-colored phasor in Figure 12. If the watt-var trip curve in Figure 12 were rotated counterclockwise an additional 5o from the 30o position, the protector can trip for leading power factor loads that are less than 81.9%. The fixed watt-var trip characteristic of Figure 12 when used in protectors in two-unit spot networks also makes tripping of one protector more likely if vars are circulating through the spot network due to voltage magnitude difference on the primary feeders for the two-unit spot network.
If the CN-33 watt-var relay is applied in networks where the backfeed with the feeder breaker open, in absence of a fault, is capacitive, as shown by the light green-colored phasor in quadrant IV of Figure 12, the relay will not detect the open breaker. This is quite possible in dedicated feeder networks where the primary cable charging current is higher than the total magnetizing current of all network transformers on the feeder. However, this condition usually would not exist in two-unit spot networks on non-dedicated feeders as in Figure 8, because the current in the protector with the feeder breaker open usually lies in quadrant III due to lagging power factor non-network load on the MGN primary feeder. CN-33 relays with the watt-var trip characteristic should not be applied in secondary networks with dedicated primary feeders.
Recommended Applications CN-33 Electromechanical Relays.
Fixed Watt Trip Characteristic
The fixed watt trip characteristic should be selected for the following applications.
-
Dedicated primary feeders with no single-pole protective devices (fuses, reclosers) in the primary feeder, having network transformers with the primary windings connected in either delta or grounded wye.
-
Non-dedicated primary feeders with no single-pole protective devices in the primary feeder between the substation feeder breaker and the HV terminals of the network transformers, with the network transformers connected delta grounded-wye, and with the non-network transformers connected delta on the primary side. If the primary windings of the non-network transformers are connected from phase-to-neutral, then a grounding bank must be installed on the primary feeder as discussed in Section 4.4 of Primary System Grounding to prevent overvoltages during backfeed.
-
Non-dedicated primary feeders with no single-pole protective devices in the primary feeder between the substation feeder breaker and the HV terminals of the network transformer, with the network transformer connected grounded-wye on both the primary and secondary sides, and with the non-network transformers having their primary windings connected from phase-to-neutral (ground).
Fixed Watt-Var Trip Characteristic
The fixed Watt-Var trip characteristic (CN-33 electro-mechanical relays) should be selected for the following applications.
-
Whenever fuses or other single-pole protective-devices are installed in the HV feeder between the substation breaker and the HV terminals of the network transformer. This applies whether the HV windings of the network transformers are connected in delta or grounded-wye. Recognize that with the fixed watt-var trip characteristic of Figure 12, the protector:
-
May not trip when the primary feeder breaker is opened in absence of a fault if the backfeed is capacitive.
-
Will trip when the primary feeder breaker is opened in absence of fault if the backfeed is inductive, which may very well be the situation on non-dedicated primary feeders
-
-
The electro-mechanical watt-var trip characteristics were developed for two-unit non-dedicated feeder spot networks with wye-wye connected network transformer and with fuses on the primary side between the station breaker and the HV terminals of the network transformer. The purpose was to allow positive detection of the SLG fault between the fuses and the HV terminals of the network transformer, with a blown HV fuse in the faulted phase.
Application Conflict With CN-33 Electro-Mechanical Relays
In most dedicated network primary feeders, the only protective devices are the relays for the feeder breaker at the substation, and of course the relays for the network protectors. Figure 13 shows a situation which exists in some systems, where the primary feeder is dedicated and protected with relays for the feeder breaker at the substation. But a user applied a spot network on the dedicated feeder, where one of the network transformers is shown. Further, the user applied fuses on the HV side of the network transformer so that better protection could be provided to the transformer and system for internal faults in the network transformer HV and LV windings.

Figure 13:
Dedicated network primary feeder with a spot network
having fuses on HV side of the network transformer.
For the system of Figure 13, and in particular for the spot network where fuses are applied on the HV side of the network transformer:
-
When the feeder breaker at the substation opens in absence of a fault, the backfeed current in the protectors can be highly capacitive. To assure that the protector will open under capacitive backfeed, the electromechanical network relay should have the watt trip characteristic as shown in Figure 6, with θM equal to + 5o (trip tilt angle of 95o).
-
To assure that the network protector in the spot network with the fuses on the HV side will open for a SLG fault between the HV fuses and the network transformer, the CN-33 electromechanical relay should have the watt-var trip characteristic as shown in Figure 11.
From items 1 and 2 above, it is clear that with the CN-33 electromechanical network relay, it is not possible to both trip on a capacitive backfeed, and also trip on backfeed to the SLG fault on the primary between the HV fuse and the network transformer with a blown fuse in the faulted phase. The CN-33 electromechanical relay could be configured to satisfy one or the other requirements, but not both. However, today there are microprocessor relays from different manufacturers that are applicable for this application.
Trip Algorithms for Microprocessor Relays
Microprocessor based network relays are available from Eaton, Electronic Technologies (Richards), DigitalGrid, and SEL, who have discontinued supplying a network relay. However, the SEL instruction manual is excellent and clearly explained the theory of operation of their power-based network relay, and will be discussed in this section, along with the theory of operation for the positive-sequence directional overcurrent relay as provided by Eaton and DigitalGrid.
Sequence Based Relay Trip Characteristics and Trip Criteria
Figure 14 shows the block diagram for a network relay which performs calculations using sequence currents and voltages. On the network side of the main contacts are sequence filters which extract from the three line-to-ground voltages on the network side, VAN, VBN, and VCN the positive-sequence component, V1N, and the negative-sequence component V2N. On the transformer side of the protector, the output currents from the current transformers (CT’s) are input to a current filter, which extracts the positive-sequence component of the protector currents, I1. The positive-sequence component of the network line-to-ground voltages V1N and the positive-sequence component of the phase currents, I1 are used to determine if the relay should make its trip contact.
As shown in Figure 15 with the blue colored phasor, V1N is at angle zero and is the reference for the relay sensitive trip curve. In the most general form, the relay sensitive trip curve is represented with two straight line segments, shown in green, TC2 in the second quadrant and TC1 in the third quadrant and extending into the fourth quadrant. Associated with each segment of the trip curve is a shift angle, with the positive-direction for both being counterclockwise.

Figure 14:
Block diagram for sequence-based network protector
relay.
The distance from the origin of the coordinates to the point where TC2 and TC1 intersect is the magnitude of the positive-sequence current needed to satisfy the trip criterion when the positive-sequence current is leading the network positive-sequence line-to-ground voltage by 180 degrees.
(22) $$ \ \ \ RT = \frac{CT RCT_{ ﹪ }}{100} amperes $$
In this equation:
RT = Current (positive-sequence) in amperes at 180o needed to satisfy the sensitive trip criteria
RCT% = Reverse current trip setting in % of protector CT rating.
CT = Rated primary current of the protector CT in amperes

Figure 15:
Segments of sensitive trip curve for positive-sequence
directional overcurrent relay.
In general, shift angles θSH2 and θSH1 can be considered adjustable. What is needed is the values for the shift angles that will assure that the protectors associated with the faulted primary feeder will trip, and the protectors associated with the unfaulted primary feeder will not trip for any specific system fault conditions.
In Figure 15 let:
I1MAG = the magnitude of the positive-sequence current in the network protector for any specific fault condition, as determined from system simulation.
θ1rly = the angle of the positive-sequence current in the protector in degrees relative to the positive-sequence network line-to-ground voltage, V1N, as determined from system simulation.
In general, the positive-sequence current in the protector on the faulted feeder will lie in quadrant 1 or 2 in Figure 15. And the current in the protectors connected to the unfaulted primary feeders will lie in quadrant 3 or quadrant 4.
The magnitude of the positive-sequence current in the protector, I1MAG, and its angle, θ1rly, which is either positive or negative in sign, are obtained from simulations of the system under consideration, for the fault condition being studied. The NP relay shift angle, θSH, where current I1MAG at angle θ1rly will just intercept the trip curve, for either positive or negative values of θ1rly, is given by eq (23).
To assure reliable detection of the fault when θ1rly is positive, meaning the positive-sequence current is in the first or second quadrant in Figure 15, shift angle θSH2 shown in Figure 15 of the relay must be less than shift angle θSH found from Eq (23).
(23)
$$ \ \ \ \theta_{SH} = a\tan{\frac{-K\cos{\theta_{1rly}} - 1}{K \sin{\theta_{1rly}}}} $$
In eq (23), “K” is defined by eq (24), so in effect “K” is simply the magnitude of the positive-sequence current I1MAG in per unit of the positive-sequence current required to make the relay trip contact when the positive-sequence current is leading by 180 degrees.
(24)
$$ \ \ \ K = \frac{I_{1MAG}}{(CT * RCT_{﹪})/100}$$
In the protector connected to the unfaulted primary feeder, angle θ1rly will be negative in sign, and solution of eq (23) gives the shift angle θSH where the positive-sequence current will intercept the trip line. To assure that the protector connected to the unfaulted feeder does not trip, the relay shift angle θSH1 in Figure 15 must be less than θSH that is found with eq (23).
Thus, for any fault condition on the network primary feeder, either with or without blown fuses in the faulted phase, or with the breaker for the faulted feeder either closed or open, if the magnitude, I1MAG, and angle, θ1rly, of the positive-sequence current in the protector are known:
-
The trip curve shift angle θSH2 needed to assure the relay in the protector connected to the faulted primary feeder will trip the protector can be found.
-
The trip curve shift angle θSH1 needed to assure the relay in the protector connected to the unfaulted primary feeder will not trip the protector also can be found.
Power-Based Relay Sensitive Trip Characteristics and Trip Criteria
The discussion presented in this section on the sensitive trip criteria for the power-based microprocessor relay is based on material in the SEL instruction manual for the SEL 632-1 network relay. For power-based relays of other manufacturers, readily available literature does not provide information on this. The reader is advised to contact the manufacturer of the power-based relay for guidance in this area.
Figure 16 shows the currents and voltages that are supplied to the power-based relay. The relay calculates a P and Q quantity, which are identified as PSELnet and QSELnet, to emphasize that it is based on the theory of operation given in the SEL 632-1 instruction manual. They are given by eqs. (25) and (26).

Figure 16:
Current and voltage inputs to SEL 632-1 power based
network relay.
PSELnet and QSELnet are calculated from the magnitude of the phase currents and the angle between the phase current and the corresponding phase-to-ground voltage, for example on phase A this is: (θIA – θVA). Note that the P and Q values are calculated using the nominal phase-to-ground voltage, VNOM, rather than the magnitude of the actual phase-to-ground voltage. If the magnitudes of the actual phase-to-ground voltages were used, then the resultant for P and Q would be the actual real and reactive flows in the network protector.
(25)
$$ \ \ \ P_{SELnet} = V_{NOM}[I_{A}\cos{(\theta_{IA} - \theta_{VA})} + I_{B} \cos{(\theta_{IB} - \theta_{VB})} + I_{C} \cos{(\theta_{IC} - \theta_{VC})}] watts $$
(26)
$$ \ \ \ Q_{SELnet} = - V_{NOM} [I_{A} \sin{(\theta_{IA} - \theta_{VA})} + I_{B} \sin{(\theta_{IB} - \theta_{VB})} + I_{C} \sin{(\theta_{IC} - \theta_{VC})}]var \enspace s$$
Figure 17 shows the network relay trip characteristic in the P-Q plane, where it is assumed that trip curve, shown in green, is a straight line. Positive “P” corresponds to a watt flow into the network, and negative “P” corresponds to a watt flow from the LV network back towards the primary feeder. Similarly, positive “Q” corresponds to a reactive flow into the network, and a negative “Q” corresponds to a reactive flow from the network back towards the primary feeder.

Figure 17:
Power-based relay trip curve in the P-Q plane.
In Figure 17, PSET is the reverse power that the trip curve passes thru when there is no reactive flow in the protector. It is calculated from eq (27)
(27)
$$ \ \ \ P_{SET} = 3V_{NOM} \frac{RCT_{﹪}}{100} CT watts$$
In eq (27), the terms are:
VNOM = Nominal line-to-ground voltage of the network in volts, typically either 120 or 125 volts, or 265 or 277 volts.
CT = Rated current in amps of the protector current transformer on the primary side.
RCT% = Reverse current trip setting in % of protector CT rating.
Note from eq (27) that the sign of PSET is positive.
Further, in the trip characteristic of Figure 17, angle θSH is the angle by which the relay straight-line trip curve, shown with the green colored line, is rotated counterclockwise from the line that is parallel to the “Q” axis.
Also plotted on the P-Q plane in Figure 17 in red is the point corresponding to PSELnet and QSELnet as found from eqs (25) and (26) respectively. If this point lies on or to the left of the trip curve (green-colored curve), then the relays sensitive trip criteria are met and the trip contact makes to open the protector. Given PSET which is a positive> number, and the shift angle θSH, it can be shown that if the inequality given by eq (28) is satisfied, the P-Q point lies on or to the left of the relay trip curve, and the relay sensitive trip criteria is satisfied.
(28)
$$ \ \ \ V_{NOM} [I_{A} \cos{(\theta_{IA} - \theta_{VA} - \theta_{SH})} + I_{B} \cos{(\theta_{IB} - \theta_{VB} - \theta_{SH})} + I_{C} \cos{(\theta_{IC} - \theta_{VC} - \theta_{SH})}] < -P_{SET} \cos{(\theta_{SH})} $$
With reference to Figure 17, with the straight-line trip characteristic the relay trip-tilt angle, as appearing in the literature of several relay manufacturers, is defined as:
(29)
$$ \ \ \ \theta_{TRIP-TILT} = 90\degree + \theta_{SH} $$
Given PSELnet and QSELnet as found from eqs (25) and (26) respectively, with reference to Figure 17, the shift angle needed for the P-Q point to lie on the trip curve is given by eq (10-30). Thus, to assure reliable detection of the fault, the shift angle for the relay must be less than that found with eq (30) when the P-Q point lies in the second quadrant.
Note that in evaluation eq (30) for θSH, when the P-Q point lies in the second quadrant, the sign of both PSELnet and QSELnet are negative, and as shown by eq (27) and on Figure 17, the sign of PSET is positive.
(30)
$$ \ \ \ \theta_{SH} = \alpha \tan{\frac{P_{SELnet + P_{SET}}}{Q_{SELnet}}} $$
An alternate approach for a power-based relay would be to calculate the P and Q point using the actual magnitude of the network line-to-ground voltages. Letting these be defined as PNET and QNET, they are found using eq (31) and (32).
(31)
$$ \ \ \ P_{NET} = V_{A}I_{A} \cos{(\theta_{IA} - \theta_{VA})} + V_{B}I_{B} \cos{(\theta_{IB} - \theta_{VB})} + V_{C}I_{C}\cos{(\theta_{IC} - \theta_{VC})} \text{ watts}$$
(32)
$$ \ \ \ Q_{NET} = -V_{A}I_{A}\sin{(\theta_{IA} - \theta_{VA})} - V_{B}I_{B}\sin{(\theta_{IB} - \theta_{VB})} - V_{C}I_{C}\sin{(\theta_{IC} - \theta_{VC})} \text{ var s} $$
Figure 18 shows a two-segment sensitive trip curve on the P-Q plain, and the point PNET and QNET with the red dot. A power-based relay calculating the P and Q point with eqs (31) and (32) will make its trip contact if the PNET - QNET point lies on or to the left of the relay trip curve.

Figure 18:
Two-segment sensitive trip curve on P-Q plain with P
and Q point found using magnitude of actual voltages.
For relays in protectors connected to the faulted feeder, the P-Q point lies in either the first or second quadrant. The shift angle at which the P-Q point lies on the trip curve is given by eq (33), similar to eq (30) except for the way the P and Q are calculated.
(33)
$$ \ \ \ \theta_{SH} = \alpha \tan{\frac{P_{NET} + P_{SET}}{Q_{NET}}} $$
With reference to Figure 18, if the PNET - QNET point is in the first or second quadrant, then shift angle θSH2 (for the top half of the trip curve must be less than θSH found with eq (33) to insure reliable detection of the fault. Similarly, if the PNET - QNET point is in the third or fourth quadrant, then shift angle θSH1 for the bottom half of the trip curve must be less than θSH as found with eq (33) to assure that the protectors fed from the unfaulted feeders will not trip.
The reader is referred to Appendix A3 of this book, where the spot-networks system of Figure 19 was analyzed for different fault types on the primary feeder, both with and without blown primary fuses, to determine the value for shift angle θSH2 in Figure 18 at which the fault will just be detected by the relay in the protector connected to the faulted feeder. Also given is the shift angle θSH1 at which the relay in the protector on the unfaulted primary feeder would detect the fault. As discussed before, the shift angles must be set so that there is margin to assure the relay in the protector connected to the faulted feeder will trip, and that the relay in the protector connected to the unfaulted feeder will not trip. Considered are the SLG, LL, and DLG faults on the primary feeder at the location indicated in Figure 19.

Figure 19:
System for investigating require shift angles.
What was learned from the analysis of this system was that shift angle θSH2 where the fault is detected is about the same for the positive-sequence overcurrent relay, and for the power-based relay that calculates P and Q using the nominal voltage [ eq (25) and (26)]. However, when the P and Q calculation is done using the magnitude of the actual voltages with eqs (31) and (32), a smaller shift angle is needed for the relay in the protector on the faulted feeder to detect the fault. See Appendix A-3 for details.
Another concern is the network relay response when energizing a network following an outage if phases in one primary feeder have been rolled or crossed. This is discussed in detail in Appendix 5.
Other Sensitive Trip Characteristics in Microprocessor Relays.
In this section, presented are the sensitive trip characteristics that are available in the microprocessor relays of different manufacturers. These trip characteristics are shown for balanced three-phase conditions with rated voltages applied, so they apply whether the relay does the sequence-based calculations, or whether it does power-based conditions
Westinghouse MPCR Relay
The first commercially available microprocessor relay for network protectors was the Westinghouse type MPCR. It was a sequence-based relay that used positive-sequence quantities to generate its trip and close characteristics (see Figure 14). The sensitive trip characteristic was adaptive, based upon the magnitude of the negative-sequence voltage at the protector, as shown in Figure 20. The trip setting, RT, was the magnitude of the positive-sequence current required to make the trip contact when leading the positive-sequence component of the network voltage, V1N, by 180 degrees. The positive-sequence component of the network voltage, V1N, was the reference phasor for the trip characteristic, and the current required to trip was independent of the magnitude of V1N. When the negative-sequence voltage at the protector, V2N, was less than 6%, the relay trip characteristic was a straight line, rotated counterclockwise 5 degrees from the true watt position, as shown by the lighter green colored curve in Figure 20. This would be the trip characteristic under normal (unfaulted) conditions.
If V2N exceeded 6%, which typically would be the condition for an unbalanced fault on the primary feeder, either without or with blown fuses in the faulted primary phase(s), see Figure 19, the trip curve rotated approximately 65 degrees in the clockwise direction to the position shown with the darker green colored curve in Figure 20. This gave reliable detection of unbalanced faults, with the positive-sequence current lying well within the trip zone. As can be seen from the discussion in Appendix 3, it was not necessary to rotate the trip curve a full 65 degrees to the position shown in Figure 20 to reliably detect the unbalanced faults. This angle apparently was selected as it was consistent with what was done with the electro-mechanical master relays when generating the watt-var trip characteristic.
So, in summary, the MPCR sensitive trip characteristic was a straight-line, nearly perpendicular to the reference phasor, V1N, but under unbalanced conditions, V2N > 6%, it was rotated approximately 65 degrees in the clockwise direction.

Figure 20:
MPCR relay adaptive sensitive trip characteristic
Westinghouse/Eaton MPCV Relay Early Versions
The Westinghouse MPCR relay was superseded by the type MPCV relay, which had not only the straight-line trip characteristic, but both the straight-line and circle close characteristics. This relay, just like the MPCR, used positive-sequence quantities to generate its trip and close characteristics. The positive-sequence voltage on the network side, V1N, just served as the reference phasor for the trip and close characteristics.
With the early version type MPCV, two trip characteristics were available. The first was the straight-line watt trip characteristic. The second was a watt-var trip characteristic, and the user selected which trip characteristic the relay was to exhibit.
Watt Trip Characteristic
When the watt-trip characteristic was selected, the trip curve was a straight-line rotated 5 degrees counter-clockwise from a line that was perpendicular to the network line-to-ground voltage, V1N.
Watt-Var Trip Characteristic
But when the watt-var trip characteristic was selected, the trip curve became that shown in Figure 21, where there are two straight-line segments making up the trip curve. Straight line segment “TC-1” is in the fourth quadrant, and has the same position as when the watt-trip characteristic was selected. But when the watt-var trip characteristic was selected, the “left half” of the watt-trip curve, TC-2, was rotated about 65 degrees in the clockwise direction to give the characteristic shown in Figure 21. This was referred to as the “boomerang” watt-var trip characteristic.
Simulations of unbalanced faults on the primary system, without blown fuse(s) or with blown fuse(s) in the faulted phases showed that the positive-sequence current phasor, Ia1 in Figure 21, lay well within the trip region, and far from the trip curve, providing reliable detection of unbalanced faults on the primary, either without or with blown fuses in the primary feeder on the substation side of the fault.

Figure 21:
MPCV relay straight-line boomerang watt-var trip
characteristic.
But with the “boomerang” watt-var trip characteristic with the trip curve shown in Figure 21, the left half, labeled TC-2, was rotated 65 degrees clockwise from the position it has when the “watt” trip characteristic was selected. This angle was fixed and not adjustable. As indicated before, the left half of the curve does not have to be rotated 65 degrees to assure reliable detection of unbalanced faults on the primary. See the discussion in Appendix A3 for details.
The concern with the boomerang watt-var trip characteristic of Figure 21 is that a protector can trip for leading power factor loads on a spot network, or it can trip from circulating vars in non-dedicated feeder spot networks.
Conditions Where Straight-Line Watt Trip Characteristic is Marginal
The straight-line watt trip characteristic in the earlier versions of the MPCV relay, was recommended for dedicated feeder applications where only three-pole protective devices are applied on the network primary feeder. However, under certain fault conditions in the dedicated network primary feeder, the performance of both the sequenced based relay, such as the MPCV, or the power-based relays such as the SEL 632-1 is marginal, the situation being worse when the network transformers have a very high X to R ratio. Three-such conditions are shown in Figure 22.
The conditions shown in Figure 22 (a) clearly illustrates a situation where a power based or a sequence-based relay may not detect a three-phase fault on the primary. With a bolted three-phase fault on the primary feeder at or close to the HV terminals of the network transformer, the current in the protector leads the network line-to-ground voltage by an angle θa1, where:
(34)
$$ \ \ \ \theta_{a1} = 180\degree - \arctan{(X_{T} / R_{T})} $$

Figure 22:
Fault conditions where performance of straight-line
watt trip characteristic is marginal.
In eq (34), XT / RT is the X to R ratio of the backfeeding network transformer. If the X to R ratio of the transformer is greater than 11.43, angle θa1, the angle by which the current (positive-sequence or balanced) in the protector leads the network line-to-ground voltage, V1N, is less than 95 degrees, and the current phasor Ia1 will not intercept the straight-line trip curve as shown in Figure 34 (a). Since this is for a balanced three-phase backfeed, it applies to both the sequence based and power-based relays.
Although X to R ratios as high as 11.43 usually are not encountered in network transformers with 4% or 5% leakage impedance, ratios higher than this are found in some network transformers with 7% impedance, especially in units designed for low load (I2R) losses for 480-volt applications. Even for X to R ratios that are less than 11.43, although theoretically the current phasor intercepts the trip curve, or the P Q point lies to the left of the trip curve in power-based relays (see Figure 17), because of tolerances in the microprocessor relays, CT phase angle errors, the relay algorithm may not detect the fault. For reliable detection of conditions where the relay should make its trip contact, the trip criteria should not be marginally satisfied. With the sequence-based relay, the positive-sequence current should be well within the trip region, and for the power-based relays the P-Q point should be well within the trip region. The analogy with an electromechanical relay element is, for conditions where the relay is to operate, the current phasor should not be close to the zero-torque line of the relay, but far enough away to ensure positive tripping action.
Figure 22 (b) and (c) show two other conditions where the performance of a network relay with straight-line trip characteristic, rotated 5o counterclockwise from the true watt position, is marginal, whether sequence based or power based using the trip algorithms discussed earlier. In Figure 22 (b), there is a double line-to-ground fault on the primary feeder with a single blown fuse in the backfeeding network protector. This is the condition which can cause overheating of secondary neutral conductors connected to the X0 bushing of the backfeeding network transformer with the delta wye-grounded connections as discussed in Backfeed Currents for Primary Feeder Faults.
In Figure 22 (c), with the wye-wye connected network transformer, there is the single line-to-ground fault on the primary side with the blown fuse in the faulted phase. This fault frequently will not be detected with the CN-33 electromechanical relay having the watt trip characteristic, and may not be detected with microprocessor relays, either sequence based or power based, having the straight-line trip characteristic as in Figure 22 (a).
MPCV Gull-Wing Watt Trip Characteristic
To overcome the deficiencies in the straight-line trip characteristic as in Figure 22 (a), Eaton in the MPCV relay adopted as standard the “gull-wing” trip characteristic as shown in Figure 23. V1N, or the network positive-sequence voltage is the reference phasor, and “RT” is the current at 180 degrees displaced from V1N required to make the trip contact.

Figure 23:
Gull-wing trip characteristic in sequence-based MPCV
relay
The right-side of the trip curve, labeled TC-1, is rotated 5o counterclockwise from the true watt position, and the left-side labeled TC-2, is rotated 5o clockwise from the true watt position. The gull-wing trip characteristic is the optimum for use in network protectors applied in dedicated feeder networks. It provides margin for tripping on highly capacitive backfeeds as when the feeder breaker is opened in absence of a fault, and it provides margin for tripping on high-current backfeeds from network transformers with high X to R ratios. In other words, for these two conditions, the positive-sequence current phasor lies well within the trip region of the relay.
The gull-wing trip characteristic shown in Figure 23 can also be achieved in power-based relays. With reference to Figure 18, to achieve the gull-wing characteristic the angle θSH2 is set to -5o, and angle θSH1 is set to +5o.
With the MPCV relay, when the watt-var trip characteristic is selected, the trip characteristic is that shown in Figure 21, where the left-side of the trip curve is at the +300 position, similar to that with the electromechanical CN-33 relays. As mentioned before, the left-side of the watt-var trip curve does not have to be that far “back” to assure reliable detection of faults on the primary with blown fuses in the faulted primary phases. Simulations performed by the author have shown, with reference to Figure 23, that if the left-side of the trip curve, TC-2, is rotated another 10 degrees clockwise so that it is at the 75-degree position, the relay will reliably detect faults with blown fuses on the primary feeder.
There is one potential problem with the gull-wing trip characteristic as shown in Figure 23 when the relay is applied in spot networks, but its advantages far overshadow the one potential problem. With reference to Figure 24, it is seen that if a pure capacitive, or a pure inductive load were connected to the spot network, the relay trip criteria will be satisfied if the magnitude of the current in the protector exceeds the value given by eq (35).
(35)
$$ \ \ \ I_{a1-TRIP} = 11.43 * RT $$

Figure 24:
Conditions in spot network where gull-wing trip
characteristic will trip in spot networks
There have been reports of protectors in spot networks tripping on startup when the only load supplied from the network was power factor correction capacitors. When the protector trips, it creates a dead network, and the network relay dead network logic will cause the relay to make its close contact, and the protector closes back in. It would then continue this cycle (pump), unless the relay included an anti-pump feature, that locks the protector open if it performs more than a specified number of operations in a defined time period.
In one known situation where this occurred, load was being transferred from the spot network bus to emergency generators with transfer switches, to allow testing of the emergency power supply. Power factor correction capacitors were connected to the network side of the transfer switches such that when the last block of load was transferred to the generators, only capacitive load was connected to the network bus, and the last closed protector tripped. The solution adopted was to control the capacitors such that they were switched on only when the lagging power factor motor load, which they were to compensate, was connected.
Figure 25 shows, under balanced three-phase conditions, the watts required to make the trip contact of the relay with the “gull-wing” trip characteristic versus the current angle θa, in per unit of the of the watts required to trip for a current which is 180o displaced from the voltage. For current angles between 85o and 90o, and between 270o and 275o, the per unit watts are negative, meaning the relay will make its trip contact for forward watt flows if the power factor is less than 8.7%.

Figure 25:
Watts to trip in per unit of watts to trip when current
is leading network voltage by 180 degrees.
MNPR Watt-Var Trip Characteristic
The ETI MNPR relay also has a watt-var trip characteristic, wherein four different settings can be specified to define the trip characteristic. Figure 26 shows the MNPR watt-var trip characteristic with the heavy green colored curve.
In this figure, which applies under balanced three-phase conditions, VN, the reference phasor, is the network line-to-ground (neutral) voltage at angle 0o. RT is the reverse current trip setting, or the current required to satisfy the sensitive trip criterion when the current is 180 degrees from VN. Trip curve segment labeled TC-1 is a straight line, rotated from the true watt position, with its angle defined by the trip-tilt angle, θTTILT. When θTTILT is set at 95 degrees, the trip curve TC-1 is rotated 5o counter clockwise from the watt position. If the relay has just the watt trip characteristic, the straight-line TC-1 defines the trip characteristic, where it is extended to the left into the third quadrant.
The trip tilt angle, θTTILT, is adjustable. If it were set to 95 degrees, and the relay had just the watt trip characteristic, the relay may not detect backfeed to a three-phase fault at the HV terminals of the network transformer for high X to R ratio transformers, as shown in Figure 22 (a).

Figure 26:
MNPR watt-var trip characteristics under balanced
conditions.
With the watt-var characteristic, in addition to setting the trip tilt angle, the following settings are made, with reference to Figure 26.
θwvar = Angle of straight-line TC-2 in the second quadrant. Consult the manufacturers literature on how to set this. Note that if this angle were set to 30 degrees, it would occupy the same position as that of the MPCV relay watt-var characteristic.
WVC = Watt Var Current, which defines the radius of the circular portion of the trip curve in Figure 26.
When this relay is applied in network protectors in two-unit spot networks with non-dedicated primary feeders with fuses on the primary side, with the network transformers having the wye-wye connections as shown at the top in the single-line diagram, the WVC can be set at a level where under unfaulted conditions with balanced loading, the relay trip criteria will not be satisfied. For example, if the WVC was set to correspond to the rated current of the network transformer, there could be considerable circulating vars from unequal voltages magnitudes on the HV side of the network transformers without tripping of the protector. Whereas if WVC were very small or zero, TC-2 would pass through the origin, and tripping would occur on circulating vars. Yet with the WVC set to transformer rated current, should any fault occur on the HV side of the wye-wye connected network transformer, the current in the protector would exceed the watt var current, and the relay would trip.
To assure reliable detection of backfeed to faults on the primary feeder with or without blown fuse, the angle of TC-2, angle θW\ VAR, can be much greater than 30 degrees, and the relay should still detect the backfeed to the SLG fault with blown fuse in the faulted phase, if it does its PQ calculations similar to that for the SEL 632-1 relay, as described earlier in this chapter.
With the characteristic shown in Figure 26, the relay can be configured so that the sensitive trip curve is the same as or similar to that of the MPCV gull-wing characteristic. This would be achieved by making settings such that angle θWVAR in Figure 26 is at 85 degrees, and the watt-var current, WVC, is set to the smallest possible value.
DigitalGrid Watt and Watt-Var Trip Characteristic
The DigitalGrid network relay can be programed for a watt trip characteristic, or a watt-var characteristic. Further it can be programed to do either sequence-based calculations or power-based calculations. The following discussion on this relay is for when it uses the sequence-based calculations.
Figure 27 shows the DigitalGrid Watt trip characteristic when programed for positive-sequence operation. The positive-sequence network voltage, V1N, at angle zero-degrees, is the reference for the sensitive trip characteristic. The reverse current trip setting, RT, is the positive-sequence current at 180 degrees required to make the trip contact.
There are two segments to the sensitive trip curve, TC-1 and TC-2, both of which intersect RT at 180 degrees. The angle of each segment is adjustable. The angle of TC-1, shown as θTC1, is set by selecting the “Trip Tilt Angle”. The angle of TC-2, shown as θTC2 is set by selecting the “Trim Angle”. With these two angles, the sensitive trip curve can be set to the gull-wing configuration as available in the MPCV relay, the preferred characteristic for applications in dedicated primary feeder networks.
When the DigitalGrid relay is set to have the watt-var trip characteristic, it exhibits the characteristic shown in Figure 27 whenever the magnitude of the negative-sequence voltage, V2N, is less than 6%. With reference to Figure 27, the sensitive trip characteristic is not satisfied for the current shown by the pink-colored phasor, Ia1. This is where the positive-sequence current would lie with a SLG fault on the primary feeder, with a blown fuse in the faulted HV phase.
However, when the DigitalGrid relay is programed to have the watt-var trip characteristic, and V2N is less than 6%. under unfaulted conditions with normal loading, the relay will not trip on circulating vars due to voltage magnitude difference on the primary feeders. But if V2N exceeds 6%, TC-2 rotates to the position shown in Figure 28, where the angle of TC-2 is shown as θTC-2. From Figure 28, the relay would trip for current Ia1, which results from a SLG fault on the HV side with a blown fuse in the faulted HV phase. The user should consult the manufacturers literature to determine what settings must be made to get the desired angular position for TC-1, shown as θTC1, and the desired angular position for TC-2, shown as θTC2.

Figure 27:
DigitalGrid sensitive trip curve with adjustable angle
positions for TC-1 and TC-2.

Figure 28:
DigitalGrid relay trip characteristic with watt-var
selected and negative-sequence voltage greater than 6%.
Time Delay Tripping of Network Protectors
The relay trip characteristics described so far are referred to as the sensitive trip characteristics, where RT is the sensitive trip setting. RT, frequently is between 0.10 to 0.20% of protector CT rating. The time that the sensitive trip criteria must be satisfied before the relay makes its trip output contact depends upon the relay. In the MPCV relay this is fixed at approximately 3 cycles. In the MNPR and the DigitalGrid relays this is adjustable. Generally, the sensitive trip time must be low so that the protector will trip under high-current backfeeds before the network protector fuses can blow.
With the CN-33 electromechanical relay such as in Figure 2, the trip time is not adjustable, but under high-power backfeeds from multi-phase faults on the primary feeder, after the primary feeder breaker opens, the trip time is in the range of 3 to 6 cycles. With the microprocessor relays of some manufacturers, it is adjustable from 1 to 256 cycles, or about 4.3 seconds. Sensitive trip times at the upper limit of adjustment should never be used, as it will result in blowing of the network protector fuses rather than opening of the protector under high-current backfeeds to multi-phase faults on the primary feeder.
When low-magnitude, balanced, reverse power conditions occur that are momentary in duration, most operators prefer that the network protector does not open. There are two reasons for this. First, if it is in a spot network and all protectors open, it creates a momentary outage to the spot network, until one protector closes back into the dead network. Second, if only one protector in a two-unit spot network opens on a momentary reversal, following opening there may not be enough load on the network to cause it to auto close. Finally, unnecessary operations of the network protector result in unwanted wear and increased maintenance for the network protector.
The relay trip curves presented so far are referred to as the sensitive trip curves, where the trip setting, RT, frequently is between 0.10 to 0.20% of protector CT rating.
Usually, momentary power reversals create problems in spot networks, but not in grid or area networks. Figure 29 shows a two-unit spot network with regenerative load, shown in red, and non-regenerative load shown in blue.

Figure 29:
Two-unit spot network with regenerative load.
The regenerative load frequently can be from elevators in high-rise office buildings, or crane hoists that use dynamic braking such that they generate power (watts) during the braking period. If, during braking, the regenerative power, PR in Figure 29, exceeds the power drawn by the non-regenerative load, PS, both protectors in the spot network will trip thru their sensitive trip characteristic, which may only have to be satisfied for 3 to 6 cycles. This creates a dead network. Depending on the network relays, one or both protectors would automatically reclose to reenergize the network bus, but there is still an objectionable momentary outage to the load served from the spot network. Depending on protector closing time, the outage could last up to 4 to 5 seconds.
The momentary outage can be prevented by allowing momentary reverse power flows of low-magnitude and short in duration, that are not due to a multi-phase fault on the primary feeder, by time delay tripping of the protector. However, there must be no time delay tripping of the protector for high-magnitude backfeed currents for multi-phase faults on the primary feeder. Further, for sustained low-magnitude backfeeds as occur when the feeder breaker at the station is opened in absence of a feeder fault, the protector must open automatically to allow clearing the feeder.
The concept of time-delay tripping of network protectors, to allow for momentary reversals, appeared early in the evolution of secondary network systems (Edison and Bostwick 1941), intended to accommodate momentary reversals from regenerative loads. Use of time-delay tripping in protectors may also allow accommodation of distributed generation on spot networks that otherwise would be unacceptable. Further use of time delay tripping allows for closed-transition switching of loads between the utility spot network and emergency synchronous generators during testing of the emergency generator system.
Figure 30 shows a spot network system having two nonregenerative loads as well as a generation source. Obviously, the generator power output can’t exceed the total load on the network, P1 + P2, because this would trip all protectors and create an island.

Figure 30:
Spot network with synchronous cogenerations.
This condition is totally unacceptable for networks. Further, IEEE Standard 1547 indicates, “Any DR installation connected to a spot network shall not cause operation or prevent reclosing of any network protectors on the spot network. This coordination shall be accomplished without requiring any changes to prevailing network protector clearing time practices of the area EPS.”
With DR connected to a spot network as in Figure 30, the requirements of P1547 may be met, but if a large block of load is shed, by opening of either breaker 1 or breaker 2 in the figure, the generation output power, PG, could exceed the power drawn by the remaining load, and both protectors would trip on the low-magnitude reversal if their relays have just a sensitive trip characteristic. This forms an island that is not acceptable. If time delay tripping is allowed by the utility, supplemental relaying can be installed, which looks at the net import power from the spot network. Whenever the net import from the spot network falls below a level, or reverses, the generator can be disconnected before any network protector trips, thereby preventing formation of an island. Time delay tripping of the protector allows the generator to be disconnected before any protector can trip.
Figure 31 shows the tripping regions when time-delay is included in the network relay. It is assumed that the relay has the sensitive gull-wing trip characteristic as shown with the green-colored straight-line segments. If the relay has just the sensitive trip characteristic, any time the current phasor lies on or below the sensitive trip curve, the protector trips without time delay.

Figure 31:
Tripping regions for network protector with time-delay
tripping.
The shaded area inside the red circle, below the sensitive trip curve, defines the time delay region. The radius of this circle IINST, defines the size of the time delay region. If the current phasor lies within the time delay region, the relay will trip the protector when the duration of the current in the time delay region exceeds the time delay setting, shown as tset in Figure 31. For current IM shown with the blue phasor, which could be the protector current when the feeder breaker is opened in absence of a fault, the protector trips when the duration of IM in the time delay region exceeds tset.
But if the duration of current IM in the time delay region is less than tset, then the protector will not trip. So, if there is a momentary reversal under unfaulted conditions, from a descending elevator, or from dropping of a large block of load on a spot network with generation, the protector will not trip as long as the duration of the momentary reversal is less than tset, and the current magnitude is less than IINST. To prevent protector tripping from elevators with dynamic braking, tset must be greater than the maximum time that the elevator would use dynamic braking. To prevent protector tripping from dropping of a large block of load with generation on a spot network, tset must be high enough to allow auxiliary relaying to disconnect the generator in a time less than tset.
If the sensitive trip is satisfied, and the magnitude of the current in any phase of the protector exceeds IINST, the relay trips with the sensitive trip time. So, for a multi-phase fault on the primary feeder where the fault current is IF as shown with the red phasor, where IF is greater than IINST, the protector trips without any time delay. This is necessary to prevent protector fuses from blowing, minimize the damage at the fault point on the primary feeder, and to limit the thermal and mechanical stresses on the backfeeding network transformer.
The range of adjustment for IINST, the current that bypasses the time delay depends upon relay type. With the electromechanical relays, the setting of INST had to be greater than maximum load current, because otherwise the instantaneous current relays to bypass time delay would be picked up continuously, a condition for which they were not designed.
The range of adjustment for tset depends upon relay type. In the electromechanical relay such as the Westinghouse type BN, tset was in the range of one to five minutes, adequate to prevent tripping from dynamic braking of elevators. But time delays, tset, in the range of seconds, as desired with generation applications in spot networks, were not possible. But with microprocessor relays, time delay settings can be accurately made, ranging from a fraction of a second up to minutes.
Figure 32 shows simplified control circuits for network protector tripping, without and with time-delay tripping, when electromechanical relays were used.

Figure 32:
Protector tripping circuits (a) without time-delay and
(b) with time delay tripping with electromechanical relays.
In Figure 32 (a), without time delay trip, whenever the master relay sensitive trip is satisfied, the protector trips without intentional time delay. Or in a microprocessor relay without time delay, whenever the sensitive trip is satisfied, the protector trips without time delay. In (b), the protector trips without time delay when the master relay trip is satisfied and the magnitude of the current in any one phase of the protector is above the pickup of the instantaneous current relays, there being one per phase. But for low-magnitude reversals, where the sensitive trip is satisfied, a timer mechanism is started, making its trip contact only if the duration of the reversal is above the time delay setting, tset. If the duration of the reversal is less than tset, the protector does not trip, and the timer mechanism resets.
Figure 33 shows the backside of the Westinghouse type BN time-delay relay. Identified are the three instantaneous current relays to bypass the time delay, and the time-delay mechanism which used a bimetal timer, not very accurate compared to what is possible with microprocessor relays.

Figure 33:
Electro-mechanical type BN time-delay relay (photo by
author).
Another application of time-delay tripping is to allow testing of emergency generator systems that are in the customer system. For certain applications, the National Electric Code requires testing of the emergency generator systems to assure they will work if there is a total loss of the utility system. When supplied from spot networks, time delay tripping is needed to prevent protector tripping on momentary power reversals in the protector when the two systems are momentarily paralleled with transfer switches during testing.
Figure 34 shows a four-unit spot network supplying a system where the load is served from three automatic transfer switches, each switch fed either from the network or from the emergency generator bus. In Figure 10-34, all load is supplied from the spot network, and all network protectors are closed as shown, having a forward power flow. At each transfer switch, the network side switch is closed, and the emergency generator side is open.

Figure 34:
Critical loads on closed-transition transition transfer
switches supplied from spot network.
In order to test the emergency systems, the generator bus is energized, and each load is transferred with closed transition from the spot network to the emergency generator bus, giving the configuration shown in Figure 35. When this is done, all load except for the non-critical load fed from breaker M2 is supplied by the emergency generators. In Figure 35, worst case is assumed where all network protectors in the spot network have opened under the light load, except for network protector 1 (NWP 1) which remains closed. Further, it is assumed that when the last critical load is transferred with closed transition to the generator bus, at least one protector never trips.
At the completion of the generator testing, the loads on the transfer switches in Figure 35 are transferred back to the network bus with closed transition switching. In many closed transition transfer schemes, the switch control monitors the difference in voltage magnitude on opposite sides of the open transfer switch, and the difference in angle on opposite sides of the open switch. As long as the magnitude difference is within a set limit, and the angle difference is within a second set limit, the open switch will close to momentarily parallel the generator bus and the network bus as shown in Figure 36, where it is assumed that the first block of load transferred back to the network is that on transformer switch 1, where S1-N and S1-E are both closed. In some controls, as long as the angle difference on opposite sides of the switch is within plus or minus the set limit, the switch on the network side, S1-N will close. However, as indicated in Figure 36, if when the parallel is made the generator voltage is leading that on the network bus, it can cause a reverse power flow in the closed protector, NWP 1. If the protector did not have time delay tripping, and with sensitive trip times of 3 to 6 cycles for the network protector, NWP 1 could trip. Typical paralleling time with the closed transition switches is about 0.1 seconds, where S1-N closes, and S1-E opens in 0.10 seconds. The one closed protector could trip during the parallel, creating an island. Further, the protector may not be rated for separating two non-synchronized systems.

Figure 35:
Critical loads on closed-transition transfer switches
supplied from generators.
But if the protectors have time delay tripping, where the time delay, tset, in Figure 31 is set at several seconds, the protector will not trip with the parallel lasting 0.1 seconds or longer, providing the paralleling time does not exceed tset. The factor that must be considering when setting the time delay relay to accommodate the closed transition is the setting for IINST, the current where the time delay is bypassed. This must be above the maximum current which can flow during the momentary paralleling, with the upper bound on the voltage magnitude and angle limits of the transfer switch. This is discussed in more detail in Closed Transition Switching & Distributed Generation.

Figure 36:
Critical load on transfer switch 1 being
closed-transitioned switched from generator to network bus.
After the first block of load is transferred back to the network, where transfer switch S1-E has opened, a second block of load can be transferred with closed transition. After the first block is placed back on the network, a second protector may close so that two protectors are connected to the network bus when the second block of load is transferred from the generator bus to the network bus.
The most likely configuration to cause tripping of a network protector during the closed transition switching is when the first block of load is transferred from the generator bus to the network. If this is accomplished successfully, with time delay tripping, there should be no issues when the second or third block of load is transferred back to the spot network.
Similarly, when the first block of load is transferred from the network to the generator bus by closing one of the emergency side switches in Figure 34, time delay tripping is needed to assure that no protectors trip should there be a momentary reversal in any of the network protectors.
Non Sensitive Tripping of Network Protectors
With non-sensitive tripping of network protectors, small amounts of reverse flow are allowed without tripping of the network protector. With reference to Figure 37, protector tripping occurs only when, (1) the sensitive trip characteristic is satisfied, and (2) the magnitude of the current in any phase of the protector is greater than IINST, shown with the red-colored circle. With microprocessor relays, IINST can be set to values that are from about 1% of protector CT rating up to about 250% of CT rating. Setting IINST below the normal maximum load current of the protector usually was not possible with electromechanical relays. Non-sensitive trip settings generally are not used in dedicated feeder networks where protectors must open when the primary feeder breaker at the substation is opened in absence of a fault. However, in special circumstances Consolidated Edison of New York, the largest operator of secondary networks, will use a non-sensitive trip characteristic.

Figure 37:
Tripping characteristic under balance conditions with
non-sensitive tripping.
One application for non-sensitive tripping is in two-unit non-dedicated feeder spot networks with grounded-wye grounded-wye winding connections for the network transformers. With the primary feeders emanating from different electrical buses in the same substation, or different substations with large phase angle differences, keeping both protectors closed may not be possible with the sensitive trip characteristic. A non-sensitive trip setting allows reverse flows in one of the units under unfaulted condition. With the grounded-wye connections for the network transformer primary windings, the backfeed current to faults on the primary feeder usually will be above the non-sensitive trip setting, IINST, allowing the protectors to trip rapidly for faults on the primary feeder. Further, the backfeed current with the feeder breaker open in absence of a fault may exceed the non-sensitive setting, due to the non-network load on the primary feeder, thereby allowing the protector to trip. Allowing reverse flows in a protector in the two-unit spot network, depending on the load in the spot network, could lead to an overload in the transformer/protector that is supplying a forward flow due to network load plus the reverse flow in the backfeeding protector. Before non-sensitive trip settings are used, a careful analysis must be made of all operating and fault conditions.
Network Relay Close Characteristics
Generally, network protectors with sensitive trip settings will trip, under balanced conditions, when the real power (watt) flow is in the reverse direction. Thus, in general, the protector should not be closed if, following closure, the real power flow is in the reverse direction. Stated more precisely, the protector should not close if the network relay sensitive trip characteristic is satisfied upon closing of the protector.
Figure 38 shows the voltages that appear at the open network protector, which can be sensed by the network relays, and from which close characteristics can be derived. In discussing the close characteristics of the network relay(s), it is assumed that balanced conditions exist, so for practical purposes, the discussion applies to power-based network relays, or to a relay that utilizes the positive-sequence components of the network and phasing voltages at the open protector to generate the close characteristics.

Figure 38:
Voltages at an open network protector under balanced
conditions.
The voltages of interest at the open protector are shown in Figure 38, being the network line-to-ground voltage, shown as VN with the blue phasor, the voltage across the open contacts of the protector, VP shown with the green phasor, referred to as the phasing voltage or difference voltage, and the transformer side line-to-ground voltage shown as VT with the red-colored phasor. Mathematically, at fundamental frequency these three voltages are related as shown by eq (36).
(36)
$$ \ \ \ V_{T} = V_{N} + V_{P} $$
The phasors in Figure 38 are drawn to scale for VN = 125 volts, VP = 2.82 volts, and VT = 126.31 volts. With these magnitudes, phasing voltage VP is leading network side line-to-ground voltage VN by 63o, and VT is leading VN by 1.14o. The phasors show that for small angular differences between the transformer side and network side line-to-ground voltages, with the magnitude of VT being either greater than or less than the magnitude of VN, and VT either leading or lagging VN, the angle of VP relative to VN can take on any value from 0o to 360o. Phasing voltage VP can either lead or lag network line-to-ground voltage VN, just as VT can either lead or lag VN. A significance of this is that, when the network relay in the protector is supplied voltages from relay autotransformers, connected from phase-to-ground on the transformer side and network side of the open protector, the autotransformers should have minimal phase angle error and minimal ratio error. Otherwise, the voltages applied to the relay will not replicate the actual voltages at the open protector.
The voltages that the network relay uses to generate a close characteristic are the network line-to-ground voltage, VN, and the phasing (difference) voltage VP. When drawing these voltage phasors, only a portion of network voltage VN is shown as in Figure 39, and the entire phasing voltage phasor VP is shown..
At the open protector, in Figure 39, the symbols that have not yet been defined are:
θP = angle by which phasing voltage VP leads network line-to-ground voltage VN. This is the phasing-voltage angle.
Ia = current that flows in the network protector following closure. Indicated in each quadrant in the figure is the direction of watt and var flows in the protector when the current phasor lies in the quadrant.
θZ = system impedance angle
Cardinal Principles
At the open network protector, two basic rules relate phasing voltage VP and current Ia that flows after the protector closes.
-
The current in the network protector following closure, Ia, lags the phasing voltage, VP, by about the system impedance angle, θZ, irrespective of the magnitude and angular position of phasing voltage VP.
-
The magnitude of the current in the network protector following closure, Ia, is nearly proportional to the magnitude of the phasing voltage, VP at the open protector prior to closing, irrespective of phasing voltage angle, θP.
For spot networks, the current in the protector following closure does not lag the network line-to-ground voltage, VN, by the load power-factor angle. However, as discussed later, the network load power factor angle affects the angle of phasing voltage VP, θP, at the open protector relative to VN in spot networks.
In spot networks, as in Figure 39, where the primary feeders emanate from the same electrical bus, practically the system impedance angle, θZ, is the angle of the network transformer leakage impedance. At an open network protector in a grid network, the system impedance angle is due to the impedances of the network transformers, low-voltage secondary mains and tie circuits, and to a small extent the impedance of the primary feeders. With the X to R ratio of the system impedance being between a low of about 3 in grid networks, and a high of about 12 or 13 in spot networks with transformers having a leakage impedance of 7%, the impedance angle θZ is between about 72o and 85o.

Figure 39:
Phasing voltage at open network protector and current
that flows in protector following closure.
With these principles in mind, reference to Figure 39 shows that if it is desired for the watt flow and var flow to be into the network following closure of the protector, current Ia should be in the first quadrant. The following should be considered when deciding if the protector should close.
-
Phasing voltage VP should lead network line-to-ground voltage VN, or not lag by a large angle to ensure that the watt flow is into the network following closure. This means transformer voltage VT should lead network voltage VN. Further, with the straight-line trip curve of the relay rotated 5o counterclockwise (950 trip-tilt angle) from the true watt position, the current in the protector following closure, Ia, should not lag VP by more than 85o.
-
Phasing voltage VP should be in the first or second quadrant to ensure that the VAR flow is into the network. This means that at the open protector:
ІVTІ > ІVNІ
-
Open network protectors should close before other closed protectors (network transformers) become overloaded.
-
In spot networks, open network protectors should close so that at least two network protectors are closed at all time.
-
Open network protectors should not close at small values of phasing voltage, or for any other condition, if this can result in unstable operation (protector cycling or pumping).
Electromechanical Relay Close Characteristics
The automatic reclosing of network protectors with electromechanical relays is control by two relays: the master relay (Westinghouse CN-33, GE CHN) and the phasing relay (Westinghouse CN-J, GE CHL).
CN-33 Master Relay
The CN-33 master relay, a three-phase device as shown in Figure 2, is also used to control tripping of the network protector when it is closed, with the trip characteristic generated by the potential coil and the current coil on each electromagnet assembly. The electromagnet for each phase also has a phasing coil to which the voltage across the open contacts of the protector, phasing voltage VP, is applied. The fluxes from the potential and phasing coils on the electromagnet for each phase produce a torque on the same moving element (drum). This results in the close characteristic shown in Figure 40 under balanced three-phase conditions.
The network line-to-ground voltage, VN, shown in blue-color is the reference phasor for the master relay close characteristic, and is at angle 0o. The master relay close curve, shown in red, is a straight line that is rotated about 7.5o from a line that is perpendicular to the network line-to-ground voltage. If the phasing voltage VP, lies on or above the master relay close curve, the master relay close contact makes. The phasing VP, at angle θP = 0o, is the relay zero-degree close setting, shown as V0 in Figure 40.
The range of adjustment for this voltage, V0, called the zero degree (0o) close setting, depends on relay type. With the CN-33 electromechanical relays rated 125 volts to ground, the range was 0.5 to 2.0 volts. For a close setting made at relay rated network voltage, 125 volts, in the electromechanical relays, the phasing voltage needed for auto close at any other VN will vary inversely with the network line-to-ground voltage. In microprocessor relays, the range for the zero-degree close setting, V0, is wider, being between 0 and 15 volts in one, and between 0.50 and 5.4 volts in another. Typical zero-degree close settings are between 1.0 and 1.5 volts, although settings below 1.0 volt are used successfully, especially in systems where the primary feeders of the network come from the same electrical bus in the substation and are dedicated to the network. Consult the network relay manufacturers literature for specific zero-degree close setting ranges.
The slope of the master close curve is shown as 7.5o in Figure 40, but this can vary somewhat in electromechanical relays. In microprocessor relays, such as he MPCV this is fixed at about 5 degrees, but in the MNPR and DigitalGrid relays this is adjustable. As far back as 1928, Blake identified the effect of the slope of the master line on the network load required for auto closing under unity power-factor conditions (Blake 1928b). Larger slopes (higher close-tilt angles) allowed open network protectors to close at lower loadings on the in-service network transformers during unity power factor loading conditions.

Figure 40:
CN-33 master relay close characteristics under balanced
three-phase conditions.
Figure 40 shows a leading phasing voltage that satisfies the master close curve, where angle θP is positive. However, the master close curve may also be satisfied for phasing voltages VP that lag the network voltage VN, where angle θP is negative. If the network protector is closed for a lagging phasing voltage, when the sum of the magnitude of the phasing voltage angle, θP, and the magnitude of the impedance angle is greater than 90o, the current phasor lies in the fourth quadrant when the protector closes, and then the protector trips as its sensitive trip characteristic is satisfied.
CN-J Phasing Relay
To prevent the network protector from closing under lagging phasing voltages, which can produce a reverse power or a condition where the sensitive-trip characteristic is satisfied upon closing, a phasing relay is used in conjunction with the master relay to control protector closing. The phasing relay, which looks at only one phase, has the close characteristic shown in Figure 41. The network line-to-ground voltage, VN, is the reference phasor for the close characteristic, and is at an angle of zero degrees.
For phasing voltages VP that lie to the left of the phasing relay close line, shown in red in Figure 41, the phasing relay makes its close contact, thereby allowing the protector to close if the master relay close characteristic is satisfied. In the CN-J electromechanical phasing relay, the slope of the close curve is adjustable from +5o to -25o in 10o steps. For most system operators, the default setting is -5o, although as shown later, with this setting network protector pumping can occur in spot networks when the primary feeders come from a substation with open bus-tie circuit breakers.

Figure 41:
CN-J phasing relay close characteristic.
Further, from Figure 41, the close curve of the phasing relay is offset from the origin such that for a phasing voltage that is 90o leading the network voltage, θP = 90o, a positive value of phasing voltage VP is required to make the close contact. With zero volts phasing voltage, VP = 0, the phasing relay should be adjusted such that its contacts are open. For phasing voltages VP that are to the right of the close curve, the phasing relay contacts are open, and the network protector will not close automatically.
The phasing relay can be adjusted to allow closing for phasing voltages VP that lag the network voltage VN by small amounts, and there will not be a reverse power flow in the protector, or a trip condition created if the system impedance angle, θZ is small. In grid networks where the system impedance angle θZ may be about 72o (X to R of about 3), closing may not result in a reverse watt flow. However, for large lagging angles for VP, closure must be blocked to avoid pumping of the network protector. Pumping and cycling of network protectors are defined later.
Composite Close Characteristic of Network Protector with Electromechanical Master and Phasing Relays
The composite close characteristics for the network protector equipped with electromechanical master and phasing relays is shown by the shaded area in Figure 42. The protector auto closes if the phasing voltage VP is to the left of the phasing relay close curve, and above the master relay close curve. The close contact of the master relay, and the close contact of the phasing relay are in series, as shown at the top of Figure 42. If both close contacts are made, and the protector is open (protector “b” contact closed), the motor control relay is energized, and the network protector closes automatically.

Figure 42:
Composite close characteristic for network protector
with electromechanical relays.
The electromechanical master relays, either the Westinghouse CN-33 or the General Electric CHN, have a single-pole double throw contact, as shown for the CN-33 relay in Figure 3, and at the top of Figure 42. With reference to the top of Figure 42, when the protector is open and VP is on or above the master relay close curve, the moving contact makes with the stationary close contact. When VP lies below the master close curve, the moving contact will either float between the stationary close contact and the stationary trip contact, or else make with the stationary trip contact.
Figure 43 shows at the bottom, the single-pole double-throw contact of the type CN-33 master relay, located behind the glass cover. The stationary close contact is on the right, and the stationary trip contact is on the left. This picture was taken when the network protector was closed with forward power flow. Thus, the master relay close contact is made. At the top of Figure 43 is the single-phase CN-J phasing relay, with the stationary close contact on the left, behind the glass cover. Because the protector was closed when the picture was taken, the phasing voltage VP is zero, and the phasing relay contact is open.

Figure 43:
Electromechanical CN-J phasing and CN-33 master relay
in closed network protector (photo by author).
If phasing voltage VP in Figure 42 lies sufficiently below the master close curve, the relay makes its trip contact when the protector is open. The literature published by the two manufacturers of the electromechanical master relays, Westinghouse and General Electric, did not show the curve giving the phasing voltage locus where the relay makes its trip contact when the protector is open, but this curve runs parallel to the master relay close curve. This is shown by the dashed green line in Figure 42. How far below depends upon the overvoltage close setting of the master relay, as well as the reverse current trip setting. For phasing voltages at 180o, the voltage that makes the trip contact is in volts.
Float Region
The region between the master relay close curve (solid red colored line) in Figure 42 and the dashed green curve showing where the trip contact makes is referred to as the float region. For phasing voltages in the float region, the master relay at the open network protector does not make either its close contact or its trip contact.
Figure 44 shows the position of the CN-33 relay single-pole double-throw moving contact under a float condition when the protector is open.

Figure 44:
Float condition in CN-33 electromechanical master
relay, front view.
Conditions Making Trip Contact at Open Protector
With the electromechanical master relays, either the type CN-33 or the type CHN, if the network protector is open and the relay trip contact is made, it could be due to several things. In general, if a network protector is open and the master relay is calling for a trip, never attempt to close the protecto. Possible reasons for the trip contact being made are:
-
The transformer side voltage, VT, is low relative to the network voltage, VN, due to the primary feeders coming from different bus sections in the substation.
-
A primary phase is open on the HV side of the network transformer.
-
The transformer side voltage, VT, is zero, due to a three-phase ground applied on the primary feeder with the feeder breaker at the substation being open.
-
Splicing was done on the primary feeder, and phases were either rolled, crossed, or rolled and crossed.
With the relay making its trip contact at the open protector, the voltages at the open protector should be measured to aid in determining the cause for the made trip contact.
Electromechanical Relay Straight-Line Close Curves
With the electromechanical master and phasing relays, the close curves are nearly straight lines. From Figure 42, as the phasing voltage angle θP goes more leading, the magnitude of the phasing voltage VP needed to satisfy the master relay close curve becomes larger. Thus, with the straight-line master close curve, as the phasing voltage at closure goes more leading, the watt flow in the protector following closure increases for two reasons.
-
The magnitude of the current flowing in the protector on closure, Ia, is proportional to the magnitude of the phasing voltage, VP.
-
The angle between the network line-to-ground voltage, VN, and the current in the protector following closure, Ia, decreases as VP goes more leading, because current Ia lags phasing voltage VP by the system impedance angle, θZ, regardless of the position of phasing voltage VP, as defined by θP.
It can be argued that if it is desired to have a forward watt flow above a specified level when the protector auto closes, then it is not consistent to require that the phasing voltage magnitude needed for closure be greater in magnitude as phasing voltage angle θP goes more leading.
Alternate Close Characteristics In Microprocessor Relays
In microprocessor relays, straight-line close characteristics similar to those in electromechanical relays, as well as circular close characteristics, are available. Figure 45 shows the circular close characteristic available in the type MPCV relay. It is also available in the microprocessor relays of the other suppliers.
With the network line-to-ground voltage, VN, the reference phasor, the magnitude of the phasing voltage needed for reclose is constant at the zero degree (V0) setting, and independent of phasing voltage angle, θP, providing the phasing voltage angle lies between the phasing line, labeled “PL” in Figure 45, and the left-hand master line labeled “LHML”. Furthermore, the phasing voltage required for closing is independent of the magnitude of the network line-to-ground voltage in the MPCV relay, where the network line-to-ground voltage VN is just the reference phasor. For the relay close-characteristic depicted in Figure 45, phasing line “PL” passes thru the origin, with its angle adjustable between +5o and -25o. In other microprocessor relays, the phasing line can be offset from the origin. The left-hand master line, LHML, passes through the origin, with its angle adjustable between 60o and 90o in the MPCV relay. When used in spot and grid networks, a setting of 90o is recommended for the LHML.

Figure 45:
Circle close characteristic with defined close, float,
and trip regions.
With the circular close characteristic, the magnitude of the current, Ia, that flows in the network protector following auto closure is independent of the phasing voltage angle, θP. However, as the phasing voltage angle θP goes more leading at time of closure, the watt flow into the network increases, because the angle between the protector current Ia and the network line-to-ground voltage VN decreases.
In the MPCV microprocessor relay having the circular close characteristic as in Figure 45, there is a well-defined float region, being circular of radius VF, and identified in the area with yellow shading. In the MPCV that uses positive-sequence quantities, the radius of this circle is 6%, or 7.5 volts on a 125-volt base. If the phasing voltage does not lie in the close region identified in Figure 45, and its magnitude is less than 6%, the relay does not make its close contact or its tip contact. This is a float condition. When the phasing voltage VP does not lie in the close region, yet its magnitude is greater than 6%, the relay makes its trip contact.
Figure 46 shows the LED indicator lights on the type MPCV network relay, which at an open protector, indicates if the phasing voltage VP in Figure 45 is in the close region, float region, or trip region.
The user should consult the instruction manuals of the other suppliers of the network relays for determining their float characteristics.
Figure 47 shows the straight-line close characteristics for the MPCV relay, where the phasing line, “PL” passes through the origin, and the master line, labeled “ML”, has a slope of about 7.5o, and the zero-degree phasing voltage needed to intercept the master line is labeled, “V0”, which is the adjustable close setting. The angle of the phasing line is adjustable between +5 and -25o. With the straight-line close characteristic, the relay makes its close contact if the phasing voltage VP lies within the close region.

Figure 46:
MPCV relay with indicating LEDs showing either float,
trip, or close at open protector (courtesy Eaton).

Figure 47: }
Straight-line close characteristics with defined float
and trip regions.
Also shown on Figure 47 are two phasing voltage phasors, identified as VP1 and VP2, neither of which lie within the close region, so the protector would not auto close for either. However, if the utilities operating procedures allow personnel to manually close the protector, the response following closure would be different for the two phasing voltages.
Remembering that the current that flows in the protector lags the phasing voltage by the system impedance angle:
-
For phasing voltage VP1, which is leading the network line-to-ground voltage, VN, following closure the real power flow would be into the network, and the network protector would remain closed.
-
For phasing voltage VP2, which is lagging the network line-to-ground voltage, VN, following closure the real power flow in the protector would be out of the network, and the protector would trip, assuming it has only a sensitive trip characteristic.
Some utilities may not allow an operator to attempt to manually close a network protector, but prefer that the protector close through its relays. In network relays which can be remotely monitored and controlled, when the phasing voltage magnitude and angle are available, the operator would know to close the protector for the leading phasing voltage, VP1, but know to not close it for phasing voltage VP2.
Figure 48 shows for the ETI MNPR relay the straight-line close characteristics and close region, as well as the float region. The bottom of the float region is defined by the Cross-Phase Voltage, VCP, which is adjustable from 10 to 49 volts on a 125-volt basis, with the recommended setting being 10 volts. When phasing voltage VP lies in the float region, neither the close contact or trip contact of the relay is made. Further, if the phasing voltage VP, for any phase, does not lie in the close region or in the float region, the relay trip contact makes. Manufacturer’s literature should be consulted for details.

Figure 48:
Straight-line close characteristics of the ETI MNPR
relay with float and trip regions defined.
Preferred Close Characteristics for Spot Networks
The microprocessor relays can be configured for either a circular close characteristic, or a straight-line close characteristic. The circular close characteristic is preferred for applications where the following circumstances are satisfied.
-
The relay is applied in a spot network, or a multibank installation feeding the area (grid) network.
-
The primary feeders to the network are dedicated, supplying only network transformers.
-
All primary feeders emanate from the same electrical bus in the same substation (bus-tie breakers closed).
-
The watt sensitive trip characteristic is selected, either the gull-wing as shown in Figure 23, or the straight-line trip characteristic.
In spot networks that have automatic power factor correction controllers maintaining near unity power factor or slightly leading power factor, the circle close characteristic allows auto closing at reasonable loads on the “in-service” network transformers in spot networks. Remember that if in a spot network the same voltage is applied to the high-voltage side of the network transformers, and one protector is open, the angle of the phasing voltage at the open protector is the sum of the impedance angle of the network transformer, θZ, plus the load current angle, which is “-“ for lagging power factor loads, zero for unity power factor loads, and “+” for leading power factor loads. From either Figure 47, or Figure 48, it is clear that when phasing voltage angle θP is in the 85 to 90-degree range as with unity or leading power factor loads, the phasing voltage will intercept the straight-line close curve only for excessive loads on the in-service network transformers.
Figure 49 shows the circular close characteristic available in the DigitalGrid network relay, where the left-hand master line, labeled “LHML”, can be set as high as 95 degrees. With this setting, the relay will allow closing at reasonable unity or leading power factor loads in spot networks and multibank installations. However, do note that if the protector closes when the phasing voltage is leading by more than 90o, following closure the var flow will be out-of-the network back towards the primary feeder.

Figure 49:
Circular close characteristic for the DigitalGrid
network relay.
The author believes from simulations he has conducted that the circular close characteristic should be used in spot networks and multi-bank installations supplied from dedicated primary feeders emanating from the same electrical bus in the substation. Further, he has heard from numerous network engineers that they have also used the circle close characteristic with great success in network protectors for the 208-volt area (grid) networks.
Open Protector Closing When Relay Trip Contact is Made
Under any of the conditions described before where at the network protector the relay trip contact is made (rolled or crossed phases, ground on primary feeder), it should not be closed. Older style network protectors such as CM-22, MG8 and MG9, did not have a close and latch rating, and never should be closed into a fault. On newer styled network protectors that have a close and latch rating, it is not prudent to close the protector for any of the conditions which make the relay trip contact at the open protector. It is for this reason that many operators of networks require that the microprocessor relay makes its trip contact for rolled and crossed phases, and for a three-phase ground on the primary feeder. For relays with the close characteristics as shown in Figure 45, 47, and 48, the trip contact makes, and the protector will not close automatically. However, this feature should not be relied upon and serve as a substitute for proper operating and testing procedures.
Some network protectors are designed with fault close capability such that with the protector open and the network relay trip contact made, the protector cannot be closed electrically. Examples of this are the type CM-D and type CM52. Further, these protectors can’t be closed by manual charging of the closing springs. Most users desire this feature in the network protector. The reasons for the relay calling for a trip at the open protector should be determined.
Comparison of Straight-line and Circular Close Characteristic
Figure 50 compares the straight line and circular close characteristics that have the same close setting at 0o, V0. For smaller phasing voltage angles θP, the difference in phasing voltage magnitude required for closure with the circle close characteristic (green-colored curve) and with the straight-line close characteristic (red-colored curve) is rather small, but this difference increases with increasing phasing voltage angle θP.
With the slope of the straight-line close curve being 7.5o as shown, for a 90o leading phasing voltage, the phasing voltage needed for auto closure is 7.6 times the zero-degree close setting, V0. For a straight-line close curve with a slope, θM of 5o in Figure 50, this becomes 11.4 times the zero-degree close setting, V0. Figure 51 plots, versus phasing voltage angle θP, the ratio of the phasing voltage magnitude needed with the straight-line close characteristic to that with the circular close characteristic for phasing voltage angles θP between 0o and 90o, for three different slopes, θM, of the straight-line master close curve. The effect on spot network operation is described later. In some microprocessor relays the slope of the straight-line close is adjustable, where in effect θM can be set as low as 0o. The relays where this is selectable refer to it as the close-tilt angle, which is 90o plus θM. Low close-tilt angle settings such 90 degrees are not recommended for most applications in spot networks, where the load power factor can be high.

Figure 50:
Overlay of circle and straight-line close
characteristics with same 0o close setting V0.

Figure 51:
Effect of master line slope on phasing voltage
magnitude needed to intercept close curve.
Protective Remote Close Characteristics
When a network protector is sitting open in a spot network or in a multibank vault for an area network, frequently the only reason the protector is open is that there is not sufficient load on the in-service network transformers in the spot network or multi-bank installation. As will be quantified later in this chapter, in these installations the magnitude of the phasing voltage at the open protector is the voltage drop thru the in-service network transformers when all transformers have the same voltage at their HV terminals. The protector may be open, because the primary feeder breaker was open, feeder out of service, and then restored, or maybe the protector was opened manually or remotely for maintenance.
Figure 52 shows the circular close characteristic of the type MPCV relay that operates on positive-sequence quantities (network line-to-ground voltages and phasing voltages). Phasing voltage V1P is the positive-sequence component of the three phasing voltages and is in the second quadrant but not of sufficient magnitude to intercept the circle close curve shown in red, having setting V0.
Yet for the angular position shown by V1P, if the protector were closed manually, the current phasor would lie in the first quadrant, and both the watt and var flows would be into the network following closure, and the protector would remain closed. But there just isn’t sufficient load on the in-service network transformers to produce a phasing voltage that will intercept the circle portion of the close curve shown in red. This explains why, when utility operating procedures allow manual closing of a protector with the operating handle after phasing checks are made, or remote closing when so equipped, the protector frequently remains closed.

Figure 52:
Protective-remote close available in one microprocessor
network relay.
Of course, if the protector were closed manually for a lagging phasing voltage as shown by phasor VP2 in Figure 47, it would immediately trip thru the sensitive trip curve.
Microprocessor relays are available with what might be called a protective remote close, or a relaxed close feature. In the MPCV network relay with the protective remote close (PRC) feature, the issuance of a PRC command does not emulate moving of the protector operating handle from open or automatic to close, and it does not override or bypass the network relay close logic by making the relay close contacts.
With reference to Figure 52, when a protective remote close command is issued to the MPCV relay from outside of the vault, with the normal close settings shown with the red colored curves in the figure, the radius of the circular portion is changed from V0, the normal setting, to about 75 millivolts, the left-hand master line, LHML angle is increased to its maximum value which is 90o, and the phasing line is rotated to -25o, giving the close characteristic shown by the green-colored lines. This in effect expands the close region. In Figure 52, phasing voltage V1P does not intercept the circle portion of the normal close curve, but following the PRC signal, V1P satisfies the protective remote close characterisic, and the protecor closes successfully, and remains closed.
However, if the phasing voltage V1P lies in the third or fourth quadrant, or if it is in the first quadrant and lags by more than 25o, the phasing voltage lies outside of the PRC close region, and the MPCV relay will not close the protector. For those situations where the phasing voltage V1P is in the first quadrant and lagging by close to 25o, it is possible that closing the protector will result in a pumping cycle. The PRC algorithm will not allow pumping under this condition.
The literature for the DigitalGrid and ETI MNPR relay should be consulted for their operation when given a remote close signal.
Dead Network Closing
A dead network refers to a condition in a spot network where all network protectors are open, no load is connected to the paralleling bus, and one or more network transformers are energized at rated voltage. These conditions could exist because a regenerative load tripped all network protectors (See Figure 29), or because testing of an emergency generator system (See Figure 36). They also will occur the first time a new spot network is energized, as the customers service switches are open. Many operators require that the network relay initiates closing of the network protector under dead network conditions when the protector operating handle is in the automatic position.
With a dead network as in Figure 53, the voltage appearing on each phase of the network bus is determined by the type of network protector, the type of relay in the protector, and the voltage of the system. Voltage Feed Through Open Network Protectors in Spot Networks of this chapter discusses this in more detail.

Figure 53:
Conditions defining a dead network.
In general, at the open protector, on each phase there is an effective impedance across the open contacts of the protector, and there is an effective impedance to ground on the network side of the open protector as shown in Figure 54. Impedances may also be between phases on the network side, depending on the type of relay in the protector. These impedances determine the network side line-to-ground voltages, and the phasing (difference) voltage VP.
With the dead network as defined, the voltage from each phase-to-ground on the network side are determined by the impedances within the open protector. With the electromechanical relays such as the CN-33 master relay and the CN-J phasing relay installed in the protector, the voltages (phasing VP and network VN) are such that the master relay makes its close contact, but the phasing relay close contact is open. The protector will not close onto a dead network. However, if a resistive load is connected from phase-to-ground on the phase to which the CN-J phasing relay is connected, the voltages applied to the phasing relay shift such that the direction of the torque is to make the close contact of the CN-J phasing relay. The resistive load must draw at rated voltage 100 watts or more times the number of protectors in the spot network to assure the phasing relay contact makes. It is for this reason that some utilities installed resistive load from phase-to-ground in spot networks.

Figure 54:
Relay and control-circuit parameters affecting dead
network voltage.
The microprocessor relays of the different suppliers also have some type of dead network closing logic, and the manufacturers literature should be consulted. Here the logic used in the MPCV relay will be described. For this relay, the power supply will function when there is no voltage on the network side of the open protector, providing there is voltage on the transformer side. Figure 55 shows the relay in an open protector with the dead network.
The transformer side of the protector is energized at rated voltages to ground. The relay calculates the positive-sequence component of the three phase-to-ground voltages on the network-side, shown as VAN, VBN, and VCN using eq (35), and the negative-sequence component of the network-side line-to-ground voltages using eq (36). Finally, it calculates the positive-sequence components of the phasing voltages VAP, VBP, and VCP using eq (37).
(35)
$$ \ \ \ V_{1N} = (V_{AN} + aV_{BN} + a^2 V_{CN}) \text{/3}$$
(36)
$$ \ \ \ V_{2N} = (V_{AN }+ a^2 V_{BN} + aV_{CN}) \text{/3}$$
(37)
$$ \ \ \ V_{1P} = (V_{AP} + aV_{BP} + a^2 V_{CP}) \text{/3}$$
The MPCV relay will close onto a dead network if the three inequalities given by eq (38) are satisfied. When these are satisfied, essentially it means there is very little or no voltage on the network side of the open protector, and that the phasing on the transformer side of the open protector is correct. With the relays that use positive-sequence quantities, it is imperative that the sequence of the voltages applied to the relay be correct, and if not, the output of the positive-sequence voltage filter, which is the reference for the close and trip curves, is zero.

Figure 55:
Dead network conditions when protector has MPCV
microprocessor relay.
(38)
$$ \ \ \ V_{1N} \lt 0.10 \text{ per unit, } \enspace V_{2N} \lt 0.06 \text{ per unit, } \enspace V_{1P} \gt 0.80 \text{ per unit }$$
Another approach for detecting a dead network is that which was used in early solid-state relays, as provided by TEMPO Instruments and brand named the SSNPR for General Electric. Figure 56 is a simplified diagram of a Westinghouse type protector with the SSNPR relay.
Note from Figure 56 that the relay power supply is connected from one phase to ground on the network side of the protector, and with voltage applied to the network, the relay trip and close logic will function. But with a dead network condition, the logic may not function, depending on the voltage to ground on the phase with the power supply. As shown, an undervoltage relay is fed from the network side of the protector, and with no or low voltage its contacts, which parallel the relay logic close contacts, are closed. Thus, with the network dead, and the transformer side energized, the protector will close.
The SSNPR literature, GEK-39809, states, “A dead network relay is provided which will close the protector when two or more phases of the network voltage are down”. Under the specification section, it is stated, “Dead Network Relay: Pickup 60 VLN, drop out 20 VLN”. With reference to Figure 56, this could be interpreted to mean that when all three phase-to-ground voltages drop below 20 volts rms, the dead network relay contacts make.

Figure 56:
Dead network control with GE SSNPR relay applied in
Westinghouse type network protectors.
Figure 57 shows the control scheme, simplified, when the SSNPR is applied in a GE type network protector. It is similar to that in Figure 56. When the network side is energized under normal operating conditions, the relay power supply is energized at near rated voltage, which allows the relay close logic to close the protector by energizing the motor control relay.
In Westinghouse type network protectors, with nothing connected to the network side of the open protector, the voltages on the network side usually are sufficiently low that the contacts of the dead network relay are closed, and the protector will close if the transformer side is energized.
But in the GE network protectors, connected across the open contacts of the protector are the auxiliary windings of the current transformers, that supplied phasing voltage to the GE electromechanical relays when the protector is open. This provides a relatively low impedance connection across the open contacts of the protector, so that significant voltage appears on the network side of the open protector when nothing is connected to the network side (dead network).

Figure 57:
Dead network control with GE SSNPR relay applied in GE
type network protectors.
The data in Table 2 gives voltage measured on a GE type network protector with different types of network relays installed when there was no load connected to the network side of the open protector.
The measurements were made by Mr. William Rinks, deceased, of the Alabama Power Company, and shared with the author.
In the first row in red are the voltages applied to the transformer side of the GE MG-8 U protector. In the second row in blue are the voltages measured on the network side of the open protector when no relays were installed. For practical purposes, the voltages on the network side are the same as those on the transformer side. In the remaining rows are the measured voltages with just the CHN master relay installed, the MPCV-GE which is a version of the MPCV for application on GE type protectors, and in the last row the voltages measured when the protector has the type 40 SSNPR relay.
From the last row of Table 2, it can be seen that if the dead-network under-voltage relay picks up at 60 volts, the voltages on the network side are too high to allow dead network closing. Some load would have to be connected to the network side of the open protector to lower the network-side voltages to the level where the dead network relay in Figure 57 will drop out. But with voltages as given in the last row of Table 2, the relay power supply would function, but the response of the relay close logic with the unbalanced voltages is not known. If both the master close logic and the phasing close logic are satisfied, then the protector would close for the conditions in the last row of Table 2.
Table 2:
Voltages measured on GE network protector with nothing
connected to network side.
RELAY INSTALLED ON MG-8 U 3000/5 CT’S |
NETWORK SIDE VOLTAGES IN VOLTS(2) | |||||
|---|---|---|---|---|---|---|
LEFT TO CENTER |
CENTER TO RIGHT |
LEFT TO RIGHT |
LEFT TO GRD |
CENTER TO GRD |
RIGHT TO GRD |
|
VOLTAGES APPLIED, TRANSFORMER SIDE |
209.2 | 208.6 | 209.6 | 121.3 | 120.4 | 120.9 |
| NO RELAY | 209.3 | 208.6 | 209.4 | 121.2 | 120.2 | 120.7 |
| CHN (ONLY)(1) | 151.1 | 171.1 | 193.5 | 101.1 | 86.6 | 111.1 |
| MPCV - GE | 193.6 | 193.2 | 193.9 | 113.9 | 113.5 | 114.0 |
| 40 SSNPR | 192.8 | 192.6 | 208.1 | 120.4 | 104.7 | 121.4 |
-
CHL phasing relay not installed at time of test. Voltages would be different with CHL installed
-
Voltages measured with Fluke Model 75 DMM, 10 MΩ input impedance.
It is believed that an approach similar to that shown in Figure 57 is used in some microprocessor relays, where the power supply is connected from one phase-to-ground on the network side of the open protector, with an undervoltage relay provided for dead network closing. If the network is dead with zero-volts from each phase-to-ground, the relay power supply can’t power the microprocessor, and closing algorithms can’t be run. However, with the undervoltage relay contacts in parallel with the logic-controlled close contacts, the contacts of the under-voltage relay would be closed, and the protector would close. But if the voltages on the network are above the level where the undervoltage relay drops out, at levels as given in the last row of Table 2, it must be determined from the relay manufacturers how the relay would respond.
One advantage of the undervoltage dead-network relay is when re-energizing an entire network system that had been dropped. With the dead network relay being an undervoltage relay, its contacts are closed when the entire network system is de-energized. When all network transformers are re-energized by simultaneous energization of all primary feeders to the network, at the instant the feeders are energized, the closing circuits of the open network protectors are energized with the closed contacts of the dead network relay, and the protectors close. In contrast, with the dead network logic of the MPCV, when the feeder is energized, the relay power supply, which is sourced from both the transformer and network side of the protector, must boot up, before the close signal can be given to the protector through the dead network logic defined by eq (38).
Other Features In Microprocessor Relays
Numerous other features are available in microprocessor network relays that were not possible in electromechanical relays. There are various ways to communicate with the relay to changes settings, capture current and voltage data, capture voltage and current waveform data following a fault on the network primary feeder that results in opening of the protector, to remotely trip and block open a protector, and as indicated earlier to issue a protective remote close to an open protector. One feature intended for operator protection when working in 480-volt spot networks is sensing and rapid tripping of network protectors to reduce arc flash incident energy.
With remote communications capability, it is possible to determine if a protector fuse is blown, a protector does not close when the relay close contact is made, or a protector does not trip when the trip contact is made. At an open protector, the magnitude and angle of the phasing voltage can be obtained. Alarms can be generated when the network transformer or vault temperatures are high, or there is excessive water in the vault. To learn about all of the capabilities with remote communications to network relays, and all of the other capabilities, the reader is referred to the literature of the suppliers, Eaton, DigitalGrid, and Electronic Technologies Incorporated (ETI).
Effect of Phase Sequence
In microprocessor relays that are power based, the basic close and trip algorithms, as discussed in Trip Algorithms for Microprocessor Relays based on the info in the SEL instruction manual, should not be affected by phase sequence, as the calculation for the P-Q point in the watt-var coordinate plane is independent of phase sequence. However, with the sequence-based relays such as the MPCV, or the DigitalGrid relay programed for sequence operation, the correct phase sequence must be applied to the relay. Otherwise, the output of the positive-sequence voltage filter, V1N, would be near zero volts under normal conditions, and a reference phasor would not exist for the close and trip characteristics.
Because of this, the MPCV relay on power up makes its trip contact if the phase sequence is different than what for which the relay is programed.
With the older electromechanical master relays, the Westinghouse CN-33 and the GE CHN, phase sequence has a minor effect on the trip and close characteristics of the CN-33 relay, but with the CHN relay, the phase sequence of the voltage applied to the network protector must be that for which the network protector is wired, because the potential coils of the GE CHN master relay are connected from phase-to-phase. With both the Westinghouse and GE phasing relays, which are single-phase devices with the potential coil connected from phase-to-ground, phase sequence has no impact on their close characteristics.
How phase sequence impacts the master relays will be explained from an actual incident in a spot network, which will be assumed to be a two-unit spot as in Figure 58.
In Figure 58, both network transformers are connected delta wye-grounded, with HV system phases A, B, and C applied to network transformer high-voltage terminals H1, H2, and H3 respectively. The phase sequence on the secondary side is left, center, and right as shown when looking into the network transformer throat. On network transformer 1 is a Westinghouse protector with CN-33 master relay, and on network transformer 2 is a protector with a GE CHN master relay. Both protectors were wired for “a”, “b”, and “c” phase sequence from left-to-right looking into the front of the protector.
Shown at the bottom of Figure 58 are the straight-line close and trip characteristics of the CN-33 and CHN electromechanical relays when the phase sequence applied to the protector is that for which it is wired. Also shown on the trip characteristic are two current phasors, the current under normal loading with the red-colored phasor, and the current during starting of a large motor on the spot network with the blue-colored phasor, where the power factor during motor start is much lower. Clearly the protectors would not trip during motor starting conditions.

Figure 58:
Close and trip curves with correct phase sequence
applied to both transformers in the two-unit spot network.
The customer supplied from the spot network asked the utility to change the phase sequence of the system supplying his service. Swapping heavy secondary connections was not an option, so during an outage, primary phases where reconnected to the HV side of the network transformers as shown in Figure 59. System phase C was connected to transformer terminal H2, and system phase B was connected to transformer terminal H3.
The effect of changing the connections to the HV side of the network transformer on the relay trip characteristics in the two protectors is shown at the bottom of Figure 59. For the Westinghouse CN-33 relay, the slope of the trip curve practically does not change. However, the 180-degree current needed to make the trip contact increases slightly as changing the phase sequence changes the direction of the voltage only torque in the relay (see Figure 44).
With the GE CHN relay, as shown at the bottom right-hand side of Figure 59 , when the phase sequence applied to the GE CHN is different than that for which the network protector is wired, the trip curve is rotated approximately 60 degrees counter-clockwise from its normal position.
Figure 60 shows the effect of applying a phase sequence to the protector that is different than for which it is wired, on the close characteristics of the CN-33 master relay, and the CHN master relay. Primary system phases B and C are connected to network transformer HV terminals H3 and H2 respectively, to change the phase sequence on the secondary.

Figure 59:
Trip curves with reversed phase sequence applied to
both transformers in the two-unit spot network.
As shown on the bottom left-hand side of Figure 60, the slope of the CN-33 close characteristic stays essentially the same, but the zero-degree phasing voltage needed for close decreases due to the change in direction of the voltage only torque produced by the three potential coils when the phase sequence applied to the relay is different than that for which it is wired. But as shown at the bottom right-hand side of Figure 60, the CHN master close curve is rotated about 60 degrees counter-clockwise from its position when the phase sequence is that for which the protector is wired.
In the spot network system where the phase sequence was changed by swapping two HV phases to the network transformer, it was observed that the operation of the Westinghouse protector was stable, but that the GE protector with the CHN master relay had a large number of operations. The opening of the GE protector occurred when a large motor was started, which caused the current phasor to move into the trip region of the CHN relay as shown on the right-side in Figure 59. After the GE protector opened, the load was on the transformer with the closed protector, the GE protector, with close characteristic as in Figure 60, bottom right-hand side, would reclose. It then would trip the next time the large motor was started. The solution to the problem was to change the wiring in the GE protector according to the instructions on the wiring diagram of the GE protector.

Figure 60:
Close characteristics with reversed phase sequence
applied to HV side of network transformers.
To confirm the observations made above, tests were run on a 480-volt MG8-U protector with a three-phase portable test set at the Duquesne Light Company shops in Pittsburgh, PA. They not only confirmed the effect of incorrect phase sequence on the operation of the CHN relay, but revealed the “float” zone for the CHN relay. Figure 61 shows the results of the tests.
The solid green curve shows the CHN close curve when the voltage applied had the phase sequence for which the GE protector was wired. It is based on three test points for phasing voltages at 0o, 10o, and 60o as shown with the heavy green dots. The dashed green curve shows the phasing voltage where the relay trip contact made, based on phasing voltages at 120o, 180o, and 240o. This shows the float region, but note from the green colored curves that the slope of the close curve is different than shown in the manufacturer’s literature.
The solid red-colored curve and dashed red-colored curve show respectively the phasing voltage where the CHN close contact made, and where the CHN trip contact made when the applied phase sequence was different than that for which the protector was wired. These two curves also show the existence of the “float” region in the CHN electromechanical master relay. From either the red colored curves, or the green colored curves, the width of the float zone is about 9 volts on a 277-volt base, or 4.06 volts on a 125-volt base. The assistance of Mr. Jim Coulter, retired from the Duquesne Light Company, in making these test is gratefully acknowledged.

Figure 61:
Results of tests on GE protector with CHN relay to show
effects of phase sequence on the close characteristic, and the float
region.
Rolled and Crossed Phase Phasing Voltages
In the normal operation of network protectors, when the protector is open, the individual phasing voltages, VP, on a 125-volt base, typically would be less than 10 volts. However, following cable work on the primary feeder, or in the secondary, it is possible that phases can be rolled or crossed. Whenever work is performed on primary cables or splices are made, it is good practice to measure the phasing voltages at an open protector downstream from the work location, to ensure that phases have not been rolled or crossed. Preferably, this is done at a 216-volt protector rather than a 480-volt protector. Regardless, as discussed before, most users require that if phases are rolled or crossed, the network relay makes its trip contact at open protectors, just as happens with both the GE and Westinghouse electromechanical master relays.
Grounded-Wye Grounded-Wye Network Transformers
With the network transformers having the wye-wye connections, at the open network protector:
-
If phases are rolled on either the primary side or the secondary side, the magnitude of each of the three phasing (difference) voltages, VP, will be near the nominal phase-to-phase voltage of the secondary system.
-
If any two phases are interchanged (crossed) on either the primary or secondary side of the transformer, one of the phasing voltages will be in the range of normal phasing voltage and be less than about 10 volts on a 125-volt base. The other two phasing voltages will be near nominal phase-to-phase voltage of the secondary system.
-
If phases are first rolled on either the primary or secondary side of the network transformer, and then any two phases interchanged (crossed), one of the phasing voltages will be in the range of normal phasing voltage, less than 10 volts on a 125-volt base, and the other two phasing voltages will be near nominal phase-to-phase voltage of the secondary system.
Delta Grounded-Wye Network Transformers
When network transformers have the delta grounded-wye connections, and phases are rolled, crossed, or rolled and crossed on the network side of the open protector, the phasing voltages will be the same as with the wye-wye connected network transformer as discussed above.
When phases have been rolled on the primary side of one of the network transformers as in Figure 62, the phase sequence applied to both transformers is the same. In this figure, primary phases A, B, and C are connected to transformer 1 HV terminals H1, H2, and H3 respectively, whose protector is closed and energizing the network paralleling bus. The network bus line-to-ground voltages “an”, “bn”, and “cn” lag the voltages applied to the HV side of transformer 1 by 30o as shown by the blue-colored phasors in the figure. These are the voltages applied to the network side of the open network protector on transformer 2.
At network transformer 2, whose protector is open, primary phases A, B, and C are connected to HV terminals H2, H3, and H1 respectively. The phase sequence on the secondary side of transformer 2 is the same as that on the secondary side of transformer 1, but advanced by 120 electrical degrees. That is, the primary phases for transformer 2 have been rolled. Thus, at the low-voltage terminals of transformer 2, whose protector is open, the phase-to-ground voltages at terminals X1, X2, and X3 are leading those at terminals X1, X2, and X3 respectively at transformer 1 by 120o. The line-to-ground voltages applied to the transformer side of the open protector at transformer 2 are shown by the red-colored phasors labeled “at”, “bt”, and “ct”. The phasing (difference) voltages at the open protector are the difference between the transformer and network side line-to-ground voltages. From the pink colored phasors at the bottom of the Figure 62, the phasing voltages are equal to the nominal phase-to-phase voltage of the system, and they are leading their respective phase-to-ground network voltages (blue colored phasors) by 150o.

Figure 62:
Phasing voltages at open protector for rolled phases on
HV side of delta wye-grounded transformer.
If phases are crossed on the primary side of the delta wye-grounded network transformer, as in Figure 63 for transformer 2, the voltages on the secondary side can be found from the quasi-phasor diagram of the network transformer, as given on the nameplate. The quasi-phasor diagram is shown in black in both Figures 62 and 63.
In Figure 63, on transformer 1, primary phases A, B, and C are connected respectively to terminals H1, H2, and H3. At the secondary side terminals of transformer 1, the protector is closed supplying the network paralleling bus. The line-to-ground voltages at the secondary terminals X1, X2, and X3 of transformer 1, shown with the blue-colored phasors, are lagging by 30o the line-to-ground voltages applied to the HV terminals H1, H2, and H3 of transformer 1, respectively. This is the standard 30o phase shift that occurs in a delta wye-grounded transformer when positive-sequence voltages are applied to transformer 1 HV terminals H1, H2, and H3. The secondary side voltages, “an”, “bn”, and “cn” shown with the blue-colored phasors are the voltages on the network bus, and the voltages applied to the network side of the open network protector on network transformer 2.

Figure 63:
Phasing voltages at open protector for crossed phases
on HV side of delta wye-grounded transformer
Shown at the bottom of Figure 63 are the voltages applied to the transformer side of the open protector with the red-colored phasors, labeled “at”, “bt”, and “ct”. From these and the network side voltages “an”, “bn”, and “cn” shown with the blue-colored phasors, it is seen that the phasing voltages for two of the phases are equal to the nominal line-to-ground voltage of the system, 1.0 per unit, and in the third phase it is equal to twice the nominal line-to-ground voltage, 2.0 per unit.
Another possibility is that on the HV side of network transformer 2, the phases are first rolled, and then phase B and C crossed such that phase A is to terminal H2, phase B is to terminal H1, and phase C is to terminal H3. This condition is shown in Figure 64.
When a network protector is open, and the trip contact of either the electromechanical master relay or the microprocessor relay is made, the control circuits in many network protectors are such that the protector will not reclose automatically. The user should consult the wiring diagrams of the specific network protector to determine the response of the open protector when the network relay trip contact is made. In this sub-section, is a discussion of the response of several different network protector types, but it is not all inclusive.

Figure 64:
Phasing voltages at open protector for rolled
Network Protector Response With Rolled or Crossed Phases
CM-22 Network Protector
Figure 65 is a simplified control schematic for a type CM-22 network protector, where the protector is open, the network side is energized at rated voltages, and phases on the primary side have been either rolled or crossed. Further, it is assumed that the protector has the electromechanical CN-33 master relay and the CN-J phasing relay.
The master relay trip contact is made, and the master relay close contact is open. The contact of the phasing relay could be either closed or open. Regardless, with the master relay close contact open, and the “J” switch contact closed when the protector operating handle is in the automatic position, the motor control relay will not pickup, and the protector will not close automatically under the crossed or rolled phase condition.
Although the protector with control circuits shown in Figure 65 will not close automatically, it is possible that an operator would attempt manual closing by moving the operating handle of the CM-22 from the “automatic” position to the “close” position. If this were done and the protector linkages and auxiliary contacts were in perfect alignment, with the master relay trip contact made, as the moving arcing contacts approach the stationary contacts, the “a” contact in series with the protector trip coil would make before the arcing contacts close, and the protector would trip free. However, it has been found from field measurements that over time the mechanical linkages and “a” switch can be out of adjustment, and the arcing contacts can make during manual closing. Never attempt to manually close a type CM-22 network protector when the relay trip contact is made. It does not have a fault close rating.

Figure 65:
Simplified control circuit for type CM-22 network
protector.
CM-D Network Protector
The type CM-D network protector was designed to have a fault close rating, as well as other features unique to it when it was introduced in the 1970’s.
Figure 66 is a simplified control diagram of the type CM-D network protector, where the protector is open, the network side is energized, and on the primary side of the network transformer phase have been either rolled or crossed. The protector is fitted with the MPCV microprocessor relay, whose trip contact is made, and the close contact is open. The CM-D protector was specifically designed such that with the protector open and the network relay trip contact made, it could not be closed electrically or by manual charging of the closing springs.
With the MPCV trip contact made, and the protector open, this energizes relay coil BF2. This opens the normally closed BF2 contact in series with the “JC” contact which closes when the protector operating handle is placed in the “close” position. Thus, with the protector open and the operating handle placed in the close position, the closing motor for charging the closing springs will not be energized.
If an operator attempts to manually charge the closing springs and close the protector, before the closing springs are fully charged, the “W” contact makes. But with BF2 coil energized, the BF2 normally open contacts in series with the anti-close circuit energize the “AC” coil, which prevents the completion of the manual charging of the closing springs.
Further, if the protector operating handle were in the automatic position, switch “JA” closed, the protector will not close with rolled or crossed phases as the MPCV relay close contact is open.

Figure 66:
Simplified control circuit for type CM-D network
protector with anti-close features
CM-52 Network Protector
Figure 67 is a simplified control circuit for the type CM-52 network protector, which also has circuits to prevent electrical or manual closing of the open protector if the MPCV relay trip contact is made. When the protector is open, if the MPCV relay trip contact is made, BF2 coil is energized through the MPCV trip contact, and the normally closed BF2 contact in the close output circuit is open, which prevents protector closing with the external operating handle (43 close contact).
Although there are features built into network protectors and their control circuits that will prevent closing when there are rolled or crossed phases in the system, good safety practice is to never attempt to close the protector when the relay trip contact is made. Whenever there is an issue with an open protector, the wiring diagram for the specific protector should be consulted to determine its response when open and the network relay trip contact is made. In addition, phasing voltages at the open network protector should be measured, and phase-to-ground voltages on both sides of the open protector should also be measured to help in determining the reason for the protector not closing. Some utilities have the practice to never close the protector manually, but place the operating handle in the “automatic” position, and allow the network relays to close the protector.
Phasing Voltages in Spot Networks
As indicated by Blake (Blake 1928b), the phasing voltage at an open network protector is due to impedance voltage drops along the network feeders, through the network transformers, and along the secondary mains. Further, if the primary feeders to a network come from different substations, or substations with open bus-tie breakers, phasing voltage will exist at the open protector from differences in both bus voltage magnitude and bus voltage angle at the substation. Regardless of the cause of the phasing voltage, the current that flows in the network protector following closure will lag the phasing (difference) voltage VP by the system impedance angle, θZ, with the impedance angle typically being between 72o and 85o.

Figure 67:
Simplified control scheme for type CM-52 network
protector.
For spot networks or multibank installations supplied from primary feeders that emanate from the same electrical bus in the substation, if the feeders from the substation to the network transformers have equal voltage drops, then the phasing voltage at an open network protector is due to just the voltage drop in the network transformer whose protector is closed. Although this situation is never completely satisfied in practice, examination of it gives significant insight into factors affecting the phasing voltage magnitude and angle at the open protector, and the load needed on the in-service network transformer to cause auto closing of the open protector.
Voltage Drop In Closed Network Protector
Factors affecting the phasing voltage needed for closure of the open protector are:
-
The loading level on the in-service network transformers, in percent of transformer rated kVA.
-
The network load power factor.
-
The network relay close characteristic, straight-line or circle, and the zero-degree close setting (V0 setting) of the network relay.
-
The network transformer impedance (both magnitude and angle).
Figure 68 shows a spot network where the same voltage is applied to the HV terminals of both network transformers. All network transformers in the spot network are assumed to have the same kVA rating and impedance, both magnitude and angle. One protector is closed and the other is open. This simplified situation gives significant insight, in conjunction with the relay close settings and characteristics, on the load that must be on the in-service network transformer to cause auto closing of the open network protector.

Figure 68:
Phasing voltage in a two-unit spot network with same
voltages at HV terminals of both network transformers.
The symbols in Figure 68 are defined below.
IL = Network load current in per unit of the rating of one network transformer.
θL = Angle of the network load current IL relative to the network line-to ground voltage, VN, in degrees. For lagging power factor loads, this angle is “negative” in sign.
ZT = Magnitude of the network transformer leakage (nameplate) impedance in per unit.
θZ = Angle of the network transformer leakage impedance in degrees, as determined from the X to R ratio of the leakage impedance.
VP = Magnitude of the phasing voltage at the open protector in per unit of the rated phase-to-ground voltage of the network transformer LV windings.
θP = Angle of the phasing voltage at the open network protector relative to the network line-to-ground voltage, VN.
From Figure 68, the phasing voltage at the open network protector is simply the voltage drop across the network transformer with the closed protector, shown as ∆VT. The magnitude of the phasing voltage at the open protector in per unit is given by eq (39).
(39)
$$ \ \ \ V_{P-PU} = I_{L}Z_{T} \text{ per unit} $$
The magnitude of the phasing voltage at the open protector in volts, is the per unit value from eq (39), times the rated line-to-ground voltage of the transformer on the secondary, VRATED, in volts, typically either 125 or 277 volts.
(40)
$$ \ \ \ V_{P-VOLTS} = V_{P-PU} V_{RATED} = I_{L}Z_{T}V_{Rated} \text{ Volts} $$
The angle of the phasing voltage, θP, relative to the network line-to-ground voltage, VN, at the open network protector is given by:
(41)
$$ \ \ \ \theta_{P} = \theta_{Z} + \theta_{L}$$

Figure 69:
Straight line and circular close characteristics for
network relays.
Straight Line Close Characteristic
With reference to Figure 69, the magnitude of the phasing voltage in volts, VP-VOLTS, needed to intercept the straight-line close curve is given by eq (42).
(42)
$$ \ \ \ V_{P-VOLTS} = V_{0} \frac{\cos{(\theta_{M})}}{\cos{(\theta_{M} - \theta_{P})}} Volts \ = V_{0} \frac{\cos{(\theta_{M})}}{\cos{(\theta_{M} - \theta_{Z} - \theta_{L})}} Volt $$
In eq (42):
V0 = zero-degree close setting in volts in Figure 69
To determine the per unit load needed for the phasing voltage to intercept the straight-line close curve, the magnitude of the phasing voltage from system analysis as given by eq (40) is equated to that given by eq (42) based on relay settings, slope of the straight-line master close curve, θM, and the impedance and current angles. Doing this gives:
(43)
$$ \ \ \ I_{L}Z_{T}V_{RATED} = V_{0}\frac{\cos{(\theta_{M})}}{\cos{(\theta_{M} - \theta_{Z} - \theta_{L})}} $$
Next, eq (43) is solved for the per unit load on the in-service network transformer needed for the phasing voltage to intercept the straight- line close curve.
(44)
$$ \ \ \ I_{L} = \frac{V_{0}}{Z_{T}V_{RATED}} \frac{\cos{(\theta_{M})}}{\cos{(\theta_{M} - \theta_{Z} - \theta_{L})}} \enspace per \enspace unit $$
From eq (44), it is seen that the load needed for auto closing:
-
Increases with the V0 close setting of the relay
-
Increases as the impedance of the network transformer, ZT, decreases
-
Increases with lowering of the slope of the straight-line master close curve angle (lowering of the close-tilt angle), shown as θM in Figure 69.
Circle Close Characteristic
When the relay has the circle close characteristic as shown by the green colored curve in Figure 69, for the conditions considered in Figure 68, the phasing voltage in volts for closure must equal the relay V0 setting. Setting the phasing voltage from the system analysis as given by eq (40) to the V0 setting in volts, and solving for IL, gives the per unit load needed for automatic closing with the circle close characteristic.
(45)
$$ \ \ \ I_{L} = \frac{V_{0}}{Z_{T}V_{Rated}} \text{ per unit} $$
Eq. (45) says that the per-unit load needed for closure with the circle close characteristic is the V0 setting in volts, divided by the voltage drop across the in-service network transformer at rated load.
Loading Curves For Automatic Reclosing in Spot Networks
The effect of relay settings, load power factor, network transformer impedance and angle, on the load needed for auto closure in the system of Figure 68, when the same voltage is applied to the HV side of all network transformers, can be plotted with eq (44) and eq (45) for relays with the straight-line close characteristic and circle-close characteristic respectively. Although the equations developed are for a two-unit spot network, they also apply for any number of units in the spot, recognizing they give the loading needed on each in-service network transformer, assuming the load on the spot network divides equally.
Figure 70 plots the per unit load on each in-service transformer needed for auto-close, for 5% impedance network transformers with X to R ratio of 8 (red-colored curve) and 4 (blue-colored curves) when the relay has the straight-line close curve, with the slope θM being 7.5o (close tilt angle of 97.5o). Curves are given for a V0 setting of 1.0 volt and 1.5 volt. The curves are plotted for load power factors from 75% to 100%, from which it is seen that at the high-power factors the curves turn up significantly.
The dashed green colored curves in Figure 70 show the load needed for auto close when the network relay has the circle close characteristic. Notice that it is independent of network load power factor.
Figure 71 plots the same information as Figure 70, except that the slope of the master close curve, θM, is just 5o (close tilt angle of 95o). This shows that lowering the slope of the straight-line master curve results in an increase in the per unit load needed for auto close. And if the slope of the master close curve, θM were set to 0o, which corresponds to a close-tilt angle of 90 degrees, the load needed for auto close increases significantly. For most applications, when adjustable in the microprocessor relays, a close-tilt angle of 90 degrees is not recommended. But obviously angle θM has no effect on the network load needed for auto-close with the circle close characteristic, as shown by the dashed green colored curves in Figure 70 and 71.

Figure 70:
Per unit loading with 5% impedance transformers and
master slope θM of 7.5o

Figure 71:
Per unit loading with 5% impedance transformers and
master slope θM of 5.0o.
From eq (44) and (45), the load needed for auto close varies linearly with the zero-degree close setting, V0, and inversely with the impedance of the network transformer. Consequently, when the network transformers have 7% impedance, everything else the same, the per unit load needed for auto closing with either the straight-line or circle close characteristic will be 71.4% of that required with 5% impedance transformers.
Transformers with 7% impedance are 1500 kVA or larger applied in 480-volt spot networks. Thus, in applying eqs (44) and (45) for 7% impedance transformers, VRATED is 277 volts, and V0 is the relay close setting on a 125-volt base times the ratio of 277 to 125, which is approximately 2.2. Figure 72 plots the load needed for auto closing with 7% impedance network transformers with X to R ratios of 8 and 13, for V0 settings of 1.0 volt and 1.5 volt on a 125-volt base.
From eqs (44) and (45), to have a network protector in spot networks with 7% impedance transformers auto close at the same per unit load required with 5% impedance transformers, the zero-degree close setting V0 on a 125-volt base should be 1.4 times the setting used on relays in spot networks with 5% impedance network transformers. However, most utilities use the same relay V0 setting on a 125-volt base, regardless of whether the network transformer impedance is 5% or 7%.

Figure 72:
Per unit loading with 7% impedance transformers and
master slope θM of 7.5o.
Sometimes users have installed spot networks using single-phase transformers in a three-phase bank. One reason cited for this is that three-phase transformers are to large or heavy to fit in elevators needed to put them on the upper floors of a building. When this is done, sometimes the impedance of the single-phase transformers is much lower than the standard 5% used for network transformers.
Having a lower impedance not only increases the circulating current in the two-unit spot network when both protectors are closed, but if a protector opens, it requires a very large load on the in-service transformer to get the open protector to close, whether the network relay has the straight-line or circle close characteristic. This is illustrated in Figure 73 where it is assumed the single-phase transformers in the bank have an impedance of 2.3%, and that the master relay has a straight-line close characteristic with a slope, θM, of 7.5 degrees.
In Figure 73, the red colored curves are for transformers with an X to R ratio of 6, and the blue colored curves are for transformers with an X to R ratio of 3. With a 1.5-volt close setting, and higher power factor network loads, the loading on the in-service network transformer needed for auto close of the open network protector approaches the rating of the network transformer. Even when the circle close characteristic is selected, if the V0 setting is 1.5 volts, a load of about 0.52 per unit of the kVA rating of the in-service network transformer is needed for auto reclose of the open protector.
From this example, using transformers with impedances below the standard levels for network transformers may create operating problems in spot networks.
Impact of Relay Settings on Tripping & Closing In Spot Networks
The effect of network relay characteristics and settings on tripping and closing in two-unit spot networks is discussed in this section. This aids in identifying measures that are helpful in solving either cycling or pumping problems in network protectors.

Figure 73:
Per unit loading with 2.3% impedance network
transformers and master slope θM of 7.5o.
Pumping
“Pumping” refers to the situation where, upon closing of the network protector, the network relay in the protector makes its trip contact and the protector opens. Upon opening, the network relay makes its close contact, and the protector closes automatically. This condition continues until system conditions change, until network relay settings are changed, until the protector is blocked open, or until a failure occurs. The period of the pumping cycle is determined primarily by the closing time of the protector following making of the network relay close contact. Network protector closing time depends upon type of protector, and usually is between 0.5 and 5.0 seconds.
With certain protectors, the pumping can result in failure of the closing motor, failure of the control power transformer, or failure of other components in the protector. Microprocessor network relays have an anti-pump feature that limits the number of open/close operations that can occur in a specified time period. When the allowed number is exceeded, the protector is locked open for a specified reset time. Later it is shown how protectors can pump for normal relay settings when the spot network is fed from substations with open bus tie breakers.
Cycling
“Cycling” refers to the situation where a network protector experiences a large number of operations throughout the daily load cycle, as a result of changes in load on the spot network, or changes in load on the feeders or substation buses that supply the spot network. Cycling usually does not result in protector failure, but the large number of protector operations increases maintenance costs for network protectors. In spot networks, cycling frequently is due to a small difference in the load level where a protector trips, and the network load level at which it auto-closes. If in the daily load cycle the network load frequently goes above the load for reclose and below the load needed to keep both protectors closed, the result is protector cycling.
Portion of Relay Close Curve Controlling Protector Closure
In a spot network with an open protector, as the load on the spot network increases, it reaches a level where the phasing voltage will intercept the network relay close curve, and the network protector closes automatically. The portion of the close curve that is intercepted depends upon system conditions and load power factor. This will be discussed assuming that the relay has the circular close characteristics. Figure 74 shows a two-unit spot network where protector 1 is closed, and protector 2 is open. As load builds up on the spot network, as represented by load current of magnitude IL at angle θL, in the figure, the phasing voltage at open protector 2, VP2, will intercept the relay close curve, the portion intercepted depending on system conditions.

Figure 74:
Factors influencing the phasing voltage at an open
network protector in spot network.
The factors affecting where the phasing voltage intercepts the close curve are identified in Figure 74. They include the magnitude and angle of the voltage applied to transformer 2 HV terminals relative to that at the HV terminals of transformer 1, the impedance and impedance angle of the network transformers, and the power factor of the network load current, quantified by angle θL, where this angle is negative in sign for lagging power factor loads.
When the difference in the magnitude of the voltages applied to the HV side of the network transformers is not large, as reflected by the value of “K” in Figure 74, and the angular difference isn’t that large, as reflected by ∆θ, frequently as the load builds up on the spot network, the phasing voltage intercepts the circle portion of the close curve as shown in Figure 75. With the voltages at the HV side of the network transformers fixed, as the load on the spot network increases, the locus of the phasing voltage vector, VP, is a straight line as shown by the purple-colored center line in Figure 75.
With reference to Figure 74, if the voltage at the HV side of the transformer with the open protector, transformer 2, is leading that at the HV side of transformer 1 with the closed protector, as the load increases on the spot network, the locus of the phasing voltage is as shown in Figure 76, and it is the left-hand master line, LHML, that controls the closure of the network protector.

Figure 75:
Phasing voltage intercepting the circle portion of the
close curve with increasing load.
The LHML in Figure 76 is shown set at 90 degrees, although it could be set at a smaller value. In some microprocessor relays, it can be set as high as 95 degrees as discussed earlier. When the load on the spot network is unity power factor or leading power factor, frequently it is the LHML that controls closure of the protector as the load on the spot network increases.

Figure 76:
Phasing voltage intercepting the circle portion of the
close curve with increasing load.
If, at the open protector the voltage at the HV side of the transformer is lagging that at the HV side of the transformer whose protector is closed, and it is somewhat higher in magnitude, the locus of the phasing voltage as spot network load increases is such that the phasing voltage intercepts the phasing line, PL, as shown in Figure 77. This condition can be created if the feeders to the spot network come from different substations, or from a substation with open bus-tie breakers.

Figure 77:
Phasing voltage intercepting the phasing line (PL)
portion of the close curve with increasing load.
When the same voltage is applied to the HV side of both network transformers in the spot network, where in Figure 74, K = 1.0 and ∆θ is 0.0o, the locus of the phasing voltage as the load builds up on the network is that shown in Figure 78, where the locus of the phasing voltage passes thru the origin.

Figure 78:
Phasing voltage locus when the same voltage is applied
to the HV side of both network transformers in the spot network..
And as shown on Figure 78, the angle of the phasing voltage is the sum of the impedance angle of the network transformer, θZ, plus the load current angle, θL, which is negative in sign for lagging power factor loads, zero for unity power factor loads, and positive for leading power factor loads. From this it can be seen that for leading power factor loads, and with the network transformer impedance angle being 85o, as the load on the network increases, it may not intercept the LHML when set at 90 degrees, because θP could be greater than 95 degrees.
Similarly, when the network relay has the straight-line close characteristics, the closure of the protector occurs when the load on the network increases to the point where the phasing voltage intercepts the close curve. The phasing voltage will either intercept the master line (ML) as shown in Figure 79, or the phasing line (PL) as shown in Figure 80.

Figure 79:
Phasing voltage intercepting the master line (ML)
portion of the close curve with increasing network load.

Figure 80:
Phasing voltage intercepting the phasing line (PL)
portion of the close curve with increasing network load.
System Conditions Producing Pumping and Relay Settings to Prevent
With the background from the previous subsection, system conditions in spot networks which result in network protector pumping, and further relay settings that can be made to prevent the protector pumping can be identified. Figure 81 shows a two-unit spot network where the protector on transformer T1 is closed, and the protector on transformer T2 is open. Basically, pumping is more likely when the feeders to the spot network come from substations with open bus-tie breakers. When the voltage at the HV side of the transformer with the open protector, transformer T2 in Figure 81, is higher in magnitude than that on transformer T1, (ІV2І > ІV1І) and leading as shown in Figure 80, conditions for pumping can be created.

Figure 81:
Two-unit spot network for defining conditions where
protector pumping is likely to occur.
Figure 82 shows the circle close characteristic of the network relay and the gull-wing sensitive trip characteristic with the green-colored curve for a protector in a spot network. The close settings are typical defaults, being a slope of -5o for the phasing line, PL, and the left-hand master line, LHML, set at 90o, the recommended setting. Shown below the close characteristic is the gull-wing sensitive trip characteristic, where the reference phasor for both is the network line-to-ground voltage, shown as VN in blue.
With the voltage at the HV side of network transformer 2 with the open protector being higher in magnitude than that at the HV side of transformer 1, and lagging that at the HV side of transformer 1, the locus of the phasing voltage VP as the network load increases is shown by the purple-colored center line in Figure 82. From this it is seen that protector closure is controlled by the phasing line, PL, having a typical default setting of -5o. When the phasing voltage intercepts the PL, its magnitude is greater than the zero-degree close setting, V0, shown in red, and the protector closes.
After the protector closes, the current in the protector, IA in Figure 81, lags the phasing voltage VP by the system impedance angle, θZ, which is taken at 85 degrees, representative of network transformers with 7% impedance and a high X to R ratio. Thus, following closure the current in the protector, labeled IA, in both Figures 81 and 82, lags the network line to ground voltage by 90 degrees as shown in Figure 82. With the gull-wing trip characteristic as shown by the light-green curve, current IA is in the trip region and the protector immediately opens. But as soon as it opens, the phasing voltage, VP, intercepts the PL and the protector closes. This establishes a classical pumping cycle. Note that this pumping cycle would also occur if the relay sensitive trip characteristic was a straight line with a trip-tilt angle of 95 degrees (θM = +5o).
An effective means to prevent the pumping is to increase the slope setting of the phasing line from – 5o to +5o, as shown in Figure 83. When this is done, when the protector closes, the phasing voltage VP is at +5o, and following closure the current lags the phasing voltage by the impedance angle, θZ, still 85o, but the current IA lags the network voltage by +5o minus 85o, or IA lags VN by 80 degrees. From Figure 83, it is seen that with current IA lagging the network voltage VN by 80 degrees, the current is not in the trip region, and the protector will not pump under these conditions. However, cycling could occur.

Figure 82:
Superposition of close curve and gull-wing sensitive
trip curve with locus of phasing voltage. Impedance angle is
85o, PL at -5o.

Figure 83:
Superposition of close curve and gull-wing sensitive
trip curve with locus of phasing voltage. Impedance angle is
85o, PL at +5o.
Sometimes, raising the zero-degree close setting, V0, or the radius of the close circle, will also prevent protector pumping when the phasing line, PL is set at -5o., a typical default setting. This is shown in Figure 84, where the PL is at -5o, but two close settings are shown, V0 and V0’, where the latter is higher.

Figure 84:
Superposition of close curve and sensitive gull-wing
trip curve with locus of phasing voltage. Impedance angle is
85o, PL at -5o. Two V0 settings with
V0’ > V0.
From Figure 84, as the load increases on the network, when the phasing voltage intercepts the phasing line set at -5o, the magnitude of VP is greater than V0, shown in red, and the protector would close and pump for the zero-degree close setting V0. But if the zero-degree close setting were V0’, as shown with the brown-colored curve in Figure 84, when VP intercepts the V0 close circle shown with the dashed red circle, its magnitude is less then V0’, and the loading on the network must increase further until the magnitude of VP equals V0’. From Figure 84, when this happens, VP is sufficiently leading so that when the protector closes, current IA, which lags the phasing voltage at closure by the system impedance angle, θZ, does not lie in the trip region.
From this exercise, it is seen there are two relay setting changes that can be made to prevent pumping. First, increase the slope setting of the phasing line, typically set at -5o to +5o. Second, increase the V0 close setting, or do both.
There is one other step that can be taken to further reduce the chance of pumping when the phasing line is set at the typical default of -5o as shown in Figure 82. In microprocessor relays where the right-hand side of the sensitive trip curve is adjustable, set it at -90o as shown in Figure 85. In relays where the trip-tilt angle is adjustable, this would be achieved by setting the trip-tilt angle to 90 degrees. Although this is helpful for a pumping standpoint, it may not allow the protector to trip under highly capacitive backfeeds when the feeder breaker at the substation is opened in absence of a fault.

Figure 85:
Superposition of close curve and sensitive semi
gull-wing trip curve with locus of phasing voltage. Impedance angle
θZ is 85o, PL at +5o.
Factors Affecting Network Load for Tripping and Auto Closing
The discussions in this section will identify factors affecting load levels for tripping and auto-closing of protectors in two-unit spot networks, as shown in Figure 86, but the same factors apply to spot networks with more than two units. Factors that affect both the network load at which a protector trips, and the load at which it auto-closes are:
-
Primary feeder sources, either the same or different electrical buses in the substation.
-
Primary feeder impedance per unit length, and feeder length. Impedance per unit length for cable circuits is much lower than that for open-wire lines.
-
Loading on the primary feeder and the distribution of the load along the primary feeder.
-
Impedance of the network transformers, being either 4%, 5%, or 7%.
-
Network load power factor.
Factors that affect only the tripping of the protector are:
-
Trip characteristics of the network relay.
-
Sensitive reverse current trip setting of the network relay.
Factors affecting only the automatic reclosing of the network protector are:
-
Network relay close characteristics, either circle or straight-line, and the slope of the straight-line close characteristic.
-
Network relay zero-degree closes setting, V0.
-
Angle of the phasing relay close curve with electromechanical relays, or the angle of the phasing line, PL, with the microprocessor relays.
-
Offset of the phasing relay close curve from the origin.
Figure 86 shows at the bottom conceptually a typical range for the network load where a protector will trip in the two-unit spot network, and the range for the network load where the protector would auto close, for a network load with a power factor of 85%. The load on the ordinate in the figure is in per unit of the rating of one network transformer.

Figure 86:
Load ranges for tripping and auto-closing in a two-unit
spot network, load power factor of 85%.
In systems where the primary feeders come from the same electrical bus, and are of similar length, impedance, and loading, once both protectors are closed, they will stay closed for very light loads on the spot network. Both protectors may stay closed for network loads that are as low as 1 to 2% of the kVA rating of one network transformer under these conditions. This will be quantified through examples later in this chapter.
As shown conceptually in Figure 86, after a protector opens, there is a range for the load on the in-service network transformer needed to cause automatic reclosing of the open protector, #2, assuming 5% impedance network transformers, the straight-line close characteristic, and a V0 setting of 1.5 volts. When the same voltage is applied to the HV side of both transformers, the curves in Figure 70, 71, and `72 show how much load is needed for auto closing. The loading range for auto close shown in Figure 86 is higher than that suggested by the curves in Figures 70 to 72. This is to account for the lower-voltage magnitude and more lagging voltage which typically would exist at the primary terminals of the network transformer whose protector is open.
However, recognize that if the voltages applied to the HV terminals of both transformers were identical, the load for auto close of the open protector would be that shown in Figures 70 to 72, and that shown in Figure 73 with network transformers having an impedance of 2.3%. Furthermore, with the same voltage applied to the HV side of both network transformers, the basis for the curves in these figures, with both protectors closed, the network load could drop to virtually zero, and both protectors would stay closed, assuming the network load power factor was not less than 8.7%.
For the load range shown in Figure 86, if the minimum load on the network were always greater than 10% of the rating of one network transformer, once both protectors are closed, they would stay closed during the daily load cycle. The network load to keep both protectors closed can vary considerably, but as shown later with examples, the biggest factor is the difference in angle of the voltages applied to the HV side of the network transformers. However, even with the same voltage applied to the HV side of both transformers, a protector will open if the associated HV feeder breaker is open, either without or with a fault on the primary feeder. Whether the protector will auto-close upon re-energization of the primary feeder depends upon the peak loading on the spot network. As implied by the range in Figure 86, if the load on the in-service transformer is light, and less than 35%, the network protector would not close automatically. But as discussed earlier in this chapter, frequently the protector can be manually closed, and it will remain closed, or if the network relay has the protective remote close feature as shown in Figure 52, closure can be initiated remotely without having an operator entering the vault. Operating experience confirms the principles shown by Figure 86.
Figure 86 shows a band between the load where the protector trips, and the load where it auto closes, being labeled “Stability Margin”. If this band becomes narrow, as possible when there is angle difference between the voltages applied to the HV terminals of the network transformers in the spot network, load swings or cycles could cause a large number of protector operations. And, of course, if the load for auto closing is lower than that where the protector trips, the protector pumps.
Figure 87 shows the same concept as Figure 86, except that the network load power factor is 98%. Practically, the higher power factor has minimal effect on the load level where one protector trips. However, as illustrated in Figure 70 to 73, the load needed for auto closing with the straight-line close characteristic can approach or exceed the rating of one network transformer at high power factor loads. However, by switching to the circular close characteristic, the network relay close characteristic is satisfied at much lower loadings, and is independent of the load power factor, as shown in Figures 70 to 73 when the same voltage is applied to the HV side of all network transformers in the spot network.
Although the concepts illustrated in Figure 86 and 87 are for a two-unit spot network, they apply for the load needed for auto-close in spot networks with more than two units, if it is recognized that the loading is that required in each network transformer whose protector is closed. However, in spot networks with more than two transformers, generally the network load needed to keep all protectors closed, in per unit of the kVA rating of one transformer, increases as the number of units (transformers) in the spot increases

Figure 87:
Load range for tripping and auto-closing in a two-unit
spot networks, load power factors of 98%.
If network protectors in a spot network remain closed following manual closing, or remote closing with a protective remote close signal, throughout the daily load cycle, yet one or more will not auto-close following opening, network relay close settings can be made that may allow auto-closure. For example, if in Figure 88, the peak load on the network is 35% of the kVA rating of one network transformer, an open network protector would not auto close. Lowering the V0 overvoltage close setting, with either the straight-line or circle close characteristic may allow auto closing of the open protector in the daily load cycle. This assumes that as the load increases on the network, the phasing relay characteristic is satisfied before the master relay (function), so it is the setting of the latter (V0) that controls auto closure. Lowering of the V0 setting will not result in an increase in protector operations, or cause pumping or cycling if the minimum load on the network is above the level where one protector trips. However, lowering the V0 setting can result in auto closing of the protector at some point in the daily load cycle. These concepts will be quantified in the next subsection through examples.
Conversely, if network protectors in a spot network are cycling excessively, it usually is due to:
-
The minimum load on the network being below the level needed to keep both protectors closed.
-
The stability margin between the load at trip and the network load for auto-reclosing being very narrow.
-
Large variations in the network load due to starting and stopping of large motors, or perhaps from variations of distributed generation connected to the spot network, such that the load varies from below the level were a protector trips, to the load where a protector auto-closes. Some conditions causing this are quantified in Section 10.11.

Figure 88:
Effect of changing zero-degree close setting V0 on
network load required for auto closing.
Sometimes it is suggested that the sensitive reverse current trip setting be increased when protectors are cycling excessively. In dedicated feeder networks where it is desired that all protectors open when the primary feeder breaker is opened in absence of a fault, raising of the sensitive trip is not recommended.
Then, possible measures to reduce the number of operations, or prevent pumping are:
-
Raise the V0 setting of the straight-line or the circle close characteristic, as shown by Figure 84 with the circle close.
-
Increase the angle setting of the phasing line (PL) as shown in Figure 83.
-
If the “boomerang” watt-var trip characteristic is used in the MPCV relay, as shown in Figure 21, change to the “gull-wing” sensitive trip characteristic as shown in Figure 23.
Measure 3 above solved a major cycling problem in a lightly-loaded four-unit spot networks at a major international airport in the USA. The 4 kV primary feeders to the network came from the same substation, with each bus section supplying the primary feeders tied to a common bus through phase reactors. As a result, there was phase angle and voltage magnitude differences between the source buses for the primary feeders. The dry-type network transformers for the spot networks were connected delta wye-grounded, with fuses on the HV side of the network transformers in metal-enclosed load break switches. The “boomerang” watt-var trip characteristics was selected by the system designers to ensure that the MPCV network relay would detect the single line-to-ground (SLG) fault between the fuses on the HV side and the HV terminals of the network transformer.
After two years of operation of the lightly loaded spot networks, some network protectors had as many as 3800 operations, an unacceptably high number for network protectors with a fault close rating having a mechanical life of 10,000 operations. Raising the V0 close setting and increasing the angle setting of the phasing line, PL, in the microprocessor relays were not effective in reducing the cycling of the network protectors. In the spot network where the most operations were occurring, there were four 1500 kVA network transformers, with the peak load on the spot network being 421 kVA at 99% power factor. At times, only one of the four protectors was closed, where it was desired that at least two protectors be closed at all times to prevent a momentary outage if the primary feeder with the closed protector were taken out of service or had a fault.
At this installation, the protector cycling was controlled to an acceptable level by changing from the “boomerang” watt-var trip characteristic to the gull-wing sensitive trip characteristic. This change was made only after detailed simulation of faults with blown fuses in the primary system, with the fault between the HV fuses and network transformers, showed that the SLG fault with blown fuse in the faulted phase would be reliably detected with the sequence-based relay having the gull-wing sensitive trip characteristic, with two, three, or four units in service. Reference the discussion in Appendix 3. These same studies showed that these faults would not be reliably detected with a straight-line watt trip characteristic with a trip-tilt angle of 95o, which corresponds to angle θM of 5o, see Figure 22 (a) and the discussion in Trip Algorithms for Microprocessor Relays.
Effect of Source Voltage Phase Angle Difference on Spot Network Operation
The effect of source voltage magnitude and angle on the operation of spot networks will be quantified in this section with the system of Figure 89. Seen from this will be the effect of changing relay close settings and characteristics on the load needed for auto close, and conditions that result in cycling or pumping. It also will show what in the previous section was defined as the stability margin, or the band between the load where a protector trips, and the load where it auto closes.
In Figure 89, network unit 1 is supplied from substation bus 1, whose voltage magnitude is fixed at 1.0 per unit at an angle of 0o. The magnitude and angle of substation bus 2 voltage are varied, to show the effect on the load where a protector trips, and the load where it auto-closes. Each network transformer is rated 1000 kVA, 5.25% impedance with an X to R ratio of 8.25 (impedance angle of 83.1o), and with the network load power factor of 85%. Secondary rated voltage is 480-volts.

Figure 89:
System for showing effect of varying source voltage
angle and magnitude on spot network operation.
The network relays in the protectors have the straight-line close characteristic, with θM (see Figure 50) being 5o. with the zero-degree close setting, V0, being either 1.0 or 1.5 volts on a 125-volt basis. The slope for the phasing line for the relay is -5o, the default setting of many users, unless indicated otherwise. The protector CTs are 1600 to 5, with the network relay having a 180o sensitive reverse current trip setting (see Figure 22-a) of 0.2% of CT rating, with the slope of the straight-line trip curve relative to a line perpendicular to the network line-to-ground voltage, VN, being 5o.
The quantities varied to show the effect of network load at tripping, and network load at auto-closing are:
-
Source 2 voltage angle
-
Source 2 voltage magnitude
-
Overvoltage close setting, V0, of the network relay
-
Slope of the phasing relay (function) close line
Figure 90, giving loads at trip and auto reclosing, applies when both sources have the same voltage magnitude, but source 2 angle is lagging source 1 by as much as 1.0o. The blue colored curve, nearly linear and intercepting the origin, shows the network load at which the protector supplied from source 2 trips versus bus 2 lag angle. Practically, it is linear with source (bus) 2 voltage lag angle. The red- and green-colored curves show the load needed on the spot network (load on the in-service transformer 1) for auto-reclose of the open protector versus source (bus) 2 angle, for relay V0 settings of 1.0 volt and 1.5 volt (red-colored curve and green-colored curve respectively). These relay V0 settings correspond to 2.2 volts and 3.3 volts on the 480-volt side.
For the curves showing the load for auto closing of the protector, indicated is the portion of the close characteristic that controls the closure, either the straight-line master curve (ML) or the phasing curve (PL). The distance between the curve for protector closing and the curve for protector tripping is the stability margin shown conceptually in Figure 88.

Figure 90:
Loads for trip and auto close with equal source voltage
magnitudes, straight-line close characteristics.
For a relay V0 setting of 1.0 volt (2.2 volts at 277-volts), closure of the protector occurs when the phasing voltage VP intercepts the relay master line (ML) when the lag angle of substation bus 2 is less than about 0.63o. That is, as the load on the network increases, the phasing voltage VP satisfies the phasing line requirements before the phasing voltage intercepts the master line. See Figure 79. So, closure is controlled by the master line, or with electromechanical relays by the master relay.
For source 2 lag angles greater than about 0.63o, as the load builds up on the network, the phasing voltage intercepts the phasing line (PL in Figure 80), with the phasing voltage magnitude, VP, at time of intercept greater than the requirements to satisfy the master line. That is, it is the phasing line that controls reclosure.
Similarly, when the V0 setting is 3.3 volts protector (1.5 volts relay), the master line (green colored curve) controls reclosure for lag angles less than about 0.92o. For lag angles (Bus 2 angle) above this, closure is controlled by the phasing line of the relay. From the curves in Figure 90, it is seen there are lag angles for source 2 voltage and ranges of loadings that could lead to either cycling or pumping.
From Figure 90, for a source 2 lag angle of 0.70 degrees and a V0 setting of 2.2 volts, pumping will occur. But for the same lag angle and a V0 setting of 3.3 volts, pumping is prevented. Figure 84 showed why the higher V0 setting may prevent pumping.
Figure 90 also shows that with a V0 setting of 2.2 volts and source 2 lag angle less than 0.25o, both network protectors stay closed for network loads down to about 10% of the kVA rating of one network transformer, or 100 kVA. Further, if one protector were open, it would auto-close for loads between about 22% and 33%, respectively for V0 settings of 2.2 and 3.3 volts at 480-volts. With closed substation bus-tie breakers, and the spot network located electrically close to the substation, such that voltage drops on the primary feeders to the network transformers were small, the angle of the voltages applied to the transformers should not differ by more than 0.25o. Reference the curves in Figure 23 of Chapter 2.
Figure 91 shows the same information as in Figure 90, except that source 2 voltage magnitude is 0.50% lower than that of source 1. This corresponds to only 0.60 volts on a 120-volt base

Figure 91:
Loads for trip and auto close with source 2 voltage
magnitude being 0.5% below source 1 (0.60 volts on a 120-volt base),
straight-line close and trip characteristics..
If the feeders to the network come from the same substation,
the feeder with the lagging angle usually will be lower in magnitude. Or if the feeders come from different bus sections supplied from different substation transformers, one position of a load tap changer for a bus voltage regulator corresponds to 5/8%, or 0.75 volts on a 120-volt base.
From Figure 91, the network load level where protector 2 trips is almost identical to that in Figure 90, where the same voltage is applied to the HV side of the network transformers. This is because voltage magnitude difference circulates primarily vars, and the relay trip is more sensitive to watt flow. However, significantly greater load is needed on the network to cause auto closure of protector 2 when source 2 voltage is 0.50% lower in magnitude than source 1. Also, larger phase-angle differences are allowed before one of the protectors would pump. Both Figures 90 and 91 show that the bandwidth or stability margin between the network load for trip and auto-closing is affected by the lag angle of source 2 voltage, and the overvoltage close setting, V0, of the network relay.
Figure 92 shows the same information as in Figure 90, except that source (bus) 2 voltage magnitude is 0.50% higher than source 1 voltage magnitude. If the primary feeders to the network come from different substation bus sections with open bus-tie breakers, the bus with the lagging voltage can be higher in voltage magnitude due to different load tap changer positions, or different loadings on the substation transformers that supply the two buses. From this figure, notice that pumping can occur for source (bus) 2 lag angles greater than about 0.30o when V0 is set at 2.2 volts, and for lag angles greater than about 0.55o for a V0 setting of 3.3 volts. Selecting the higher V0 setting may not prevent a pumping condition.

Figure 92:
Loads for trip and auto close with source 2 voltage
magnitude being 0.5% above source 1 (0.60 volts on a 120-volt base).
Because pumping is possible in Figure 92, when the conditions are such that the protector closing is controlled by the phasing relay or phasing line (PL as shown in Figure 82), requiring a more leading phasing voltage angle before auto closure will prevent the pumping, as shown conceptually in Figure 83. Figure 93 plots the same information as Figure 92, except that the relay phasing line was set at +5o. When this is done, the protector will not pump. However, as shown in Figure 93, for source 2 lag phase angles that are large, the margin between the load at trip and the load for auto-close is quite small, possibly resulting in protector cycling, depending on the minimum load levels and the V0 setting for the straight-line master line.

Figure 93:
Loads for trip and auto close with source 2 voltage
magnitude being 0.5% above source 1 (0.60 volts on a 120-volt base) and
PL setting of +0.5o.
If instead the network relay has the circle close characteristic, and the magnitude of the voltage applied to the HV terminals of both network transformers is the same, Figure 94 plots the loads for trip and auto close. This should be compared with the plots in Figure 90, where everything is the same except the straight-line close characteristic applies for Figure 90. At the smaller lag angles, the open protector, whether V0 is 2.2 volts or 3.3 volts, will close at lower network loads than with the straight-line close characteristic. With the larger lag angles for source 2 voltage, pumping will occur, but just as with the straight-line close characteristic, setting the phasing line to +5o will prevent the pumping.

Figure 94:
. Loads for trip and auto close with equal source
voltage magnitudes, circle close characteristic.
From Figure 94, notice that for lag angles between about 0.60o and 0.90o, if V0 is set at 2.2 volts, pumping occurs, but when V0 is set at 3.3 volts, pumping is prevented in this angle range. See Figure 84 for the reason for this. But if bus 2 lag angle is greater than about 0.9 degrees, protector pumping will occur even with the higher V0 setting. Increasing the slope of the phasing line from -5 to +5 degrees with the circle close characteristic also will prevent the pumping for the large lag angles, regardless of the V0 setting.
Effect of Network Load Power Factor On Closing In Spot Networks
As mentioned before, when the spot network load has a high-power factor, and the straight-line close characteristic is selected for the network relay, the load required for auto close can be excessive. This is illustrated in Figure 95, for the system of Figure 89, where source 1 and 2 have the same voltage magnitude, but source 2 is lagging by 0.2 degrees.
The blue-colored curve shows the network load at which protector 2, fed from source 2 trips, and the red-colored curve, which is for the straight-line close characteristic, shows the network load at which it auto closes versus network load power factor. Note that for the straight- line close curve, angle θM shown in Figure 69 is +5o, which for relays where adjustable corresponds to a close-tilt angle of 95o.
From the green-colored curve which is for the circle-close characteristic with the same V0 setting, the open protector will close for network loads above about 30%, even when the power factor is 100%.

Figure 95:
Effect of Network Load Power factor on load for auto
closing with straight-line and circle close characteristics.
Voltage Feed Through Open Network Protectors In Spot Networks
When all network protectors in a spot network are opened, voltage may still appear on the network paralleling bus due to impedances connected across the open contacts of the network protector and impedances from the network side to ground. This is depicted in [Figure 96], where the voltages appearing from phase-to-ground on the network bus are labeled VA, VB, and VC.
The value of these voltages depends upon:
-
The voltage of the system, either 208-volts or 480-volts.
-
The type of network protector. The GE type protectors have an impedance across the open contacts of the protector, even when the network relay is removed. This is due to the current transformer, which has an auxiliary winding that allows the CT to provide a voltage signal to the network relay that is proportional to the phasing voltage when the network protector is open. See the test data in Table 2 of this chapter.
-
The type of relays within the network protector. Electromechanical relays and microprocessor relays have different effective impedances connected across the open contacts, and connected from phase-to-ground on the network side. With the electro-mechanical CN-33 relay, the potential coils are connected from phase-to-ground, but in the CHN relay the potential coils are connected from phase-to-phase on the network side of the open protector. With the single-phase phasing relay, type CN-J or CHL, the potential coil is connected from phase-to-ground.

Figure 96:
Impedance network at an open network protector.
With a CM-22 network protector in a 480-volt system, the voltages on the network side can be estimated using the nominal impedances of the relay phasing coils and potential coils, and assuming there is no coupling between phase of the CN-33 master relay. Figure 97 shows the impedances of the CN-33 relay potential coil and phasing coil in nominal ohms. In series with the phasing coil is a 1200-ohm resistor. The relay autotransformers are rated 277 volts to 125 volts.

Figure 97:
Impedances on phases B and C at the open CM-22 network
protector with electromechanical relays.
Figure 98 shows the impedances for phase A, where on the network side to ground are the impedances of the CN-33 potential coil and the CN-J potential coil. Across the open contacts is the impedance of the CN-J phasing coil in parallel with the series combination of the CN-33 phasing coil and the 1200-ohm external resistor.

Figure 98:
Impedances on phases A at the open CN-22 network
protector with electromechanical network relays.
With reference to Figures 97 and 98, of interest is the magnitude of the voltage from the network side to ground. Also desired is the current that would flow if the network side were shorted to ground, shown as ISC in both figures.
From the impedances in Figure 97 and 98, it is possible to calculate the open-circuit voltage on each phase, and the short circuit current, neglecting the exciting impedance of the relay autotransformer on the network side of the protector, where the exciting impedance is in parallel with that of the relay potential coils. Doing this gives the results shown in the third column of Table 3. The data in the first two rows of Table 3 are for phase B and phase C, which have only the impedances of the CN-33 master relay. The last two rows of data are for protector phase A which has both the master and phasing relay connected to it.
Listed in the last column of Table 3 are values measured by an engineer at a utility in a 480-volt CM-22 network protector. Notice that the measured network-side voltages are lower than the calculated values, with the reason for this being that the exciting impedance of the relay autotransformer on the network side is in parallel with the impedance of the relay potential coils, which is not accounted for in the calculations. But notice that when the network side is shorted to ground, the calculated and measured currents in the short circuit path, ISC in Figures 97 and 98, are in good agreement. The reason for this is that the impedances to ground on the network side, including the exciting impedances of the auto transformers, do not affect the short circuit current.
Table 3:
Calculated and measured quantities at open CM-22
protector with electromechanical relay.
| Phase | Nwk Side Quantity |
Calculated | Measured |
|---|---|---|---|
| B or C | Open Cir Volts | 57.7 V | 47 V |
| B or C | Short Cir Current | 22.2 mA | 21 mA |
| A | Open Cir Volts | 51.6 V | 47 V |
| A | Short Cir Current | 37.7 mA | 38 mA |
In the subsection titled “dead network closing”, it was indicated that with the electromechanical CN-33 and CN-J relays, if load was not connected to the network side of the protector, the CN-33 relay close contact is made, but the CN-J phasing relay contact is open.
From the equivalent circuit in Figure 97, it can be shown that on phase B and phase C the phasing voltage, the voltage across the open contacts of the protector, lags the corresponding network line-to-ground voltage by 61.28 degrees, so the torque from these two phases is in the direction to make the master relay close contact. From the equivalent circuit in Figure 98, which is for phase A of the protector, the phasing voltage lags the network line-to-ground voltage by 33.6 degrees. The torque for phase A is in the direction to make the CN-33 master relay close contact with no load connected to the network side of the protector. But the phasing relay close contact is open for the lagging phasing voltage. It can be shown from the equivalent circuit that if a resistor of 156 ohms, on a 125-volt base, is connected from phase A to ground on the network side of the protector, the phasing voltage on phase A will lead phase A to ground network voltage by 16.8 degrees, and for this leading phasing voltage the phasing relay close contact is made. Note that 156 ohms on a 125-volt base corresponds to 100 watts. The effect of this was confirmed by tests made by the author in the laboratory.
When the protectors are equipped with microprocessor relays, the voltages to ground on the network side are different, dependent on relay type.
Regardless, when all protectors in a spot network are open, workers in 480-volt spot networks have experienced shock when making contact with the paralleling bus. If work is to be performed on the paralleling bus, or if the customer wants to work on one or more services supplied from the paralleling bus, the voltage must be totally eliminated.
Possible measures for removing this voltage from the bus are listed below. Before any measures are adopted, they should be carefully evaluated in light of operator safety and operating practices. At least two know fatalities have occurred to utility personnel when attempting to remove the voltage from the paralleling bus in 480-volt spot networks.
-
Open all network protectors, and remove the network protector fuses. This is applicable with fuses installed inside the network protector, or if mounted outside of the network protector. This may involve unbolting fuses from energized 480-volt buses, with the possibility of an arc flash, and is not a preferred procedure.
-
Open all network protectors, and remove the disconnect links on the transformer side of the open protector. This involves unbolting the disconnect links from energized buses, with the possibility of an arc flash, and is not a preferred procedure, especially in 480-volt systems.
-
With draw-out type network protectors, open the protector, and withdraw the protector onto the maintenance rails. With some protectors this can be done with a remote operator.
-
Open all network protectors, and ground all three phases of the paralleling bus. As shown in Table 3, the current flowing in the grounding cables is small. If this procedure is used, which is not a preferred practice, the network protector operating handle must be placed in the open position. If the operating handle were left in the automatic position, when the grounds are applied to the network side of the open protector, the protector would close into the three-phase ground. This could cause a catastrophic failure if the protector does not have a fault close rating. This approach was used by one utility, and with the bare copper ground cables grounded at one end, an attempt was made to connect the other ends to the network-side terminals inside the protector enclosure. In so doing the grounding cables made contact with energized protector buses, a flash occurred, and there was a fatality.
-
Open all network protectors and remove all relays from all protectors in the spot. This is effective in Westinghouse-type protectors which do not have auxiliary windings on the CTs, but is not effective in GE type protectors. See the data in Table 2. Regardless of protector type, this does not provide a visible break, and is not a preferred practice.
-
Open all network protectors, and if so equipped open the HV disconnect switch on the HV side of the network transformer. This requires that the HV disconnect and grounding switch be rated to break transformer magnetizing current. This procedure was used by one operator in a two-unit spot network, and it resulted in an operator fatality.
How this happened will be explained with the aid of Figure 99 and 100. Figure 99 shows the locked when de-energized mag break switch control.

Figure 99:
HV mag break disconnect and grounding switch, locked
when deenergized (courtesy General Electric)
In order to go from the close to open position, the protector must be opened (“b contact closed). Further, with the “b” contact closed voltage must be on the network side of the open protector, so that the solenoid on the right-hand side in Figure 99 is energized, thereby allowing movement of the switch operating handle in the direction indicated by the green arrow (contacts in direction shown by blue arrow).
From Figure 99, note that if the protector is open and the “b” contact closed, but if there is no voltage on the network side of the open protector, the HV switch operating handle can’t be moved from the closed position to the open position as the solenoid will not pickup.
Figure 100 (a) shows the two- unit spot network after NP 1 was opened, and after HV switch S1 on network transformer T1 was opened. With protector NP1 open, there was voltage on the network bus as NP2 was closed, and the operating handle for HV switch S1 could be moved from closed to open. Then, network protector NP2 was manually opened, giving the condition shown in Figure 100 (b). However, with both NP2 and NP1 open, there was still voltage on the network bus as the protectors had the CN-33 and CN-J electromechanical relays. But the voltage on the network side of NP2 was not high enough to pickup the interlock solenoid on the right-hand side in Figure 99 HV switch S2. The operating handle for HV switch S2 was locked in the close position.

Figure 100:
(a) NP 1 and HV S1 open with NP2 and HV S2 closed, (b)
NP 2 open and HV S2 closed.
To allow opening of HV switch S2, an attempt was made to energize the interlock solenoid for switch S2 with a wire, having potential fed from another source. It is not known exactly what happened when the operator was reaching inside the 480-volt CM-22 throat mounted network protector NP2 to energize the wire leading to the switch solenoid, but there was a flash with a resultant fatality. Clearly this was a dangerous procedure that never should be used.
The reason for mentioning these two incidents which resulted in fatalities when trying to remove voltage from the network bus is best summed up by a quote from Sam Levenson, “You must learn from the mistakes of others. You can’t possibly live long enough to make them all yourself.”
-
In some 480-volt spot networks, where enhanced protection systems have been added to detect and isolate arcing faults in the protector and 480-volt system, vacuum breakers or switches are installed at the HV side of the network transformers. Opening of these switches after the network protectors are open will remove all sources of voltage from the network paralleling bus. Reference 480-volt-spot-network which discusses enhanced protection schemes for 480-volt spot networks.
-
Some utilities have installed disconnect switches between the network terminals of the network protector and the paralleling bus. These switches serve two purposes. First, when the switch is opened, after the network protector is opened, it removes voltage from the network terminals of the protector, and allows removing protector fuses with no voltage on the network side buses in the open protector. Second, after the protectors in the spot network are opened, and the disconnect switches are open, it removes all voltage from the services, plus provides a visible break. Figure 101 shows disconnect switches between the network side terminals of the protector and the paralleling bus.

Figure 101:
Disconnect switches between the network terminals of
the network protector and paralleling bus (courtesy of Entergy New
Orleans, Inc.)
Both Eaton and Richards manufacturing can provide disconnect devices for mounting on the network protector terminals or separately, for isolating the network side of the protector, or for isolating the paralleling bus. Before these disconnect devices are opened, the network protector first must be opened to break load current. Figure 102 shows the Eaton VisoBlock® device on the top terminals of the protector. It is equipped with a Kirk Key interlock, so that it can open the circuit only if the network protector operating handle is in the open position.

Figure 102:
Eaton Visoblock disconnect device for separate
mounting or mounting on network protector terminals (courtesy Eaton).
Figure 103 shows an early version of the Richards Manufacturing Outside Link Box, which can be either mounted on the top terminals of the network protector, or can be separately mounted on the vault wall, with cable connections from the protector network terminals to the Outside Link Box.

Figure 103:
Richards Outside Link Box on top terminals of network
protector (courtesy EPRI).
- Some draw-out network protectors, such as the type CM-52, have a viewing window on the side, which allows viewing the internal disconnect contacts when the protector is racked out to the disconnect position. This establishes a visible break between the network transformer/protector and the network paralleling bus for removing all sources of voltage from the paralleling bus. Figure 104 shows the viewing window on the side of a CM-52 network protector.

Figure 104:
Viewing window in side of type CM-52 network protector
(courtesy Eaton).
Some systems are designed with large capacity current limiting fuses in the service. To isolate the service, the service breaker is opened, and then the fuses removed. This requires caution as the bus on the source side of the fuse may be energized, even if all network protectors are open. Figure 105 shows a system where this can be done, showing the location for the three current-limiting fuses. Note the large interphase barriers between the terminals for the CL fuses.

Figure 105:
Position for current-limiting fuses between the
paralleling bus and cables to customers service equipment (photo by
author).
Voltage Feedback Through Open Network Protector
When the primary feeder breaker at the substation is open, and all network protectors on the feeder are open, voltage can also be fed back to the primary feeders through the open network protectors, as mentioned in Introduction and Overview.
The mechanism responsible for this is similar to that discussed in Voltage Feed Through Open Network Protectors in Spot Networks, except that it is occurring in the reverse direction. This must be considered when establishing safety and grounding practices for working on the primary feeders. With the feeder breaker open and no grounds applied to the primary feeder, there can be significant voltage fed back through the open network protector. If it is not grounded, it is not dead. Figure 106 shows a simplified circuit for this situation, where only one network transformer and open protector are included.
At the open network protector, there are impedances across the open contacts of the protector, and there are impedances from each phase-to-ground on the transformer side of the open protector due to protector control circuits and the network relay. These are shown in green in Figure 106. In addition, from each phase-to-ground on the transformer side of the open protector are the magnetizing impedances of the network transformer, shown in black color.
The impedances at the open protector in Figure 106 make up a voltage divider network, which results in small voltages being applied from phase-to-ground at the LV terminals of the network transformer, shown in blue as VAT, VBT, and VCT in the figure. However, these small voltages are stepped up by the transformer turns ratio, or the ratio of the phase-to-phase voltage on the HV side to the phase-to-ground (neutral) voltage on the LV side of the transformer. If work practices or procedures create conditions where grounds are not applied to the primary feeder on the HV side, hazardous voltages appear on the primary side, which could shock an unprotected cable splicer or worker.
To get an estimate of the voltages that might be backfed to the primary feeder with an open network protector, tests were conducted by Consolidated Edison where the backfeeding transformer was rated 500 kVA, 26400 volts delta to 216Y/125 volts. The variables evaluated were the protector type, either Westinghouse or GE, and the type of relay in the protector, either electromechanical, solid state, or microprocessor. The tests were made in the shop, with no primary cable connected to the HV terminals of the network transformer. Digital multi-meters were connected from phase-to-ground at the LV terminals of the network transformer, from the HV terminals, and between the HV terminals of the network transformer.
Figure 107 shows the terminal designation of the network transformer, as well as the primary and secondary voltage phasors under normal conditions. Note that this operator connects primary phase “a” to HV terminal H3, primary phase “b” to HV terminal H2, and primary phase “c” to HV terminal H1. Secondary phases “A”, “B”, and “C” are fed respectively from secondary terminals X3, X2, and X1 as shown in Figure 107. Thus, the secondary phase-to-ground voltages lead the primary system phase-to-ground voltages by 30o, as effectively negative-sequence voltage is applied to the transformer HV terminals H1, H2, and H3.
The results of the measurements on a 500 kVA network transformer are given in Table 4, and their point of measurement is indicated in Figure 106.
From Figure 106, the voltage applied to the network terminals of the open network protector was approximately 125-volts to ground, 216-volts phase-to-phase, but it was reported that the applied voltages varied slightly due to load changes in the supply system in the shop. With reference to Table 4, given in the first column is the type of network protector on the transformer, and listed in the second column is the type of relay in the network protector.
Listed in the third, fourth, and fifth columns of the table are the phase-to-ground voltages at the transformer LV terminals, consistent with the designation in Figure 107. For the Westinghouse type protectors with the solid-state relay and microprocessor relay, these voltages are virtually zero, as shown by the data in rows two and three
But when the Westinghouse type protector had the electromechanical relays, the LV terminal to ground voltages were in the range of about 1.0 volt (first row data).
With the GE type network protectors, as shown in the last three rows of the Table 4, the LV terminal to ground voltages were in the range of 3 to 6 volts, even with the solid state or microprocessor relays in the network protector. This is due to the auxiliary windings on the CTs that supply phasing voltage to the relay when the protector is open.

Figure 106:
Voltage feedback to primary feeder through open
network protector.

Figure 107:
Connections for backfeed voltage tests and terminal
designations for identifying measured voltages.
Given in the remaining columns of the table are the transformer primary phase-to-phase voltages and the transformer primary phase-to-ground voltages. From these it is seen that with the GE type protector, the primary side phase-to-phase voltages can exceed 1000 volts, and the phase-to-ground voltages of the floating delta HV winding are as high as 700 volts. If one of the HV side terminals were grounded, then the phase-to-ground voltages on the other two HV terminals would exceed 1000 volts. So, grounding just one HV phase will not eliminate the voltages.
If primary cable were attached to the HV terminals of the network transformer, that also would affect the magnitude of the voltages being backfed. The best confirmation of the existence of the backfeed voltages is the observation of operating personnel when removing portable grounds from the primary cable at the substation. The author has been told by field personnel that when all network protectors are opened and the portable ground connections are removed, there is a slight arc, with the current limited by the impedance across the open contacts of the network protector.
The validity of the data can be made considering the data in the first row of the table. Secondary A phase to ground voltage is shown in blue as 0.711 volts. This couples to phase a to b voltage on the primary. With the turns ratio being 26,400 to 125, or 211.20, the voltage on the primary is calculated as 211.2*0.711, or 150.2 volts, in good agreement with the measured value of 150.9 volts in the first row of Table 4.
The screen capture in Figure 108 shows the voltages measured with the Eaton VaultGuard system at an open GE protector when the primary feeder breaker at the substation was open. Notice that the transformer side voltages at the open protector in this 480-volt system, were 72, 68, and 69 volts. The network transformer was rated 13,200 volts to 480Y/277 volts. The turns ratio of the transformer is 13200/277, or 47.65. From, this, the highest phase-to-phase voltage on the HV side of the transformer would be 47.65*69, or 3288 volts rms. Determining the phase-to-ground voltages is difficult, as the primary system is an ungrounded system when the feeder breaker at the substation is open.
Table 4:
Measured voltages in shop tests, 500 kVA transformer,
26,400 delta to 216Y/125 volts, No cable connected to HV terminals of
network transformer. Data courtesy of Consolidated Edison Company of New
York.
NWP TYPE |
RELAY TYPE |
TRANSFORMER SECONDARY Ф-TO-GROUND VOLTAGES |
TRANSFORMER PRIMARY Ф-TO-Ф VOLTAGES |
TRANSFORMER PRIMARY Ф-TO-GROUND VOLTAGES |
||||||
|---|---|---|---|---|---|---|---|---|---|---|
A(1) to Grd |
B(2) to Grd |
C(3) to Grd |
Фa to Фb | Фb to Фc | Фc to Фa | Фa to Grd | Фb to Grd | Фc to Grd | ||
| WEST | EM | 0.711 | 1.140 | 0.456 | 150.9 | 242.7 | 97.8 | 28.9 | 125.3 | 117.7 |
| WEST | SS | 0.008 | 0.007 | 0.010 | 1.725 | 1.554 | 2.199 | 1.152 | 0.807 | 1.211 |
| WEST | MICRO | 0.000 | 0.000 | 0.000 | 0.006 | 0.005 | 0.008 | 0.004 | 0.004 | 0.004 |
| GE | EM | 4.730 | 5.190 | 3.995 | 997 | 1092 | 841 | 419 | 651 | 527 |
| GE | SS | 4.520 | 5.520 | 2.836 | 951 | 1241 | 596 | 360 | 660 | 561 |
| GE | MICRO | 4.710 | 5.950 | 3.029 | 996 | 1256 | 638 | 367 | 700 | 609 |
EM ELECTRO MECHANICAL NETWORK RELAY (MASTER AND PHASING)
SS SOLID STATE NETWORK RELAY (TEMPO)
MICRO MICRO PROCESSOR NETWORK RELAY (ETI)

Figure 108:
Network, transformer and phasing voltages at an open
type GE protector as measured with the Eaton VaultGuard system (courtesy
Eaton).
4.11 - Network System Modeling
NETWORK SYSTEM MODELING
One of the first tools for planning and analysis of the secondary network system was the dc network calculator. Resistors were used to model the impedances of the network transformers, secondary mains, and loads, connected together to mimic the system topology. DC network calculators provided results that were superior to those obtained from many manual methods. However, they had limitations in accuracy, because the impedances of the network transformers, secondary cable circuits, and loads were assumed to have the same angle. Cook and Powers 1960 showed that this did not significantly affect the calculated loadings on network transformers, but could cause considerable errors in the calculated voltages in the secondary network.
Prior to the availability of digital computer programs, the ac network calculator, another analog device, was available for the analysis of secondary network systems. These devices could model both the magnitude and angle of the impedances of the network transformer, inter-vault tie circuits, and secondary mains. Loads on the secondary were represented with constant impedances, both resistive and reactive. The ac network calculators were developed primarily for analysis of the transmission and generation systems, and most did not have the capacity to model in detail large secondary network systems. With both the dc and ac network calculators, there usually were not enough elements to represent the individual sections of the primary feeders of the network. As shown before, the impedance of short tap cables from the main primary feeder to a network transformer is insignificant in comparison to the transformer impedance. With the dc and ac calculators, the common practice was to connect the primary side of all network transformers to the same source bus. But this practice could result in inaccuracies for the power flows, especially in systems with low nominal primary feeder voltages (4.16 kV versus 13.2 kV), and long primary feeders.
The first power flow programs for digital computers were developed for the analysis of transmission systems. They ran on mainframe computers with input from punch cards or magnetic tape. Output results for power flows, in primary circuits, network transformers, and secondary circuits, and for bus voltages were printed with line printers in tabular form.
Cook and Powers 1960 describe an early digital computer program designed specifically for power flow analysis of secondary networks. The computational engine performing the calculations was the same as found in programs intended for transmission system analysis, but the input and output formats were tailored for secondary network applications. Line impedances were input in ohms rather than in per unit, and line flows in the output were in kW, kVAr, and amperes, units more beneficial to the network engineer. The programs were a valuable tool for designing secondary network systems, and analyzing them under normal and contingency conditions.
Programs developed for mainframe computers were adapted for use on minicomputers when they became available. As the capabilities of personnel and microcomputers increased, many digital power flow programs and short circuit programs migrated to these machines. Today there are several vendors who have power flow programs designed specifically for the analysis of secondary network systems.
Although the power flow program is the principal tool available for planners, engineers, and operators for analyzing the secondary network system, other computer programs employed for secondary network design and analysis are:
-
Short circuit
-
Harmonic flow
-
Arc flash calculations
-
Cable ampacity
Power Flow Simulations
The power flow program is used by the planning engineer for short- and long-range planning studies to evaluate the system adequacy under normal and contingency conditions. The analysis usually is done for peak load conditions, sometimes considering both summer and winter peak loads, because ratings assigned to some equipment may be different in the two seasons. If transformers and line loadings are within ratings and voltages within allowable limits at peak load, problems usually are not encountered at light load conditions.
The normal practice is to perform the power flow calculations when all primary feeders and their network transformers are in-service. Then power flows are performed by removing from service, one at a time, each primary feeder and its connected network transformers. In doing this it is not sufficient to just open the feeder branch connected to the substation bus. The branch representing each network transformer on the feeder also must be opened. If the system is designed for loss of two primary feeders, the analysis is performed for all possible double contingency outages of the primary feeders, and for each single contingency outage.
The amount of data for line flows and bus voltages resulting from power flow simulations can be massive and overwhelming for large secondary network systems. Fortunately, output summaries are available with most programs where only line and transformer loadings above a user-specified percentage of rating are given, and the only voltages listed are for buses (nodes) where the voltages are outside of a user-specified range.
For the planning engineer, normal and contingency power flows are done at some initial load level, and then at a projected future load level for the end of the planning period. Power flow programs frequently have the capability to apply a multiplier to different classes of base-case-loads. Forecasting where loads will grow in the future, and their growth rate can be challenging for the planning engineer.
There are two aspects to modeling of the secondary network system. The first is the system topology and the impedances for the network transformers, inter-vault tie circuits, secondary mains, and primary feeders. Every effort should be expended to get this part of the model correct and accurate, which is possible if detailed records are kept. The second part which is much more difficult is taking load data and assigning it to a bus or manhole in the model. Sometimes only peak kVA or kW data is available and for certain smaller loads only kWHr data is available. The peak loads of different customers are usually not coincident, and assigning base-case load values to the network model may involve trial and error. Some utilities assign a load class to each load, and for each load class there is a load curve. Techniques are available to determine the individual load to use at time of peak loading on the system.
The power flow program helps the network engineer evaluate the effects of adding new loads to the secondary, and determine the effect of making system reinforcements, (tie circuit additions, network transformer additions, additional sets of secondary mains) required to supply new loads, or alleviate overloads or solve low-voltage problems. When overloads or undervoltages are encountered, the first option is to consider adding additional secondary main circuits or tie circuits, especially if the overload is during a primary feeder contingency. If that is not effective or possible, then changing to a larger size network transformer, say from 500 kVA to 750 kVA if the vault can accommodate the larger transformer, can be helpful. Or addition of a new transformer vault can be considered, but this is the most expensive approach. Operating personnel may employ the power flow program to evaluate operation under a primary feeder outage needed for scheduled work, or during unplanned primary feeder outages.
Short-Circuit Calculations
Three-phase and single line-to-ground (SLG) faults on the primary feeders are simulated to provide currents required to evaluate the operation of phase and ground current relays for the feeder breaker at the substation end. Faults are simulated with the breaker for the faulted feeder closed, and with the faulted feeder breaker open, with all backfeeding network protectors closed. With the breaker for the faulted feeder closed, most practitioners desire that the fault at the most remote point on the primary feeder is detected with instantaneous current relays for the feeder breaker, either phase, ground, or both. As indicated before, the purpose of simulating the fault with the faulted feeder breaker open, and all network protectors closed, is to determine the currents in the unfaulted primary feeders at the substation, to assure that the instantaneous current relays for the unfaulted feeders do not pickup for a fault on another (adjacent) primary feeder. The phase instantaneous current relays for unfaulted feeders must not reach through the network and operate for a fault on another primary feeder. When the network transformers have the delta connected primary windings, the ground relays for unfaulted primary feeders would not be expected to reach through the network for a fault on another primary feeder.
Faults in the secondary system, either the 208Y/120 volt grid or spot networks, are simulated for different reasons. One very important reason is to determine the maximum currents in the primary feeders at the substation (for bolted faults in the secondary) so that settings can be made that do not result in tripping of the primary feeder breaker for faults in the secondary. With the delta wye-grounded connections for the network transformer, only the three-phase fault must be simulated, but with network transformers having the grounded-wye connections for the primary and secondary windings, both the three-phase and SLG fault in the secondary must be simulated.
Faults in the secondary system of 208Y/120-volt grid networks may also be modeled to:
-
Determine if there is sufficient current to burn off solid or welded type faults when cable limiters are not used.
-
Generate short-circuit currents needed for customers to size their service entrance equipment. Frequently, in spot networks, the short circuit current provided to the user for breaker sizing is based on just the impedances of the network transformers, assuming an infinite bus on the HV side of the transformers. This gives the greatest upper bound on short circuit current.
-
Generate data for performing arc flash evaluations.
-
Generate data for evaluating the performance of cable limiters, and for determining the required bracing for buses in high-capacity spot networks, and in multi-bank installations in the grid network.
Primary System Modeling
For both power flow analysis and short-circuit calculations in secondary networks, the system model should include the impedances of all elements (secondary mains, low-voltage cable tie circuits, network transformers, primary cables, etc.) from the manholes that supply the service to which loads are assigned, back to a common point in the system. The location of the common point depends on whether the network is supplied from either one substation, or multiple substations. When supplied from just one substation, the location of the common point depends on whether the system is operated with closed bus-tie breakers on the medium voltage buses that supply the primary feeders, or operated with open bus-tie breakers. When the primary feeders to the network are supplied from multiple substations, the model must include significant portions of the transmission system that supplies the multiple substations for the network primary feeders.
Same Substation with Closed Bus-Tie Circuit Breakers
With this configuration, examples which are given in Network Substation Design, all primary feeders electrically are supplied from the same bus at the substation. Examples of this are seen in Figures 1, 4, 5, 6, 7, 8, 9, 10, and 11 of Network Substation Design. For the power flow studies, this bus is the common point to which the first section of each primary feeder is connected, and the point where the voltage is usually held at a specified level for the power flow calculations. This bus is the “swing bus” for the power flow study. For short-circuit studies, simple Thevenin equivalent circuits can be made for both the positive-and zero-sequence networks looking back into the substations from the common point. All that is required to generate the Thevenin equivalents are the available three-phase fault current, and the available single line-to-ground current for short circuits on the medium voltage bus with all bus tie breakers closed.
The positive-and zero-sequence Thevenin impedances in ohms are found from eqs. (1) and (2) respectively.
(1)
$$ \ \ \ Z_{1Thev} = \frac{E_{LN}}{I_{3\phi} (\cos{\theta_{I3\phi} + j\sin{\theta_{I3\phi}}})} \Omega $$
(2)
$$ \ \ \ Z_{0THEV} = \frac{3E_{LN}}{I_{SLG}(\cos{\theta_{ISLG}} + j\sin{\theta_{ISLG}})} - 2Z_{1THEV} \Omega $$
In these equations, the terms are defined as follows:
ELN = System phase “A” line-to-neutral voltage in volts.
I3ϕ = Current for a three-phase fault on the medium-voltage bus in amperes.
θI3ϕ = Angle of phase “A” three-phase fault current relative to voltage ELN in degrees. This angle usually is “-“ in sign.
ISLG = Current in phase “A” for a single line-to-ground fault on the medium-voltage bus in amperes.
θISLG = Angle of phase “A” current for a SLG fault relative to voltage ELN on phase A, in degrees. This angle usually is “-“ in sign.
Same Substation with Open Bus-Tie Circuit Breakers
When the substation supplying the secondary network operates with open bus-tie breakers on the medium-voltage buses that supply the network primary feeders, with the common point being on the HV side of the substation transformers, as in Figure 2 of Network Substation Design, the substation transformers must be included in the primary system model.
For the power flow simulations, the “swing bus” is on the HV side of the substation transformer, being the point where the voltage is held at a specified level. Each substation transformer must be modeled in detail, including voltage regulating control when the transformer is equipped with load tap changing (LTC). The voltage regulated with each LTC could be that on the medium-voltage bus that supplies the network primary feeders, or the voltage at a downstream regulating point. As discussed earlier, this can result in angular differences in the voltages on the buses that supply the network feeders, due to different loadings and or impedance characteristics of the substation transformers.
For the short-circuit studies, the Thevenin equivalent circuits must include the transmission system, looking into the transmission system from the bus supplying the HV side of the substation transformers. These are also easily obtained from the available three-phase and single line-to-ground currents for faults on the bus at the HV side of the substation transformers. However, when the substation transformers are two winding, with delta connected primary windings, only the positive-sequence Thevenin impedance of the transmission system is required when finding currents for faults on the network primary feeders.
Different Substations
When the secondary network is supplied from different substations, the model for the network source is more complex, and must include the transmission system in some detail. Figure 3 from Network Substation Design, repeated here as Figure 1, shows a system where the network is supplied from three 13.8 kV stations, with 13.8 kV tie lines between the stations. Detailed modeling of the transmission system, substations, and tie lines is needed to accurately give the magnitude and angle of the voltage on the medium-voltage buses supplying the network primary feeders for the power flow studies. This modeling should be accurate, because differences in angles can significantly affect watt and var flows in the network primary feeders, and in network transformers. As discussed in Chapter 10, large angle differences can lead to cycling and pumping in network protectors, especially in spot networks.

Figure 1:
Network system supplied from three different
substations.
For the short-circuit studies, the system supplying the three 13.8 kV buses in Figure 1 to which the network primary feeders terminate, can be represented in the positive-sequence network with a three- bus equivalent, as shown in Figure 2. The equivalent impedance, identified as ZEQ1 through ZEQ6, are found from voltage and current data obtained by placing a three-phase short circuit on each bus that supplies the network primary feeders, with the network primary feeders out of service (no connections to the branches representing the primary feeders). Similarly, a three-bus six branch equivalent circuit can be generated for the zero-sequence network that supplies the three buses for the network primary feeders.

Figure 2:
Equivalent network for system buses that supply the
network primary feeders.
Primary Feeder Topology
In the past, the model of the network system for power flow studies and the model for finding currents for faults in the secondary system frequently ignored the impedances of the primary feeders. The HV windings of all network transformers were connected to a common point. With modern power flow and short-circuit programs, with capacity to handle large numbers of buses and branches, the impedance of primary feeder sections should be included in the models for power flow and short circuit calculations.
Primary feeder impedances frequently are small relative to the impedance of one network transformer, but in general they should be represented. One exception may be the impedance of short tap lines of several hundred feet from the main feeder that supply just one network transformer. Table 1 lists the impedance of network transformers in ohms referred to the HV side, for different nominal primary voltage levels.
Table 1:
Impedances of Network Transformers in Ohms Referred to
the Primary Side
HIGH-VOLTAGE RATING (KVv) |
IMPEDANCE IN OHMS REFERRED TO THE HV SIDE | |||||
|---|---|---|---|---|---|---|
500 KVA 5% Z |
750 KVA 5% Z |
1000 KVA 5% Z |
1500 KVA 7% Z |
2000 KVA 7% Z |
2500 KVA 7% Z |
|
| 4.16 | 1.73 | 1.15 | 0.87 | 0.81 | --- | --- |
| 13.2 | 17.4 | 11.6 | 8.71 | 8.13 | 6.10 | 4.88 |
| 23 | 52.9 | 35.3 | 26.5 | 24.7 | 18.5 | 14.8 |
| 27 | 72.9 | 48.6 | 36.5 | 34.0 | 25.5 | 20.4 |
| 34.5 | 119.0 | 79.4 | 59.5 | 55.5 | 41.7 | 33.3 |
Transformer ohms referred to HV side are proportional to kV2
Table 2:
Positive-Sequence Impedances of 3/C PILC Cables (Ω/mile),
R1 based on 65o C conductor Temperature
3/C SIZE |
5 KV BELTED | 15 KV SHIELDED | 23 KV SHIELDED | 35 KV SHIELDE | ||||||||
|---|---|---|---|---|---|---|---|---|---|---|---|---|
| R1 | X1 | Z1 | R1 | X1 | Z1 | R1 | X1 | Z1 | R1 | X1 | Z1 | |
| 1/0 | 0.622 | 0.165 | 0.644 | 0.622 | 0.201 | 0.654 | 0.622 | 0.222 | 0.660 | 0.622 | 0.239 | 0.666 |
| 350 | 0.190 | 0.133 | 0.232 | 0.190 | 0.153 | 0.244 | 0.190 | 0.167 | 0.253 | 0.190 | 0.187 | 0.267 |
| 500 | 0.134 | 0.129 | 0.186 | 0.134 | 0.1465 | 0.168 | 0.134 | 0.159 | 0.208 | 0.134 | 0.177 | 0.222 |
| 750 | 0.091 | 0.125 | 0.155 | 0.091 | 0.139 | 0.166 | 0.091 | 0.151 | 0.176 | 0.091 | 0.165 | 0.188 |
Table 2 lists the positive-sequence impedances of three-conductor PILC cables in ohms per mile. Cable impedance increases slightly at the higher voltages, but not to the extent that the network transformer impedances in ohms referred to the HV side increases with voltage. From the data in Table 1 and Table 2, the impedance of short lengths of primary cable, several hundred feet or less, are negligible in comparison to the impedance of network transformers, even at the 4.16 kV voltage level. For example, at 13.2 kV the impedance of the 500 kVA network transformer referred to the HV side is 17.4 ohms. The impedance of a 1/0 15 kV tap cable, 300 feet in length, is 0.0371 ohms, insignificant in comparison to the transformer impedance. At 23 kV, the 500 kVA transformer impedance is 52.9 ohms, and that of a 1/0 cable tap, 300 feet in length, is 0.0375 ohms. If the feeders use triplexed single-conductor cables, the impedance per unit length will be slightly higher than in Table 2.
But segments of the main or trunk primary feeder that carry the current of many network transformers can have voltage drops that are not negligible in comparison to the voltage drop in network transformers. The impedances of the main primary feeders should be included in the model for both power flow studies and short-circuit studies.
Primary Feeder Sequence Impedances
There are different approaches for arriving at the impedances of the primary feeders for the power flow and short-circuit studies. Frequently utilities have standard size cables and configurations for primary feeder circuits, and tables with the sequence impedances per unit of length, either in ohms per mile or ohms per 1000 feet. The data for each primary feeder segment is entered into the computer program in terms of segment length and impedances per unit length. Another approach is to enter a code for the particular size cable and its length.
Software is available for finding the positive-and zero-sequence impedances of cable circuits made with either three-conductor cables, or three-single conductor cables. Some power flow programs include default values for sequence impedances for different types and sizes of cable, and the user may select to use these values. However, the user should check to see if the assumptions used to arrive at the default values are consistent with his practices.
Figure 3 shows three types of single-conductor cables found in primary feeders of secondary networks, from which the positive-and zero-sequence impedances can be found with relatively simple equations. The equations are presented below along with the assumptions for which the zero-sequence impedance applies, and an explanation of the parameters required for their use.

Figure 3:
Single conductor cable types for network primary
feeders.
Figure 4 shows single conductor cables used for network primary feeders, having flat-strap neutral on left side, and multiwire concentric neutral on the right-hand side.

Figure 4:
Flat-strap neutral cable and multi-wire concentric
neutral cables used in network systems (photo by author).
The equations presented herein are applicable when the centers of the three-single conductor cables are located at the vertices of an equilateral triangle, a typical configuration when three single-conductor cables are triplexed on the reel before being pulled into a duct. Further, the equations apply when the sheaths, flat-strap neutrals, or multiwire concentric neutrals of the single conductor cables are bonded together in each manhole and connected to earth of a uniform volume resistivity. That is, it is assumed that the return path for the zero-sequence current consists of either the lead sheaths in parallel with the earth, the flat-strap neutrals in parallel with the earth, or the multi-wire concentric neutrals in parallel with the earth.
Note that for a primary circuit in a duct, there may be other primary circuits in the same duct bank, with their sheaths, or flat-strap neutrals bonded in the manholes on opposite ends with the sheaths or neutrals of the circuit of interest. So, for a given circuit in a duct, the return path for zero-sequence current is not only the sheaths or neutrals of the circuit of interest but also the sheaths or neutrals of other circuits in the duct bank. Due to inductive effects, most of the zero-sequence current in a circuit returns in its own sheaths or flat -strap neutrals. In the expressions presented in this chapter for the zero-sequence impedance, it is assumed that the return path for zero-sequence current is the sheaths or neutrals of the circuit being considered and the earth.
Single-Conductor Cable Parameters.
The equations for finding the self-sequence impedances apply to circuits made from the types of cables in Figure 3, being cables with lead sheaths, flat-strap neutrals, or a multiwire concentric neutral. The parameters for the individual cables that are represented with the equation for finding the sequence impedances are;
Phase Conductor
Rϕ = AC resistance (at 60 Hz) of the phase conductor in ohms per 1000 feet. In selecting a value for this parameter, remember it is a function of conductor temperature.
GMRϕ = Geometric mean radius (at 60 Hz) of the phase conductor in inches. Numerical values are found from conductor data tables. As a rough approximation, the GMR is 0.7788 times the conductor radius.
Lead Sheath, Flat Strap Neutral, Multiwire Concentric Neutral
RN = AC resistance (at 60 Hz) of the lead sheath, the flat strap concentric neutral, or the multiwire concentric neutral on each cable, in ohms per 1000 feet. This can be obtained from cable manufacturers. For the flat-strap neutral or multiwire concentric neutral, this is the effective resistance when all flat strap neutrals, or all round-wire neutrals on the cable are paralleled.
GMRN = Geometric mean radius of the lead sheath, flat-strap neutral, or the multiwire concentric neutral. For the different cable types, the GMR is found as follows.
For the lead sheath and flat-strap neutrals:
(3)
$$ \ \ \ GMR_{N} = \frac{r_{i} + r_{0}}{2} inches $$
In eq (3):
ri = Inside radius of the lead sheath or flat-strap neutral, which is the distance from the center of the phase conductor to the inside of the lead sheath or flat-strap neutral in inches, as shown in Figure 3 (b) for the flat-strap neutral cable.
ro = Outside radius of the lead sheath or flat-strap neutral, which is the distance from the center of the phase conductor to the outside of the lead sheath or flat strap in inches.
For the multiwire concentric neutral with round wires:
(4)
$$ \ \ \ GMR_{N} = \sqrt[nw]{0.7788 * r_{n} * nw * r_{cnw}^{(nw-1)}} \text{ inches} $$
In eq (4),
nw = Number of round neutral wires on each cable.
rn = Radius of each neutral wire in inches.
rcnw = Radius of circle formed by the centers of the neutral wires in inches, as shown in Figure 3 (c)
Figures 5 and 6 plot the geometric mean radius of multiwire concentric neutrals versus the radius of the circle formed by the centers of the neutral wires, rcnw, for concentric neutrals with #14 and #12 round wires respectively.

Figure 5:
Geometric mean radius of multiwire concentric neutral
having No 14 copper wires.
From these curves it is seen that when the number of neutral wires, nw, is large, the geometric mean radius of the multiwire concentric neutral is nearly equal to the radius of the circle formed by the centers of the neutral wires, rcnw.
Positive and Zero-Sequence Impedances at 60 HZ for Circuits with Multiwire Concentric Neutral Cable
The only other parameter needed to find he sequence impedances for the cable circuits, with the cable centers located at the vertices of an equilateral triangle (triplexed), is the spacing between the centers of the phase conductors.
d∆ = Spacing between the centers of the phase conductors in inches. If the three single-conductor cables are triplexed, this would be the outside diameter of one cable.

Figure 6:
Geometric mean radius of multiwire concentric neutral
having No 12 copper wires.
For circuits made with multiwire concentric neutral cable, the positive-sequence impedance at 60 Hz is:
(5)
$$ \ \ \ Z_{11} = R_{11} + jX_{11} \enspace \Omega/1000 \text{ft} \ = [R_{phi} + j0.0529\log_{10}{\frac{d_{\Delta}}{GMR_{\phi}}}] + [\frac{(0.0529 \log_{10}{\frac{d_{\Delta}}{r_{cnw}}})^2}{R_{N} + j0.0529 \log_{10}{\frac{d_{\Delta}}{GMR_{N}}}}] \Omega/1000 \text{ ft} $$
From eq (5), when the single-conductor cables do not have a concentric neutral, RN is infinite and the second term in brackets on the right-hand side of eq (5) is zero.
The resistive part of the positive-sequence impedance, R11, from eq (5) is given by eq (6), and the reactive part of the positive-sequence impedance, X11, is given by eq (7)
(6)
$$ \ \ \ R_{11} = R_{\phi} + \frac{R_{N}(0.0529 \log_{10}{\frac{d_{\Delta}}{r_{cnw}}})}{R_{N}^2 + (0.0529 \log_{10}{\frac{d_{\Delta}}{r_{cnw}}})^2} \Omega/1000 \text{ ft}$$
(7)
$$ \ \ \ X_{11} = 0.0529 \log_{10}{\frac{d_{\Delta}}{GMR_{\phi}}} - \frac{(0.0529\log_{10}{\frac{d_{\Delta}}{r_{cnw}}})^3}{ R_{N}^2 + (0.0529\log_{10}{\frac{d_{\Delta}}{r_{cnw}}})^2} \Omega/1000 ft $$
The positive-sequence impedance, Z11, is the impedance presented when the phase currents are perfectly balanced, and is independent of the resistivity of the earth return path for the assumed configuration. For the positive-sequence resistance, R11, as given by eq (6) the first term on the right-hand side is the resistance of the phase conductor, Rϕ, and the second term represent the effect of the concentric neutral. With balanced phase currents, balanced currents are induced into the concentric neutrals on the three single-conductor cables. This results in the positive-sequence resistance R11 being greater than the resistance of the phase conductor, Rϕ. The phase conductors can be thought of as the primary winding of a transformer, and the concentric neutrals as the shorted secondary winding. So, the resistance looking into the primary winding is the resistance of the phase conductor, plus the resistance of the secondary winding, the concentric neutrals, reflected to the primary winding.
For the positive-sequence reactance, X11, as given by eq (7), the first term on the right-hand side is simply the positive-sequence reactance of the three single-conductor cables if the concentric neutrals were not present. The second term represents the effect of the concentric neutrals, where the induced currents in the concentric neutrals reduces the flux linkages between the phase conductors. In the next section the currents induced into the concentric neutral with just positive-sequence phase currents is quantified.
The zero-sequence self-impedance of the circuit at 60 Hz is found with eq (8).
The only term in eq (8) that has not been defined is ρ, which is the volume resistivity of the earth in ohm-meters. In absence of a specific value, 100 ohm-meters frequently is selected. The first term in brackets on the right-hand side of eq (8) gives the zero-sequence impedance of the cable circuit if all of the zero-sequence current were to return in the earth. The second term in brackets accounts for the presence of the multi-wire concentric neutrals on each cable.
The equations for the positive-and zero-sequence impedance of circuits with lead sheath or flat-strap neutral cables are very similar to those for circuits with multi-wire concentric neutral cables, and are given with eq (9) and (10) respectively. The only difference is that the term, rcnw, the radius of the circle formed by the center of the neutral wires, is replaced with the geometric mean radius of the flat-strap neutral or lead sheath, designated GMRN, which is found from eq (3).
The zero-sequence impedance given by eq (10) is for the return path for the zero-sequence current being in the three flat-strap neutrals (or lead sheaths) in parallel with the earth.
(8)
$$ \ \ \ Z_{00} = [R_{\phi} + 0.05421 + j0.1457 \log_{10}{\frac{25920 \sqrt{\frac{\rho}{60}}}{\sqrt[3]{GMR_{\phi}d_{\Delta}^2}}}] \ - [\frac{(0.05421 + j0.1587\log_{10}{\frac{25920\sqrt{\frac{\rho}{60}}}{\sqrt[3]{r_{cnw}d_{\Delta}^2}}})^2}{R_{N} + 0.05421 + j0.1587 \log_{10}{\frac{25920 \sqrt{\frac{\rho}{60}}}{\sqrt[3]{GMR_{N} d_{\Delta}^2}}}}] $$
Positive-and Zero-Sequence Impedances at 60 Hz -Lead Sheath and Flat-Strap Neutral Cables
(9)
$$ \ \ \ Z_{11} = R_{11} + jX_{11} \Omega/1000 \text{ ft} \ = [R_{\phi} + j0.0529 \log_{10}{\frac{d_{\Delta}}{GMR_{\phi}}}] \ + [\frac{(0.0529\log_{10}{\frac{d_{\Delta}}{r_{cnw}}})^2}{R_{N} + j0.0529\log_{10}{\frac{d_{\Delta}}{GMR_{N}}}}] \Omega/1000 \text{ ft} $$
(10)
$$ \ \ \ Z_{00} = [R_{\phi} + 0.05421 + j0.1457\log_{10}{\frac{25920\sqrt{\frac{\rho}{60}}}{\sqrt[3]{GMR_{\phi} d_{\Delta}^2}}}] \ - [\frac{(0.05421 + j0.1587 \log_{10}{\frac{25920\sqrt{\frac{\rho}{60}}}{\sqrt[3]{GMR_{N}d_{\Delta}^2}}})^2}{ R_{N} + 0.05421 + j0.1587\log_{10}{\frac{25920\sqrt{\frac{\rho}{60}}}{\sqrt[3]{GMR_{N}d_{\Delta}^2}}}}] \Omega/1000 \text{ ft}$$
If the only return path for the zero-sequence current were the lead sheaths or the flat-strap neutrals, or the multi-wire concentric neutral, then the zero-sequence impedance is given by eq (11).
(11)
$$ \ \ \ Z_{00} = (R_{\phi} + R_{N}) + j0.0529 \log_{10}{\frac{GMR_{N}}{GMR_{\varphi}}} \Omega/1000 \text{ ft}$$
In actual circuits, the return path for zero-sequence current is difficult to define. As indicated before, the determination of the zero-sequence impedance is further complicated by other return paths that are in parallel with the lead sheaths (flat-strap neutrals) of the circuit of interest. This is due to the common practice of bonding in each manhole the sheaths or flat-strap neutrals of all cable circuits in the manhole, and also bonding to secondary neutral conductors. Equations given above help determine the bounds for the zero-sequence impedance of the primary cable circuits. Computer software is available to model the effects of cable sheaths and other grounded conductors in the duct bank that are not part of the circuit of interest.
Induced Currents in Lead Sheaths and Flat Strap Neutrals
In network primary feeders that are dedicated to the network, and where all network transformers have the delta connected primary windings, load is not connected to the lead sheaths or the flat-strap neutrals of the primary feeders. However, even when the three phase conductors are perfectly balanced, currents are induced into the three flat-strap neutrals or lead sheaths. This is shown in Figure 6-b, where the three phase currents, IA, IB, and IC shown in red are perfectly balanced. The currents induced into the three neutrals are designated IX1, IX2, and IX3 for the neutrals on phase A, B, and C cables respectively. The currents induced into the neutrals are also perfectly balanced as shown.

Figure 6b:
Triplexed single-conductor cables, with perfectly
balanced phase currents, and currents induced into the flat-strap
neutrals.
With the cable centers at the vertices of an equilateral triangle, it can be shown that the ratio of the current in the sheath or flat strap to that in the phase conductor is given by eq (12).
(12)
$$ \ \ \ \frac{I_{SHEATH}}{I_{PHASE}} = \frac{-j0.0529 \log_{10}{\frac{d_{\Delta}}{GMR_{N}}}}{R_{N} + j0.0529 \log_{10}{\frac{d_{\Delta}}{GMR_{N}}}} $$
From eq (12), the angle of the term in the numerator is at -90o, and the angle of the term in the denominator is between 0 and 90o. This means that the sheath current in each phase will lag the current in the phase conductor by more than 90o, as shown by the phasors in Figure 6.
As indicated before, the effect of the sheath or flat-strap neutral induced currents is to make the positive sequence resistance, R11, greater than the phase conductor resistance, Rϕ. And the induced currents in the neutrals make the positive-sequence reactance, X11, less than that if the flat-strap neutrals or lead sheaths were not present.
Figure 7 plots the ratio of the sheath or flat-strap neutral current, ISHEATH, to the phase conductor current, IPHASE, versus the resistance of the neutral conductor on each cable in ohms per 1000 feet. The curves are plotted for two values for the ratio of d∆ to GMRN, which bound the values encountered in most situations when the cables are triplexed.
If the sheath or flat-strap neutral resistance were zero, which corresponds to a superconducting cable, the current induced into the sheath or flat-strap neutral is the same as that in the phase cables. But for the sheath/flat-strap neutral resistances of cables typically used in network primary feeders, the circulating currents in the sheaths/flat-strap neutrals are typically less than 25% of the phase conductor current.

Figure 7:
Induced currents in the sheaths/flat-strap concentric
neutrals with balanced phase currents
Example Calculation for 25 kV 500 kcmil Cable
The use of the equations in the previous section will be demonstrated for a circuit with 25 kV EPR cable having 210 mills of insulation and flat-strap neutral. The cable parameters follow.
ODCABLE = Cable outside diameter = 1.416 Inches
ODFS = Nominal outside diameter over flat strap
= 1.3146 inches
Flat strap thickness = 0.03 inches
Rϕ = 0.0221 Ω/1000 ft @ 25o C
RN = 0.093 Ω/1000 ft @ 25o C
The geometric mean radius for the 500 kcmil phase conductor is:
GMRϕ = 0.2867 inches
From these values, the outside radius, ro, and inside radius, ri, of the flat strap neutral are:
r0 = 1.3146/2 = 0.658 inches
ri = 0.658 – 0.030 = 0.628 inches
The geometric mean radius of the flat strap neutral is the average of the inside radius and the outside radius of the flat-strap neutral.
GMRN = (0.658+0.628)/2 = 0.643 inches.
With the three cables triplexed, the equivalent delta spacing is the outside diameter of the cable, ODCABLE.
d∆ = 1.416 inches
The remaining parameter needed for the calculations is the earth resistivity, ρ, in ohm-meters. The default value will be used.
ρ = 100 Ω-meters
Equation (9) will be used to calculate the positive-sequence impedance, by substituting in the above values.
(13)
$$ \ \ \ Z_{11} = [0.0221 + j0.0529\log_{10}{\frac{1.416}{0.2867}}] + [\frac{(0.0529 \log_{10}{\frac{1.416}{0.643}})^2}{0.093 + j0.0529\log_{10}{\frac{1.416}{0.643}}}] \Omega /1000 \text{ ft} \ = [0.0221 + j0.03669] + [0.00341 - j0.0006645] = 0.02551 + j0.03603 \enspace \Omega /1000 \enspace ft $$
From eq (13), the positive-sequence resistance, 0.02551 Ω/1000 ft is 1.15 times the phase conductor resistance, Rϕ, which is 0.0221 Ω/1000 ft. What this means is the I2R losses under balanced loading are increased by 15% due to the induced currents in the flat-strap neutral. Also note from eq (13) that the effect of the induced currents in the flat-strap neutral is to reduce the positive-sequence reactance without the neutrals, 0.03669 Ω/1000 feet to 0.03603 Ω/1000 feet.
Equation (10) will be used to calculate the zero-sequence impedance when the zero-sequence current return path is the flat-strap neutrals and the earth in parallel with the neutrals. Substituting into eq (10) gives eq (14):
If the zero-sequence return path were confined to just the flat-strap neutrals, the zero-sequence self-impedance is found from eq (11). Substituting values into eq (11) gives:
(15)
$$ \ \ \ Z_{00} = (0.0221 + 0.093) + j0.0529\log_{10}{\frac{0.643}{0.2867}} \Omega/1000 \text{ ft} = 0.1151 + j0.0186 \enspace \Omega/1000 \text{ ft} $$
(14)
$$ \ \ \ Z_{00} [0.0221 + 0.05421 + j0.1457 \log_{10}{\frac{25920 \sqrt{\frac{100}{60}}}{\sqrt[3]{0.2867 \text{ } .416^2}}}] \ - [\frac{( 0.05421 + j0.1587 \log_{10}{\frac{25920 \sqrt{\frac{100}{60}}}{\sqrt[3]{0.6431 \text{ } .416^2}}})}{ 0.093 + 0.05421 + j0.1587 \log_{10}{\frac{25910 \sqrt{\frac{100}{60}}}{\sqrt[3]{0.06431 \text{ } .416^2 }}}}] \ = 0.11269 + j0.03020 \Omega/1000 \text{ ft} $$
From eq (15) and eq (14), it is seen that when all of the zero-sequence current returns in the neutrals, the zero-sequence resistance is higher, but the zero-sequence reactance is lower as the return path for zero-sequence current is closer to the outgoing path for the phase currents.
Remember, in using the equations presented in this subsection for the positive and zero-sequence impedances, it is assumed that the cables are triplexed. Further, the return path for the zero-sequence current neglects the effect of other return paths which may be in the duct bank with the circuit of interest.
Effect of Induced Currents In Flat Strap Neutrals On Total Watts Loss in Cable Circuit
With balanced phase currents, the induced currents in the flat-strap neutrals increases the I2R losses of the circuit. From eq (12), the current in the flat-strap neutral, in terms of the current in the phase conductors, IPHASE, is given by eq (16), which is simply eq (12) rearranged.
(16)
$$ \ \ \ I_{NEUTRAL} = \frac{-J0.0529 \log_{10}{\frac{d_{\Delta}}{GMR_{N}}}}{R_{N} + j0.0529 \log_{10}{\frac{d_{\Delta}}{GMR_{N}}}} I_{PHASE} $$
The power loss in the three flat-strap neutrals, is three times the square of the current in the flat-strap neutral on one cable, times the resistance of the flat strap, RN. With the phase current being IPHASE, the total loss in the three flat-strap concentric neutrals is:
(17)
$$ \ \ \ P_{N-TOTAL} = 3 * I_{NEUTRAL}^2 R_{N} \enspace watts/1000 \text{ ft}$$
Substituting the expression for the current in each flat-strap neutral, INEUTRAL, as given by eq (16) into eq (17) gives:
(18)
$$ \ \ \ P_{N-TOTAL} = 3\frac{[0.0529 \log_{10}{\frac{d_{\Delta}}{GMR_{N}}}]^2}{R_{N}^2 + [0.0529 \log_{10}{\frac{d_{\Delta}}{GMR_{N}}}]} I_{PHASE}^2 R_{N} \enspace watts/1000 \enspace ft $$
From eq (18), it is seen that when the resistance of the flat-strap neutral is zero, or infinite, there are no losses in the three flat-strap neutrals. However, it can be shown from eq (18) that when the resistance of the flat-strap neutral on each cable is that given by eq (19), the watts loss in the three-flat-strap neutrals is maximized.
(19)
$$ \ \ \ R_{N-MAX PWR} = 0.0529 \log_{10}{\frac{d_{\Delta}}{GMR_{N}}} \Omega/1000 \enspace ft $$
Figure 8 plots the total watts loss in the three flat-strap neutrals per foot per 100 amperes of balanced phase conductor current, IPHASE. versus the resistance of the flat strap neutral, RN, in Ω/1000 feet. Two curves are given for ratios of d∆ to GMRN that cover the range when the cables are triplexed, with their centers at the vertices of an equilateral triangle. Plotted with the vertical brown line is the resistance of the flat-strap concentric neutral for the example calculation. From eq (11-18), the total loss per foot per 100 amperes of phase current is, with d∆ = 1.416 inch and GMRN = 0.643 inches is 0.1022 watts per foot per 100 amperes of phase current. In comparison, the watts loss in the three phase conductors at 100 amperes, with each having a resistance of 0.0221Ω/1000 ft is 0.663 watts per foot. So, the loss in the flat strap neutrals is 15.4% of the watt loss in the three phase conductors, which is not negligible.

Figure 8:
Total watts loss in three sheaths of flat-strap neutral
cable per foot per 100 amperes of phase current.
Selecting Flat-Strap Cable Concentric Neutral Size
When specifying cable for network dedicated primary feeders which use flat-strap or multi-wire concentric neutral cable, numerous factors must be considered when selecting the size of the neutral. A few are listed below.
-
Power losses in the concentric neutral with balanced phase currents in systems with delta wye connected network transformers as this affects the ampere rating of the circuit.
-
Short circuit currents for ground faults, and the protection of the concentric neutrals under fault conditions. Protective devices for primary feeder must interrupt fault current flow before the concentric neutrals are damaged.
-
Concentric neutral load currents in network systems that have network transformer with the wye-grounded winding connections for the primary and secondary, as the unbalance load currents (zero-sequence fundamentals and harmonics) return to the substation.
-
Zero-sequence impedance. This determines the ground current for ground faults on the primary feeder.
Network Transformer and Secondary System Modeling
Network Unit
The network unit usually is modeled with just the leakage impedance of the network transformer, neglecting the effects of the transformer exciting impedance. If the exact leakage impedance is known for a transformer, from test data or from the nameplate, the value should be used in the model for both power flow and short-circuit studies. Otherwise, the standard impedances for network transformers, as given in Network Unit Equipment can be selected. If load loss data is available for the network transformer then the impedance can be broken into its resistive and reactive parts as shown below.
(20)
$$ \ \ \ R_{T%} = \frac{P_{CU}}{10KVA_{T}} % $$
(21)
$$ \ \ \ X_{T %} = \sqrt{Z_{T%}^2 - R_{T%}^2} % $$
In the above equations:
KVAT = kVA rating of the network transformer, the 55oC rating for units rated 55oC or 55/65oC, and the 65oC rating for units rated 65o
ZT% = Network transformer nameplate impedance in percent.
PCU = Load losses of the network transformer when the output is its rating, KVAT. Usually the quoted transformer impedance and load losses are based on the average temperature of the windings when delivering rated output KVAT.
The above gives the positive-sequence impedance of the network transformer. The zero-sequence impedance on the wye side depends upon winding connections and the type of core used for the network transformer. In absence of specific data, most practitioners assume that the zero-sequence impedance of the network transformer is the same as the positive-sequence impedance.
If load loss data is not available for the network transformer, then typical values of the X to R ratio can be applied to break the impedance into its resistive and reactive parts. For transformers with 5% impedance, the X to R ratio typically is between 4.8 and 9.0, and for transformers with 7% impedance, the ratio typically is between about 8 and 13. Given the X to R ratio of the transformer, the impedance can be broken into its real and reactive parts as shown with eq (22) and eq (23), where XT/RT is the X to R ratio of the network transformer
(22)
$$ \ \ \ R_{T%} = Z_{T%}\frac{1}{\sqrt{1 + (\frac{X_{T}}{R_{T}})^2}} % $$
(23)
$$ \ \ \ X_{T%} = Z_{T%} \frac{(\frac{X_{T}}{R_{T}})}{\sqrt{1 + (\frac{X_{T}}{R_{T}})^2}} % $$
When the software for performing the power-flow includes a model of the network protector, then network protector current transformer data, as well as the relay close and trip characteristics and settings can be part of the data base. Network Protector Relaying discusses network relay close and trip characteristics and settings, and criteria for determining if the sensitive trip characteristic of sequence- based and power-based relays will be satisfied under either balanced or unbalanced conditions. Some software for modeling the protectors contains algorithms that will automatically open and close protectors during power flow studies, based on network relay response.
Secondary Systems
Secondary Grid Design Considerations contains equations for finding the impedances of low-voltage secondary cable circuits of different configurations, both phase isolated and phase grouped. When finding the impedances of secondary vault/manhole tie circuits and secondary mains, the length used for each circuit between connection points, buses, moles and crabs should be the actual length of the cable between the points, not the length of the duct line. This is possible if during construction, crews record the actual cable length pulled, minus any lengths removed from either end to make the connections. For secondary cable circuits, charging kVAr is negligible.
Vault/Manhole Tie Circuits
When network protectors are separately mounted from the network transformer, depending on the distance between the protector and the transformer, the impedance of the tie circuit may not be negligible in comparison to the network transformer impedance, especially if the tie circuit uses phase isolated configurations. Secondary Grid Design Considerations gives equations for finding the positive-and zero-sequence impedances of both phase-grouped and phase-isolated cable tie circuits. They apply when the neutral path is made from multiple cables. When bus bar is used for the neutral path, software is needed to find the zero-sequence self-impedance.
Similarly, the impedance of the tie circuit from the network protector network terminals to the adjacent vault or manhole may not be negligible in comparison to the impedance of the network transformer. As discussed in Secondary Grid Design Considerations, the impedance of a circuit with phase isolated construction of a given length is much higher than the impedance of a circuit with phase-grouped cables.
Secondary Mains
Secondary mains most always use phase-grouped cables, and their sequence impedances can be found from the equations in Sequence Impedances of Phase-Grouped Cables . Generally, except for very short mains, the impedance of secondary mains should be included in the model for power flow and short circuit studies. As indicated before the positive-sequence impedance of 100 feet of phase grouped 500 kcmil copper cables is about equal to that of a 500 kVA 5% impedance 216Y/125-volt network transformer.
When there are multiple sets of phase-grouped cables between two buses or junction points, an equivalent can be made by paralleling the impedances of all of the sets. However, sometimes it is desirable to exclude from the equivalent one set of cables. For example, if there are N sets of cables between two junction points, there would be two branches between the junction points, one being the equivalent of N-1 sets in parallel, and the other branch being for one actual set of cables. This would allow simulating faults on the actual set to determine if there is sufficient fault current to burn clear when cable limiters are not used, or if the available fault current will blow the cable limiters in an acceptable time.
Bus Impedance
In spot networks, and in multi-bank installations, frequently the network terminals of the network protector are connected to a paralleling bus at different points along the bus. Normally the impedance of the bus sections between points where the cables are attached to the bus is not considered. However, in some situations, in particular in 208-volt systems, the impedance of the bus may not be negligible, and can be included in the model for power flow and short-circuit studies.
Figure 9 shows two bus bar configurations for which the positive-sequence impedances are given in Table 3, in micro-ohms per 10 feet of length, for the spacings indicated in the table. Note the relatively high X to R ratio of the bus impedance relative to that of phase-grouped cables. Going from one bar per phase to two bars per phase lowers the resistance significantly, although not in half due to skin and proximity effects, but the number of bars has a minor effect on the positive-sequence reactance.

Figure 9:
Bus bar arrangements for positive-sequence impedances.
Table 3:
Positive-sequence impedances for the bus bar arrangements
shown in Figure 9.
Bar Size (inch) |
No Bars Per ϕ |
Phase Spacing (Inch) |
Pos Sequence Impedance (μΩ/10 ft) |
||||
|---|---|---|---|---|---|---|---|
| w | h | A-B | B-C | Z11 | R11 | X11 | |
| 1/4 | 4 | 1 | 10 | 10 | 591 | 93.6 | 583 |
| 1/4 | 4 | 2 | 10 | 10 | 550 | 53.3 | 547 |
| 1/2 | 6 | 1 | 10 | 10 | 479 | 36.1 | 478 |
| 1/2 | 6 | 2 | 10 | 10 | 432 | 22.8 | 431 |
One major user of 480-volt spot networks makes the paralleling bus using 5 inch by 8 inch integral web aluminum bus on 15 inch centers as shown in Figure 29 of Introduction and Overview. The spacings for this bus and the positive-sequence impedance is listed on Figure 10, for comparison with those in Table 3. Notice that although the phase-to-phase spacings with the integral web bus are wider, 15 inch versus 10 inch, for the configuration in Figure 9, the positive-sequence reactance, 386.7μΩ/10 foot is less than that for the bus arrangements in Figure 9. This is because the effective geometric mean radius of the integral web bus is larger than that for the bus bars in the arrangements of Figure 9.

Figure 10:
Spacings for 5 inch by 8 inch integral web aluminum bus
and the positive-sequence impedance.
It should be noted that with bus configurations as in Figure 9 and 10, the system is not symmetrical, and the mutual impedances between the sequence networks are not negligible. In comparison, with phase-grouped cables, the mutual impedances between the sequence network are very small in comparison to the self-sequence impedances.
Table 4 lists the leakage (nameplate) impedance of 216-volt and 480-volt network transformers in micro ohms referred to the secondary side. A comparison of the impedance of 10 foot of bus as given in Table 3 with the impedance of the 480-volt transformers shows that for most situations the impedance of the bus can be neglected. But the impedance of the bus may not be negligible in comparison to the impedance of the 216-volt network transformers.
Table 4:
Network transformer impedances in μΩ referred to the
secondary side
Size (kVA) |
Sec (Volt) |
Z (%) |
Z (μΩ) |
R (μΩ) |
X (μΩ) |
|---|---|---|---|---|---|
| 500 | 216 | 5.0 | 4660 | 659 | 4613 |
| 750 | 216 | 5.0 | 3110 | 440 | 3079 |
| 1000 | 216 | 5.0 | 2330 | 330 | 2307 |
Size (kVA) |
Sec (Volt) |
Z (%) |
Z (μΩ) |
R (μΩ) |
X (μΩ) |
| 1000 | 480 | 5.0 | 16130 | 2001 | 16005 |
| 1500 | 480 | 7.0 | 10750 | 1333 | 10667 |
| 2000 | 480 | 7.0 | 8060 | 1000 | 8000 |
| 2500 | 480 | 7.0 | 6451 | 800 | 6401 |
For example, the impedance of 10 feet of bus is at least 18.5% of the impedance of the 1000 kVA 216-volt 5% impedance network transformer.
Effect of Bus Impedance on Backfeed to DLG Fault on Primary
To illustrate the effect that bus impedance in spot networks can have on backfeed currents, and phase-to-ground voltages at the backfeeding network protector, the results of analyzing the actual system in Figure 11 will be presented. In this system, there are three 750 kVA 216-volt 5% impedance network transformers. On the feeder supplying the network unit on the right end, there is a double line-to-ground fault with the breaker for the faulted feeder open. The HV terminals of the other two network units in the spot network are connected to an infinite bus.
Table 5 lists the phase-to-ground and phase-to-phase voltages at the backfeeding network protector, and the currents in the backfeeding protector, when the impedance of the bus sections is neglected (set to zero), and when the impedance of the 15 feet of bus between the network units is included.

Figure 11:
Spot network for illustrating the effect of the
impedance of 15 feet of bus on the backfeed currents and voltages at the
backfeeding network protector.
The situation simulated in Figure 11 occurred at one utility and the backfeeding network protector failed to open. It is believed that the voltage on the phase with protector shunt trip mechanism was too low and the device did not operate. From the third row of data in Table 5, if the bus impedance were zero, the voltage from phase C to ground (neutral) would be 83.34 volts, but when the bus impedance was included, the voltage is only 68.56 volts, or 54.8% of the protector rated line-to-ground voltage of 125 volts.
Shown by the data in the last two columns of Table 5 are the effect of including the bus impedance on the phase currents in the backfeeding network protector. Notice that whether the impedance of the bus is or is not included, the two to one current ratio associated with the backfeed to the DLG fault when the cable charging of the primary feeder is neglected. Including the impedance of the 15 feet of bus lowers the backfeed current to 82.3% of that when the bus impedance is neglected.
Table 5:
Phase-to-ground voltages at the backfeeding network
protector in Figure 11 and the currents in the backfeeding network
protector.
| PHASE | VOLTAGE (VOLTS) | CURRENT(AMPS) | ||
|---|---|---|---|---|
| NO BUS | 15 FT BUS | NO BUS | 15 FT BUS | |
| A-N | 116.0 | 113.3 | 13396 | 11020 |
| B-N | 116.0 | 113.8 | 13396 | 11020 |
| C-N | 83.34 | 68.56 | 26792 | 22040 |
| A-B | 216.5 | 216.5 | ||
| B-C | 165.4 | 14939 | ||
| C-A | 165.4 | 148.7 | ||
Effect of Bus Impedance on Backfeed to Three-Phase Fault on Primary
Figure 12 illustrates a fault situation which generates voltages to ground at the backfeeding network protector which can create conditions which may result in failure of the power supply in microprocessor network protector relays. Should this happen, and it has, the protector will not open, but the fuses in the backfeeding protector will blow.
If in the system of Figure 12, all primary feeders come from a substation with closed medium-voltage bus-tie breakers, and a three-phase fault occurs on one feeder, the voltage on the medium-voltage buses in the substation goes to zero, or close thereto until the faulted feeder breaker opens. This also results in the voltage on the spot network bus also dropping down to zero or close thereto.

Figure 12:
Network voltages at a backfeeding network protector for
a three-phase fault on the primary feeder at the substation.
Following opening of the breaker for the faulted feeder in Figure 12, the voltage on the network bus at the backfeeding protector will rise, to a value determined by the number of network transformers in the spot network, and the impedance of the bus sections between the network protectors.
With the impedance of the bus sections being zero, following opening of the breaker for the faulted feeder, the voltage to ground on the network bus, will rise up to the value given by eq (24) in a 216Y/125-volt spot network, where “N” is the number of units in the spot network.
(24)
$$ \ \ \ V_{Bus \phi-G} = 125 \frac{N-1}{N} \text{ volts} $$
From eq (24), the voltage to ground on the bus, following opening of the breaker for the faulted feeder will rise to 62.5, 83.3, or 93.75 volts when the fault is on the feeder supplying an “end” unit as in Figure 12, and when respectively there are two, three, or four units in the spot network.
But when the impedance of the bus between the network units is included, the voltage on the bus at the backfeeding network protector (end unit) will not rise to the level given by eq (24). For the system in Figure 12, the bus voltage following opening of the breaker for the faulted feeder (three-phase fault) will rise to the level shown in Figure 13 for spot networks with two, three, and four network units. The bus voltages are plotted for bus section lengths between zero feet up to 20 feet. It is seen from Figure 13 that the voltage to ground at the backfeeding protector are significantly lower when the effects of bus impedance are included.
For the situation described, when the three-phase fault first occurs, the voltage on the spot network bus drops to zero volts, which is below the level where the power supply of the microprocessor network protector relays will function under steady state conditions. The duration of the zero-voltage condition depends upon the opening time of the breaker for the faulted feeder. After the faulted feeder breaker opens, the voltage on the network bus at the backfeeding protector (end unit) for the three-phase fault will rise to the level shown in Figure 13. The level it rises up to is strongly influenced by the number of units in the spot network, and the impedance of the bus sections between adjacent network units.

Figure 13:
Bus voltage at backfeeding network protector for
three-phase fault at station, following opening of breaker for faulted
feeder.
What is important for microprocessor relays for this extreme fault condition is that when the voltage on the bus at the backfeeding network protector rises to the level shown in Figure 13, the power supply for the microprocessor relay will power up and the relay trip logic becomes active. Recognize that three-phase fault creates the most severe conditions for the network relay power supply. For the SLG or DLG fault on the feeder at the substation, this is not an issue.
Effect of Spot Network Bus Impedance on Secondary Fault Currents
Whenever fault current calculations are performed for spot networks for arc flash studies or to provide the maximum short-circuit currents for determining the required interrupting rating of customer breakers, it may be beneficial to include not only the bus impedance in the model for the 216-volt system, but also the impedance of the phase-isolated cables that go from the network terminals of the network protector to the paralleling bus. The Aluminum Electrical Conductor Handbook (Aluminum Association 1971) contains useful information on the impedances of aluminum buses that can be used in secondary network systems.
Load Modeling
With careful attention to detail and by keeping up-to-date records of the actual topology of the secondary network, an accurate impedance model can be created for the network. As indicated before, the impedance of short inter-vault tie circuits and secondary mains are not negligible in comparison to the impedances of the network transformers, and should be included in the model. The impedance model is the foundation needed for obtaining accurate results for both the power flow and short-circuit studies.
In most power flow programs, loads can be modeled as constant impedances, constant current sinks, or constant P + jQ loads, where most users select the later. For larger loads, usually peak demand values are available from billing data, from which the load peak kW and kVAr values can be obtained. For smaller loads where demand data is not available, many utilities have algorithms for converting kWhr data to peak kW, from which the peak kVAr value is found by assuming a load power factor.
For the secondary grid network, each individual load is assigned to a bus or node representing a manhole, hand-hole, vault, or service box. The total load supplied from the node would be the aggregate of the individual loads supplied from the node. If the aggregate is the sum of the peaks of all loads supplied from the node, the results of the of the load flow will be the worst case, giving the highest loadings and the lowest voltages on the network. If data exists on the diversity of the different loads supplied from a given node, the individual peak loads can be adjusted accordingly to account for different shapes on the individual load curves and the individual loads peaking at a different time.
There is always uncertainty in modeling of the loads, and this is perhaps the main reason power flow result do not perfectly match actual load data. But modeling of the system topology and impedances can be done accurately, and high effort should be extended to remove error in the power flow result due to inaccurate topology and impedances.
Data Input
System Topology and Impedances
How the data is provided to the power flow or the short-circuit program modeling of the secondary network depends on the program and the state of the required data. Topology data may be maintained on paper maps, or it may be included in a geographic information system (GIS), or in other geospatial records maintained by the utility.
Data for programs that ran on mainframe computers and minicomputers typically were provided on punch card or in punch-card format, where each card contained data for the line or transformer. Lines and transformers were assigned a branch number and/or an alphanumeric identifier. Associated with each branch was a “to” and “from” bus number, series impedance values, and for primary cable the cable charging kVAr. Most power flows for secondary networks are done assuming balanced three-phase conditions, so only positive-sequence impedance data is required, but for short-circuit programs, zero-sequence impedance data is needed if phase-to-ground short-circuits are to be simulated. For the network primary feeders, primary cable charging should be represented in the power flow program for the longer segments, especially for the main trunks that use large size cables. Typically, the engineer or planner would take data from maps, assign bus or node numbers and line/transformer identifiers, and then enter the data in the format required by the particular program.
Today, many load-flow and short-circuit programs for personnel computers have graphical user interfaces (GUI), allowing the engineer to graphically draw the system topology showing buses, branches for primary feeder segments, network transformers, secondary tie circuits, and secondary mains. Assigned with drop-down menus for each network transformer are the primary and secondary rated voltages, impedance, connections, and for branches the impedances per unit length and the length of the branch. Some programs have a library of impedances for transformers, primary cables, secondary mains, and tie circuits such that only a line code and line length must be entered. When using these, the engineer or planner should check that the default values in the program are applicable to his particular system.
Programs with GUI allow much easier visualization of the input data and results of either the power flow or short-circuit calculations. If the output of the power flow shows an overloaded line or transformer, or a low-voltage condition, additional cables or transformers can be added graphically, and immediately the effect of the addition on overload or undervoltage is visualized.
If the secondary network system data is maintained in a GIS or other enterprise system, vendor programs are available that can link this data to the short-circuit or power flow program., simplifying the manual effort required to generate the model. Although some utilities have data for radial primary system entered into GIS, very few have done this for secondary network systems.
Assembly and input of the system impedance data for the load-flow and short-circuit programs requires a significant effort, but once established as a base case, it can be maintained and kept up-to-date with a reasonable effort. However, resources must be committed to keeping it up-to-date. When paper maps were the main method of maintaining system data, if system changes or additions were made in the field were not recorded, they could easily be overlooked and lost. The same applies to data in digital programs regardless of how the data is entered.
Loads
Loads for programs that ran on mainframe computers and minicomputers were typically provided on punch-cards or with card image format, where each card contained data for one bus (node). Data for each bus contained an alphanumeric identifier, bus number, nominal voltage, P+jQ data for all loads connected to the bus, and any shunt element such as power factor capacitors. For the power flow studies, most always the loads are considered balanced.
For each customer supplied from the secondary network, their peak load data is available from either demand metering, or kWhr metering, with the customer associated with a manhole, vault, handhole or service box. As indicated before, all loads do not peak at the same time. A conservative approach is to perform the power flow using noncoincident peak load values. Systems that perform satisfactorily with this approach will also perform satisfactorily when load diversity is taken into account.
When simulating faults in the low-voltage portion of the system, the total current in the primary feeders at the substation is needed so that the phase instantaneous and time overcurrent relays can be set properly. The total current seen by the feeder phase relays, for a secondary system fault, consists of a load component and a fault component. The magnitude of the load component frequently is not negligible in comparison to the magnitude of the fault component for faults in the LV system. The short circuit program should account for the load components, recognizing that the two components have different angles.
Program Output
Power flow and short-circuit programs that ran on mainframe and minicomputers typically provided printed results in tabular form for lines and buses. In programs with GUI, the results can be provided in both tabular form or on the system one-line diagram. When output is given on the one-line diagram, sometimes when there are multiple sets of phase-grouped cables between manholes, the results can be cluttered and difficult to read. For example, if there were eight sets of phase-grouped cables in a secondary tie circuit between two manholes, there are eight lines in the SLD with the same information. For this reason, it can be advantageous to represent all but one set of parallel cables between the same two nodes (buses) with an equivalent, maintaining the identity of just one set of cables.
Programs with results presented on the one-line diagram can use color coding to help identify overloaded transformers, or secondary mains during normal and contingency conditions. Similarly, color coding of results helps in identifying buses or nodes with low voltages.
For large secondary network systems, the amount of line flow and voltage data to be examined for each normal and contingency conditions can be massive. Most software will provide tabular outputs with only the lines that are overloaded, or nodes that have low voltages, thereby simplifying the work load for the engineer or network planner.
Control of Data Base
When more than one individual or department within the utility has access to the data base for the secondary network system, protocols must be established regarding who controls the data base, who can access the data base, who can change the data base, and when it can be changed. Procedures must be in place so that whenever a change is made in the field, which could occur even during an emergency repair in the middle of the night, they are immediately reflected in the data base. This includes not only additions to the system, but removal of circuits and network transformers, or changing of transformer size.
Other Software For Secondary Network Systems
Although the power flow and short-circuit software are the major tools for modeling secondary network systems, other programs are very useful. For power flow studies, ratings must be assigned to primary cables and secondary cables, both for normal conditions and emergency conditions. Although cable circuit ratings can be found in manufacturers literature, based on certain load factors, duct bank occupancy, and other parameters affecting circuit rating, the conditions in the field may not be reflected in these data. Computer software is available that can accurately calculate the ratings of specific cable circuits installed in duct banks containing both primary and secondary cable circuits. The software will also account for other heat sources that are in the vicinity of the network primary and secondary cables, such as steam lines and adjacent duct banks. Primary Feeder Protection of the EPRI Bronze Book discusses in detail cable ampacity ratings and factors that affect ratings.
In today’s network system, a greater percentage of the loads produce harmonic currents. Discharge lighting in 480-volt systems, connected from phase-to-neutral, can produce significant zero-sequence harmonic currents, the third and its odd multiples, that flow in the secondary neutral conductors and in the wye-connected secondary windings of the network transformers. With the delta-connected primary windings on the network transformers, the zero-sequence currents circulate within the delta connected primary, and they do not flow in the flat-strap neutrals or lead sheaths of the primary cables. But with the primary windings of the network transformer connected in grounded wye, the zero-sequence currents return to the substation in the ground return path of the primary feeders, which include lead sheaths, flat-strap neutrals, and multi-wire concentric neutrals. Other harmonic loads, such as rectifiers and variable frequency drives, can produce both positive-and negative-sequence harmonic currents that pass through the network transformer to the primary feeders, regardless of transformer connections. The main harmonics from the six-pulse rectifier are the fifth and seventh, and for the twelve-pulse rectifiers, they are the eleventh and thirteenth.
The flow and distribution of harmonic currents in the system is
different than the flow at fundamental frequency. When harmonics are
significant, it may require derating network transformers and cable
circuits. Software is available for finding harmonic flows, and
determining if harmonic resonances will occur when loads generate
harmonic current levels that can be troublesome.
Whenever short-term and long-term planning studies are conducted, one
major problem is determining how the loads will change in the future.
Software for small-area load forecasting using trending, multivariate,
or other simulation methods- can provide the planner with guidance on
where loads will develop in the future. Essentially these methods
analyze past and present load growth to identify trends, patterns, or
information about the process of load growth that is then used to
project future loads.
4.12 - 480 Volt Spot Network Protection
480-VOLT SPOT NETWORK PROTECTION
Early three-phase four-wire secondary network systems operated at a nominal 208Y/120 volts, serving combined power and lighting load. In many systems, the individual loads were small relative to the network transformer sizes. The network transformers and protectors at different locations were connected together through three-phase four-wire secondary mains. Many of the small loads were supplied from the secondary mains rather than directly from transformer vaults or manholes adjacent to the transformer vaults, a practice suitable for high-density urban areas with both large and many small customers.
When the load in a building exceeded a certain level, one or more network transformers and protectors (network units) were installed close to the large load, feeding into a bus structure, from which the large load was supplied. In addition, there would be ties from the bus to the street network, such as illustrated in Figure 4 of secondary Grid Design Considerations. Smaller loads were supplied from manholes or handholes fed by the secondary mains.
As buildings in urban areas became taller, with associated increases in HVAC loads and higher lighting levels, the cost of the building interior wiring systems operating at 208Y/120-volts became quite high. Studies by architects and engineers showed that the building wiring costs could be reduced if the interior wiring systems operated at a nominal 480Y/277-volts. (Electrical World 1956) indicated that selecting 480 volts, rather than 208 volts, for the New York City Coliseum resulted in a savings of $1.5 million (1956 dollars). (Larson 1959) indicates choosing 480 volts rather than 208 volts can produce savings as high as 25% for the building’s interior wiring system. With 480-volt distribution in the buildings, large motors and HVAC are supplied directly at 480 volts (or 460 volts) from low-voltage switchgear or motor control centers (MCC). Dry type transformers, installed internally to the building, convert 480-volts to 208Y/120-volts three-phase four-wire for small loads and convenience outlets. These transformers typically are connected delta on the 480-volt side, and wye on the 208-volt side, with the neutral of the wye-connected windings solidly grounded to the building steel, and to the equipment grounding conductor of the 480-volt feeder that supplies the delta winding. Further, changes to the electrical codes permitted use of 277-volt circuits (one phase, one neutral, and equipment grounding conductor) for fluorescent lighting, including the “wall switches” for manual control of the lighting.
To supply large loads at 480-volts with the same reliability of the 208Y/120-volt grid networks, 480-volt spot networks were selected in many situations. Selecting 480-volts for the spot network also resulted in lower cost for the serving utility. The spot network single-line diagram is similar to that in Figure 4 of secondary Grid Design Considerations, except that there are no ties to the street network, and no ties to other nearby spot networks operating at 480-volts. Spot networks have from two to six network units feeding a common paralleling bus.
Spot Network Equipment Layouts
Operation For Faults In Three-Feeder Network of Figure 1 describes some common layouts for spot networks. Further examples are given in (Cranos and Gilligan 1976). Figure 1, similar to Figure 16 of Introduction and Overview of Secondary Network Systems, is used for discussing the design of 480-volt spot network systems and identifying some potential problems that may occur in the 480-volt spot network, but not in the 208-volt systems.
The equipment and designs selected by utilities for many 480-volt spot networks are similar to those employed successfully in 208-volt systems for spots and multi-bank installations feeding a paralleling bus. The network transformers and HV disconnect and grounding switch are basically the same, except that the secondary winding is rated 480Y/277 volts rather than 216Y/125 volts, or 208Y/120 volts. Network protectors first applied in the 480-volt spot networks were essentially the same protector applied in 208-volts systems, except for either the addition of electromechanical network relays suitable for operation at 480-volts or else the addition of relay autotransformers, which allowed utilizing the same 216-volt electromechanical relays applied in the grid network system (Uber 1960). The equipment for making the low-voltage connections on the secondary (cables, moles, crabs, utility-fabricated bus structures, commercial bus duct, etc.) at 480 volts were the same as in the 208-volt systems in many cases.
One exception was that cable limiters had to be developed for 480-volt systems (see Figure 40 in secondary Grid Design Considerations), because the standard cable limiter could not interrupt at the higher voltage. Subsequently, network protectors were developed with characteristics more suitable for 480-volta applications, including wider spacings between energized power buses, and draw-out features (Figure 38 & 39 of Network Unit Equipment).

Figure 1:
Three-unit spot network supplying two 480-volt services.
Protection Practices for 480-Volt Spots
Protection practices in early 480-volt spot networks were similar to those in 208-volt systems. Faults on the HV primary feeder or in the network transformer were cleared by opening of the feeder circuit breaker at the substation, and the opening of all network protectors associated with the faulted HV primary feeder.
As can be seen from Figure 1, faults downstream of the network protector network terminals in the 480-volt portion of the system were cleared by blowing of network protector fuses, cable limiters, or service fuses, depending on the type of devices installed, and whether cables, buses, or a combination were used to construct the secondary system. If the fault in the 480-volt portions of the system either burns clear or draws sufficient current to blow cable limiters or fuses, this approach electrically isolates the fault downstream of the network protectors.
However, the experiences at some utilities has been that faults in the 480-volt system do not burn clear. Or the faults are arcing and intermittent in nature, and do not draw sufficient current to blow high-capacity current-limiting (silver sand) fuses used for the services, or blow the network protector fuses. Even if the currents are high enough to ultimately blow the protector fuses or service fuses, they may not blow until excessive damage is done to the system, with possible fire and smoke damage to the building supplied from the spot network, or other nearby facilities.
Unprotected Zone
Most 480-volt spot networks have an unprotected zone, as indicated in Figure 2. This area, outlined with the dotted purple boundary, extends approximately from the point where the low-voltage leads for the secondary windings exit the LV coils, through the network protector to the location of the network protector fuses. Should a fault occur in this area, it may be cleared from the network side by blowing of the protector fuses, or possibly by opening of the network protector main contacts. But with the fuses internal to the network protector as depicted in Figure 2, it is quite possible that with an internal arcing fault, the fault will propagate to the network terminals for the protector enclosure. Figure 3 is a picture of a staged fault inside a submersible network protector, showing the effects of the internal fault and the flame exiting the gasketed door. Surely the internal protector is filled with ionized gases which will maintain the fault and allow it to spread.
The chance of a network protector fuse isolating an internal fault in the protector from the network is increased if the protector fuses are located outside of the protector enclosure. Figure 4 shows a conventional throat-mounted network protector with silver-sand fuses located on the network side terminals outside of the main enclosure.
Even if the fault in the unprotected zone in Figure 2 is isolated from the low-voltage portion of the system by blowing of network protector fuses external to the protector enclosure, it must still be cleared from the primary side by de-energizing the network transformer. This means in the conventional network system with dedicated primary feeders that the feeder circuit breaker associated with the faulted protector must open.
As discussed in Primary Feeder Protection, a fault of any type in the secondary winding of the network transformer, or in the secondary system is not detected by the ground relays for the primary feeder (50/51G) when the network transformers are connected delta on the HV side, and grounded-wye on the LV side.

Figure 2:
Current paths in a throat mounted network protector for
a 480-volt spot network.

Figure 3:
Internal fault in an energized submersible 480-volt
network protector (courtesy Dallas Power and Light).
Further, in most systems the pickup of the phase time overcurrent relay for the primary feeder circuit breaker, 51ϕ, is higher than the current that flows for faults on the secondary side of the transformer, and in particular with the smaller sized network transformers. For example, with a 1000 kVA 5% impedance network transformer and a bolted three-phase fault at its LV terminals, the maximum fault current on the primary feeder is 875 amperes rms in a 13.2 kV primary system. If the fault on the LV side were SLG, the maximum phase current on the HV side is just 505 amperes rms. Considering that many faults in the 480-volt system are arcing and intermittent in nature, the phase time overcurrent relays for the primary feeder will not pickup, and the phase instantaneous current relays, 50ϕ, will not pickup. The experience of many utilities with such faults is that the phase relays for the primary feeder at the substation will not respond until the fault burns back into the transformer windings.

Figure 4:
Throat-mounted network protector with silver-sand fuses
mounted externally on the network-side terminals (photo by author).
If a fault in the unprotector zone is arcing and self- sustaining in nature, it can do considerable damage to the protector, and extensive peripheral damage. Figure 5 shows the inside of a type CM-22 network protector that experienced a sustained arcing fault in a 480-volt spot network. Figure 6 shows this protector before it was removed from the vault, as well as the peripheral damage done in the vault.
In Figure 5, the damage to the stationary bus bars in the network protector housing is clearly evident. In effect, there was a “mini arc furnace” inside the network protector enclosure with the arcing occurring in the unprotected zone. The heat of the arcing was sufficient to melt the solder seal on the network transformer LV bushings, allowing transformer fluid to leak into the network protector enclosure. The heat also resulted in the failure of the protector bushings at the top of the enclosure, allowing them to drop down into the enclosure as shown.
From Figures 5 and 6, insulation of the cables attached to the network terminals of the protector was consumed by fire.

Figure 5:
480-volt network protector that had a fault in the
unprotected zone (courtesy Westinghouse)

Figure 6:
Peripheral damage done to network vault with the damaged
protector shown in Figure 6.(photo courtesy Westinghouse)
From Figure 6, the protector housing busbars also arced to the bottom of the enclosure, burning through the enclosure, and dropping down onto the vault floor below the protector. For this particular event, the fault was cleared manually by dropping the primary feeders to the spot network.
Figure 7 shows the damage done to a GE type 480-volt network protector that experienced an internal arcing fault. Again, the main reason for the extensive damage is that the relays for the primary feeders generally do not respond for faults in the unprotected zone, and the arcing continues until the network transformer is deenergized.

Figure 7:
Remains of a GE type network protector that experience
an arcing fault in the unprotected zone.(photo courtesy PG&E)
Arcing Faults Downstream From Network Protectors
Faults downstream of the network protector terminals are not in the unprotected zone, but should a fault occur in bus or cables, the only devices for clearing the fault in the conventional 480-volt spot network are the network protector fuses, or service fuses, depending on fault location. Both fuses have a high continuous current rating.
When an arcing fault occurs downstream of the network protector, if arcing in nature considerable damage can be done before it is cleared or burns clear in the 480-volt system. Figure 8 shows damage to metal enclosed bus duct that was used to parallel the network protectors, and supply the 480-volt service. Faults in metal enclosed bus duct in 480-volt systems are prone to sustaining themselves, as the spacings between phases, and between phases and ground are very small. This construction is not preferred for 480-volt spot networks.

Figure 8:
Remains of LV bus duct in a 480-V system that
experienced an arcing fault (photo courtesy Toledo Edison).
Figure 9 shows, in the upper left-hand corner, high-ampere current-limiting fuses in the network vault for protecting the service entrance bus. Connections from the paralleling bus to the service bus are with insulated phase-isolated cables. Also installed in this vault in the picture are probe-type heat sensors, which, upon operating, initiate trip and lockout of all network protectors in the spot network.

Figure 9:
High-ampere, current-limiting fuses protecting a
480-volt service (photo by author).
If the paralleling of the network protectors and the connections to the service switchgear are made with multiple sets of insulated cables per phase, fault must be cleared by blowing of one or more cable limiters, depending on the configuration and where the fault is located. If the fault is on a bus to which many sets of cable are terminated, the limiters in many sets of cables must blow to clear the fault. In effect, the limiters in the paralleled cables feeding the bus look like a high-ampere current-limiting fuse. Regardless, when the faults are arcing and intermittent in nature, the rms value of the current can be low and protector fuses or service fuses may not blow, or they blow only after extensive damage is done by the arcing fault.
In contrast, when enhanced protection systems are installed in 480-volt spot networks, damage from arcing faults can be significantly reduced. With these protection systems, devices are installed to detect arcing faults in the 480-volt portion of the system, and devices are installed to de-energize the arcing faults. Faults downstream of the network protector “network terminals” between the protector and service entrance breaker (or switch and fuse) can be cleared by opening of all network protectors in the spot network, or by opening of vacuum circuit breakers or switches on the HV side of all network transformers for the spot network.
Figure 10 shows the minimal damage resulting from arcing at the interface between the copper bus bars of the network paralleling bus and service bus duct to the customers switchgear on the other side of the vault wall (see Figure 1). This vault was equipped with an enhanced protection system that rapidly detected and de-energized the fault at the interface.
For the system in Figure 10, the initial event was an arcing fault within the service entrance switchgear on the incoming side of the main breaker. The fuses in the network protectors feeding the paralleling bus did not respond to this fault, which is not unexpected. With the fault in the service switchgear on the other side of the vault wall, the connections between the paralleling bus in the utility vault and service bus failed, initiating an arcing fault at this location. But, because this utility installed “probe-type” heat sensors at this location, as seen in the picture, the arcing fault was detected by operation of the heat sensor. Operation of the heat-sensor initiated tripping of vacuum breakers at the HV side of each network transformer in the spot network, de-energizing the system and limiting the damage.

Figure 10:
Minimal damage from arcing fault at tap from
paralleling bus to service bus in 480-volt spot network (photo courtesy
Eaton).
Experiences elsewhere would suggest that had the enhanced protection system not been installed, the fault could have caused extensive damage within the network vault. For faults at the location shown in Figure 10, the fault also can be cleared by opening and lockout of all network protectors in the spot network.
Similarly, faults within network protectors can be rapidly isolated to limit damage to the faulted protector and prevent or minimize collateral damage. This requires that detection devices be installed, and circuit interrupters be installed on the HV side of the network transformer to de-energize the transformer for the protector with the internal fault. And to de-energize a protector with an internal fault, means must be installed to de-energize the network terminals of the protector with the internal fault.
Bolted and Arcing Faults in 480-Volt Systems
As discussed in Currents for Bolted, Arcing, and Intermittent Faults, faults can be classified as bolted or arcing. For the bolted fault, the impedance in the fault path between two or more energized conductors is zero ohms. With bolted faults in the 480-volt portion of the secondary network system, the protector fuses, service fuses, or cable limiters usually will clear. However, the clearing time may be long, depending on fault location and fuse characteristics. For example, for a bolted fault on the paralleling bus in a 480-volt spot network, the upper bound on the current in the protector fuse in each protector is 20 times network transformer rated current for 5% impedance transformers, or 14.3 times transformer rated current for 7% impedance network transformers. See the protector fuse time-current curves for the different size fuses in Appendix 4, which also show the maximum through fault current for 480-volt transformers of different sizes.
When a fault occurs on the primary feeders to a spot network, the backfeed current in the protector on the faulted feeder, with the feeder breaker open, can approach the current in the protector for a bolted fault on the secondary side. How close depends upon the number of units in the spot network. This principle can be seen from Figure 11, where at the top IF is the current in each protector for a bolted three-phase fault on the secondary side, and at the bottom of Figure 11 IB is the backfeed current in the protector connected to the faulted feeder, with the breaker for the faulted feeder open.

Figure 11:
Comparison of protector currents for secondary fault
and primary feeder fault.
With N being the number of units in the spot network, with network transformers of equal size and impedance, the ratio of the maximum backfeed current IB for a fault on the primary feeder to the forward current for a fault on the network bus, IF, is:
(1)
$$ \ \ \ \frac{I_{B}}{I_{F}} = \frac{N-1}{N} $$
Table 1 list this ratio for spot networks with between two and six network transformers. This ratio is independent of network transformer impedance.
Table 2:
Ratio of Maximum Backfeed Current to Maximum Forward
Current
Number of Units (N) |
2 | 3 | 4 | 5 | 6 |
|---|---|---|---|---|---|
| IB / IF | 0.50 | 0.67 | 0.75 | 0.80 | 0.83 |
By necessity, the network protector fuse at high backfeed currents must be slow enough to allow time for the network relay to detect the fault and time for the protector to interrupt the backfeed current when the trip mechanism is energized. This is particularly important with electro-mechanical network relays where the relay sensitive trip time can be high. In contrast, with modern microprocessor relays, the sensitive trip time is definite, typically being between 3 and 6 cycles. For a six-unit spot network, normally the largest size used, the maximum backfeed current IB is 83% of the of the maximum forward fault current, IF. At the maximum backfeed current, the protector fuse time should be no faster than about 0.70 to 1.0 seconds to allow tripping of protectors with electromechanical relays. Further, the size fuse in a network protector of a given rating is the same regardless of the number of units in the spot network. One factor in selecting the fuse size is the through-fault protection it provides the network transformer during backfeed when a protector fails to open, as discussed in Appendix 4.
Consequently, the network protector fuse will not be fast for bolted faults on the 480-volt secondary or network side of the protector, and even slower for intermittent and arcing faults on the secondary. The protector fuses should also coordinate with the fuses installed in the service or at the service entrance, and should coordinate with the tripping of the main breaker at the service entrance. Appendix 2 discusses the coordination of network protector fuses with service fuses, type A4BY, between 1200 and 6000 amperes.
For arcing faults in the 480-volt system, as discussed in secondary Grid Design Considerations, the rms value of the arcing fault current can be significantly less than the bolted fault current, due to the effect of both arc voltage and intermittency in the arcing.
Effect of Arc Voltage on RMS Value of Fault Current
Equation 64 in secondary Grid Design Considerations gives the relationship between the rms value of the current in a sustained arcing fault, IARC, to the rms value of the bolted fault current, IB, as a function of the rms value of the fundamental frequency component of the square-wave arc voltage, VA-RMS, circuit X to R ratio, and the rms value of the system line-to-ground voltage, ES. Equation (9-65) gives the relationship between the peak value of the square-wave arc voltage, VP-ARC, and the rms value of the fundamental frequency component of the arc voltage, VA-RMS. As explained in secondary Grid Design Considerations, in deriving this relationship, it is assumed that following each current zero the arc restrikes.
With these equations, the ratio of the rms value of the sustained arcing fault current to the rms value of the bolted fault current can be plotted as a function of the peak value of the square-wave arc voltage. This ratio is repeated here as eq. (2), and the ratio of the rms value of the fundamental frequency component of the arc voltage, VA-RMS to the peak value of the square-wave arc voltage, VP-ARC, is given by eq (3).
Figure 12 plots the ratio of IA-ARC to IB, for a 480-volt system where ES in eq (2) is 277 volts. The curves apply to either the three-phase or single line-to-ground arcing fault. It is emphasized that the curves in Figure 12 assume that the arc restrikes following each current zero. Thus, the curves give the maximum rms value for the sustained arcing fault current.
(2)
$$ \ \ \ \frac{I_{ARC}}{I_{B}} = \frac{V_{A-RMS}}{E_{S}} \frac{1}{\sqrt{1 + (X/R)^2}} * [-1 + \sqrt{\frac{E_{S}^2}{V_{A-RMS}^2}(1 + (X/R)^2) - (X/R)^2}] $$
(3)
$$ \ \ \ V_{A-RMS} = \frac{2\sqrt{2}}{\pi} V_{P-ARC} $$

Figure 12:
Ratio of the rms value of the sustained arcing fault
current, IARC, to the rms value of the bolted fault current,
IB.
Sustaining a fault in equipment operating at 208Y/120-volts is difficult when there is separation between the electrodes. In the AIEE paper, “Reignition of Metallic A-C Arcs in Air”, by Attwood, Dow, and Krausnick, published in 1931, summary point 3 of the paper states, “Before current can pass in the new direction (following arc extinction) the voltage between the electrodes must rise to a definite minimum value. For copper electrodes in air at atmospheric pressure this is about 300 volts”. A possible interpretation of summary point 3 is that in 120-volt circuits where the peak value of the voltage is √2 x 120 or 170 volts, an arc initiated between electrodes in air at atmospheric pressure may not restrike following current zero. But in a 277-volt circuit where the peak value of the voltage is 392 volts, an arc initiated between electrodes in air may restrike following current zero.
Although sustaining an arc in 120-volt circuits between two electrodes in air may be difficult, the same does not apply in some 480-volt equipment, such as bus duct and network protectors. Industry experience, with arcing faults in 216-volt network protectors is that frequently they self- clear, and there is not a massive meltdown. However, there have been faults in 216-volt low-impedance bus duct, protected with a 4000 Ampere fuse, that did not blow the fuses and the fault did not go out as the fault continued to make phase-to-phase contact. There have also been a few reports of faults in 216-volt network protectors that caused considerable damage as the fault reestablished itself through metal to metal contact.
But in 480-volt systems, there have been numerous situations where arcing faults in the network protectors did not go out, causing extensive damage to the protector. Recent tests conducted by EPRI for arc flash hazard investigations show that faults initiated in 216-volt protectors do not sustain themselves, but at 480-volts they do. This is consistent with the findings of Attwood, Dow, and Krausnick cited earlier. But as indicated above there have been faults in 216-volt network protectors which resulted in extensive damage, as the fault caused mechanical damage which allowed phases to re-establish contact. When the arcing fault current flows, high mechanical forces are created which can cause, in 208-volt systems, conductors to separate, but when the arc goes out the conductors can move to re-establish contact, phase-to-phase or phase-to-ground.
As shown in Figure 12, the maximum rms value of the sustained arcing fault current in the 480-volt spot network is less than the bolted fault current, the amount dependent upon the peak of the square-wave arc voltage, plotted on the abscissa, and by the circuit X to R ratio. For a given arc voltage on the abscissa, the higher the X to R ratio the higher the rms value of the sustained arcing fault current. This is because the fundamental frequency component of the square-wave arc voltage, VA-RMS is in-phase with the IR drop in the system. For a given set of circumstances, the higher the X to R ratio, the more likely the fault will restrike following current zero, due to the higher transient recovery voltage. The factors on the ordinate of Figure 12 are consistent with those from analysis of arcing fault test data.
Figure 13 is another photo of a type CM-22 480-volt network protector that experienced an internal arcing fault in the unprotected zone. The damage to the bus bars on the rollout unit is extensive as well as the damage to the housing bus bars.

Figure 13:
Damage to CM-22 480-volt network protector from arcing
fault in the unprotected zone (photo courtesy PG&E) .
Effect of Intermittent Arcing on RMS value of Fault Current
Observation from test and actual arcing faults in 480-volt systems show that frequently the fault is not sustained, but intermittent in nature. Perhaps the reason for this is that during the arcing the magnetic forces cause conductors to move, and the arc to lengthen. When the arc goes out, the conductors may remake contact and establish an arc. Or with the arc extinguished, tracking may occur on carbonized insulation and the arc restrikes. Regardless, the effect of the intermittency is to reduce the rms value of the fault current, making it less likely that high-ampere fuses (network protector and service fuses) will blow, or at a minimum increase the blowing time. Figure 14 plots the ratio of the rms value of the current for an intermittent arcing fault to the rms value of the current for a sustained arcing fault, versus the period of time the fault is conducting (See figure 49 in secondary Grid Design Considerations). For example, from the curve with the intermittent arcing taking place 50% of the total time period, the rms value would be 70.7% of the rms value of the sustained arcing fault current. With the heating of a fuse element being proportional to the square of the rms value of the current, the heating would be 50% of that for a sustained arcing fault.
Effect of Fault Type on Fault Current
Frequently, only the current for a bolted three-phase fault is available for faults in 480-volt systems. This may be for a fault on the network paralleling bus, or a fault at the service entrance. Yet many faults start from phase to ground, propagate into a multi-phase faults, then blow one or two fuses, then revert back to a single line-to-ground (SLG) fault. Or because of the nature of arcing faults in low-voltage systems, the fault may alternate between phases, or alternate from different phases to ground.

Figure 14:
Ratio of the rms value of the intermittent arcing fault
current to the rms value of he sustained arcing fault current.
When a fault exists from just one phase-to-ground (neutral), as discussed in Currents for Bolted, Arcing, and Intermittent Faults, the current for the bolted SLG fault can be significantly less than that for a bolted three-phase fault. Figure 15 plots for bolted faults the ratio of the SLG fault current to the three-phase fault current versus the ratio of the zero-sequence to the positive-sequence impedance (Z0 to Z1 ratio) at the fault location. Although the ratio of Z0 to Z1 at the network transformer LV terminals may be 1 or slightly lower, at downstream points, this ratio could be 3 or even higher with phase isolated construction and certain bus configurations where the neutral return path is remote from the phase conductors. If the impedance ratio were 5.0, due to the remoteness of the ground return path, and use of reduced-size ground return conductors, the SLG fault current is only 43% of the three-phase fault current.

Figure 15:
Ratio of bolted single line-to-ground fault current to
the bolted three-phase fault current versus the sequence impedance ratio
at the fault point.
Minimum Value for Arcing Ground Fault Current
When performing arc flash evaluations, the maximum value for the arcing fault current may be needed. But when determining whether a fuse or phase overcurrent device operates for an intermittent arcing fault, the minimum value for the fault current is required.
From the preceding, the three main factors that make the rms value of the arcing single line-to-ground (SLG) fault current less than the rms value of the bolted three-phase fault current are:
-
Arc voltage, which opposes the system driving voltage.
-
Intermittent nature of the arcing fault
-
Relationship between the bolted SLG fault current and the bolted three-phase fault current, due to Z0 being larger than Z1 at the fault location.
Numerous references cite levels for the minimum value of arcing SLG fault current in solidly grounded low-voltage systems. For arcing ground faults in 480-volt systems, figures in the range of 20% to 40% of bolted three-phase fault current have appeared. (ANSI/IEEE 1983) indicates the minimum value of an arcing ground fault current is 38% of the bolted ground fault current in 480-volt systems. (Smith 1982) indicates the minimum arcing ground fault is about 40% of the bolted ground fault current. Thus, if expressed as a percentage of the bolted three-phase fault current, the arcing ground fault current can be much less than 38% to 40%.
Some references suggest that, if the arcing ground fault current is less than 38% of the bolted ground fault value, the arc will extinguish. When arcs are initiated between electrodes in air, as the electrode separation is increased, the arcing current must decrease because lengthening the arc increases the arc voltage. It may indeed be that when the arc is drawn to the length where the current is 38% when the voltage between electrodes is 277 volts rms, the arc will extinguish at a current zero. That is, following current zero, there is insufficient voltage across the de-ionizing arc space to cause a restrike. It is for this reason that some practitioners design 480-volt paralleling buses with wide spacings. This can be true when the arcing electrodes are separated in air. But if there are materials between the electrodes which can track, or a conducting object bridges the gap, the arc may re-ignite for cycles or more.
The point is that arcing ground fault currents can be much less than the current for the bolted three-phase fault. Phase overcurrent devices such as network protector fuses, fuses for service taps, and LV circuit breakers with high current ratings may not detect arcing ground faults in low-voltage systems, or detect them only after considerable damage has occurred. It is for this reason that in 1971, the National Electric Code (NEC) first required that ground fault protection on 480-volt service entrance equipment rated 1000 amperes or higher, with a maximum trip level of 1200 amperes. This requirement was put into effect because of numerous equipment burn-downs that resulted from arcing ground faults in 480-volt systems. In 1978, the code was expanded to specify a maximum clearing time of 1 second for ground currents above 3000 amperes. These requirements were still in effect in the 1996 NEC (Earley et al. 1996)
Damage from Arcing Faults
If an arcing fault is initiated between two bare bus bars, with the source connected to only one end of the two bars, the electromagnetic forces cause the arc to motor away from the source. Since the arc terminus are moving, the damage to the bus will be limited. A similar phenomenon occurs in overhead distribution lines operating at 15-, 25-, or 35 kV class levels, although the available fault current levels in the OH lines are not as high as in large 480-volt spot networks. If sources with equal short-circuit capacity are connected to the bus bars at both ends, the current into the arc from both sources is nearly equal, and movement of the arc terminus is less likely to occur. With the movement of the arc terminus limited, there will be more damage to the bus bars.
When an arc is initiated in enclosed electrical equipment such as network protectors, metal enclosed buses, cable in conduit, and metal enclosed switchgear, the arc may not be free to move. Further, its length is limited by the spacing between phases and the distances to grounded metal parts. Under these conditions the arcing fault is more likely to sustain, and there can be excessive burning of metals where the arc terminates, as shown in Figure 5 and 7.
(Stanback 1977) describes tests to determine the metal burn rates for arcing faults involving copper, aluminum, and steel electrodes. The major purpose of the tests was to obtain data so that phase instantaneous and ground relay trip settings in low-voltage systems could be selected that would limit the damage from arcing faults. Given in his paper are formulas for calculating the burn rate for steel, copper, or aluminum as a function of the rms value of the arcing fault current and time of the arcing, for situations where the arc can’t motor. Using these equations, it can be shown that considerable damage will result from arcing faults when high-ampere fuses, such as those in network protectors or fuses in service taps as in Figure 9, are required to clear the fault.
For example, for copper bus bars where the arc terminus is stationary, the metal burn rate is given by:
(4)
$$ \ \ \ Y = 0.723 * 10^{-6} * I_{ARC}^{1.5} \enspace cubic \enspace inches/second $$
Figure 16 plots eq (4) with the solid line, as well as shows the 95% confidence limits based on the test data.

Figure 16:
Burning rate for copper with +/- 95% confidence limits.
With a three-unit spot network having 1000-kVA 5% impedance 480-volt network transformers, the current for a bolted phase-to-phase fault on the paralleling bus would be 62,500 amperes ((1203/.05)*3*√3/2), assuming an infinite bus at the HV side of each network transformer. If the sustained arcing fault current were 80% of the bolted, or 50,000 amperes, the current in each network protector fuse would be 16,667 amperes. Figure 17 shows the time-current curves of fuses that could be used in the protector applied with the 1000 kVA 480-volt network transformer. The vertical black line at the 16.6 kA level indicates the protector fuse current for 50 kA in the fault path.
At 50,000 amperes, eq (4) shows that the burn rate for copper would be 8.08 cubic inches per second. From Figure 17, with the tin fuse (red colored curve) in the protector, the total clearing time would be about 3 seconds. At 3 seconds, the arcing would consume 24.24 cubic inches of bus bar per phase before the fuse clears. For a bus bar with ¼ x 6-inch cross section, this corresponds to a length of about 16 inches.
If the total arcing fault current were 30,000 amperes, or 10,000 amperes per protector the burn rate would be about 3.76 cubic inches per second. At 10 kA, the clearing time of the NPL fuse, green colored curve, the slowest of the fuses at the lower currents, is about 10 seconds. The arcing would consume 3.76 cubic inches of copper per second, or a total of 37.6 cubic inches.
The above calculations are approximate, but they illustrate the extensive damage that can occur before fuses operate to isolate the arcing faults in 480-volt systems. And if the fault is within the network protector in the unprotected zone, the arcing time can be minutes or longer, with extensive damage to the protector.

Figure 17:
Time-current curves for fuse in network protector on
1000 kVA 480-volt network transformer.
Protection Philosophies, Requirements for 480-Volt Spot Networks
With the preceding background, network planners and engineers must decide if enhanced protection systems are incorporated into the design of the 480-volt spot networks. Past experience with the designs utilized will be a major factor in the approach selected. If there have been no faults in the “unprotected zone”, and if all faults up to the main service disconnect device (main breaker or switch/fuse), if any at all, either blew fuses or cable limiters, without causing significant damage to the spot network system in the utility vault, or the service equipment up to the main breaker, justifying the added cost and complexity of an enhanced protection system may be difficult.
If there have been faults in the unprotected zone causing protector damage/meltdown and a network outage, or faults in the paralleling bus or service buses or cables up to the main breaker in the service, then an enhanced protection scheme may be warranted, especially if there was significant property damage. With the concern for arc flash protection when working on 480-volt network protectors, especially roll-out protectors which requires unbolting fuses and disconnect links, some users are installing vacuum switches or circuit breakers at the HV side of the network transformers to de-energize the transformer when working on the protector. If these devices are installed for worker safety, they can also be used as part of an enhanced protection system to de-energize network protectors which have an internal fault in the unprotected zone.
If an enhanced protection system is installed in the 480-volt spot network, the protection system should not degrade the reliability and security of the spot network. It should be reliable and sensitive, and able to detect all faults in the zone it is to protect. The enhanced protection system should be selective, and not false-trip network protectors or de-energize the spot network for faults outside of its zones of protection, or for faults downstream of the service entrance main breaker or switch/fuse. Final the protection system should be relatively simple, robust, and maintainable, because in some situations it will be installed in some very harsh environments.
Security from False Operation
Low-voltage spot network provide extremely reliable service to the customer. In most installations, faults never occur in the unprotected zone, or in the zone between the network protector terminals and the main breaker or switch/fuse at the service entrance(s). However, in those few cases where a fault has occurred, the damage can be extensive. This is a major factor that influences the decision at some utilities to install enhanced protection systems in 480-volt spot networks.
But if an enhanced protection system results in just one false tripping of all protectors in the spot network, the reliability of the system is degraded. Listed below are some factors that, if not properly accounted for, may cause false tripping with protection systems that employ ground fault relaying.
-
Fundamental frequency currents in the neutral path due to unbalanced phase-to-neutral loads.
-
Harmonic zero-sequence currents in the neutral path, which are predominately third harmonic and its odd multiples. One major source of these is 277-volt fluorescent lighting in commercial and office buildings.
-
Single phasing in the low-voltage system due to fuse blowing in just one or two phases.
-
Ground faults on the primary feeders. With delta grounded-wye connected network transformers and faults on the primary feeder, there is virtually no ground current on the secondary (LV) side from the fault. However, there can be current in the X0 bushing of the network transformer due to secondary loading and/or unequal phase impedances in the network transformers. But if a double phase-to-ground fault or three phase-to-ground fault occurs on a primary feeder, and a fuse blows or is blown in a protector on the faulted feeder, large neutral currents flow in the secondary system as discussed in Backfeed to Double Line-to-Ground Fault. See Figures 3 and 11 respectively for the three-phase and double line-to-ground fault with one blown fuse in the protector. The protection system should not trip the protectors and de-energize the spot network for this condition when the secondary neutral conductors are properly sized. Similarly, if the network transformers have the grounded-wye connections for the primary and secondary windings, ground faults on the primary feeder cause significant ground current in the secondary system, even in the absence of blown fuses in the network protectors. Depending on the location of the current transformers for the ground fault relay scheme, the ground relays may see these currents.
Some protection schemes for spot networks use heat sensors to detect arcing faults in the vicinity of the paralleling bus, either probe type or continuous element type sensors. There have been several reports of false operation of the continuous element type heat sensors, with there being disagreement at to the cause of the false operations. Possible explanations included degradation in the harsh environment in below grade vaults in northern climates were snow-melting salts are used, or degradation from long-term use of the device.
Sensitive and Reliable Detection of All Faults
The enhanced protection system for 480-volt spot networks should detect all arcing faults within its zone of protection. With ground fault relay schemes, the pickup of the ground time-overcurrent relay must be below the minimum arcing fault current. Ground fault relay schemes will detect faults from phase-to-neutral, phase-to-ground, or both depending on the location of the current transformers that supply the ground relays. However, they will not detect faults between phases, although this is not a major concern in most environments, such as metal-clad bus and switchgear, because faults that start phase-to-phase frequently involve ground in a matter of cycles.
In contrast, heat sensing elements, ultraviolet devices, and light sensors can detect both phase-to-phase, phase-to-neutral, and phase-to-ground arcing faults. However, since they are not sensing current or voltage in the system, they will only respond to arcing faults that are in the vicinity of where the devices are installed. In comparison, ground fault relay schemes detect ground fault current not only for faults in the utility vault, but for ground faults within the “supplied system” on the opposite side of the vault wall. Also, ground relay schemes respond to both bolted and arcing ground faults, whereas some detection schemes respond only to arcing faults.
With enhanced protection schemes, faults in the secondary system usually are cleared (de-energized) by tripping of all network protectors in the spot network, or by tripping of vacuum circuit breakers or switches on the HV side of the network transformers. A reliable source of control power must be available to accomplish these functions.
Selectivity and Coordination
Ground fault relay schemes in 480-volt spot networks will detect faults in both the utility system, and faults downstream of the customer’s main breaker at the service entrance. It is imperative that the ground fault relaying in the network vault is selectively coordinated with the ground fault relaying on the service entrance equipment, especially when multiple services are supplied from the spot network paralleling bus. The spot network should not be de-energized for faults downstream of the customers main breaker or switch/fuse. However, backup protection may be allowed should the main breaker or switch/fuse fail to operate.
Maintainability
Enhance protection systems for spot networks, like the network protector, require periodic inspection, maintenance, and testing. The enhanced protection system should allow for these procedures, preferably by the same personnel who perform these functions for the network protector and other equipment within the network vault.
Network Protector Tripping
Some protection schemes, whether using ground fault relaying, heat sensors, or other detection device, initiate tripping and lockout of the network protectors to isolate faults which are downstream from the protector network-side terminals. The shunt trip coil or trip device/mechanism of the protector, by industry standards, functions for voltages as low as 7.5% of rated. For arcing faults in the secondary for which the enhanced protection scheme is to operate, the voltage would not be expected to drop below this level.
When protectors in a spot network are tripped for a fault downstream of the protectors, the network relays, either electromechanical or microprocessor, will immediately call for a close, and the protector will close back into the fault. Any scheme that trips network protectors must use a lockout relay (IEEE device 86) to both trip and lock out the network protectors. Network protectors of recent manufacture have been provided with provisions for external trip and lockout, but this may not be found in older protectors. Further, a reliable source of control power must be available to operate the 86-device. Sources that have been used are a capacitor trip device supplied from the protected network, connected to either the paralleling bus or the secondary terminals of a network transformer.
-
120-volt circuit from a street network. Systems have been installed where two 120-volt street circuits are available, with automatic transfer scheme to select an alternate source if the preferred source is not available. Figure 18 shows an example of this.
-
Battery
-
Special design lockout relays that operate down to low voltages.

Figure 18:
Secondary selective scheme for supply to Fenwal heat
sensors (photo by author).
Protection Zones
When designing enhanced protection system for 480-volt spot networks, the following issues should be considered regardless of the type of devices installed to detect the arcing fault.
-
Zones to be protected
-
Devices to be tripped to clear faults in the different protection zones.
These issues will be discussed for a two-unit spot network, where the protectors are throat mounted on the network transformers, with the paralleling bus supplying a single service as shown in Figure 19. The paralleling bus can be in the same vault as the transformers/protectors, or it could be in a separate vault or compartment. Operation For Faults In Three-Feeder Network System of Figure 1 shows some different equipment arrangements for 480-volt spot networks.
For the network system of Figure 19, the fuses for the network protector on the left side are inside the protector main housing, but for the protector on the right side, the fuses are external to the main housing, and are of the current-limiting type. Installations have also been made with the Y or Z copper fuses mounted external to the protector as shown in Figure 20.
Protection Zone 1
In Figure 19, protection zone 1 extends from the network terminals of the network protector to a point downstream in the 480-volt system, the downstream point dependent upon what fault detection devices are installed. If heat sensors, ultraviolet detectors, light intensity detectors, or other devices that do not measure current or voltage are installed in just the network vault, or in the network vault and bus compartment, the protection zone includes only those areas under observation by the detection devices.

Figure 19:
Two-unit 480-volt spot network with a single service
entrance.

Figure 20:
Copper fuses mounted external to the 480-volt network
protector (photo by author).
In Figure 19, if ground fault relaying is installed, protection zone 1 is from the protector network terminals into and through the main breaker in the service switchgear. Furthermore, most ground fault relay schemes also detect faults in protection zone 2 defined later.
Faults in protection zone 1 can be cleared by tripping and lockout of the network protectors in the spot network. Circuit-interrupting devices are not required on the HV side of the network transformers to clear faults in protection zone 1. If operating experience indicates that all faults, if any, have occurred in protection zone 1, it could be difficult to justify placing vacuum interrupters on the HV side of the network transformers. But as indicated before, some operators want interrupters on the HV side so that the network transformer and network side of the open network protector can be de-energized for worker safety when removing and installing network protector disconnect links.
Not only do HV interrupters add cost, but adequate space may not be present for their installation in existing vaults. Protector tripping to clear faults in protection zone 1 has been selected by numerous operators of 480-volt spot networks.
Protection Zone 2
With reference to Figure 19, protection zone 2 is from the network-side terminals of the network protector back to the low-voltage terminals of the network transformer with the wye-connected secondary windings. This zone includes portions of what was defined as the “unprotected zone”. For this discussion, it is assumed that the network protector is mounted on the LV throat of the network transformer, the most common configuration, rather than being separately mounted.
To clear faults in protection zone 2 in 480-volt systems requires disconnecting the HV winding of the network transformer from the energized primary feeder, or de-energizing the entire primary feeder. Either approach removes the energy source from the HV winding of the network transformer. The transformer can be disconnected from the energized primary feeder with an interrupter installed on the HV side of the transformer, such as a vacuum breaker or switch, as shown in Figure 19. The primary feeder can be de-energized by transfer tripping of the HV feeder breaker at the substation, but this does not de-energize the primary winding of the network transformer with a fault in protection zone 2 until all other network protectors on the feeder open. The drawback of transfer tripping is that it creates a single contingency for the network systems. If this happens when another primary feeder is out-of-service, a double contingency condition is created, for which some systems are not designed.
Whether a fault in protection zone 2 is cleared from the network side, after de-energizing the HV winding of the network transformer, depends upon the location of the fault within zone 2, the location and type of fuses for the network protector, and whether other circuit-interrupting devices can be opened to de-energize the network-side terminals of the network protector with internal fault.
-
If the protection zone 2 fault is in the network protector between the network transformer LV bushings and current transformers on the roll-out or draw-out unit, the network relay may detect this fault and initiate opening of the protector main contacts. If successful, this clears the fault from the network side. Faults in this area, or anywhere within the protector enclosure, can also be detected with probe-type heat sensors or differential relaying. The explosive effects and ionized gases from the arcing fault, see picture in Figure 3, may involve current transformers or control wiring of the protector, preventing opening of the main contacts of the protector. Even if the main contacts open and interrupt the current from the network, the explosive effects and ionized gasses most likely may propagate the fault to the network side of the open protector prior to or after the main contacts open. It is not prudent to depend on clearing faults in this portion of zone 2 from the network by opening of the protector main contacts.
-
If the fault in protection zone 2 is between the current transformers for the network relay and the network protector fuses, the network relay does not see a reverse fault condition, and the relay would not make its trip contact, and the protector tripping circuit would not be energized. If heat sensors are installed in the protector, or a differential relaying scheme is installed around the network transformer and protector, they will detect the fault. However, tripping of the protector will not isolate a fault in this region from the energized network. But most likely the fuses mounted internally to the protector main housing, such as Y or Z copper fuses, low-loss type S fuses, or tin fuses will be involved in the fault, and even if they blow, the fault quite likely will not be isolated from the network paralleling bus.
Although the internal network protector fuses may melt, because of the explosive effects of the arcing within the protector enclosure, with the network transformer still energized, it is quite likely that the arcing fault would involve the top (network side) terminals of the protector. Electrically, this places a fault on the network paralleling bus. Further, the current for a bolted fault in this area may exceed the interrupting rating (IR) of the fuses installed internally to the protector, which is no higher than the IR of the protector breaker. Internal fuses in the protector, as in the protector on the left-side of Figure 19, should not be relied upon to clear an internal protector fault from the spot network paralleling bus. Most likely the fuses are involved in the inferno. Remember, the main purpose of the protector fuses is to backup the network protector for faults on the primary feeder should the protector fail to open. For faults on the primary feeder, the backfeed current is limited by the impedance of the network transformer and never exceeds the interrupting rating (IR) of the network protector fuses.
Some utilities have replaced internal fuses in the network protector main enclosure with solid links, and installed external current-limiting fuses on the protector terminals, as in the protector on the right-side of Figure 19. Figure 4 also shows such an installation with a type CM-22 network protector. Also, network protectors are available with current-limiting (CL) fuses in a separate enclosure, external to the protector main enclosure, as shown in Figures 33, 35, 38, and 43. With the CL fuses having an interrupting rating as high as 150 kA or 200 kA, and not being involved in the inferno that can exist for an internal fault in the 480-volt network protector , protection zone 2, their application increases the chance that the fault within the network protector will be successfully isolated from the network paralleling bus. However, extensive damage could still occur to the network protector before these fuses melt for internal faults. In the time required for the fuse to melt and clear the fault current, the internal fault could propagate outside of the protector main enclosure to cables or even to the fuses attached to the protector network-side terminals,
Ideally, faults in protection zone 2 between the LV terminals of the network transformer and the protector fuses would be cleared by de-energizing of the network transformer and blowing of the fuses and/or tripping of the protector with the internal fault. This allows maintaining service to the network. However, with internal fuses, it is not prudent to assume that such a fault would not propagate to the network side of the main contacts, or to the network terminals of the protector. Further, the protector fuses, even when located external to the protector may not isolate the fault from the network side, regardless of where the fault is located in protection zone 2. Normal practice is to not rely on clearing a fault within a circuit breaker enclosure or compartment by tripping of the faulted circuit breaker, or blowing of fuses within the same enclosure as the circuit breaker. To clear faults withing protection zone 2 from the network side, following or concurrent with de-energizing the network transformer from the primary side, the following can be considered:
-
Trip all network protectors in the 480-volt spot network. This de-energizes the network terminals of the faulted protector. Clearing from the network in this fashion results in an outage to the network, but damage should be limited if the transformer side of the protector is rapidly de-energized. Network protector interrupting rating will not be exceeded.
-
With an interrupter installed on the HV side of each network transformer, trip all HV interrupters for the spot network. This also results in an outage to the network, but damage will be limited, and a major protector melt-down, such as shown in Figures 5, 7, and 13 will be avoided.
-
Trip all network protectors in the 480-volt spot network, and trip only the interrupter installed on the HV side of the network transformer having the faulted protector.
With enhanced protection schemes, faults in protection zone 2 (from LV terminals of the network transformer to protector network side terminals) can be detected with heat sensors installed in the network protector, differential relay schemes around the transformer and protector, or ground-fault relay schemes. Figure 21 shows a protector with heat sensor mounted in door, and external current limiting fuses.

Figure 21:
Probe-type heat sensor mounted in protector door at the
top. Sensor at bottom of door not shown in picture (photo by author).
With heat sensors inside the protector, or differential relaying around the transformer and protector, the protector with the internal fault can be identified, and appropriate circuit interrupters tripped to isolate the faulted protector. But as indicated before, de-energizing the network side of the faulted protector requires de-energizing the paralleling bus and creating an outage to the spot network.
In comparison, with many ground fault relaying schemes, it is not possible to determine which protector has the internal fault, or differentiate between faults in protection zone 1 (downstream of protector network-side terminals), and faults in protection zone 2.
Protection Zone 3
With reference to Figure 19, protection zone 3 extends from the HV terminals of the cable compartment on the network transformer through the transformer to the LV bushings of the transformer. It can be broken into three sub-protection zones. Sub-protection zone 3H is from the HV terminals of the cable compartment to the point where the HV leads enter the HV coils. It includes the HV terminal compartment, the HV switch compartment, and paths internal to the transformer main tank including HV leads and the HV tap changer. Sub-protection zone 3W includes the primary windings, the high-low space between the primary and secondary windings, and the secondary windings. Sub-protection zone 3L is from the point where the LV leads exit the LV windings to the LV terminals of the network transformer.
The currents for any type of fault in sub-protection zones 3H and 3L can be found, because practically they are the same as for faults at the HV and LV terminals of the network transformer, respectively. Determination of the currents in the primary phases and secondary phases external to the transformer for faults in protection zone 3W is not easily done, due to uncertainties in the impedance network of the transformer for faults internal to the windings. Upper bounds on the transformer primary line currents and secondary line currents are those for faults at the HV and LV terminals of the transformer respectively.
Sub-Protection Zone 3H
Figure 22 shows with the dashed blue-colored lines sub protection zone 3H.

Figure 22:
Sub-protection zone 3H.
The device that clears faults in sub-protection zone 3H from the primary side depends on what equipment is installed. In the absence of an enhanced protection scheme, faults in zone 3H should be seen by the instantaneous-current relays, phase and ground, or both, for the primary feeder breaker at the substation. Further, all other network protectors on the feeder must open to clear, from the primary side, faults in sub-protection zone 3H. If electronic current-limiting fuses are installed in the HV feeder at the substation, as discussed in Limiting Energy Input From Substation to Faulted Equipment, the energy into the fault in sub-protection zone 3H will be reduced significantly, lowering the chance of a rupture of the enclosure for the cable terminal compartment, switch compartment, or main tank of the transformer.
If a vacuum breaker or switch is applied on the primary side of the network transformer as part of an enhanced protection system, as illustrated in Figure 22, faults in sub-protection zone 3H can be cleared from the energized primary feeder by opening of the vacuum breaker. With a dedicated HV interrupter, it is not necessary to de-energize the entire primary feeder and all of its network transformers to clear a fault in sub-protection zone 3H from the primary feeder. This is predicated on the vacuum interrupter having an adequate interrupting rating. When a network is under severe stress from multiple outages, this may be of great benefit. Figure 23 show vacuum interrupters installed on the primary side in a 480-volt spot network.

Figure 23:
Vacuum interrupters on the primary side in a 480-volt
spot network (photo by author).
With vacuum interrupters installed on the primary side, and if they are equipped with phase and ground relays that will trip the interrupter, for faults downstream of the interrupter the relays for the interrupter should be selectively coordinated with the phase and ground relays for the feeder breaker at the substation. Selective coordination usually can be achieved with the phase and ground time overcurrent relays. But this usually is not possible with instantaneous current relays. With a dedicated HV interrupter at the HV terminals, it is not necessary to de-energize the primary feeder to de-energize the faulted transformer to clear a fault in sub-protection zone 3H.
When the vacuum interrupter on the HV side is equipped with phase time over current relays, during backfeed to a multi-phase fault on the primary feeder between the feeder circuit breaker at the substation and the HV interrupter, with the feeder breaker at the substation being open, the phase relays for the HV interrupter must not trip the vacuum breaker, just as the network protector fuses should not blow. The multi-phase fault on the feeder is cleared from the secondary network by tripping of the network protector.
Faults in sub-protection zone 3H will, in most cases, be detected by the network relay in the protector on the secondary side, and the protector will trip, thereby preventing an outage to the network. And the fault in sub-protection zone 3H is de-energized from the primary by either tripping or the feeder breaker at the substation, or the vacuum breaker installed on the HV side. Faults in sub-protection zone 3H, 3L, and 3W can be detected with sudden pressure relays in the network transformer, and with current differential relay schemes.
Sub-Protection Zone 3L
Figure 23 outlines with the dashed blue-colored box sub-protection zone 3L.

Figure 23b:
Sub-protection zone 3L.
Faults in sub-protection zone 3L, can be cleared from the primary side by opening of either the primary feeder breaker at the substation or opening of an interrupter installed at the HV terminals of the network transformer. Many faults in sub-protection zone 3L will not be seen by the phase relays for the feeder breaker at the substation, especially for the smaller kVA network transformers. Faults in sub-protection zone 3L might be cleared from the LV network by tripping of the network protector. However, there are several caveats associated with this.
The fault can be cleared from the secondary side by opening of the network protector, providing the explosive effects of the fault within the transformer do not damage the throat-mounted network protector, and providing the backfeed current does not exceed the interrupting rating of the network protector. The network relay most likely will detect faults in sub-protection zone 3L, and most likely there will be sufficient voltage, at least 7.5% of nominal voltage, to trip the network protector when the network relay makes its trip contact. The magnitude of the maximum backfeed current for faults in sub-protection zone 3L depends on the number of transformers in the spot network. For bolted faults at the LV terminals of the network transformer, or in the LV leads inside the network transformer, the backfeed current can exceed the interrupting rating of not only the network protector, but also the interrupting rating of non-current-limiting protector fuses.
Clearing faults in sub-protection zone 3L from the network can be accomplished without exceeding equipment interrupting rating by either (1) tripping all network protectors in the spot network, or (2) tripping the HV interrupter on each network transformer in the spot network if so equipped. In either approach, there is an outage to the network.
Faults in sub-protection zone 3L generally will not be seen by the relays for the feeder breaker at the substation. With delta grounded-wye connections for the network transformer, the primary feeder ground instantaneous and ground time overcurrent relays experience virtually no current for faults in sub-protection zone 3L. And the phase time-overcurrent relay pickups usually are above the maximum current for fault in this sub-zone. However, if a HV interrupter is applied at the HV terminals of the network transformer having phase time overcurrent relays, the phase relays may time out for faults in protection zone 3L. As indicated before, the interrupter needs an interrupting rating based upon the maximum through fault current it will see for faults in sub-protection zones 3L, zone 2, and zone 1.
Faults in sub-protection zone 3L can also be detected with a transformer sudden pressure relay, or current-differential relays installed around the network transformer and its network protector. However, operation of these devices doesn’t delineate between faults in sub-protection zones 3H, 3L, and 3W.
Sub-Protection Zone 3W
Figure 24 shows sub-protection zone 3W. The primary line currents and secondary line currents for faults in sub-protection zone 3W are dependent upon the location of the fault within the transformer windings and the type of fault. The upper limits on the primary line currents are the currents for faults at the HV terminals of the network transformer. The upper limits on the secondary line currents, those in the network protector, are the currents for faults at the LV terminals of the network transformer.
The issues discussed for faults in sub-protection zones 3H and 3L also apply to faults within the transformer windings and faults in the high-low space. Depending on fault location, the current in the backfeeding protector could exceed its interrupting rating, and the current in a HV interrupter at the HV terminals could exceed it interrupting rating. Depending on fault location and fault type, the fault may not be seen by the phase and ground relays for the feeder breaker at the substation, but the fault could be seen by phase and ground time overcurrent relays applied with the HV interrupter, as their pickups and time delay will be lower than those of the relays for the feeder breaker at the substation

Figure 24:
Sub-protection zone 3W
Faults in the LV windings of the network transformer are rare, especially in transformers that use sheet rather than strap construction for the LV windings. Faults in sub-protection zone 3L shown in Figure 23 are also rare.
Faults in sub-protection zone 3W may be detected by supplementary protection devices, such as a sudden pressure relay for the transformer, or with a differential relay scheme around the transformer and protector. Differential relay schemes with conventional CT’s can be costly and difficult to realize in spot networks. Recently, differential relay schemes using the Rogowski coils on both the primary and secondary side of the transformer/protector have been developed. These coils do not have an iron core, but provide a voltage output that is proportional to the derivative of the circuit current. The output is applied to an integrator and suitable relays to perform many different relay functions.
HV Interrupter Application Considerations
In many applications the main reason for installing a vacuum breaker or interrupter on the HV side of the network transformer is to de-energize the network transformer for faults in protection zone 2 (faults inside the network protector between the LV bushings of the network transformer and the protector network-side terminals). Such faults are detected with heat sensors installed in the network protector, differential relaying, or ground fault relaying on the secondary side. Figure 25 shows a vacuum interrupter on the HV side of a network transformer with the primary rated 23 kV

Figure 25:
Vacuum interrupter installed on the 23 kV side of a
network transformer for a 480-volt spot network (photo by author).
Vacuum breakers at the HV terminals of the network transformer can be equipped with phase and ground time overcurrent relays, and instantaneous current relays. The phase and ground time overcurrent relays can have a lower pickup and time delay setting than the relays for the feeder breaker at the substation. The lower pickup and time delay allow more sensitive detection of faults in either the delta connected HV or LV windings of the transformer (sub-protection zone 3W), and in sub protection zone 3L (see Figure 23) than possible with relays for the feeder breaker at the substation. The phase relays for the feeder breaker at the substation are set to carry the load current of all network transformers on the primary feeder during single or double contingency conditions, and not that of just one network transformer. When relaying is installed for the HV interrupter, the following issues should be considered.
-
Phase time overcurrent relays for the breaker on the HV side of the network transformer should be selectively coordinated with the phase-time overcurrent relays for the feeder breaker at the substation. For faults in the secondary system, the phase relays for each HV breaker should be selective with any phase and ground relays on the secondary that may be part of an enhanced protection system. They should also be selective with the network protector fuses.
-
For a fault on the primary feeder on the substation side of the HV interrupter, the phase and time overcurrent relays for the HV interrupter must be no faster than the tripping of the backfeeding network protector through the network protector relay. If phase instantaneous relays are applied with the HV interrupter, they must have a pickup which is above the maximum backfeed current for a fault on the primary feeder, where the maximum usually occurs for the three-phase fault. Otherwise, faults on the primary feeder would trip the HV vacuum interrupter. Faults on the primary feeder should be cleared from the network by tripping of the backfeeding network protector, and not a HV interrupter on the HV side of the network transformer.
-
The HV interrupter must have adequate interrupting rating for faults it is to clear. If it is to clear faults in sub-protection zone 3H as identified in Figure 22, its interrupting rating must be greater than the available three-phase fault current for a fault on the feeder. For faults in sub-protection zone 3L as identified in Figure 23, in protection zone 2, or in protection zone 1 (from network-side terminals of the network protector to the customers service entrance), the current will not exceed 20 times and 14.3 times the full-load current of the network transformer, respectively, for 5% and 7% impedance transformers. But for faults in sub-protection zone 3H, the fault current is that available from the primary system. Currents for faults in sub-protection zone 3H and portions of sub-protection zone 3W could exceed the interrupting rating of interrupters that might be installed on the HV side. For these situations, relaying should be incorporated that blocks opening of the HV interrupter for currents that are above its interrupting rating. These faults are then cleared by the feeder breaker at the substation.
-
The relaying applied with the HV interrupter should not necessitate changes in settings for the feeder breaker relays at the station that would compromise the protection for faults on the primary feeder, and for faults in other network transformers on the feeder. If the HV interrupter applied with the network transformer has phase and ground time-overcurrent relays, it usually is possible to selectively coordinate them with the phase and ground time overcurrent relays for the feeder breaker at the substation. For faults in the HV winding of the network transformer or within the low-voltage windings that do not draw high current, sub protection zone 3W, the time overcurrent relays for the HV interrupter would time out before those for the feeder breaker at the substation and provide more sensitive protection. But if the HV interrupter has instantaneous current relays, either phase, ground, or both, and a fault occurs in sub-protection zone 3H, the current likely would be of a level that picks-up the instantaneous current relays for both the HV interrupter and the feeder breaker at the substation. Coordination would be lost as instantaneous current relays usually can’t be coordinated. Phase instantaneous current relays for the feeder breaker at the substation must not operate for faults in protection zone 2 (from LV terminals of the network transformer to the network-side terminals of the network protector).
To achieve coordination with instantaneous current relays on the HV interrupter, one approach is to remove the instantaneous current relays for the feeder breaker at the substation. This is not recommended, because it degrades the protection for faults on the primary feeder cables, splices, and for faults in sub-protection zone 3H of other network transformers that do not have HV interrupters. It is preferable to maintain the instantaneous tripping of the feeder breaker at the substation, and accept the miss coordination between the instantaneous phase relays for the feeder breaker at the substation and the HV interrupter, again providing the interrupting rating of the HV interrupter is not exceeded.
In an enhanced protection system, where the network transformer is equipped with a sudden pressure relay (SPR) the protection system must be configured to trip the HV interrupter and the network protector for faults in the transformer which are detected with the SPR. The HV interrupter opening can be blocked if the current is above its interrupting rating. However, the operation of the SPR does not delineate the location of the fault within the transformer. If the fault is near the LV bushings in sub-protection zone 3L (Figure 23), the backfeed current could exceed the network protector interrupting rating. This must be considered when deciding what devices are tripped when the transformer SPR operates. If a SPR or differential relay detects a fault in the network transformer (zone 3), tripping of all network protectors in the spot network, other than the protector associated with the faulted transformer, ensures that the protector interrupting rating will not be exceeded. A fault within the transformer also would be detected by the network protector relay in the backfeeding protector, which would energize the trip mechanism of the backfeeding protector. It is difficult to determine if the backfeeding protector, tripping through its network relay, would open before a SPR or differential relay scheme would trip all other protectors in the spot network. Regardless, opening of all other protectors in the spot network removes voltage from the network side of the transformer whose sudden pressure relay operated. It also causes an outage to the network.
Arcing Fault Detection Devices
Various schemes and devices have been utilized for detecting arcing faults in 480-volt spot networks. This section briefly describes the schemes and some advantages and limitations of each.
Enclosure Grounding Arrangements
When the paralleling bus for the network protectors and/or services from the network is made from metal-enclosed bus duct, either high-impedance or low impedance, any fault within the bus duct involves the metal housing. By insulating this housing from ground, and grounding the housing with an insulated conductor that passes through a current transformer, as depicted at the bottom of Figure 26, a reliable and secure ground fault detection scheme results for faults in these portions of the system.
In the top half of Figure 26, the bus duct has a neutral bus and buses for the three phases. There is also a separate grounding bus in the network vault. In some systems, the neutral conductors to the service, and the neutral conductors from the network transformer X0 bushings, run to the same bus that is grounded, with there being no delineations between neutral and ground in the network vault.
With the enclosure grounding scheme of Figure 26:
-
Load unbalances and harmonics do not cause false tipping of the protectors or HV interrupter if installed. Zero-sequence currents from load unbalances and harmonics return to the X0 bushings of the network transformers through the neutral conductors and the ground return path.
-
The pickup and time settings for the time overcurrent relay can be very low, because there is no current in the connection being measured, other than during a ground fault to the enclosure housing. Sensitive ground fault detection is possible.
-
The material insulating the metal enclosure of the bus duct from the mechanical supports must be suitable for the application. If the connections from the paralleling bus to the service entrance switchgear is with bus duct rather than insulated cable, the bus duct enclosure must be insulated from the metal enclosure of the service entrance switchgear.
-
The scheme will not false trip for faults in the service entrance switchgear and downstream
-
The scheme will not detect faults in the network protector enclosure.
Figure 27 has two pictures showing this scheme in a three-unit 480-volt spot network. Insulated cables connecting the network protector terminals to the paralleling bus are visible in the top half. Metal enclosed bus duct is used for both the “paralleling bus” and the “service bus”, seen in the top half of the figure. The black material between the horizontal supports for the bus duct and bus-duct metal enclosure is the insulation that electrically isolates the bus duct enclosure from the hangers and horizontal supports. Under un-faulted conditions, there would be virtually no voltage across this insulation. During a ground fault to the bus duct enclosure, several volts or so could appear. The picture in the bottom half of Figure 27 shows the bus-duct enclosure insulated grounding conductor and the CT that supplies the ground detection time-overcurrent relay.
Heat Sensors
Heat sensors are widely used as arcing fault detection devices in 480-volt spot networks. The temperature of the arc in an arcing fault at its core is close to 20,000oC, with the average temperature of the arc being around 5,000oC. The two main types applied are the probe type, as shown in Figures 28 and 29, and the continuous element types as shown in Figure 30.

Figure 26:
Bus duct enclosure grounding scheme for detecting
ground faults.

Figure 27:
Enclosure grounding scheme for paralleling and service
bus (photo by author).


Figure 28:
Probe type heat sensor with normally open contacts
(photo by author, sketch from Fenwal).
Figure 10 shows a probe-type heat sensor installed in a network vault that experienced an arcing fault. These are sometimes called “Fenwals” because they are made by Fenwal Controls. Figure 29 shows a probe-type heat sensor mounted above a bare paralleling bus in a 480-volt spot network.

Figure 29:
Probe type heat sensor mounted above a paralleling bus
in 480-volt spot network. (photo by author).
Probe-type heat sensors have been installed to detect arcing faults in the vicinity of bare buses, metal enclosed bus duct, and cables. The probe types have also been located in the network protector housing (protection zone 2) for detecting arcing faults. When the heat sensors are installed within the network protector housing, the heat-sensor-rated temperature must be high enough so that it does not operate from the heat generated when the protector opens at its rated interrupting current. Furthermore, if the protector has internal fuses, the sensor temperature rating and locations must be such that it will not operate when the network protector fuses blow for faults on the primary feeder when the protector fails to open. These probe-type sensors have been mounted in the side-walls of the protector and in the protector doors.
The bottom half of Figure 28 shows the construction of the Fenwal probe-type heat sensor. It has an outer stainless-steel shell. Differential expansion of the outer shell and the contact struts causes the normally open contacts to close. With normally open contacts, the sensor’s contacts at different locations in the protection zone can be wired in parallel. Probe-type heat sensors are also available with normally closed contacts. With this configuration, the sensor contacts at different locations throughout the protection zone can be wired in series. The devices are available in operating ranges of 140oF up to 725oF.
Operation of the probe-type heat sensors does not require a control unit or source of power. However, if their operation initiates tripping of a lockout relay (device 86), then there must be a reliable power source for operation of the lockout relay.

The diagram below shows the sensing element with standard connections supplied with them.

Figure 30:
Continuous element heat sensors (photo by author,
drawing by Fenwal)
The Fenwal continuous element heat sensors, as in Figure 30, were originally developed for application in jet aircraft, both commercial and military, for detecting fires in the fuselage, wings, engine nacelles, and at other locations. They have been adapted for various other industrial applications. The suitability of the continuous element heat sensor for application in spot network systems was first tested by the Dallas Power and Light Company in the early mid 1960s (Griffin et. Al. 1966).
The top half of Figure 30 shows the Fenwal continuous element heat sensor mounted in the vicinity of the bare copper bus in a 480-volt spot network. Also seen in this picture are silver-sand fuses in the connections to the service bus, and metering current transformers.
The bottom half of Figure 30 shows the construction of the Fenwal continuous element sensor. The sensing element is a slender Inconel tube packed with a thermally sensitive eutectic salt compound and a nickel wire center conductor. Lengths of these elements are connected in series and to a control unit. The elements may be of equal length, and of the same or different temperature settings. The control unit, operating directly from a reliable power source, impresses a small voltage on the sensing elements. When an overheating condition occurs at any point along the entire element length, the resistance of the inorganic eutectic salt compound within the element drops sharply, causing current to flow between the outer shell and the central conductor. This current is sensed by the control unit, which produces a signal to actuate the output relay. This would typically energize a lockout relay (86 device) to either trip network protectors or vacuum circuit breakers on the HV side of the network transformers. A reliable source of power is required for the control unit, just as for the lockout relay.

Figure 31:
Control unit for continuous element heat sensor mounted
on vault wall (photo by author).
The Protectorwire Company also manufacturers linear heat detectors that have been installed in 480-volt spot network protection schemes. The sensing element consists of a twisted pair of two steel wires with a heat-sensitive polymer coating on each wire, as shown in Figure 32, with the assembly in a mylar wrap and a protective outer jacket. The sensing element is monitored, and when the temperature at any point along the element exceeds a level, the control unit detects this. A reliable source of power is needed for the control unit, just as with the Fenwal continuous element heat sensor.
UV Detectors and Light Detectors
Ultraviolet detection devices and light-detecting devices have been investigated and applied on a trial basis for arcing fault detection in 480-volt spot networks (Roop and Vidonic 1983, Batty et. al 1994). However, they have not found wide acceptance in 480-volt spot networks. The heat sensor devices as described above, and the ground fault relaying schemes as describe in Ground Fault Relaying have found much wider acceptance in spot network applications.
Harmonic Voltage Detectors
The arc voltage at the location of an arcing fault in a 480-volt spot network is not sinusoidal. If the arc is stable, the arc voltage wave form is approximately a square wave, and the arc behaves like a square-wave voltage source inserted into the circuit at the fault point. The square wave voltage magnitude is proportional to the arc length plus a constant, the anode-cathode drop irrespective of the current level. Waveforms from arcing tests show that high-frequency components are also on top of the underlying square wave voltage. Some testing in 480-volt systems has shown that harmonic voltage components above 2 kHz are negligible. Thus, within the electric system with and arcing fault, there are primarily two voltage sources impressed on the electrical network, as illustrated in the impedance diagram in Figure 33 for a four-unit spot network.

Figure 32:
Protectorwire linear heat detection element.
In Figure 33, one voltage source is on the primary side of the network transformers at the substation. This is the fundamental frequency voltage of the system. The other voltage source is at the fault point on the secondary, and is the square-wave arc voltage. For a square-wave arc voltage having magnitude of VP as shown in Figure 33, the arc voltage can be represented with a fundamental frequency component, plus voltage sources at the odd harmonics in accordance with the following:
(5)
$$ \ \ \ V_{FUN} = \enspace rms \enspace value \enspace of \enspace fundamental \enspace frequency \enspace component = \frac{2\sqrt{2}}{\pi} V_{P} $$
(6)
$$ \ \ \ V_{h} = \enspace rms \enspace value \enspace of \enspace hth \enspace harmonic \enspace of \enspace arc \enspace voltage = \frac{V_{FUN}}{h}$$
The response of the circuit to the application of the fundamental frequency component of the source voltage, the fundamental frequency component of the arc voltage, and each harmonic component of the arc voltage can be found with the principle of superposition. As shown in Figure 33, the voltage at any point in the electrical network at each harmonic is determined by setting the fundamental frequency source voltages and all harmonics to zero, other than the harmonic of interest, and determining the harmonic at points of interest throughout the network. Then the total harmonic voltage at any point in the system is obtained by combining the individual components. When finding the harmonic voltages, remember that the impedance of each element in the system changes with frequency.

Figure 33:
Spot network with arcing fault in the low-voltage
portion.
For each harmonic in the arc voltage, the harmonic voltage at the fault point is maximum, and generally decreases in magnitude going away from the fault point. At the substation bus on the HV side, the harmonic voltage at each frequency due to the arcing fault practically is zero. Installing a harmonic voltage detector with appropriate algorithms on the network bus as in Figure 33, or at some other point in the LV system, would allow an arcing fault in the LV system to be detected, providing the harmonics in the voltage at the monitoring point are substantially above the harmonics in the voltage during unfaulted conditions. With microprocessors and appropriate algorithms, a harmonic voltage detection device is feasible.
A harmonic voltage detection device would have to measure both phase-to-phase and phase-to-ground voltages. It would have to consider that arcing phase-to-phase faults affect both phase-to-phase voltage harmonics, and phase-to-ground voltage harmonics. Similarly, the detection device may have to consider that arcing phase-to-ground faults affect the harmonics in the phase-to-phase voltages at possible locations for the detection device(s). An advantage of this detection scheme is that it does not require installing large current transformers for the high-capacity conductors of the secondary system. Only voltage taps need to be made to the network paralleling bus or cables at the monitoring location.
Although the presence of excessive voltage harmonics at the monitoring point is a good indication of an arcing fault, it would be difficult to decipher, from the harmonics measured at just one point, if the fault is in the utility portion of the system or the customer’s system. Monitoring at each service entrance and in the network vault may provide information, with appropriate algorithms, that will tell if the fault is ahead of the service entrance breaker(s). If the customer has ground fault relaying on his service entrance breaker, and the harmonic voltage is monitored in just one location in the secondary, it would be challenging to coordinate the tripping of the network protectors or HV interrupters through harmonic voltage detector with the ground overcurrent relaying for the service entrance breaker.
Although harmonic voltage detection devices show promise for arcing fault protection systems, they have not been implemented in actual 480-volt spot networks. Perhaps this is because simpler and lower-cost device detection schemes, using heat sensors, and ground fault relays are available that have performed satisfactorily in numerous installations.
It is worthy to note that the presence of harmonics in voltages in transmission systems have been used to control reclosing of transmission line circuit breakers. If a circuit breaker trips and there were no harmonics in the voltages prior to tripping, it is quite likely that the fault on the line is permanent, and reclosing would not restore the line to service. But if there are appreciable harmonics in the voltage prior to breaker tripping, most likely the fault is arcing, and reclosing of the circuit breaker will be successful, as the arc will extinguish when the transmission line breakers are open.
Ground Fault Relaying
The discussion on ground fault relaying schemes is for configurations where the paralleling bus or paralleling point for the spot network is not in the service switchgear, but is in the vault with the network transformers/protectors, or else in a separate vault or compartment. There are services from the paralleling bus to the service entrance switchgear located outside of the vault with the network equipment, as in Figure 1 or 19. Per the National Electric Code (NEC), the neutral of each network transformer wye-connected LV windings, X0 bushing, must be grounded, and the neutral bus must be grounded on the incoming side of the main breaker at the service entrance switchgear within the building.
Ground fault relaying schemes are installed in 480-volt spot networks to detect faults in the utility portion of the system, and in the customers system up to the main breaker, or switch/fuse in the service entrance switchgear. The main device in the service entrance equipment most likely is equipped with ground fault relaying. The ground fault relaying scheme for the spot network frequently reaches beyond the main breaker or switch in the service equipment, so it must be selectively coordinated with the main breaker ground fault relaying. However, prior to 1971, the NEC did not require ground fault relaying at the service entrance. If not present, any ground fault relaying for the spot network, if coordinated, must be selective with the phase-tripping devices at the service entrance. If ground fault relaying for the spot network must coordinate with the phase tripping devices at the service entrance, sensitive ground fault protection is not possible in many situations.
In 1971, the NEC was changed to require ground fault relaying on 480-volt services rated 1000 amperes or higher, with a maximum trip setting of 1200 amperes. The 1978 code was amended to require that, at 3000 amperes, the tripping time is no longer than 1 second. With these benchmarks, and a knowledge of the time-current characteristics of the ground fault relaying in the customer’s system, it is possible to select pickup settings, time delay settings, and tripping characteristics for the ground fault relaying for the utility spot network that will coordinate selectively with downstream devices.
Ground fault relaying in the customers system is intended to detect faults to ground. As shown in Figure 34, the circuits in the customer’s system supplied from the service entrance equipment are five-wire circuits. The circuits consist of three phase conductors, a neutral conductor (grounded circuit conductor), and the equipment grounding conductor. If all load on a circuit is connected between phases (no phase-to-neutral connected load), the circuit would consist of three phase conductors and the equipment grounding conductor (a four-wire circuit).
Per the NEC, in five wire circuits as shown in Figure 34, the neutral conductor and the equipment grounding conductor are in effect connected together at the service entrance on the incoming side of the main breaker by the main bonding jumper (MBJ) as in Figure 34. However, the neutral conductor of the circuit is not connected to the circuit equipment grounding conductor at any points downstream from the service entrance. Such connections are in violation of the NEC. The purpose of the equipment grounding conductor, which may be made from bus, conduit, insulated or bare conductor, or any means approved by the code, is to bond equipment frames together to keep them at the same potential during un-faulted conditions. This purpose would be defeated if load were connected to the equipment grounding conductor, or the neutral were bonded to the equipment grounding conductor downstream from the service entrance.

Figure 34:
Ground fault relaying in a 480-volt system supplied
from network transformers with the X0 bushing welded to the network
transformer tank.
The equipment grounding conductor of each circuit is also intended to carry the ground fault current until circuit protective devices open. The minimum size required for the equipment grounding conductor is defined in the appropriate electrical codes for the building wiring system.
Figure 34 also shows a representative ground fault relay scheme for the main breaker (MB) and feeder breaker (FB) at the service entrance switchgear. Zero-sequence CTs and ground fault relays are applied with the main breaker and feeder circuit breakers. Passing through the window of the zero-sequence CT’s are the three phase conductors and the neutral conductor. With perfect zero-sequence CTs or zero-sequence sensors, the net output of the current of the CT is zero under un-faulted conditions, even with unbalanced phase-to-neutral loads and zero-sequence harmonics in the phase-to-neutral loads. The same result can be achieved by having separate CTs or sensors of equal ratio on each phase conductor and the neutral conductor, with the residual connection used for the four CT secondary windings. Regardless, when a phase-to-ground fault occurs, the output of the zero-sequence CT or the residual from the phase and neutral CTs is proportional to the ground fault current. With this arrangement, the ground fault relays for the main and feeder breakers see no zero-sequence current from load unbalances, but do experience zero-sequence current from ground faults.
These schemes, as in Figure 34, detect phase-to-ground faults, either arcing or bolted, but they do not detect phase-to-neutral faults. When there are no connections between the neutral conductor and equipment grounding conductor downstream from the service entrance, which is a code requirement, current is not supplied to the ground fault relays (GFR) for the feeder breaker (FB) or main breaker (MB) in the service entrance switchgear under un-faulted conditions, assuming perfect CTs. False tripping should not be a problem. Further, the ground fault relays or tripping devices for the main and feeder breakers within the customer’s system can be set to coordinated selectively, using a variety of schemes.
Although there is a clear distinction between the neutral conductor and equipment grounding conductor at the service entrance and points downstream in Figure 34, this is not the case when the network transformer has an X0 bushing that is welded to the transformer tank, as shown in Figure 35, the standard arrangement if not otherwise specified by the user. Note that in this application the neutral connected to the X0 bushing is of reduced size. See Backfeed to Double Line-to-Ground Fault and Secondary Neutral Conductor Path Overheating for problems that may occur with reduced size neutral connections to the X0 bushing. At the service entrance in Figure 34, the neutral bus is connected to the equipment grounding bus with the main bonding jumper (MBJ in Figure 34). The equipment grounding bus is connected to an approved grounding electrode, which may include building steel, rebar in the building foundation, metallic water pipe, or other approved grounding electrodes. In addition, the switchgear metallic enclosure is bonded to the equipment grounding bus. The enclosure for the service conductors from the network vault, if metallic conduit, metal-enclosed bus duct, or cable tray would be bonded to the equipment grounding bus in the service switchgear. They also should be connected to the ground structure in the utility vault so that a continuous metallic path exists to the X0 bushings of the network transformers.

Figure 35:
Network transformer with X0 bushing welded to the tank
of the network transformer (photo by author).
Figure 34 implies that there is a separate neutral bus in the network vault, and a separate ground bus. Often this is the same bus when the transformer X0 bushing is welded to the tank, with neutral conductors to the service, and neutral conductors from the network transformers X0 bushings terminated on this common bus. There is no distinction between neutral and ground in the utility vault with this arrangement. In addition, equipment enclosures and primary cable shields are also connected to this neutral/ground bus.
Figure 35 shows a network transformer with connections to the X0 bushing consistent with those defined in Figure 34. To apply ground fault relaying schemes to systems where the network transformers do not have an insulated neutral bushing can be very challenging. It is preferred that the network transformers have an insulated X0 bushing when ground fault relaying is installed.
Shown with the solid green-colored line in Figure 34 is a ground connection from the network transformer tank ground pad (item 13 in Figure 2 of ANSI C57.12.40-2006) and the vault ground bus. In addition, the shields and sheaths of the primary cables must be connected to the transformer tank to provide a return path to the substation for ground faults internal to the switch or transformer. With there being more than one connection to the transformer tank as in Figure 34, there are parallel return paths for the zero-sequence component of load and fault currents on the secondary side. Determining how the zero-sequence load current divides between the different return paths, and how the zero-sequence component of the fault current divides between the different parallel return paths is difficult. Also, the division of the zero-sequence component of the fault current between the parallel paths is a function of the fault location within the low-voltage portion of the system. This creates uncertainties, and makes it challenging to install ground fault relaying schemes in absence of insulated neutral bushings on the network transformers.
Figures 36 and 37 shows how ground fault relaying can be applied in the spot network vault when the network transformers do not have an insulated neutral bushing. In Figure 36 zero-sequence CTs or sensors are place around the three phases near the top terminals of the network protector. Each CT supplies a time overcurrent relay, and trips through a lockout relay (not shown) its own protector. With this scheme, unbalanced load current will be seen by the ground time overcurrent relay for each protector, and its pickup must be set above the maximum unbalanced load current to avoid false tripping.

Figure 36:
Network ground fault relay scheme 1 with transformer X0
bushing welded to transformer tank.
With the scheme in Figure 36, the time overcurrent relay for each network protector should be set such that it will coordinate selectively with the ground fault relay for the service entrance main breaker/switch (see Figure 34) when one of the two network protectors is out of service. With the scheme of Figure 36, if a fuse in a network protector were blown, the residual could exceed the pickup setting for the time overcurrent relay (device 51), and the protector may trip for a blown fuse in the network protector.
The scheme in Figure 37 is similar to that in Figure 36, except that the output of the two zero-sequence CTs is summed, and supplied to a ground time overcurrent relay (device 51). Pickup and time out of this relay trips and locks out through an 86 device both network protectors. This time-overcurrent relay must be selectively coordinated with the ground fault relay for the main breaker at the service entrance in Figure 34.
With reference to Figure 34, when a single line-to-ground fault occurs downstream of the main breaker (MB), its ground fault relay (GFR) sees the total ground fault current, but none of the unbalanced load current. In contrast, the time overcurrent relay for the network protectors in the scheme of Figure 37 sees the sum of the single line-to-ground fault current, plus the unbalanced load current. This complicates coordination of the main breaker ground fault relay (GFR) at the service and the time overcurrent relay for the network protectors. When the network transformers have an insulated neutral (X0) bushing, schemes are available where the current seen by the main breaker GFR at the service entrance and network vault time overcurrent ground relay are the same during the SLG fault.

Figure 37:
Network ground fault relay scheme 2 with transformer X0
bushings welded to transformer tank.
To obtain reliable and secure ground fault protection requires careful consideration of where the ground connections are made to the neutral conductors, where the CTs that sense ground fault current are located, and how the CT secondary windings are connected. Ideally, the ground fault relays see no current for load unbalances, and they see the same current for ground faults.
Figure 38, 40, 42, 43, 44, and 45 show grounding arrangements that have been used when the network transformers (delta connected HV windings) have an insulated LV neutral bushing (X0) and ground fault relaying installed. The security and detection performance of these different schemes are not equal, as will be seen from the following discussions. The discussions apply only when there is a single service from the spot network, as in the figures, or else there are multiple independent services where the neutral bus for each service is not connected to the neutral bus of other services. For applications where there are multiple services with ties between services (neutral bus and bus-tie breakers) in the service switchgear, ground relaying schemes are available, but their discussion is beyond the scope of this chapter.
Scheme 1 – CTs over Insulated X0 Bushing
For this scheme, shown in Figure 38, it is assumed there is a separate insulated neutral bus, and a separate ground bus in the network vault. The scheme can also be used if there is just a ground bus in the network vault with all neutral conductors connected to the ground bus. A current transformer is placed over the insulated neutral bushing of each network transformer, and the CT secondary windings connected as shown in the upper right-hand corner of the figure to supply a ground time-overcurrent relay 51G. In absence of HV interrupters, time out of 51G trips and locks out the network protectors. Relay 51G sees ground faults anywhere in the 480-volt system, including faults in the network protectors. If HV interrupters are on the primary side of the network transformers, relay 51G can initiate tipping of the HV interrupters rather than the network protectors. Tripping of the HV interrupters clears a fault in the “unprotected zone” of any of the network protectors, whereas tripping of all protectors will not clear a fault in the unprotected zone of any one protector. Protector tripping also clears a fault on the paralleling bus or on the service. A tank grounding conductor connects the ground pad on each network transformer to the vault ground bus, to which also must be connected the sheaths/flat strap neutrals of the primary cables. These connections provide a return path to the substation for currents for ground faults from the HV conductors to the transformer tank, switch compartment, or cable compartment.
When CT’s are placed over the insulated neutral bushing, X0, as in Figure 38, ground fault relay 51G for the network protectors or HV interrupter sees unbalanced load current during unfaulted conditions, whereas the ground fault relay (GFR) for the main breaker at the service experiences no current during unbalanced phase-to-neutral loading. The pickup and time delay characteristics of vault ground relay 51-G must be such that it does not false-trip a protector for line-to-neutral load unbalances and the zero-sequence harmonics in the line-to-neutral load currents.

Figure 38:
Spot network with network transformers having an
insulated neutral bushing, with identical CT’s over each X0 bushing
With the CTs placed over each X0 bushing as in Figure 38 and a ground fault downstream of the main breaker (MB) in the service switchgear, the ground fault relay (GFR) for the main breaker sees just the ground fault current, whereas ground-fault relay 51-G for the network vault sees the total ground fault current plus current from unbalanced line-to-neutral loading, including zero-sequence harmonic currents. The current seen by vault ground relay 51-G is the vectoral sum of the current due to the ground fault and the unbalanced load current. The sum can be less than or greater than the ground fault current seen by the ground fault relay (GFR) for the main breaker (MB).
If the ground fault is downstream of the main breaker (MB) in the service switchgear in Figure 38, the GFR for the main breaker sees just the ground fault current, whereas vault relay 51-G sees both the ground fault current and the unbalanced load current. Because the current in the two relays is not the same, this creates uncertainty when coordinating the GFR for the main breaker and network vault ground relay 51-G. Described later are configurations where the GFR for the main breaker at the service and vault ground relay see the same current for faults to ground.
Vault ground relay 51-G in Figure 38 also sees phase-to-neutral faults. The positive aspect of this is that any phase-to-neutral fault in the LV system is seen by vault relay 51-G for the network protectors. The negative aspect is that, if a phase-to-neutral fault occurs downstream of the main breaker in the service equipment, and the fault does not involve ground, the GFR for the main breaker sees no current, but vault relay 51-G for the protectors sees the phase-to-neutral fault current plus the unbalanced load current. To obtain coordination for phase-to-neutral faults requires that vault relay 51-G for protector tripping be coordinated with the phase tripping of the main breaker (MB) or a feeder breaker (FB) if the phase-to-neutral fault is on the feeder.
Figure 39 shows a 480-volt spot network with a ground fault protection scheme, where a current transformer is placed over the insulated X0 bushing on the network transformers.

Figure 39:
Network transformers with current transformers over X0 bushing (photo by
author).
Scheme 2 – CTs over X0 Grounding Conductors
This scheme is shown in Figure 40, where the CT’s are located on the grounding conductors that connect the X0 bushings of the network transformers to the grounding bus in the network vault. There are also neutral conductor connections from the X0 bushings of each network transformer to the insulated neutral bus in the network vault. The connections between the network vault and the service entrance equipment consists of the neutral conductor and three phase conductors, made from either bus or insulated cables. Depending on the construction, the enclosure for the service entrance phase and neutral conductors, such as bus, metallic conduit, or cable tray should be connected to the vault ground bus. Within the service entrance switchgear, there is a separate neutral bus and equipment ground bus, as in Figure 40. Figure 41 is a photo of a portion of a network vault where this grounding arrangement is used.
In the network vault, the network transformer tanks are connected to the vault ground bus. If the paralleling bus were made from commercial bus duct, the bus duct enclosure would be connected to the vault ground bus. If the connections in the network vault were made with insulated cable installed in cable trays, the metallic tray would also be connected to the vault ground bus.

Figure 40:
Spot network with network transformers having an
insulated neutral bushing, CT’s over grounding conductors connected to
X0 bushings.
The CTs for vault ground relay 51-G, connected as shown in the upper right-hand corner of Figure 40, initiates tripping and lockout of the network protectors. They also could initiate tripping and lockout of vacuum breakers on the HV side of the network transformers. Under unfaulted conditions, vault relay 51-G sees a portion of the total current from load unbalances in the secondary. The reason for this is that there are two parallel paths from the service back to the network vault, being the neutral conductors and the grounding conductors. Further, vault relay 51-G sees a portion of the total ground fault current for ground faults in the secondary, the amount dependent upon the location of the ground fault.

Figure 41:
Network transformer with ground fault CT located in
accordance with Figure 40 (photo by author).
First, in the system of Figure 40, consider the return path for unbalanced phase-to-neutral load currents in the secondary system. Downstream of the connection between the neutral bus and equipment ground bus in the service switchgear (main bonding jumper), all unbalanced line-to-neutral load current returns to the service switchgear in the neutral conductors. There is no current in the equipment grounding conductor. However, between the main bonding jumper (MBJ) in the service entrance switchgear and the network vault, there are two parallel return paths for neutral current. One is the neutral bus or cables between the service switchgear and the neutral bus in the network vault. The other is through the ground path, which may include bus duct housings, cable trays, and other grounded objects.
The division of the load’s total neutral current between these two paths can be hard to predict or calculate. In most situations, the majority of the current returns in the neutral path, rather than the ground path, because the impedance between the phase conductors and neutral conductor(s) generally is much lower than that between the phase conductors and the ground return path. This is because the neutral conductor(s) are usually much closer to the phase conductors than are the conductors that make up the ground return path. Regardless, vault ground relay 51-G supplied from CT-1 and CT-2 in the network vault experiences a percentage of the unbalanced line-to-neutral load current. Vault relay 51-G must be set to not false-trip the protectors or HV interrupters, if installed, from the current due to unbalance line-to-neutral loading, and from zero-sequence harmonics in the balanced phase-to-neutral loads. Because of uncertainty in the division of the zero-sequence current from load unbalances, setting vault ground relay 51-G can be challenging.
Next, consider the response of vault ground relay 51-G in Figure 40 for ground faults. For a ground fault in the network vault to the network protector housing, paralleling bus duct enclosure, cable tray, or any other grounded part, a very high percentage of the total ground fault current flows in the paths monitored by CT-1 and CT-2. The sum is supplied to ground fault relay 51-G. However, a small percentage of the ground fault current could follow the ground path to the equipment ground bus in the service switchgear, then pass through the main bonding jumper (MBJ) in the service switchgear, and return in the neutral conductors to the insulated neutral bus in the network vault and the X0 bushings of the network transformers. This small component of current is not seen by vault relay 51-G, which is fed from CT-1 and CT-2 in the network vault.
For ground faults in the service switchgear in Figure 40, the ground fault current returns to the network vault in the neutral bus, and in the ground return path, with the division being similar to that for unbalanced phase-to-neutral load. With the ground fault located on the main bus in the service switchgear downstream of the main breaker, the GFR for the main breaker (MB) sees the total ground fault current, and the vault ground relay 51-G for the network vault sees a fraction of the total ground fault current. If these two relays are coordinated, assuming they see the same current for ground faults, then they are coordinated when vault relay 51-G for the network vault sees less than the total ground fault current. Further, if vault ground relay 51-G coordinates with the GFR for the main breaker, which would have a pickup no higher than 1200 amperes per the NEC, relay 51-G most likely would detect any arcing ground fault within the network vault. This is because a very high percentage of the arcing ground fault current for a fault in the network vault returns to the network transformer X0 neutral bushings in the path monitored by CT-1 and CT-2.
A concern with the scheme of Figure 40 is whether vault ground relay 51-G provides backup protection for ground faults on the main bus in the service switchgear. If a fault occurs in the main breaker in the service switchgear, or on the incoming side of the zero-sequence CT for the main breaker GFR, most of the ground fault current returns to the network vault in the neutral conductor(s). If it is desired to provide backup protection for such faults by network protector tripping, or tripping of breakers on the HV side of the network transformers, the current in the path monitored by CT-1 and CT-2 and supplied to vault ground relay 51-G must be known. But, as the division of this ground fault current, again, is not easily determined or calculated, it can be challenging to set 51-G such that it will provide backup protection for ground faults on “the other side of the vault wall.” However, if there is no intention of providing backup protection for the service switchgear for ground faults, this is of little consequences.
For schemes as in Figure 38 and 40, the CT secondary windings are paralleled to supply a single time-overcurrent ground relay. As an alternative, each CT could supply a separate ground relay and separate lockout relay (86 device), which would only trip the associated network protector or HV vacuum breaker. The coordination of the vault ground relays and service GFR with this arrangement should consider the number of network protectors in service. Also, the response of the system with faults on the primary feeder with one or more blown fuses in the network protector should be considered, because such fault with blown protector fuses gives current in the X0 bushing of the network transformers.
Scheme 3 – CTs summing Total Ground Current
Because of the uncertainty in the paths taken by the ground fault current and the unbalanced load current in Schemes 1 and 2, it is difficult to ensure that the desired sensitivity and coordination between the vault ground fault relay 51-G and the ground fault relay (GFR) for the service main breaker will be achieved. But in Scheme 3, shown in Figure 42, the division of unbalanced load currents and ground fault currents in the parallel path between the service entrance switchgear and the network vault is not required to achieve selective coordination between the vault ground relay 51-G and main breaker ground relay GFR.

Figure 42:
Ground relay scheme 3 in a two-unit spot network.
In Scheme 3 in Figure 42, CT’s are placed on each grounding connection in the network vault, and also on the main bonding jumper (MBJ) in the service entrance switchgear. With all CTs having the same ratio, and connected as shown in the upper right-hand corner of Figure 42, vault relay 51-G sees no current for unbalanced phase-to-neutral loads, and no current for zero-sequence harmonics in the balanced phase-to-neutral loads. This of course assumes that downstream of the service switchgear there are no connections between the neutral conductors and the equipment grounding conductors, and that the CTs are perfect. With this scheme, the possibility of false tripping from unbalanced phase-to-neutral loads can be eliminated or minimized.
For phase-to-ground faults anywhere in the low-voltage system, vault ground relay 51-G sees the total ground fault current. If the fault is downstream of the main breaker in the service switchgear, the GFR for the main breaker (MB) and the vault ground fault relay 51-G see the same current. Thus, they can be selectively coordinated for faults downstream of the service main breaker. Further, vault ground relay 51-G provides backup protection to the service main breaker.
Ground fault relay scheme 3 is applicable when multiple services are supplied from the network paralleling bus, as shown in Figure 43, where there are two independent services. Further note that the X0 bushing of each network transformer is connected to the neutral bus in the network vault, and this bus is connected to the vault ground bus. The current in this path is monitored with CT-1.
Vault ground relay 51-G sees no current for unbalanced phase-to-neutral loads in the secondary, yet sees the total ground fault current for a ground fault at any point in the LV system. The scheme when applied to this configuration with multiple services has the same reliability and security as with a single service, providing the two switchgear assemblies for the two services are independent, as shown in Figure 43. However, if the neutral bus in service entrance switchgear 1 were connected to the neutral bus in service entrance switchgear 2, the GFR for the main breaker in service entrance switchgear 1 may see a net current in absence of a fault. The reason for this is that not all of the line-to-neutral load current from loads on service entrance switchgear 1 will return in the neutral between service switchgear 1 and the neutral bus in the network vault. Some can return in the neutral path between service entrance switchgear 2 and the neutral bus in the network vault.

Figure 43:
Ground fault relay scheme 3 in a two-unit spot network
supplying two service entrances.
With the relay scheme of Figure 43, the following should be considered.
-
The short time ratings for ground fault relay 51-G in the utility vault should not be exceeded. This relay must withstand the current associated with a bolted ground fault cleared by of the network protectors, or tripping of HV vacuum interrupters if installed on the primary side of the network transformers.
-
The CTs for the scheme should not saturate for bolted ground faults anywhere in the secondary system, and must have the same ratio.
-
With this scheme, the designers of the utility spot network and the building electrical system must coordinate their designs. Space must be provided in the service switchgear for the ground fault CTs on the main bonding jumper (MBJ). Vault ground fault relay 51-G must have time-current characteristics that allow
selective coordination with the GFR for each main breaker.
If there were a bus tie breaker between service entrance switchgear 1 and 2 in Figure 43, the parallel paths for the neutral current still exists when the tie breaker is open. However, by using four-pole breakers for the tie and main breakers, with the bus tie operated normally open, and closed only when one of the main breakers is open, the problems mentioned above can be avoided.
Scheme 4 – Neutral Grounds Applied Only in Network Vault
Section 290-23 (a) of the 1996 NEC indicates that, “A premises wiring system that is supplied by an ac service that is grounded shall have at each service a grounding electrode conductor connected to a grounding electrode that complies with Part H of Article 250. The grounding electrode conductor shall be connected to the grounded service conductor at any accessible point from the load end of the service drop or service lateral to and including the terminal or bus to which the grounded service conductor is connected at the service disconnecting means. Where the transformer supplying the service is located outside of the building, at least one additional grounding connection shall be made from the grounded service conductor to a grounding electrode, either at the transformer or elsewhere outside the building. A grounding connection shall not be made to any grounded circuit conductor on the load side of the service disconnecting means.”
The systems shown in Figures 34, 38, 40, 42, and 43 conform to this requirement, because the transformers in the spot network supplying the service or services are outside of the building. However, as mentioned before, having multiple grounds on the neutral conductor (grounded circuit conductor) of the system complicates the ground fault relaying scheme and introduces uncertainties in the split of the unbalanced load current and ground-fault current between the neutral path and ground path. However, scheme 3 in Figure 43 does not require knowing of the split of the currents between the neutral conductors and grounding conductors, because of the placement of a CT on each neutral to ground connection, with the CT secondaries paralleled.
In Scheme 4, as shown in Figure 44, where ground connections are made to the neutral conductor only in the network vault, and omitting the bonding of the neutral and the equipment ground bus in the service through the main bonding jumper, a reliable and secure ground fault protection scheme can be developed.

Figure 44:
Ground fault protection scheme with neutral grounded
only in network vault outside of served building (requires code variance).
In the system of Figure 44, the scheme is applied to a two-unit spot network. (Anderson 1969) shows that one utility adopted this approach in 1969 or thereabouts. To use this scheme requires that a variance be obtained from the code authorities who must approve the installation.
In the system of Figure 44, the circuit between the network vault and the service entrance switchgear on the “other side of the vault wall” is a five-wire circuit. It consists of three phase conductors, a neutral conductor, and an equipment grounding conductor. These conductors must be sized in accordance with the applicable electrical codes. Furthermore, the neutral conductor should be sized to carry the maximum unbalanced load currents, including harmonics. The equipment grounding conductor between the network vault and service should be sized to carry the maximum ground fault current until the protective devices operate to interrupt the fault current flow. To keep impedances low, the neutral conductor and equipment grounding conductor between the network vault and service entrance switchgear should be in close proximity. If part of this connection is made with a metal enclosed bus duct, five-wire duct with three phases, a neutral bus, and a ground bus can be used.
In Figure 44, vault ground relay 51-G trips the protectors to clear faults downstream of the network protector terminals. Ground relay 51-G also sees ground faults in a network protector. To clear faults in the network protectors, vacuum breakers need to be installed on the HV side of the network transformers. Vault ground relay 51-G sees no current for unbalanced phase-to-neutral loads, yet sees the total ground fault current for ground faults anywhere in the 480-volt system. The GFR for the main breaker in the service switchgear sees no current for unbalanced phase-to-neutral loads, yet sees the total ground fault current. This ground fault relay scheme can be made sensitive, reliable, and secure.
Figure 45 shows the cable connections in a two-unit spot network that uses scheme 4. The figure shows the three phases, neutral, and equipment grounding conductors connecting the respective buses in the network vault (not visible in the picture) to the five-wire service bus duct that stabs into the network vault. Out of site is the connection between the neutral bus and ground bus in the network vault, and the current transformer that monitors the current in this path. An alternate arrangement for scheme 4 is to use a single CT between the vault neutral bus and vault ground bus as shown in Figure 46

Figure 45:
Five-wire connections in the network vault from spot
network phases, neutral, and ground buses to service entrance bus duct
stabs (photo by author).

Figure 46:
Alternate arrangement for scheme 4 in Figure 44
(requires code variance)
In Figure 46, insulated neutral conductors are run from the X0 bushing of each network transformer to the insulated neutral bus in the network vault. And grounding conductors are run from the transformer ground pad to the ground bus in the network vault. A current transformer, CT-1, is in the connection between the insulated neutral bus and the ground bus. Current flows in this path only for a ground fault in the customers system, service switchgear, or in the network vault. Under normal loading, no current flows in the path between the vault neutral bus and vault ground bus, providing of course that loads are not connected between any phase and the equipment grounding conductor in the customer’s system.
Figure 47 shows a portion of a 480-volt spot network system that uses this arrangement. Seen for the paralleling (collector) bus are the three phase buses, the neutral bus, and the ground bus. The connection between the neutral bus and the ground bus is visible in the lower part of the picture. As depicted in Figure 47, and as seen from an inspection of the vault, the grounding conductors of the low-voltage system are attached to the transformer tank at the ground pad that is just below the X0 bushing, and then run with the phase and ground cables to the neutral bus. With this arrangement, both the LV neutral conductors and grounding conductors for the LV system are in close proximity to the LV phase conductors, thereby keeping the inductance of the neutral path and ground path low.

Figure 47:
CT in connection between the neutral bus and ground bus
in the network vault (courtesy of Portland General Electric).
As shown in Figure 48, this particular vault also has probe-type heat sensors located above the paralleling bus and the cable trays, with the cables from the transformers (neutral cables) and protectors (phase cables) to the paralleling (collector) bus. Figure 48 also shows one of several probe-type heat sensors located above the paralleling bus. Operation of either the heat sensors or the ground fault relays will initiate trip and lockout of the network protectors.
Other Considerations
The previous sections considered spot networks with network transformers having the delta connected primary windings, and grounded-wye connections for the secondary windings. These are the connections found in most but not all systems. When the network transformers have the grounded-wye connections for both the primary and secondary windings, the issues considered in this Chapter also must be studied (Roop and Vidonic 1983) and the discussions of that paper address other issues to consider when the network transformers have the grounded-wye connections for the primary and secondary windings, and ground fault relaying is to be applied. The big difference when the grounded-wye connections are used for the primary and secondary windings is that ground faults on the primary system give ground current on the secondary side, whereas that is not the situation when the network transformers have the delta connected primary windings.

Figure 48:
Probe-type heat sensor mounted above paralleling bus.
Sensors are also mounted above the cable trays (courtesy of Portland
General Electric).
Sometimes, network protectors are included in the service switchgear. The network protector serves as both the “main breaker” and the network protector. The bus work in the service switchgear is used for the paralleling bus, and there may be one or more tie breakers in the paralleling bus. If the network transformers and service switchgear are located within the building, then the grounding of the neutral is more straightforward than when the supply transformers are outside of the building. Various grounding and ground fault relay schemes have been developed for these equipment arrangements. Refer to the manufacturer’s literature for details on the grounding arrangements and ground relay schemes. (Cutler Hammer Consulting Application Guide) is one example of this.
It is emphasized that when designing ground fault relay schemes for spot networks, always carefully evaluate the various paths for unbalanced load currents, and ground current paths for ground faults at various locations in the system. This is necessary to assure reliable detection of ground faults, allow for selective coordination with downstream ground fault detection devices, and minimize the chance of false operation from phase-to-neutral load unbalances and zero-sequence harmonics in the phase-to-neutral load currents.
Additional information on protecting 480-volt spot networks can be found in (IEEE Standard C37.108-2002).
Coordination of Vacuum Interrupters On HV Side of Network Transformer With Substation Breaker
In this section, issues to be addressed when a vacuum breaker with phase and ground relays is installed on the HV side of network transformers in 480-volt spot networks are identified. Figure 49 shows one feeder, feeder 3, of a five-feeder network system. All of the network transformers on the feeder do not have vacuum interrupters (VI’s) on the HV side, except for the network transformers supplying locations 5 and 8, which are for 480-volt spot networks.
As discussed before, the opening of the VI’s would be initiated for faults in the 480-volt secondary system, as might be detected with:
-
Heat sensors in the network protectors
-
Heat sensors located near the paralleling bus or service connections
-
Ground fault relay schemes for ground faults in the 480-volt system
-
Sudden pressure relay in the network transformer
-
Other suitable arcing-fault detection devices.
The vacuum interrupters also may be equipped with both phase and ground time overcurrent relays and perhaps instantaneous current relays. Doing so will allow for more sensitive protection against faults in the primary or secondary windings of the network transformers than is possible with the relays for the primary feeder breaker at the substation. Any relays for the VI’s must be selectively coordinated with the relays for the feeder breaker for faults “downstream” of the vacuum interrupter, such that only the VI opens. And, of course, the VI should not open for faults downstream of the customers main breaker in the service entrance switchgear. Furthermore, the phase relays for the VI must be selectively coordinated with the tripping of the network protector for faults on the primary feeder between the feeder breaker at the substation, and the vacuum interrupter at the HV side of the network transformer. For such faults the VI should remain closed, and only the backfeeding network protector should open.

Figure 49:
Network primary feeder having two network units with
vacuum interrupters at their HV terminals.
Shown in Figure 50 are two network transformers on the primary feeder, one having a vacuum interrupter at its HV terminals, and the other connected directly to the primary feeder through its disconnect and grounding switch.
At the substation, there are phase instantaneous and time overcurrent relays, 50/51ϕ, and instantaneous and time overcurrent ground relays, 50/51G. For the vacuum interrupter, there are phase instantaneous and time overcurrent relays, 50/51ϕ-T, and instantaneous and time overcurrent ground relays, 50/51G-T. Factors to consider in setting and coordinating these relays, and coordinating with tripping of the network protector will be described for faults at different locations. As shown in Figure 49, the network transformers have the delta connected HV winding, and all bus-tie breakers at the substation are closed (ring bus). It is assumed that the network protectors have microprocessor relays with sensitive trip of 3 or 6 cycles.

Figure 50:
Phase and ground relays for feeder breaker at
substation, and vacuum interrupter (VI) at HV terminals of network
transformer.
Fault Between Feeder Breaker and Vacuum Interrupter
In Figure 51, a multi-phase fault exists on the primary feeder between the feeder breaker at the substation and the VI on the network transformer. The feeder breaker and the network protectors are closed, as the network relay sensitive trip criteria most likely is not satisfied with the feeder breaker closed. For the multi-phase fault, high currents flow in the substation breaker, IBKR, and in the VI, shown as IBACK in Figure 51. However, with closed bus tie breakers at the substation, the backfeed current in the VI, IBACK, is not that high due to the substation bus voltage being depressed. In Figure 51, the current flowing into the fault on the substation side is ISUB.

Figure 51:
Currents for multi-phase fault between feeder breaker
at substation and VI for network transformer with feeder breaker
closed.
With the feeder breaker equipped with instantaneous phase and instantaneous ground relays, the first device to open would be the feeder breaker at the substation, as shown in Figure 52. With the feeder breaker open, and a multi-phase fault, the sensitive trip characteristic of the network relays would be satisfied, and after 3 to 6 cycles, the network relay would make its trip contact. Further, with the feeder breaker at the substation open as in Figure 52, the backfeed current in the VI, IBACK, would increase significantly, but it never would exceed 20 times the full load current of the network transformer with 5% impedance transformers, or 14.3 times full load with 7% impedance network transformers. The pickup for the instantaneous phase relays for the VI, 50ϕ-T, must be set above the maximum backfeed current so that the VI does not open on backfeed. Furthermore, if the network protector on the transformer with the VI fails to open, the backfeed should be cleared by blowing of the network protector fuse(s). What this means is that the phase time overcurrent relays 51ϕ-T for the VI should selectively coordinate with the network protector fuses. In evaluating this coordination, it must be remembered that with the delta wye-grounded network transformer, the ratio of the current in the protector fuse to that seen by the phase relay for the VI is a function of the type of fault on the primary feeder.

Figure 52:
Currents for multi-phase fault between feeder breaker
at substation and VI for network transformer with feeder breaker open
and protectors open.
Following opening of the feeder breaker at the substation, all network protectors on the secondary side open as shown in Figure 53. However, because of sneak type circuits across the open contacts of GE type network protectors, very small currents may still flow in the fault path. As a result, IBACK in the VI may not be zero as indicated in Figure 53.
Fault in Primary System Downstream of VI
For a fault in the primary system downstream of the VI on a network transformer, as in Figure 54, with all network protectors closed at time of fault, the current in the feeder breaker at the substation, ISUB, and the current in the vacuum interrupter, IVI, typically are very high. With the feeder breaker at the substation closed and with closed bus-tie breakers at the substation, typically the network relay sensitive trip criteria would not be satisfied. Also, the backfeed current in the network protectors would be limited due to the voltage on the substation buses being depressed.

Figure 53:
Multi-phase fault between feeder breaker at substation
and VI for network transformer with station breaker and all network
protectors open.
With the vacuum interrupter (VI) in Figure 54 having instantaneous phase (50ϕ-T) and instantaneous ground (50G-T) relays, the VI would open in a matter of cycles, depending on the speed of the VI. Further, if the station breaker has just inverse time overcurrent relays, 51ϕ, the feeder breaker at the substation would not open.

Figure 54:
Multi-phase fault on primary downstream of VI, with
feeder breaker at station and VI closed, and all network protectors
closed.
Following opening of the VI for the fault “downstream”, as shown in Figure 55, the network protector on the secondary side of the transformer with the VI opens With the feeder breaker at the substation closed as in Figure 55, the network protectors on other transformers on the feeder most likely would not open, as shown. Again, this assumes that the feeder breaker at the substation does not have instantaneous phase or instantaneous ground relays.

Figure 55:
Multi-phase fault on primary downstream of VI, with
feeder breaker closed, VI open, and network protector on transformer
with VI open.
For faults downstream of the VI as in Figure 54, if it is desired that only the VI opens, and it opens fast to minimize the damage at the fault point, then the instantaneous phase and ground relays for the feeder breaker must be deactivated.
However, if the instantaneous relays for the feeder breaker are deactivated so that there is selective coordination with the VI for “downstream” faults, then protection for faults on the primary feeder, and for faults in network transformers without vacuum interrupters is marginalized. These faults would then be cleared by time-delay tripping of the feeder breaker at the substation.
If VI’s are installed with some network transformers on the feeder, it is preferred to still have instantaneous relays for tripping of the feeder breaker at the substation for fault on the primary feeder and faults in the HV portion of network transformers without vacuum interrupters.
With instantaneous current relays for the feeder breaker at the substation and for the VI on the HV side of the network transformers, faults downstream of the VI as in Figure 56 would trip not only the VI, but also the feeder breaker at the substation. This miscoordination is preferred as it allows for fast clearing of faults on the primary feeder and in network transformers without VI’s.
In Figure 56 with the fault downstream of the VI, both the VI and station breaker are open. Under these conditions, the network protector on the secondary side of the transformer with the VI would see high backfeed currents, and should open quickly. The network protectors on the secondary side of all other network transformers on the feeder would see, with the VI open, reverse magnetizing currents and circulating currents, just as when the feeder breaker is opened in absence of a fault. With these protectors having microprocessor network relays with a definite sensitive-trip time of 3 or 6 cycle, the protectors would sequence open to de-energize the primary feeder.

Figure 56:
Multi-phase fault on primary downstream of VI, with
feeder breaker open, VI open, and network protectors on all network
transformers open.
Another important consideration when VI’s are installed on the HV side of the network transformer is the coordination of the VI’s phase instantaneous and time over current relays with devices on the secondary side. For example, if a vault ground relay 51G is installed to detect faults in the secondary, the VI phase time overcurrent relay, 51ϕ-T should be selective with this ground relay. And, of course, the instantaneous phase relay for the VI, 50ϕ-T, should not pickup for faults in the secondary. Again, the pickup of 50ϕ-T must be above the maximum through current for a bolted three-phase fault on the secondary system.
An added advantage of having phase and ground time-overcurrent relays on the VI’s is that their pickup is much lower than that of the relays for the station breaker. This should allow for earlier detection of faults within the delta-connected HV and LV windings of the network transformer.
What must be decided by the protection and network engineer when placing VI’s on the HV side of the network transformer is whether instantaneous tripping is used on the primary feeder breaker, recognizing that coordination is lost for faults downstream of the VI. Most practitioners probably would prefer the miss coordination so that instantaneous tripping of the feeder breaker occurs for high-current faults on the primary feeder, and in the HV portion of network transformers that do not have a VI on their primary side.
Coordination Considerations
Given in this section is an example of the phase and ground relay coordination between the VI on the HV side of a network transformer, and the relays for the primary feeder breaker at the substation. The network transformer is rated 13.8 kV to 480Y/277 V, having standard 5% impedance. The full load current at 1000 kVA and 13.8 kV is 41.8 amperes.
Phase Relay Coordination
The phase relays for the primary feeder breaker at the substation, as shown with the orange-colored curve in Figure 57, have a pickup of 720 amperes at 13.8 kV, which is 17.2 times the full load current of the 1000 kVA network transformer. The feeder phase instantaneous relay pickup is 3600 amperes at 13.8 kV as shown by the vertical red line in Figure 57. Also shown is the maximum and minimum time for the phase instantaneous relay, being for an SEL 751 relay.
The phase relay for the VI has a pickup of 240 amperes @13.8 kV, and a time dial of 2.5 as shown with the brown-colored curve in Figure 57. The pickup of the phase instantaneous relay for the for the VI is 2000 amperes at 13.8 kV as shown by the vertical brown-colored line.
Also shown with the solid and dashed blue colored curve is the time-current characteristic of a Y25 network protector fuse on the 480-volt side, reflected to the primary side. The solid curve is for a three-phase fault on the primary, and the dashed curve is for a phase-to-phase fault on the primary.

Figure 57:
Example of coordination between phase relays for the VI
on the HV side of a 1000 kVA 13.8 kV network transformer and the feeder
breaker phase relays.
Plotted on Figure 57 with the left-most dashed vertical black line is the maximum backfeed current to a three-phase fault on the primary feeder, with the feeder breaker open, assuming a five-unit spot network. This current is 669 amperes, well below the pickup of the VI instantaneous phase relay at 2000 amperes.
From the blue colored curves which show the time-current characteristic of the Y25 network protector fuse, it is seen that if the network protector were to fail to open during backfeed to a three-phase or phase-to-phase fault on the primary, the Y25 protector fuse is selectively coordinated with the phase tripping of the VI, and only the protector fuse would blow as desired.
Plotted with the second dashed vertical black line is the maximum through fault current for a bolted fault in the 480-volt secondary system, or 837 amperes at 13.8 kV. This current is also below the pickup of the VI instantaneous phase relay, shown with the vertical brown-colored line, and it should not trip for a bolted fault in the secondary.
Should a multi-phase fault occur on the primary downstream of the VI, with the fault current below the pickup of the phase instantaneous relay for the feeder breaker, 3600 amperes, only the VI would open. But if this current were above 3600 amperes, the instantaneous phase relays for both the VI and the feeder breaker at the substation would pick-up, and both breakers would trip. As mentioned before, to prevent the feeder breaker from tripping through phase instantaneous relay, it must be disabled. This, however, eliminates rapid clearing for faults on the primary feeder and in the HV portions of network transformers that do not have a VI.
Finally, the phase time overcurrent relay for the VI, brown colored curve in Figure 57, should coordinate with the ground fault relay, 51G, used for arcing fault protection in the 480-volt portion of the system. When such a ground-fault relay is applied in the 480-volt system, most likely it would be configured to trip all VI’s on the primary side, as this is necessary to clear faults in the network protector.
Ground Relay Coordination
Figure 58 shows the ground relay time-current curves for the VI and the feeder breaker at the substation to illustrate the coordination and discuss the issues.
The solid green-colored curves are for the feeder breaker time overcurrent and instantaneous ground relays, having pickup of 240 amperes and 3600 amperes respectively. The dashed olive colored curves are for the VI time-overcurrent and instantaneous ground relays, having pickup of 80 amps and 800 amps respectively. The feeder and VI ground relays would not pickup for faults in the secondary with the delta wye-grounded connections for the network transformer.
For faults on the primary feeder between the feeder breaker at the substation and the VI, the feeder breaker sees high ground fault current, but the VI sees virtually no ground current because the three phase currents must sum to zero at the HV delta connected windings of the backfeeding network transformer. For a single line-to-ground fault on the primary feeder between the feeder breaker at the substation and the VI, after the feeder breaker opens, the SLG fault is on an ungrounded system. Backfeed currents in the closed network protectors are determined primarily by the zero-sequence capacitive reactance of the faulted primary feeder. The network protectors would be expected to open through the network relay sensitive reverse current trip characteristic. If the protector were to fail to open, the backfeed current generally will not be high enough to blow the protector fuses, and the primary feeder remains live on backfeed.

Figure 58:
Example of coordination between ground relays for the
VI on the HV side of a 1000 kVA 13.8 kV network transformer and the
feeder breaker ground relays.
For ground faults “downstream” of the VI, the ground relays for the VI are selectively coordinated with the ground relays for the feeder breaker, providing the ground current is below the level where the instantaneous ground relay, 50G, for the feeder breaker does not pickup. But if the ground current for a fault “downstream” of the VI on the primary side is greater than the pickup of the instantaneous ground relay for the feeder breaker, 50G, then both the VI and the feeder breaker will open. This miss coordination should be accepted as it provides fast tripping for ground faults on the primary feeder and in network transformers that do not have a VI at their primary terminals. Regardless, after the feeder breaker opens, the network protectors on all other network transformers on the feeder should open through the network relays sensitive trip characteristic.
The ground relays for the VI and feeder breaker do not have to be coordinated with a vault ground relay, 51G, that might be installed to detect arcing ground faults in the 480-volt system, because of the delta connected HV windings on the network transformer.
Summary of VI Benefits
In many cases, the main reason for applying a VI at the HV terminals of the network transformer will be to clear arcing faults in the network protector, as might be detected with heat sensors or ground-fault relay schemes. Some users have indicated a reason for applying the VI is to allow de-energizing the network transformer for working on the 480-volt network protector, to reduce the arc flash hazard.
But as can be seen from the time current curves presented herein, the phase and ground relays for the vacuum interrupter on the HV side provide more sensitive protection for faults internal to the HV and LV windings of the network transformer than provide by the phase and ground relays for the feeder breaker at the substation. Of course, the ground relays will not respond to ground faults in the LV winding of the delta-wye connected network transformer.
Selective coordination for all faults on the primary downstream of the VI is possible by elimination of instantaneous tripping of the feeder breaker at the substation. However, eliminating the instantaneous tripping is not recommended in many cases, as it can significantly increase the time to clear faults on the primary feeder and in network transformers which do not have a vacuum interrupter.
4.13 - Medium Voltage Spot Network Systems
MEDIUM VOLTAGE SPOT NETWORK SYSTEMS
Most spot network systems operate at a nominal voltage of either 208Y/120 volts, or 480Y/277 volts, supplying a combination of lighting load and power load. Sometimes when the building supplied by the electric system covers a large area, such as a convention center, the main distribution in the building operates at a medium-voltage level, such as 4.16 kV, or at a higher voltage. In these systems, large motors may be supplied at the medium-voltage level, but many of the smaller loads require either 208Y/120-volt or 480Y/277-volt service. The lower voltages are supplied from three-phase transformers, dry type or otherwise, that step the medium-voltage down to the utilization voltage. Frequently, these transformers have a delta connected primary winding and a wye-grounded secondary winding.
For such systems where very reliable supply is desired, the medium-voltage system can be supplied from a medium-voltage spot network. Their configuration is like that of the low-voltage spot network, but they use medium-voltage circuit breakers, with appropriate relaying, rather than network protectors. These systems basically operate just like the conventional low-voltage spot networks, except that protection must be installed to clear faults in the medium-voltage portion of the system. This chapter discusses issues to consider when designing medium-voltage spot networks.
General Design Considerations
The issues considered when designing the low-voltage spot network must also be addressed when designing the medium-voltage spot network. Some of these issues are identified with the aid of the four-unit medium-voltage spot network in Figure 1.
-
The source for the HV primary feeders for the medium-voltage spot network. Just as with low-voltage spot networks, the best operation is obtained for the medium-voltage spot network if the HV primary feeders come from the same electrical bus in the same substation. Attempting to supply the medium-voltage spot network from different substations, or from the same substation with open bus-tie breakers, can result in the same problems occurring in low-voltage spot networks, as discussed in Network Protector Relaying. The medium-voltage circuit breakers, performing the network protector function, referred to as “network breakers”, can sit open, fail to close, cycle, or pump.
-
The voltage level of the medium-voltage spot network system. This usually is one of the standard nominal system voltages as recognized in ANSI C84. The medium-voltage selected for the spot network can be influenced by the size and cost of the large three-phase motors to be fed directly at the medium-voltage level, and medium-voltage feeder length.
-
The connection for the “network transformers” that are used in the medium-voltage spot network, either delta wye-grounded, or wye-grounded wye-grounded. These transformers, shown in Figure 1, will be referred to as “network transformers”, although they may not be built to network transformer standards. The delta wye-grounded connections are preferred for most applications because they isolate the primary (HV) system in Figure 1 from the medium-voltage (MV) system in the zero-sequence network. See Network Transformers, for a listing of the advantages of the delta wye-grounded connections for network transformers.

Figure 1:
Medium-voltage spot network without medium-voltage
bus-tie breakers.
-
The impedance of the network transformers, shown as ZT in Figure 1. The size and number of network transformers in the medium-voltage spot network are determined primarily by loading considerations, and whether the medium-voltage spot network is designed for single or double contingency. Factored into the selection of the impedance of the transformer is the interrupting rating for the circuit breakers for the medium-voltage feeders supplied from the paralleling bus as in Figure 1. For example, if the transformers in Figure 1 were rated 2500 kVA, 4.16 kV secondary winding, with 6% impedance, the upper bound on the current for a three-phase fault on the medium-voltage bus, with an infinite bus on the HV side of each network transformer, is 23,131 amperes. This would be somewhat less when the impedance of the HV system supplying the network transformers is included in the calculations.
-
The impedance of the network transformers also affects the overvoltage close setting selected for the network relay that controls the automatic closing of the medium-voltage network breakers that act as network protectors, as discussed in Network Relay Close characteristics. In this chapter, these circuit breakers are referred to a “network breakers”.
-
Whether a disconnect and grounding switch is to be applied on the high-voltage (HV) side of the network transformer.
-
The type of grounding selected for the medium-voltage system when the “network transformers” are connected delta on the HV side. Most low-voltage spot network systems are solidly grounded, because this is a code requirement when they supply four-wire 208Y/120-volt or 480Y/277 volt low-voltage circuits. However, the medium-voltage system could employ either reactance grounding, or low-resistance grounding if all loads on the medium-voltage system, such as three-phase motors and all transformers, are connected from phase-to-phase. Benefits from resistance grounding are limiting ground fault current for the single line-to-ground (SLG) fault, which in turn improves power quality for ground faults, reduces arc flash hazards and reduces voltage sag during SLG faults. Grounding Classes discusses in more detail the benefits of resistance grounding.
If resistance or reactance grounding is selected for the medium-voltage spot network, when a SLG fault occurs in the medium-voltage system, the unfaulted phase-to-ground voltages can rise significantly above the nominal voltage, and approach the full phase-to-phase voltage of the medium-voltage system. All equipment connected from phase-to-ground in the medium-voltage system must be able to withstand this voltage. One major concern with this is the overvoltages applied to ground to the network relays for the medium-voltage network protectors. The network relay network-side terminals and transformer-side terminals are connected on the secondary side of potential transformers connected from phase-to-ground as shown in Figure 2. If resistance or reactance grounding is selected, the temporary overvoltages must not exceed the capability of the voltage transformers and the network relay. With solid grounding, this is not an issue. For this reason, resistance or reactance grounding may not be applicable in the medium-voltage spot network.
-
The contingency condition for which the medium-voltage spot network is to be designed. Just like low-voltage spot networks, the medium-voltage spot network can be designed for the outage of one or two source feeders (HV feeders in Figure 1) and their associated network transformers.
-
The overload to be placed on each network transformer during contingency conditions. This requires information on the shape of the load curve as well as the peak loading of the medium-voltage system.
-
The type of equipment for the “network protectors” in the medium-voltage spot network system. In the low-voltage spot network, the network protector frequently is mounted on the low-voltage throat of the network transformer. In medium-voltage spot networks, the “network breaker” is typically a medium-voltage circuit breaker that is included in a metal-clad switchgear assembly, which has all of the other network breakers, the paralleling bus, and medium-voltage feeder breakers as depicted in Figure 1. There may or may not be a bus-tie breaker in the medium-voltage paralleling bus of the MV spot network.
-
With reference to Figure 1, the medium-voltage feeders supplied from the medium-voltage spot network bus could operate in a radial fashion, or they could supply conventional low-voltage spot networks.
-
The connection method between the medium-voltage terminals of the “network transformers” and the switchgear with the medium-voltage network breakers, typically either insulated cables or medium-voltage bus duct.
Network Relay Functions
In the medium-voltage spot network, the tripping of the “network breaker” for faults on the primary (HV) feeder and the automatic closing are controlled with basically the same 216Y/125-volt microprocessor relay that is used in 480-volt spot networks. When the network breaker is tripped through the network relay, it is not locked out, so that it can automatically reclose when system conditions are proper. However, as discussed later, when the network breaker on any network transformer trips for many faults in the MV system, it must be locked out.
As illustrated in Figure 2, at each network breaker, potential transformers are installed on the network side and transformer side of the network breaker, to convert the medium-voltage system nominal phase-to-ground voltage to 125 volts for the network relay. The temporary overvoltage capability of the voltage transformers and the network relay must be considered when selecting the grounding for the medium-voltage system. When the network transformers have the delta connected HV winding, objectionable overvoltages will not occur to ground in the MV system during faults to ground on the HV primary system, even with low resistance grounding of the MV system or reactance grounding of the MV system. But temporary overvoltages will occur for single line-to-ground faults in the MV system. This may place limits or prevent the use of resistance or reactance grounding for the MV system. Solid grounding of the MV system avoids this issue

Figure 2:
Connections to microprocessor network relay in a
medium-voltage spot network.
Potential Transformer Error
It is imperative that the potential transformers for the network relay have minimal ratio error and phase angle error, so that the phasing voltage supplied to the microprocessor network relay accurately replicates the actual phasing voltage at the medium-voltage level. On a 125-volt basis, the phasing voltage at the open network breaker may be less than 1.0 volt, and the zero-degree close setting, V0, for the network relay may be 1.0 volt or less. Errors that produce false phasing voltages as low as 0.10 volts are unacceptable.
To determine if the potential transformers are acceptable for the application in the medium-voltage spot network, simple measurements can be made. With the network breaker (NWK BKR1) closed as in Figure 2, the network side voltage is applied to terminal 2 of the network relay, and the transformer side voltage is applied to terminal 1 of the network relay. With perfect potential transformers, the voltage measured between terminals 1 and terminal 2, the phasing voltage on a 125-volt base, is zero volts. The measured voltage should be less than 0.10 volts, and the smaller the better. Voltages measured at one actual installation were 0.04 volts or less when all burdens were connected to the potential transformers for the network relay.
Note that if the voltages measured from terminal 1 to ground, and from terminal 2 to ground were of the exact same magnitude, that is not sufficient to show that the voltage transformer accuracy is acceptable. For example, if both line-to-ground voltages were 125.0 volts, there could be considerable angle difference between the two, due to CT angle error. If the voltage between terminals 1 and 2 were 1.0 volt, the angle difference is 0.458 degrees. And if the voltage between terminals 1 and 2 were 0.50 volt, the angle difference is 0.229 degrees. This amount of error could give erroneous phasing voltages to the network relay, with the network relay possibly seeing a “leading” phasing voltage, where in the actual system the phasing voltage could be lagging, for which the “network breaker” should not be closed.
Network Relay Trip and Close Settings
The trip and close settings for the network relays in the medium-voltage spot network are made considering the same factors that determine relay settings made in the low-voltage spot network. Reference Network Protector Relaying.
The current transformer (CT) for the network breaker should have a primary current rating that is greater than the full load current of the network transformer, to allow for overloading the network transformer under contingency conditions. The 180-degree trip setting for the network relay, in % of the CT rating, should be made so that when the HV primary feeder breaker is opened in absence of a fault to clear the feeder, the network relay sensitive trip characteristic is satisfied and the MV network breaker opens. As with conventional low-voltage network protectors, the network breaker does not have to trip on just the exciting current of its own network transformer. This is because of circulating current effects when the circuit breaker for the HV feeder at the substation is opened in absence of a fault, as discussed in Operation When Primary Feeder Breaker Opened in Absence of Fault.
For the network relay sensitive trip characteristic in the medium-voltage spot network, supplied from dedicated network HV primary feeders, the gull-wing watt trip characteristic is recommended, just as with relays applied in conventional low-voltage spot networks. With the microprocessor relays, time-delay tripping can be selected if there will be momentary power reversals. Momentary reversals can occur from closed transition load transfers between the medium-voltage network bus and emergency generators, or if generation is run in parallel with the medium-voltage spot network, as discussed in Closed Transition Switching & Distributed Generation. Other features found in the microprocessor network relays, such as protective remote close and anti-pump settings, can be utilized in the medium-voltage spot network.
For control of automatic reclosing of the network breaker, either the circle or straight-line close characteristic can be selected, as described in Network Relay Close Characteristics. When supplied from dedicated HV feeders with the HV feeders coming from the same substation with closed HV bus-tie breakers, the circle close characteristic is preferred. The overvoltage close setting of the network relay is made such that when a network breaker is open, it automatically recloses when the load on the “in-service” network transformers is above the value needed for stable operation. See Phasing Voltages In Spot Networks which discusses factors to evaluate when selecting the V0 zero-degree close setting for network relays in low-voltage spot networks, and factors affecting the network load at which a network protector trips, and automatically closes under unfaulted conditions. These same factors should be considered when making network relay trip and close settings in medium-voltage spot networks.
Rolled and Crossed Phase Conditions
When a HV primary feeder to a medium-voltage spot network is removed from service for work or cable splicing, following restoration, HV primary phases can be inadvertently rolled or crossed. At the open network breaker in the medium-voltage spot network, where phases are rolled or crossed on the HV side, many network relays that control the network breaker, all electromechanical relays, and some microprocessor relays make their trip contact. It is recommended that the control circuit for the medium-voltage network breaker be designed such that with breaker open and the network relay trip contact made (from rolled or crossed phases), it is not possible to manually close the network breaker with the network breaker control switch.
Faults Downstream of Network Breakers
Although many 208Y/120-volt and 480Y/277-volt spot networks operate without a means for tripping the network protectors for “downstream faults”, such an approach is not acceptable in medium-voltage spot network systems. First, there are no network protector fuses in the medium-voltage spot network that will clear bolted faults in the MV system. Second, the probability of a fault in the medium-voltage system and equipment self-clearing, as possible in LV systems, is extremely small. For faults downstream of the network breaker and ahead of the MV feeder breakers in the medium-voltage spot network in Figure 1, (faults on the network bus), the network breakers must be tripped and locked out.
In Figure 1 and in the discussion that follows, it is assumed that only phase time-overcurrent and phase instantaneous current relays are used in the network breakers. However, ground relays also might be applied, and when applied, must be selectively coordinated with the ground relays at the substation for the HV primary feeder if the network transformers have the grounded-wye connections for both the HV and MV windings. For faults downstream of the network breakers, on the network bus:
-
The phase time-overcurrent relays for the network breaker must be faster than the phase time-overcurrent relays for the HV primary feeder breaker at the substation. When phase relay coordination is being evaluated, the effect of load currents and the position of the medium-voltage network breakers (open or closed) supplied from the HV primary feeders must be considered when determining if selective coordination exists between phase relays for the MV network breaker and the HV feeder breaker.
-
If the network transformers supplying the medium-voltage spot network are connected grounded-wye on both the HV and MV sides, the phase overcurrent relays applied with the medium-voltage network breaker must be selectively coordinated with the ground relay for the HV primary feeder breaker at the substation. With the delta grounded-wye connections for the network transformers, faults in the medium-voltage system give minimal ground current in the HV primary system, and coordination with HV primary feeder ground relays usually is not an issue.
An example of the coordination, with wye-wye connected network transformers, between the medium-voltage network breaker phase time-overcurrent relay and the ground relay for the HV primary feeder at the substation is illustrated in Figure 3 for one installation. The network transformers in the four-unit medium-voltage spot network are rated 2000 kVA, with the HV primary system voltage being 34.5 kV and that of the medium-voltage spot network being 4.16 kV. The primary feeders at the substation have phase time-overcurrent relays, phase instantaneous current relays, and a ground time overcurrent relay.

Figure 3:
Illustration of coordination between the medium-voltage
network breaker phase time-overcurrent relays, and HV primary feeder
ground relay for faults in the medium-voltage system.
The ground time overcurrent relay for the HV feeder breaker is faster than the phase time-overcurrent relay for the HV feeder breaker, so only the HV feeder ground relay time-current characteristics are plotted in Figure 3, with the solid green-colored curve. The time-current characteristics of the 4 kV network breaker phase relays are plotted in Figure 3 with the solid red-colored curves, where the heavy-weight curve gives the relay time, and the light-weight curve is the relay time plus the breaker time, taken as 6 cycles. A ground time overcurrent relay is not applied with the MV network breaker. All curves are plotted versus current on the 4.16 kV side.
Also shown on Figure 3 with the dashed vertical red-colored line is the minimum phase current in the 4 kV network breaker for the single line-to-ground (SLG) fault on the 4.16 kV bus in Figure 1, and with the vertical dashed green-colored line the maximum residual current in the 34.5 kV HV feeder breaker at the substation, referred to the 4.16 kV side. The curves in Figure 3 show that, for faults in the 4.16 kV system downstream of the network breaker, the network breaker is selectively coordinated with the HV feeder breaker at the substation.
With reference to Figure 1, the breakers for the radial feeders in the medium-voltage spot network will also have phase time-overcurrent relays. The time overcurrent relays applied with the network breaker, with time current characteristics shown with the red-colored curves in Figure 3, should be selectively coordinated with the time overcurrent relays for the medium-voltage feeder breakers, which are not shown in Figure 3. When analyzing the coordination, recognize that the total fault current, and the ratio of the current in the HV feeder breaker at the substation to the current in the medium-voltage network breaker, is a function of the number of closed network breakers.
Faults on Network HV Primary Feeder
With a fault on the network HV primary feeder, as illustrated in Figure 4, where the breaker for the faulted HV primary feeder 1 is open, HV BKR.1, the current in the backfeeding network breaker is shown as INB1, and the currents in the network breakers on the unfaulted feeders are shown as INB2, INB3, and INB4. The corresponding currents in the HV primary feeders are shown as IHV2, IHV3, and IHV4. In determining these currents, the effects of loads on the medium-voltage spot network, and on any low-voltage networks supplied from the HV primary feeders, should be accounted for. These currents are needed to evaluate coordination for different fault conditions.

Figure 4:
Medium-voltage spot network with backfeed to fault on HV
primary feeder 1 with breaker for faulted HV feeder open.
Normal Operations for Faults on HV Feeder
With equipment functioning properly, the network relay in backfeeding network breaker NB1 in Figure 4 should trip the backfeeding network breaker before other time overcurrent relays can time out. The network relay, which typically would have a sensitive trip time of 6 cycles or less, must be faster than the time overcurrent relays applied with the backfeeding MV network breaker, NB1, at the maximum value possible for backfeed current INB1. At the maximum backfeed current, the operating time of the time overcurrent relay in backfeeding network breaker (NWK BKR 1) should not be less than about 0.7 seconds to assure coordination with opening of NB1 thru the network relay. The reason this is important is that if NWK BKR 1 trips through its time overcurrent relay for a fault on the HV primary feeder, it will lock out network breaker NWK BKR1 and it could not reclose when faulted HV feeder 1 is restored to service.
With reference to Figure 4, under maximum backfeed current, if the backfeeding network breaker NWK BKR 1 opens through the network relay before its time overcurrent relay seeing current INB1 can time out, then the time overcurrent relays for the other network breakers, NWK BKR 2, NWK BKR 3 and NWK BKR 4 will not time-out as they see lower current than backfeeding network breaker NWK BKR 1. The only situation where a phase time overcurrent relay on a medium-voltage network breaker could be faster than the time overcurrent relay on the backfeeding network breaker is in a two-unit medium-voltage spot network, or in any spot network if only two MV network breakers are closed at time of the fault on the HV primary feeder. However, with the operating time of the time-overcurrent relay on the backfeeding network breaker being no less than about 0.7 seconds, the microprocessor network relay with sensitive trip time of 6 cycles is still faster than the time overcurrent relays on the MV network breakers supplied from the unfaulted HV primary feeders.
If the network transformers are connected wye-grounded wye-grounded, and ground time overcurrent relays are applied on the network breakers, their operating time at the maximum backfeed current should also be no less than about 0.70 seconds. Also, with reference to Figure 1, with the wye-wye connections for the network transformers, the ground relays for the HV primary feeder breakers at the substation, HV BKR 2, HV BKR 3, and HV BKR 4 should not time out for a fault on HV FDR 1 with the breaker for faulted HV feeder1, HV BKR 1, open.
Network Relay Failure In Backfeeding Network Breaker
If the network relay fails to make its trip contact for a fault on the HV primary feeder, the backfeeding network breaker will not trip through the network relay. In the conventional LV spot network, backup protection for failure of the network relay is with network protector fuses, as discussed in Network Unit Equipment. In the MV spot network, backup protection for failure of a network relay is provided by the phase time-overcurrent relays on the MV network breakers. These relays also detect faults in the MV system downstream of the network breakers, as discussed in Faults Downstream of Network Breakers.
With reference to Figure 4, the backfeed current in network breaker INB1, for a fault on high voltage feeder 1, HV1, is greater than the current in the MV network breakers supplied from the unfaulted HV primary feeders, currents INB2, INB3, and INB4. Whenever a time overcurrent relay for a network breaker times out, it must both trip and lockout the backfeeding network breaker. In contrast, when the network breaker trips through the network relay, it is not locked out, and auto closing through the network relay is allowed.
Backfeeding Network Breaker Failure To Trip
In the medium-voltage spot network, protection should also be provided if the backfeeding MV network breaker fails to open. If both the network relay and the time over current relays for the backfeeding MV network breaker make their trip contacts and the backfeeding network breaker fails to open, then the time-overcurrent relays for the MV network breakers supplied from the unfaulted HV primary feeders will time-out, trip and lockout their respective network breakers to clear the backfeed. The time for this to occur can be rather long, because the current in the MV network breakers on the unfaulted HV feeders, NB 2, NB3, and NB 4 can be much lower than the current in the backfeeding MV network breaker. For example, in the four-unit spot network in Figure 4, the current in each MV network breaker on the unfaulted HV feeders, INB2, INB3, and INB4, is approximately one-third of that in the backfeeding network breaker, INB1.
Whenever a MV network breaker on an unfaulted HV feeder trips through its time-overcurrent relay for failure of the backfeeding MV network breaker to open, the MV network breakers on the unfaulted HV primary feeders must be locked out. In Figure 4, with NWK BKR 1 failing to open under a high-current backfeed, opening of NWK BKR 2, NWK BKR 3, and NWK BKR 4 de-energizes the spot network bus and clears the backfeed to the fault on HV feeder 1. After the network breakers on the unfaulted HV feeders open, a dead network condition is created, and the network relays at the open network breakers fed from the unfaulted HV primary feeders will make their close contacts (thru dead network logic). If the network breakers were not locked out when tripping through their time-overcurrent relays, the MV network breakers would close, energize the network bus, and backfeed the fault on primary feeder 1 through the network breaker that failed to open on backfeed. The network breakers on the unfaulted feeders would trip open again, and the cycle would repeat. Repetitive closing back into the fault could produce catastrophic results.
Network Breaker Phase Relay Coordination
The coordination between the phase time-overcurrent relays for the backfeeding 4-kv network breaker, and the phase relays for the HV feeder breaker at the substation is shown in Figure 5.
The curves are for the same system parameters that apply to the time-current curves in Figure 3. Shown for both the 4-kV backfeeding network breaker, and the feeder breaker for an unfaulted 34.5 kV feeder, is the range for the current in each breaker. The subject 34.5 kV feeders supplied not only the 4 kV medium-voltage spot network, but also conventional low-voltage spot networks.
When all low-voltage network protectors supplied from the 34.5 kV feeders are closed, and the feeder breaker for the faulted 34.5 kV feeder is open, the backfeed current in the 4-kV network breaker is minimum, show as 2444 amperes at 4.16 kV. However, the phase currents in the 34.5 kV breakers for the unfaulted feeder are maximum, being 16,735 amperes @ 4.16 kV. As the low-voltage network protectors supplied from the faulted 34.5 kV feeder sequence open, the current in the backfeeding 4 kV network breaker increases, with the maximum being 3487 amperes, and the current in each 34.5 kV feeder breaker decreases significantly, with the minimum being 4685 amperes at 4.16 kV.

Figure 5:
Phase relay coordination for network breaker and 34.5 kV
primary feeder breaker.
At worst-case conditions, the 4-kV network breaker backfeeding the fault is faster than the phase relay for the 34.5 kV breaker for an unfaulted HV feeder. From Figure 5, at the maximum current in a 34.5 kV feeder breaker for an unfaulted feeder, the phase relay time is about 1.7 seconds. And at the minimum backfeed current in a network breaker on the faulted feeder the phase relay time is about 0.9 seconds. In Figure 5 , the heavy red curve gives the network breaker phase relay time, and the light-weight red curve is the relay time plus 6 cycles (0.10 second) for breaker time.
Thus, if the network relay in the backfeeding 4-kV network breaker fails to make its trip contact, the phase time-overcurrent relay for the backfeeding 4-kV network breaker will trip the backfeeding network breaker before the feeder breaker for the unfaulted 34.5 kV feeders can trip. Similarly, the backfeeding 4-kV network breaker will trip before the time-overcurrent relays for the 4-kV network breakers connected to the unfaulted 34.5 kV feeders can time out.
However, if the backfeeding 4-kV network breaker fails to open when trip signals are issued from both its network relay and its phase time-overcurrent relay, then it is desired that the 4-kV network breakers supplied from the unfaulted HV feeders trip through their phase time-overcurrent relays. This should occur before the phase time-overcurrent relays for the 34.5 kV feeder breakers for the unfaulted feeders can time-out and trip their breakers.
Further, should the backfeeding 4-kV network breaker fail to open, most if not all low-voltage network protectors, also supplied from the faulted 34.5 kV primary feeder, would open within several tenths of a second. With the low-voltage network protectors open, as shown by the current range arrow in Figure 5, the currents in the feeder breakers for the unfaulted 34.5 kV feeders drop below the pickup of their phase time-overcurrent relays.
With all low-voltage network protectors open on the faulted 34.5 kV feeder, and the backfeeding 4-kV network breaker closed, Figure 6 plots the time-current characteristics for the phase relay on each 4 kV network breaker. Shown with the dashed vertical lines originating at 0.01 seconds are the currents in the backfeeding 4-kV network breaker for the three-phase fault with either two (green line), three (brown line) or four (purple line) 4-kV network breakers closed, and the infeed current in each 4-kV network breaker supplied from an unfaulted 34.5 kV primary feeder with the solid lines.
With all four 4-kV network breakers closed, the current in the backfeeding 4-kV breaker is 3487 amperes, and in each 4-kV breaker connected to an unfaulted feeder, the infeed current is only 1164 amperes. At this current, the time for the 4-kV network breakers on the unfaulted HV feeders to trip is about 4 seconds. That is, if the backfeeding network breaker fails to trip, backup clearing time is about 4 seconds.
Faster breaker failure clearing time can be achieved with a second time-overcurrent relay, 51-BFϕ, applied with each 4-kV network breaker, as shown in Figure 7, set to coordinate with the time overcurrent relay installed to trip only its own network breaker. Time overcurrent relay 50/51ϕ trips and locks out only its own network breaker. Time overcurrent relay 51-BFϕ, which is for breaker failure, initiates trip and lockout of all other network breakers in the medium-voltage spot network. Both time overcurrent relays see the same current. They can be coordinated such that 51-BF times out only if its breaker fails to open through 50-51ϕ.
If the backfeeding 4 kV network breaker does not trip through its network relay or its time overcurrent relay, then breaker failure time-overcurrent relay 51-BF in Figure 7 times-out, operates lockout relay 86-BF, which initiates trip and lock-out of the three 4 kV network breakers supplying infeed current from the unfaulted HV primary feeders. This can result in significantly faster clearing time for network breaker failure when all four network breakers are closed, as shown by the time-current curves in Figure 8. In Figure 8, the time-current characteristic of the breaker failure relay, 51-BF, is shown with the dashed red colored curve.
With all four network breakers closed, 51-BF will clear the backfeed in about 1.3 seconds, versus 4 seconds without the breaker failure overcurrent relay.

Figure 6:
Phase relay characteristics for network breaker with
backfeed and infeed currents.
If the backfeeding 4 kV network breaker does not trip through its network relay or its time overcurrent relay, then breaker failure time-overcurrent relay 51-BF in Figure 7 times-out, operates lockout relay 86-BF, which initiates trip and lock-out of the three 4 kV network breakers supplying infeed current from the unfaulted HV primary feeders. This can result in significantly faster clearing time for network breaker failure when all four network breakers are closed, as shown by the time-current curves in Figure 8. In Figure 8, the time-current characteristic of the breaker failure relay, 51-BF, is shown with the dashed red colored curve.
With all four network breakers closed, 51-BF will clear the backfeed in about 1.3 seconds, versus 4 seconds without the breaker failure overcurrent relay.
Grounded-Wye Grounded-Wye Network Transformers
When the network transformers have the grounded wye connections for both the HV and MV windings, a ground fault on the primary feeder also causes ground fault currents (zero-sequence currents) on the unfaulted primary feeders until the backfeeding medium-voltage network breaker opens. It also causes ground currents in the medium-voltage system, being the 4-kV system, in the examples cited herein. This must be considered when setting the phase time-overcurrent relays for the network breakers, and the ground time-overcurrent relays if applied with the network breakers.

Figure 7:
Use of inverse time-overcurrent relay to provide breaker
failure protection for faults on HV feeder.

Figure 8:
Time current curves with breaker failure protection
provided with second set of phase time-overcurrent relays on each
network breakers.
With the delta grounded-wye connections for the network transformers, this is not an issue, because ground faults on the HV primary feeder give virtually no ground current on the unfaulted HV primary feeders, and in the network breakers on the medium-voltage side.
Also shown in Figure 8 with the solid purple, brown, and green-colored vertical lines are the maximum infeed currents in the network breakers on the unfaulted feeders when there are respectively 4, 3, and 2 network breakers closed during the fault on one HV primary feeder. The dashed vertical purple, brown, and green lines show the maximum backfeed current in the network breaker connected to the faulted HV primary feeder. From this information, as long as three or four network breakers are closed when a fault occurs on the HV primary feeder, and the backfeeding network breaker fails to open, the breaker failure relay on the backfeeding network breaker will time out, and trip the network breakers supplied from the unfaulted HV primary feeders. If only two network breakers are closed at the time of fault on the HV primary feeder, and the backfeeding network breaker fails to open, the 4 kV network breaker supplied from the unfaulted HV primary feeder will open through its own 50/51relay before the breaker failure relay on the backfeeding network breaker times out (current for this condition shown by the vertical solid and dashed green lines in Figure 8. network breakers are closed at the time of fault on the HV primary feeder, and the backfeeding network breaker fails to open, the 4 kV network breaker supplied from the unfaulted HV primary feeder will open through its own 50/51 relay before the breaker failure relay on the backfeeding network breaker times out (current for this condition shown by the vertical solid and dashed green lines in Figure 8.
Network Breaker Control Circuits
Shown in Figures 9 and 10 are some elements of breaker control circuits for tripping the network breaker, and for closing the network breaker respectively, to help illustrate the operation of the network breaker for faults in the medium-voltage system, and for faults on the HV primary feeders. The tripping control circuit in Figure 9 is for one of the network breakers, assuming there are four network breakers in the medium-voltage spot network. It is assumed that the network relay for each medium-voltage network breaker is the type MPCV microprocessor relay.
Normal Operation
Under normal conditions, the tripping and auto closing of the network breaker are controlled by the MPCV trip and close contacts, MPCV/T and MPCV/C shown in Figure 9. With the network breaker initially closed, the making of the MPCV trip contact, MPCV/T, energizes the breaker shunt trip coil, 52/TC, and the network breaker opens. This could occur if the circuit breaker for the HV primary feeder at the substation were opened in absence of a fault, from circulating currents at light load on the medium-voltage spot network, or if the circuit breaker for the HV primary feeder opened for a fault on the primary feeder. From Figure 9, the network breaker can also be tripped manually through the breaker control switch, shown as CS/T in Figure 9.
Figure 10 shows a portion of the network breaker close control scheme. After the network breaker opens through the network relay (MPCV/T), or if the network breaker opens through the breaker control switch, CS/T, it can be closed with the breaker control switch, CS/C in Figure 10, providing phases have not been rolled or crossed on the HV primary side of the open network breakers. Or it will close through the MPCV relay close contact, MPCV/C, if the relay close characteristics are satisfied.

Figure 9:
Portion of network breaker control circuit for tripping.

Figure 10:
Portion of network breaker control circuit for closing.
But if phases are rolled or crossed while the network breaker is open, the MPCV relay trip contact, MPCV/T, in Figure 9 is made, which energizes the operating coil of the rolled and crossed phase auxiliary relay (CRP) through the network breaker “b” contact, 52/b. This in turn opens the normally closed contact or CRP that are in series with control switch close contacts, CS/C in Figure 10, which prevents manual closing of an open network breaker with the breaker control switch if when phases are rolled or crossed.
It should be noted that if the network breaker is open, and three-phase ground is applied to the HV primary feeder, the MPCV relay trip contact, MPCV/T, is also made, which energizes CRP in Figure 9, and the network breaker can not be closed with the breaker control switch as the CRP contacts in the closing circuit of Figure 10 are open.
With no abnormal conditions at the open network breaker, if the MPCV relay makes its close contact, MPCV/C, in Figure 9, auxiliar relay 67X is energized. This closes contacts 67X in the closing control circuit in Figure 10, and the network breaker closes, providing none of the breaker lockout relays (86-1) or (86-BF1) have operated. In Figure 10, control switch contacts CS/NAC close and remain close following manually placing the control switch handle in the closed position. The control switch CS/NAC contacts remain closed until the breaker control switch is manually put in the trip or open position, which opens contacts CS/NAC in Figure 10. Thus if the network breaker is tripped with the breaker control switch, CS/T, making of the network relay close contact, MPCV/C in Figure 9, which energizes 67X, closing contacts 67X in the closing circuit of Figure 10, but with CS/NAC open, the network breaker will not close.
Fault in Medium Voltage System Downstream of Network Breakers
With a fault in the medium-voltage system downstream of the network breaker and before a medium-voltage feeder breaker (See Figure 7), the network breaker phase time overcurrent relays, 50/51ϕ, time out. With reference to the tripping control circuit in Figure 9, when any of the phase time-overcurrent relay contacts close, lockout relay 86-1 is energized and seals itself in. When 86-1 is energized, it trips the network breaker through contacts 86-1 in Figure 9. In addition, reference to the closing control circuit in Figure 10 shows that this opens contacts 86-1 in the closing circuits and prevents manual closing of the network breaker, either through its control switch or through the network relay (closing of contacts 67X). All network breakers in the medium-voltage spot network respond in this fashion for a fault downstream and before a medium-voltage feeder breaker, thereby de-energizing the network bus, and preventing the network breakers from closing onto a “dead” network bus.
If a fault occurs on a MV network feeder fed from the network bus in Figure 7, only the breaker for the MV network feeder should open, assuming the time-overcurrent relays for the network feeder breaker are selectively coordinated with the time-overcurrent relays for the network breaker.
Fault on HV Primary Feeder, Network Relay Failure
For a fault on the network HV primary feeder where the network rely fails, the MPCV trip contact, MPCV/T, in Figure 9 does not make. Then one or more of the phase time-overcurrent relays (50/51ϕ) in the backfeeding protector times out and energizes lockout relay 86-1 and seals itself in. The normally open contacts of 86-1 in Figure 9 make to energize the breaker trip coil, 52TC, which trips the backfeeding network breaker. Figure 10, which is for the closing control of the network breaker, shows that operation of 86-1 opens the closing circuit of the backfeeding network breaker so that it can’t be closed with either the breaker control switch, CS/C, or through the network relay close contact (MPCV/C and 67X).
The time overcurrent relays in the network breakers supplied from the unfaulted HV primary feeders would not time out for this condition, they do not trip, and service is maintained to the load served from the medium-voltage network bus. An exception to this is in a two-unit medium-voltage spot network, where the time overcurrent relays on both network breakers see about the same current, and trip both network breakers to de-energize the network bus. A similar response occurs in two-unit low-voltage spot network if a backfeeding network protector fails to open. If a network protector fails to open on a high-current backfeed, the network protector fuses in both protectors can blow, causing a complete or partial outage to the network.
Fault on HV Primary Feeder, Failure of Backfeeding Network Breaker to Open
For a multi-phase fault on a HV primary feeder where the backfeeding network breaker fails to open, the phase time-overcurrent relays in the network breakers fed from the unfaulted primary feeders will time-out. When the time-overcurrent relays time-out, reference to Figure 9 shows that the breaker lockout relays, shown as 86-1 , will pickup and seal in, and the network breaker fed from each unfaulted HV primary feeder will trip. This de-energizes the network bus and the network relay in each network breaker supplied from an unfaulted primary feeder makes its close contact(MPCV/C) for the “dead network condition.” This energizes relay 67X in Figure 9. However, from the close circuit of Figure 10, the network breakers fed from unfaulted primary feeders will not close with the normally open contacts of 67X being open, because operation of lockout relay 86-1 opens the closing circuit with the normally closed contact of 86-1. Closing of the network breakers supplied from unfaulted HV primary feeders is possible only after the 86-1 lockout relay is manually reset.
Clearing a fault on a HV primary feeder, due to failure of a backfeeding network breaker, with the phase time-overcurrent relays for the network breakers fed from unfaulted HV primary feeders can require an excessively long time as discussed before. This is because they see only one third or one half of the current in the backfeeding MV network breaker. If a breaker failure time-overcurrent relay is incorporated with each network breaker, 51-BF in Figure 7 and Figure 8, faster clearing is possible. With reference to Figure 9, if the breaker failure relay for the backfeeding network breaker makes its contacts, shown as 51/BF1, this energizes lockout relay 86-BF1. The normally open contacts of lock-out relay 86-BF1 are in the tripping control circuits of the other MV network breakers fed from unfaulted HV primary feeders. The 86-BF1 contacts are in parallel with the contacts of the phase time-overcurrent relays, and their closing trips and locks-out the network breakers fed from the unfaulted HV primary feeders.
Similarly, as shown in Figure 9, if the breaker failure relay for any other backfeeding network breaker times out, it will trip and lock-out network breaker 1, through either contacts 86-BF2, 86-BF3, or 86-BF4, depending on which network breaker failed to open for backfeed to a multi-phase fault on the HV primary feeder. Manual reset of 86-1 is required before the backfeeding breaker which failed to open can be closed. In Figure 9, this is accomplished with the reset push button (RPB).
Summary
The intent of Chapter 13 is to identify major issues to consider in designing and protecting medium-voltage spot networks. The operation of the system for faults on the HV primary feeders is similar to that for low-voltage spot networks. After the breaker for the faulted HV primary feeder opens, the network relay in the network breaker detects the fault, and the network breaker opens.
This isolates the fault, and, the network load continues to be supplied from the unfaulted HV primary feeders. However, in the medium-voltage spot network, the network breakers must be tripped for faults downstream of the network breakers and ahead of the medium-voltage feeder breakers fed from the paralleling bus, as such faults will not be self-clearing. Furthermore, if the network breaker fails to open for a high-current backfeed to a fault on the HV feeder, the breaker failure relay initiates trip and lockout of all network breakers fed from the unfaulted primary feeders.
Different fault conditions that must be studied to evaluate HV primary feeder breaker coordination with the network breaker relay coordination were identified. Included were examples to illustrate the coordination of MV network breaker nondirectional time overcurrent relays and HV primary feeder relays for faults at different locations in the system, and a design for the major control circuits that produce the desired responses. In particular, backup protection must be provided if the MV network breaker supplied from the faulted HV primary feeder fails to open. In the conventional low-voltage spot network, the backup protection is provided with the network protector fuse. In the medium-voltage spot network the backup protection is provided with a breaker failure time overcurrent relay, shown as 51 BF1 in Figure 9, with time-current characteristic shown by the dashed red curve on the time-current characteristic in Figure 8. Operation of the breaker failure relay trips and locks out all other network breakers, and causes an outage to the medium-voltage spot network
The relay and protection departments at each utility with a medium-voltage spot network may have different protection philosophies, preferences for relay types, and design practices for breaker control circuits. This is why protective relaying is frequently referred to as both a science and an art. Although there is commonality in protection practices used in low-voltage spot networks, this is not true for the protection applied in medium-voltage system.
4.14 - Closed Transition Switching and Distributed Generation
CLOSED TRANSITION SWITCHING AND DISTRIBUTED GENERATION
Low-voltage network systems operate best when load levels are relatively high, with the potential for operating problems, such as network protectors cycling, pumping, or sitting open, at the lower loading levels. The effect of adding distributed generation (DG), sometimes referred to as distributed resources (DR) to either the spot network or the grid network is to lower the loading on the system. Furthermore, when generation is added to the low-voltage network, it increases the possibility of forming an island and creating conditions for which the network protector and network relays that control the network protector were not intended. In most situations, addition of DG to low voltage networks can’t enhance their operation, but can have negative impacts on operation. This section identifies issues associated with applying distributed generation to low-voltage spot and grid networks.
Types of Generation
The basic types of generation that may be in user systems supplied form low-voltage secondary networks are the inverter, the induction generator, and the synchronous generator. The energy source for the generation will, in many cases, determine the generation technology. Some technologies can be employed for the full range of energy sources, whereas others may be restricted to a specific type of prime mover. The three types of electric power generation technology are discussed below.
Inverter
Inverters convert dc power to ac power, synchronized to the secondary system voltage. They allow batteries and other dc sources to connect to the ac power system. Inverters are typically configured to provide a power output at a pre-set power factor consistent with the energy available from the energy source employed as input. Inverter power output is controlled to make optimum use of the energy source, particularly with variable resources such as photovoltaic or wind energy systems. Inverter fault current contribution is typically limited to 125% or less of rated current. For a system fault, inverters with adjustable clearing times may be capable of disconnecting within one to two cycles. Output voltage is determined by the electric power system (EPS) bus with which it is interconnected. Inverters may be islanding (capable of providing sustained output energy in absence of an external connection to an alternating current energy source) or non-islanding (designed to cease providing output energy within some fixed time from separation from an alternating current energy source, typically the Area EPS).
Induction Generator
An induction generator requires interconnection to an energized ac system to produce power. Induction generation is derived from an induction motor driven by a prime mover such as an engine or by a wind or hydro turbine. Without the presence of an excitation source (the area EPS or capacitance from power factor correction capacitors and/or underground cables), most induction generators will not produce any significant power output. The induction generator has limited capability to produce fault current. Without an external excitation source, the bolted fault current contribution from an induction generator could be as high as 700% of rated current, but will decay to a negligible value in 10 cycles. The actual fault current magnitudes and durations are a function of the machine characteristics, circuit characteristics, available capacitance, fault impedance, and the available voltage prior to the fault.
Synchronous Generator
A synchronous generator has an excitation source and will produce an electric output either interconnected with an EPS or isolated from it. For that reason, the controls of the machine must include the means to synchronize the generator to the EPS prior to interconnection. This will include systems to control the output voltage and the frequency (speed) of the synchronous generator. When interconnected with the EPS, synchronous generator controls regulate the power factor and prime mover loading (generator electric power output) to desired values. In accordance with IEEE Std 1547-2003 (IEEE 2003), when the DR is connected with the Area EPS, it shall not regulate voltage. Also, the DR shall not export power through any network protector.
Synchronous generators on the order of 5 MW or less may provide a fault current contribution of 6 to 10 times rated output current. The fault current value may decrease to less than 40% of the initial fault value within four cycles of the initiation of the fault and reduce to 300% or less of rated full load output for up to 10 seconds. Typically, synchronous generators are designed to withstand 300% of rated current for 10 seconds.
Closed Transition Load Transfers with Synchronous Generators
Although spot networks provide extremely reliable service, there is a finite probability of a total outage occurring if the entire secondary network system must be dropped, or if there is an outage of the substation supplying the spot network. Some critical loads, such as data centers and communication facilities, require that emergency generation be installed to supply critical loads should the utility supply fail. This requirement is frequently accomplished with synchronous generation that is interfaced to the normal supply system with transfer switches. Reference the discussion in Time Delay Tripping of Network Protectors on time delay tripping of network protectors, and in particular Figures 34, 35, and 36 of Network Protector Relaying for examples of schemes with transfer switches.
Most operating protocols require that the emergency generation be periodically tested to confirm that it will operate properly in a true emergency. During testing, the loads are transferred from the spot network to the emergency generation, and then transferred back to the spot network supply. Closed transition transfer switches are employed to prevent momentary outages to the load during the testing, as in Figure 34 of Network Protector Relaying, repeated here as Figure 1. If network protectors in the spot network are not properly controlled, all network protectors can trip during momentary paralleling, and form an island, creating conditions for which the network protectors and network relays were not intended.

Figure 1:
Critical loads on closed-transition transition transfer
switches supplied from spot network
In one highly reported incident that occurred in the southwestern part of the United States in February of 1991, testing of an emergency generation system on a 480-volt spot network resulted in a failure of a 480-volt network protector during closed-transition switching. Extensive damage resulted to the utility network as the fault in the 480-volt protector was in the ”unprotected zone” as shown in 480-volt-spot-network, Figure 2 and Figure 19. This Chapter identifies conditions that can form an island during closed transition switching, and measures that minimize the probability of island formation during such switching.
Transfer from Network to Emergency Generators
Figure 2 shows an example system to illustrate and discuss problems and solutions when closed-transition switching (momentary paralleling) takes place between the spot network and the emergency generators. Normally all load is supplied from the spot network, with all network protectors in the closed position as in Figure 1. When the emergency system is tested, the generators are brought on line and load transferred in blocks from the spot network to the emergency generators with closed transition switching. With reference to Figure 1, load P1 + jQ1 is transferred to the emergency generation by closing transfer switch S1-E, and then opening of transfer switch S1-N. In some systems, the transfer is done passively in that the transfer switch control does not regulate the speed or excitation of the synchronous generation. The transfer switch will make the parallel if:
-
The magnitude of the voltages on the opposite sides of the open transfer switch do not differ by a specified limit, frequently +/- 5%.
-
The angle between the voltages on the opposite sides of the open transfer switch does not exceed a specified limit, frequently +/- 5 degree.
-
The slip frequency between the two systems on opposite sides of the switch does not exceed a specified limit, frequently 0.20 Hz.
With modern transfer switches, the duration of the parallel of the two systems is typically limited to 100 ms (6 cycles). If there is a failure of the transfer switch opening to break the parallel, the parallel connection is opened in 500 ms (30 cycles) be opening of a backup breaker, or opening of the transfer switch that closed to make the momentary parallel. With the temporary parallel made passively, it is possible that the generator voltage angle would be leading the network side voltage angle, and a reverse power would occur in the network protectors. This could result in the tripping of all network protectors in the spot network and formation of an island. This must be prevented, and is accomplished by incorporating time-delay tripping in the protectors, as discussed in Time Delay Tripping of Network Protectors.
For example, when transferring load P1 + jQ1 in Figure 1 from the network to the generator bus, following making of Switch S1-E, switch S1-N would open within 100 ms to break the parallel connection. But if switch S1-N did not open, the parallel connection would be broken by either opening of switch S1-E, or opening of the breaker at the generator bus on the emergency side of transfer switch S1-E. As additional blocks of load are transferred from the spot network to the generators, load is removed from the spot network bus. Before all load is transferred to the generators, one or more protectors may open. The concern with passive switching is that, if the generator bus voltage is leading the spot network bus voltage when the momentary parallel connection is made, it may produce momentary power reversals in the network protectors. With the network protectors having just the sensitive reverse current trip characteristic, with a sensitive trip time of 3 cycles as in some microprocessor network relays, with the last protector to trip isolating two non-synchronized systems. This is a condition for which many network protectors are not rated. As mentioned before, this can be prevented if time-delay tripping is employed in the network protector relays.
The probability of tripping all network protectors is greatest, not when load is transferred from the network bus to the generator bus, but when transferred from the emergency generators back to the spot network bus. With the load being successfully transferred to the generator bus without tripping of all network protectors, the system configuration could be that shown in Figure 2. Depending on system configuration, all loads may not be transferred to the emergency generation during testing, where in Figure 2 P4+jQ4 remains connected to the spot-network bus.

Figure 2:
Critical loads transferred to the generator bus.
Transferring from Emergency Generation to Spot Network
With all critical load on the transfer switches supplied from the generator bus as in Figure 2, with the load on the spot network bus, P4 + j Q4 being miniscule, it is possible that all network protectors but one would be open. In Figure 2, the power flow in network protector 1(NWP 1) is into the network and it remains closed.
When the first parallel connection is made between the generator bus and the spot network bus, the generator bus voltage can be higher than the network bus voltage and leading by as much as 5 electrical degrees. During the momentary parallel lasting for 100 ms (6 cycles), this can cause a momentary reverse power flow in the closed protector as shown in Figure 3. The duration would be about 100 ms, the paralleling time. If the network protector does not have time delay tripping, with the sensitive trip time being 3 cycles, it will open and form an island. This could result in failure of the network protector when trying to separate two non-synchronized systems.
Consequently, opening of the only closed protector during closed transition switching must be prevented. Further, should the network bus remain energized with all protectors open, the network relays at the open protectors will experience the voltages of two non-synchronized systems, a condition for which they were not designed. The phasing voltage, VP, at the open network protector could swing into the relay close region defined in Figure 45 for the circle close characteristic, and in Figure 47 for the straight-line close characteristic in Network Protector Relaying. If the network relay makes its close contact when the two systems are not synchronized, the closing time of the network protector, between 0.5 and 5 seconds depending on protector type, could be such that when the protector arcing contacts close, the two systems on opposite sides of the protector could be sufficiently out of phase that equipment damage or failure occurs upon closure of the network protector.

Figure 3:
Transferring critical load P1+jQ1
back to network bus with closed transition switching.
The probability that an island will form by opening of all network protectors is highest when the first block of load is transferred from the generator bus to the spot network bus, as in Figure 3. When the first block of load is transferred, there may be no or very little load connected to the network bus, and with the generator bus voltage angle leading the network bus voltage, there will be a momentary reverse power flow in the closed protector. If there is some load on the network bus as in Figure 3 when the parallel is made, such as load P4+jQ4, it is less likely that a momentary power reversal will occur in the one closed protector.
As mentioned before, to prevent tripping should there be a momentary reverse power flow when the parallel connection is made for 100 ms (6 cycles), the network protectors must be equipped with time delay tripping, as described in Network Protector Relaying. The time delay setting must be greater than the maximum possible parallel time, which could be as high as 500 ms if there is a failure of a transfer switch. It is desired to keep the time delay as low as possible, so that during backfeed to a single line-to-ground (SLG) fault on the primary feeder with the feeder breaker open (delta wye-grounded network transformers), the energy into the SLG fault is minimized, which reduces the chance of the SLG fault propagating into a multi-phase fault. It is also desired to have the time-delay setting as low as possible so that when the primary feeder is removed from service in absence of a fault, the time for the feeder to go dead on backfeed is low.
When time delay tripping is used, as discussed in Network Protector Relaying, an instantaneous current setting is made to bypass the time delay for high-current backfeeds during multi-phase faults on the primary feeder with the feeder breaker open, as discussed in Time Delay Tripping of Network Protectors. of Chapter 10. The instantaneous current setting must be above the current associated with the momentary backfeed current during paralleling. The current during the momentary paralleling is best found with detailed simulation with software where the dynamics of the synchronous generators are modeled.
Momentary Current in Network Protector during Paralleling
However, a conservative estimate of the current in the network protector during momentary paralleling can be made with the aid of the simplified circuit in Figure 4 (a), where only one network protector is closed, and there is no load connected to the spot network bus. This configuration represents the situation when the first block of load is transferred from the generation bus back to the spot network. Transferring the first block of load back to the spot network is the worst-case situation. If this is accomplished successfully under worst-case voltage magnitude and angle conditions at the transfer switch, then transferring of subsequent blocks of load should not result in protector tripping, because some load is then connected to the spot network paralleling bus.
In Figure 4, VGS and VNS are the voltages, respectively, on the generator side and network side of the open transfer switch as shown. The difference in the magnitude of these two voltages, ∆VTS%, in percent of the voltage on the network side is given by eq. (1). This magnitude difference is one of the parameters that some transfer switches monitor before allowing closure, with the limit being +/-5% at time of transfer switch contact closure.
(1)
$$ \ \ \ \Delta V_{TS ﹪ } = \frac{100(|V_{GS}| - |V_{NS}|)}{|V_{NS}|} ﹪ $$
From eq (1), when VGS is greater in magnitude than VNS, ∆VTS% is positive in sign, and vice-versa.

Figure 4:
Simplified circuit for estimating the current in the
network protector during momentary paralleling with synchronous
generators
Knowing at the open transfer switch ∆VTS%, and the angle between voltages VGS and VNS on opposite sides of the open switch, angle θ, the magnitude of the voltage across the open switch, shown as VOS in Figure 4 (a), is given by eq. (2) in percent.
(2)
$$ \ \ \ |V_{OS ﹪}| = 100\sqrt{2(1 - \cos{\theta})(1 + \frac{\Delta V_{TS ﹪}}{100}) + (\frac{\Delta V_{TS ﹪}}{100})^2} ﹪ $$
In this equation, positive values for angle θ mean that voltage VGS leads voltage VNS. In general, when the voltage on the generator side of the open transfer switch leads the voltage of the network side when the parallel connection is made, there can be a momentary reverse power flow in the network protector. In contrast, when voltage VGS is lagging voltage VNS, the real power flow in the closed protector when the parallel connection is made will be into the network, and the network protector will not trip.
Figure 5 plots eq. (2) versus ∆VTS% for angular differences, angle θ of 1o through 5o. Whether VGS is leading or lagging VNS by a specified angle has no effect on the magnitude of the voltage across the contacts of the open transfer switch, VOS, but it does affect the direction of the momentary real power flow during the paralleling.
As shown in Figure 4 (a), the magnitude of the current in the network protector during the momentary paralleling can be estimated from the compensation theorem. This theorem basically states that the voltage at the open transfer switch, VOS, is rotated 180o and applied to the circuit with all other voltage sources set to zero, to find the change in current in the network protector and in the transfer switch due to the paralleling. Because there is no current in the network protector prior to paralleling, the change in current is the total current in the protector during paralleling. Also, with only one network protector closed, the current in the transfer switch and in the protector are the same.

Figure 5:
Magnitude of voltage across the open contacts of the
transfer switch, ІVOS%І.
An upper bound is needed for the current in the closed network protector, so that the network relay can be set to not trip on the momentary reverse power flow. The network relay’s instantaneous current setting, IINST, must be set above the upper bound on the protector current during momentary paralleling. The upper bound on the protector current can be found by assuming, as in Figure 4, that the only impedances limiting the current are those of the network transformers and the generator(s), taking the sub-transient reactance for the generator(s). The impedance of the low-voltage circuits between the transfer switch and the generators in Figure 4, and the impedance of the circuits between the transfer switches and the network protector will further limit the current.
Equation (3) gives the upper bound on the current in the network protector in percent of protector current transformer (CT) rating during the paralleling.
(3) $$ \ \ \ I_{NWP ﹪} \frac{\frac{100}{N} |V_{OS ﹪}|}{ \frac{Z_{T ﹪}}{N} + jX’’_{d ﹪} \frac{KVA_{T}}{KVA_{G}} } \frac{I_{XFR}}{I_{NWPCT}} ﹪ \enspace of \enspace CT \enspace Rating $$
In eq.(3), the terms are as follows:
ZT% = network transformer impedance in % on the transformer nameplate rating
Xd%” = sub-transient reactance of the generator on its own kVA rating.
KVAT = kVA rating of the network transformer
KVAG = kVA rating of the generator.
IXFR = rated secondary current in amperes of the network transformer at its rated kVA.
INWPCT = rated primary current in amperes of network protector CT.
N = number of closed network protectors in the spot network at time of paralleling.
From Figure 5 or eq (2), voltage VOS that drives the current during paralleling is maximum when ∆VTS% is +5%, and angel θ is +5o. At these values, ІVOSІ is 10.24%.
Figure 6 plots, for a spot network with 1000 kVA network transformers, the upper bound on the current in the protector and transfer switch in percent of protector CT rating, versus the generator size on the abscissa, when just one protector is closed during the paralleling, as would occur when the first block of load is transferred back to the spot network. Curves are given for generator sub-transient reactance of 10% or 20% on the generator rating. Equation (3) shows that when more than one network protector is closed at paralleling, the total current in the transfer switch is higher, but current in each closed protector is lower.

Figure 6:
Network protector current in % of CT rating for 1000 kVA
transformers with one closed network protector.
For each value of sub-transient reactance Xd”, two curves are plotted. The lower or solid curve assumes that the network transformer leakage impedance is purely inductive (X over R ratio is infinite), and the upper or dashed curve assumes that the X over R ratio is 3 which is about the lowest expected value. Clearly, with one closed protector, the setting of the instantaneous current relay to bypass the time delay must be increased when the generator capacity increases. But for the parameters shown in Figure 6, the pickup of the instantaneous current, IINST, for microprocessor relays can be set above the maximum momentary current during paralleling. For most network relays, the instantaneous setting can be as high as 250% of protector current transformer rating (See Figure 31 in Network Protector Relaying).
Measures to Reduce Likelihood of Protector Tripping
Several measures may be used to reduce the probability of forming an island when transferring load from the generators back to the spot network bus. As shown in Figure 4, one measure is to transfer as much load as possible to the network bus with open transition switching. Or even better, non-critical load could be left on the spot network bus during testing of emergency generators. As shown in Figure 2 if non-critical loads remain connected to the network paralleling bus during testing, it may be that more than one network protector stays closed when the critical loads are transferred to the generator bus, as shown in Figure 4 (b). When the first block of critical load is transferred back to the spot network bus:
-
There may not be a reverse power in the closed protector or protectors under worst-case conditions due to the load on the network bus, and the network relay sensitive reverse current trip characteristic will not be satisfied.
-
If there is reverse power in the network protectors, the current in each closed protector, in percent of protector current transformer (CT) rating, goes down as the number of closed protectors goes up, as shown by eq. (3). Figure 7 plots the magnitude of the current in each closed protector at time of transfer, when there is no other load on the paralleling bus, for a spot network with 1000 kVA transformers. The curves are plotted versus the generator rating in kVA, where the generator reactance is taken as 10% on its rating. By having more protectors closed, the protector current in percent of CT rating goes down, making it less likely that the current exceeds the instantaneous current setting, IINST, that bypasses the time delay.

Figure 7:
Network protector current in % of CT rating for 1000 kVA
network 5% impedance transformers with one, two, or three closed network
protectors.
With time delay tripping and transfer switches that operate within +/- 5o on angle, and +/- 5% on voltage magnitude difference, application of time delay tripping usually prevents tripping of the last protector when loads are transferred from the network to the emergency generator, and then back to the network with closed transition switching. Should the last protector trip such that all protectors are open, some practitioners may desire to install relaying and control the will block the protectors from closing back in, to prevent out-of-phase closing. This measure can be accomplished by either:
-
Trip and lockout all sources of generation should all network protectors in the spot network be open. With the generators off, this de-energizes the network bus, creates a “dead network”, and then at least one network protector would close back in through the dead network logic of the network relay. See Network Relay Close Characteristics for the dead network logic in network relays.
-
Installing relay and control logic such that if (a) all network protectors are open, and (b) voltage exists on the network paralleling bus above a very small value, roughly 10% or so, the relay and control will block closing of the network protectors by opening of the network protector closing circuits.
Relay and control circuits can be designed for preventing out-of-phase closure of network protectors with energized network paralleling buses. Doing this requires careful coordination between the designer of the system, which has the closed-transition transfer switches for the emergency generators.
Industry Standards and Recommended Practices
IEEE 1547-2018
Industry standards applicable to distributed resources applied on secondary networks are IEEE 1547-2018 and IEEE 1547.6-2011, latest revisions. The umbrella standard is IEEE 1547, “IEEE Standard for Interconnecting and Interoperability of Distributed Energy Resources with Electric Power Systems Interfaces”. This standard contains sections that are applicable to low-voltage networks to which distributed resources might be interconnected, and should be considered in the design of the system. IEEE 1547.6, “IEEE Recommended Practice for Interconnecting Distributed Resources with Electric Power Systems Distribution Secondary Networks”, is devoted to applications in secondary networks.
Section 9 of IEEE 1547-2018 contains information on placing DR on secondary networks.
Network protectors and automatic transfer scheme requirements.
“Network protectors (NPs) shall not be used to connect, separate, serve as breaker failure backup, or in any manner isolate a network or network primary feeder to which DER is connected from the remainder of the network, unless the network protectors are rated and tested per applicable standards for such application” Practically, this says that in spot networks, with DER connected, or when emergency generation is being tested with closed-transition transfer switches, relaying should be installed that prevents all network protectors in the spot network from opening. Considering load transfers with closed-transition switching, the chance of opening all protectors can be minimized by utilizing time-delay tripping with the network protector relays.
“Unless specified otherwise by the Area EPS operator, DER installations on a network, using automatic transfer schemes in which load is transferred between the DER and the EPS in a momentary make-before-break operation, shall meet all the requirements of this clause regardless of the duration of paralleling”. “Power flow during this transition shall be positive from the Area EPS to the load and the DER unless approved by and coordinated with the Area EPS operator”. As discussed before, with closed transition load transfers, the power flow during the momentary paralleling can be in either direction. Time delay tripping should be used with the network protector relays to assure an island is not formed if the momentary power flow is in the reverse direction.
IEEE Std 1547-2018 also states:
-
“DER on grid or spot networks shall have provisions to:
-
Monitor instantaneous power flow at the PCC of the DER interconnected to the secondary grid or spot network for reverse power relaying, minimum import relaying, dynamically controlled inverter functions and similar applications to prevent reverse power flow through network protectors”. This is discussed later in conjunction with application of DER in spot networks.
-
“Maintain a minimum import level at the PCC as determined by the Area EPS operator”. A scheme for accomplishing this is discussed later.
-
“Control DER operation or disconnect the DER from the Area EPS based on an autonomous setting at the PCC and / or a signal sent by the Area EPS operator”.
In section 9.1 of 1547-2018, it is indicated the “DER on grid or spot networks shall not:
-
“Cause any NP to exceed its loading or fault interrupting capability”. Adding DER to a network generally will not cause the NP interrupting rating to be exceeded, as the maximum thru fault current is limited by the impedance of the network transformer.
-
“Cause any NP to separate dynamic sources”. As discussed later, if appropriate relaying and control is not installed in spot networks with DER, the NP with just sensitive trip can and will under certain circumstances separate two dynamic sources.
-
“Cause any NP to connect two dynamic systems together”. If the DER results in opening of all protectors in a spot network, it is conceivable that the network relay in an open protector will call for a close, but by the time the network protector arcing contacts close the systems can be significantly out of phase. Relaying and control should be installed to prevent the opening of all network protectors in the spot network.
-
“Cause an NP to operate more frequently than prior to DER operation”. Adding DER to a spot network in effect results in lowering the load on the spot network, which can result in more operations (cycling) of the network protectors. See the discussion in Effect of Source Phase Voltage Angle Difference on Spot Network Operation.
-
“Prevent or delay the NP from opening for faults on the Area EPS”. When time delay tripping is added to the NP in spot networks to accommodate the DER, the protector opening will not be delayed for high-current backfeeds to multi-phase faults on the primary feeder with the feeder breaker open, as the backfeed currenst will be above the instantaneous current setting, IINST, that bypasses the time delay. However, for backfeed to a single line-to-ground (SLG) fault on the primary feeder from delta wye-grounded network transformers, if time delay tripping is used to accommodate DER on the spot network, the time to clear the SLG fault by protector opening will be increased significantly.
-
“Delay or prevent NP closure”. Adding DER to a spot network can delay or prevent closure of an open protector, as the DER reduces the loading on the in-service network transformers in the spot network.
-
“Energize any portion of an Area EPS when the Area EPS is de-energized”. In a spot network, if all network protectors are open, consideration should be given to control that blocks connection of the DER to the system if it will energize the spot network paralleling bus.
-
“Require the NP settings to be adjusted except by consent of the Area EPS operator”. In many spot network applications, time delay tripping of the network protectors may be required when DER is supplied from the spot network paralleling bus.
-
“Prevent reclosing of any network protectors installed on the network. This coordination shall be accomplished without requiring any changes to prevailing network protector clearing time practices of the Area EPS”.
Distribution secondary grid networks
This section of IEEE 1547-2018 contains two important requirements for DER on networks
-
“In addition to the requirements in Cable Configurations, DER on secondary grid networks shall not cause an islanding condition within the network”. As discussed later, should this happen a DER in one facility in the island could damage customer load in another facility in the island.
-
“In addition to the requirements of Cable Configurations, in the event of an adjacent feeder fault, network protector master relays shall not be actuated by the presence of DER. The interconnected DER shall be coordinated with NP relay functions and shall be evaluated by the Area EPS operator to ensure network reliability”. As discussed later, an adjacent feeder fault can result in tripping of all network protectors in a spot network if the protector relays do not have time delay tripping.
Distribution secondary spot networks
This section of IEEE 1547 contains the following:
“In addition to the requirements in Cable Configurations, connection of the DER to the Area EPS is only permitted if the Area EPS network bus is already energized by more than 50% of the installed network protectors”. This requirement can be easily implemented with a control scheme in spot networks. Implementing it in an area (grid) network with hundreds of protectors would be challenging.
IEEE 1547.6 -2011
This standard, titled, “IEEE Recommended Practice for Interconnecting Distributed Resources with Electric Power System Distribution Secondary Networks” also contains statements affecting DER application on secondary network systems. A few are given below. The standard should be consulted for more detail.
Network Protectors
The presence and operation of DER on networks:
-
“Shall not cause an NP to exceed its fault interrupting capability”. This is similar to the requirements given in 1547-2018.
-
“Should not cause a NP to separate two dynamic sources”. Again, this is similar to requirements given in 1547-2018.
-
“Should not cause any NP to connect two dynamic systems together”. This also is similar to requirements in 1547-2018.
Protection and Controls
The presence and operation of DER on networks:
-
“Should not cause any NP to operate more frequently than prior to DR operation”.
-
“Should not prevent or delay the NP from opening for faults on the network feeders”.
-
“Should not delay or prevent NP closure”.
-
“Should not energize a de-energized network”. In a spot network with all network protectors open, the DER must not be allowed to connect if it will energize the spot network paralleling bus.
-
“Should not require the NP settings to be adjusted except by consent of the area EPS operator”.
-
“Should not cause an islanding condition within part of a grid network”.
-
“Should not remain connected to the network if 50% or more of the protectors serving the network are open”. To satisfy this requirement in a spot network, control can be connected that will disconnect the DER.
It should be further recognized that IEEE 1547-2018 and IEEE 1547.6-2011 do not establish maximum DER levels that can be applied on any spot network, or on any area (grid) network. Establishing levels for DER on area networks that will not cause network protectors to open, or will not prevent network protectors from automatically closing, is not feasible, due to the large number of combination of DER sizes, locations, and their dispatch in the area network In contrast, determining the impact of DER on spot networks is feasible if adequate data is available.
In addition to national standards, the regulatory bodies of some states have rules concerning the application of distributed resources to spot and area networks. Any installation of DER on networks should conform to the applicable rules.
Spot Network Application Considerations
This section discusses some of the more important areas to consider when applying distributed generation to spot networks. On spot networks, the three generation types, synchronous, induction, and inverter based have been applied. Specific areas that must be considered to satisfy IEEE 1547 and IEEE 1547. 6 are discussed below.
Exporting Power to the Network
Early proponents of placing DR on spot networks desired to have the DR export power back to the Area EPS, just as is possible in radial distribution systems with nondirectional overcurrent devices. From the discussion in Introduction and Overview and Network Protector Relaying on network protector relay sensitive trip characteristics and settings, it is clear that DR on spot networks can not export power to the Area EPS, as it will trip all network protectors, and form an island.
Minimum Load to Prevent Protector Tripping
If DR is to be added to a spot network, a requirement of 1547 is that the DR shall not cause network protectors to trip, that otherwise would remain closed in absence of DR. In a spot network were all network protectors remain closed throughout the normal load cycle, it is desired to know the network load level at any instant in time at which a protector will trip. If the load at which a protector trips is known, as well as the actual load on the spot network, it is possible to determine how much DR can be added to the spot network without causing a network protector to trip.
When historical load data is available for the network protectors in a spot network, or real-time protector load data is available when all protectors are closed, a procedure may be used to determine the spot network load level at which the first protector will trip. The procedure is referred to as the Coulter Procedure, named after Jim Coulter, a retired engineer from Duquesne Light Company, who suggested the procedure.
The procedure is applicable to an “N” unit spot network where each network transformer is the same kVA size and all have the same percent impedance. Further, all network protectors are closed, and the primary feeders come from the same substation, either with or without closed bus-tie breakers. At each instant in time, needed for each network protector in the spot network are the three-phase kW flow and the three-phase kVAr flow. These flows can be integrated average values over a given time interval.
Figure 8 shows a “N” unit spot network, where at each time interval the kW and kVAr flow in each network protector, shown in black at the top of the figure are known.
KWNWPi = kW flow in network protector “i”
KVARNWPi\ = kVAr flow in network protector “i”

Figure 8:
Total load, load components, and circulating components
of kW and kVAr flow in network protectors in a spot network.
At any point in time, the total kW and kVAr load supplied by the spot network, shown in blue in Figure 8 as KWSPOT and KVARSPOT are simply respectively the sum of the kW flows in all protectors, and the sum of the kVAr flows in all protectors, and are found from eqs. (4) and (5) below.
(4)
$$ \ \ \ KW_{SPOT} = \sum_{i=1}^{i=N}KW_{NWPi} $$
(5)
$$ \ \ \ KVAR_{SPOT} = \sum_{i=1}^{i=N} KVAR_{NWPi} $$
At each instant in time, the total kW and kVAr flow in each network protector can be broken into two components, a load component and a circulating component, as shown in Figure 8. For practical purposes, the load component in each network protector, KWLOAD and KVARLOAD for the real and reactive components are equal because the network transformer impedances are nearly equal, within the tolerance allowed by standards, and the transformer impedances are much greater than the impedances of the primary feeder between the substation and the transformer. The load components in each protector, shown in pink in Figure 8, are equal to the total supplied by the network protectors, KWSPOT and KVARSPOT divided by the number of network transformers in the spot network, “N”, and are given by eq. (6) and eq. (7) for the real and reactive components.
(6)
$$ \ \ \ KW_{LOAD} = \frac{KW_{SPOT}}{N} $$
(7)
$$ \ \ \ KVAR_{LOAD} = \frac{KVAR_{SPOT}}{N} $$
The circulating components in each network protector, shown in orange, red, and green color at the bottom in Figure 8 are found from the three following equations. The real and reactive components of the circulating components are the kW and kVAr flow that would be in each network protector if all load were removed from the spot network bus and the network protectors blocked closed. They are due primarily to other loads on the primary feeder and differences in feeder voltages at the substation end. The kW circulating flows are given by eqs (8), (9), and (10).
(8)
$$ \ \ \ KW_{CIRC1} = KW_{NWP1} - KW_{LOAD} $$
(9)
$$ \ \ \ KW_{CIR2} = KW_{NWP2} - KW_{LOAD} $$
(10)
$$ \ \ \ KW_{CIRN} = KW_{NWPN} - KW_{LOAD} $$
The reactive circulating flows are given by eqs (11), (12), and (13)
(11) $$ \ \ \ KVAR_{CIRC1} = KVAR_{NWP1} - KVAR_{LOAD} $$
(12) $$ \ \ \ KVAR_{CIR2} = KVAR_{NWP2} - KVAR_{LOAD} $$
(13) $$ \ \ \ KVAR_{CIRN} = KVAR_{NWPN} - KVAR_{LOAD} $$
With reference to Figure 8. positive values for KWCIRCi and KVARCIRCi correspond to flows into the network, and negative values correspond to flows out of the network, or from the network back towards the primary feeder. A good estimate of the kW load needed on the spot network, KWSPOT, is that needed to prevent a reverse kW flow in all network protectors. Letting:
KWCIR-MAX-REVERSE = the largest reverse circulation kW flow in all of the protectors in the spot network.
Then, the load component in the network protector, shown in pink color in Figure 8 which will prevent a trip, designated KWLOAD-NO-TRIP , must equal or be greater than KWCIR-MAX-REVERSE as given by eq (14):
(14) $$ \ \ \ KW_{LOAD-NO-TRIP} \gt KW_{CIRC-MAX-REVERSE} $$
But the load component needed to prevent a trip is the total kW load on the spot network, KWSPOT, divided by the number of closed network protectors, “N”. The spot network load needed to prevent a protector from tripping is, KWSPOT-NO-TRIP. With this definition, eq (14) reduces to eq (15) and the spot network load needed to prevent trip is given by eq (16).
(15) $$ \ \ \ \frac{KW_{SPOT-NO-TRIP}}{N} \gt KW_{CIRC-MAX-REVERSE} $$
(16) $$ \ \ \ KW_{SPOT-NO-TRIP} \gt N * KW_{CIRC-MAX-REVERSE} $$
Example Using Actual Monitored Data
Table 1 lists actual kW and kVAr data for a three-unit spot network as obtained with the Eaton VaultGuard® remote monitoring system.
Table 1:
kW and kVAR flows measured in a three-unit spot network
with remote monitoring
Protector |
KW |
KVAR |
|---|---|---|
NP 1 |
162 |
50 |
NP 2 |
150 |
39 |
NP 3 |
114 |
12 |
Figure 9 is a simplified single line diagram of where the measurements were made. Shown in black for each unit are the measured kW and kVar flows. Given in blue as KWSPOT and KVARSPOT are the total kW and kVAr supplied by the spot network. The load component of the real power in each unit is shown in pink as KWLOAD, which is simply KWSPOT , 426, divided by 3, or 142 kW as given by eq (6).
Figure 10 lists for each network transformer, unit, in black the total kW, in pink the load component, KWLOAD, and the circulating component, KWCIRCi for each unit “i”. Listed are the circulating components for each unit, where the circulating component is the total kW given in black minus the load component, which is 142 kW in each protector. For network units 1 and 2, the circulating components are positive in sign, or into the network. But for unit 3, the circulating component, KWCIRC3, is negative in sign and from the network back to the primary feeder, and 28 kW in magnitude. In order to prevent a reversed power flow in Unit 3, the load component, KWLOAD, must equal or exceed 28 kW. This means that the total kW load supplied by the spot network, KWSPOT, must equal or exceed 3*28 or 84 kW. Thus, as long as the total kW load does not drop below 84 kW, all three protectors will remain closed.

Figure 9:
Measured kW and kVAr flows in network protectors and
calculated total load supplied by spot.

Figure 10:
Load and circulating kW components for kW data in
Figure 9.
It should be recognized that the kW load to prevent protector opening at this instant in time, 84 kW, is approximate as the analysis assumes that as long as the kW flow is into the network, the protector will not trip. Rigorously, both the kW and kVAr flow should be considered if the network relay has other than a straight-line trip characteristic with a trip-tilt angle of 90 degrees (sensitive trip curve perpendicular to the network line-to-ground voltage). The procedure described here can be modified to account for the sensitive trip curve not being perpendicular to the network line-to-ground voltage.
Control of DG to Prevent Protector Tripping
Many operators desire that DG on spot networks does not result in a network protector opening. When DG is operating on a spot network, an underpower relay looking at the import power can be installed to trip the DG should the import power drop below the setting. The challenge with this approach is to determine a setting for the underpower relay that will trip the DG before any one network protector sees a reverse power and trips. Because of unequal kW division in the protectors in a spot network, a protector could trip before an underpower relay would disconnect the DG. In the example of Figure 10, if the under-power relay were set at less than 84 kW, the network protector in unit 3 would trip before the underpower relay would disconnect the DG.
If there is real-time monitoring of the network protectors in the spot network with DG as in Figure 10, it is possible to employ logic that would disconnect the DR before any protector would trip. This logic is shown in Figure 11. The actual kW taken by the load in real time would be calculated by summing the kW flow in each protector, shown in blue as KWACTUAL, in Figure 11. In addition, in real time the kW at which the first protector would trip, shown as KWTRIP in green in Figure 11 would be calculated. As long as KWACTUAL was greater than KWTRIP plus a margin, shown in orange as KWMARGIN, the DR would remain connected. But if the inequality of Figure 11 were not satisfied, a signal would be provided to initiate disconnecting the DR. The margin, KWMARGIN, could be set as a fixed percentage of KWTRIP.

Figure 11:
Real-time control logic with DG to prevent protector
tripping in spot networks
The control logic in Figure 11 for disconnecting DR to prevent network protector tripping applies regardless of the type of DR, inverter, induction, or synchronous, and the number of units in the spot network.
Similarly, the DR should not be allowed to connect to a spot network if it will result in a network protector tripping. IEEE 1547 indicates that DR should not be connected to a spot network unless more than 50% of the network protectors are closed. Even if this criterion is met, allowing the DR to connect could result in tripping of a closed network protector.
When real-time monitoring of the kW flows is available in the network protector, before the DR is connected the actual kW supplied by the network, KWACTUAL in Figure 12 is known, being the same quantity shown as KWSPOT in Figure 10. In addition, at the same instant in time the kW import at which a protector will trip is also known, shown as KWTRIP in green in Figure 12. The DR should not be allowed to connect to the spot network if it will result in the tripping of a closed network protector, even when all protectors are closed. The control logic shown in Figure 12 can be used to give a permissive signal to allow the DR to connect to the spot network. It requires that the kW output or rating of the DR, shown in red in Figure 12 as KWGEN be known. Then the DR is given permission to connect providing the difference between the actual load prior to connection, KWACTUAL and the DR kW rating, KWGEN, is greater than the kW import at which the first protector trips, KWTRIP, plus a margin, shown as KWMARGIN in orange in Figure 12, where the margin would be a fixed percentage the kW import which results in a protector in the spot network tripping

Figure 12:
Real-time control logic to give permissive signal to
allow DG to connect to spot network.
The DR control logic for disconnecting the DR, and allowing it to connect as given in Figures 11 and 12 respectively should be considered, along with other means such as the percentage of closed protectors and underpower relaying on the service.
Another potential application for the Coulter Procedure results is controlling the output kW of the DR in real time such that no protectors in the spot network trip. This concept is illustrated in Figure 13, where plotted with the blue curve versus time is the actual kW import from the network, KWACTUAL, and with the green colored curve the kW import at which the first network protector will trip, KWTRIP. Having at any point in time these two values, it would be possible to adjust the DR kW output so that none of the protector in the spot network would trip due to the presence of the DR. With today’s microprocessor relays and monitoring systems, implementing the control of the DR with logic as shown in Figures 11, 12, and 13 is possible.

Figure 13:
Plots of real time actual kW import from spot network
(KWACTUAL) and the kW import at which a network protector
will trip (KWTRIP).
Other Considerations for Spot Networks with DR
At this time, to the authors knowledge, there are not commercial packages available from vendors that would enable implementing the control in Figures 11 through 13, but development of such packages should not be that difficult. It requires interfacing with the microprocessor network protector relay in each protector to obtain in real time the kW and kVAr flows.
Other conventional measures can be employed with existing equipment to prevent opening of one or all network protectors in a spot network, where the latter results in formation of an island which must not be allowed to happen.
Dropping Large Blocks of Load
If generation, regardless of type, is running in parallel with the spot network, and a large block of load is disconnected, all network protectors can open if their network relays have only the sensitive trip characteristic. This forms an island which must not be allowed to happen. The circuit in Figure 14 will be referenced to identify conditions where load dropping can trip all network protectors in the spot network and form an island. Relay and control strategies to prevent this are identified.

Figure 14:
Spot network with generation running in parallel.
As shown in Figure 14, if a large load is dropped by opening of a low-voltage circuit breaker in the system supplied by the spot network, the generation output could exceed the remaining load, and with the network relay in each protector having just a sensitive trip setting (no time delay), all protectors would trip and form an island. This is possible with synchronous, induction, or inverter-based generation, because over/under frequency or over/undervoltage relays will not respond until after the island is formed. When the island forms, if the generation is synchronous, the network protectors will be isolating two non-synchronized systems, a situation for which many are not rated. Further, after the island is formed, the systems on opposite sides of the open protectors are not synchronized. As indicated before, under these conditions the phasing voltage,VP, at the open contacts of the network protectors may fall within the network relay close region for sufficient time that the relay close contact makes. By the time the protector arcing contacts make, there can be a large angle difference between the two non-synchronized systems, resulting in equipment damage due to the out-of-phase closing. The network relays were never intended to function when the two sides of the open protector are not synchronized.
To prevent formation of an island, time delay tripping is applied to every network protector in the spot network, with sufficient time delay to allow other protective relays, such as an under power relay (device 37) or a reverse power relay (device 32) monitoring the net input from the spot network to disconnect the generation.
With the time delay tripping, the instantaneous current setting to bypass the time delay tripping, shown as “IT” with the vertical orange colored line in Figure 14, must be higher than the maximum backfeed current in the protector during the load drop, shown with the bold arrow in the figure. And, of course the time-delay setting for the network protector relay, shown with the green colored horizontal curve labeled, “TD-1”, must be coordinated with the disconnection of the generation whether it be with an underpower relay or a reverse power relay. An application with under/overpower relay in a two-unit spot network is discussed in (Baier et. al. 2003). In that application, the overpower relay will allow the generation to connect providing the input from the network is above its setting.
Despite installation of relay and control to prevent tripping of all protectors and formation of an island, should all protectors open due to failure of the protection system, several approaches can be taken to protect the system. One approach is to block closing of all network protectors when all protectors are open, and there is voltage present on the network paralleling bus. This would have to be coordinated with the “dead network” function in the network relay that initiates protector closing with the transformer energized and very low voltage on the network bus. Reference the discussion in Network Protector Relaying on network protector relaying.
A second approach is to install control circuits such that if all network protectors in the spot network are open and the all network transformers are energized, the generator is automatically disconnected. With this approach, following generator disconnect and lockout, one or more network protectors would close back to energize the “dead” network bus. Whether or not the generation would reconnect following re-energization of the network bus would depend upon the control strategies applied to the generation system. However, the reconnection of the generation following an outage shall satisfy the requirements of IEEE 1547.
The time-current plot included in Figure 14 illustrates the coordination between the reverse power relay (device 32) or underpower relay (device 37) monitoring the flow from the spot network, and the time delay tripping characteristic of the network protector relay when the power flow is in the reverse direction. For reverse power flows or under power flows with low magnitude currents in the protector, below the setting of the instantaneous current pickup (IT) that bypasses the time delay (TD-1), the reverse power relay or underpower relay disconnects the generation before protectors can trip. For reverse powers in the network protector where the associated protector currents are high in magnitude, as for multi-phase faults on the network primary feeder following opening of the feeder breaker at the substation, the network relay time delay (TD-1 in the figure) is bypassed, and the protector on the faulted primary feeder trips without time delay, typically with the relay sensitive trip time being either 3 or 6 cycles.
Generation Output Exceeding Loading
Without proper relaying and control of the DR on the spot network, regardless of the type of DR, if the generation output exceeds the load, all network protectors in the spot network can trip and an island is formed. This can happen even if the protectors have time-delay tripping. This circumstance must be prevented by disconnecting the generation before the network protectors can trip. To accomplish this, time delay tripping for low-magnitude reversals is needed on the network protectors, similar to that needed to prevent island formation for load dropping. The time delay gives time for detection of the reverse power or under power with other relays, and time to disconnect the generation, or reduce its power output.
Synchronizing Synchronous Generators on Spot Networks
When synchronous generators are synchronized with the spot network system, closing the circuit breakers that make the parallel may cause momentary power reversals in all of the network protectors in the spot network, as can occur with closed-transition load switching, as discussed in Closed Transition Load Transfers With Synchronous Generators of this chapter. Time delay tripping may be required on all network protectors to prevent island formation. Factors affecting the direction of the power flow in each closed protector in the spot network and the magnitude of the associated current in the closed protector during synchronizing of generators are listed below. The magnitude of the current in the protector during synchronization is needed so that the pickup of the instantaneous trip function that bypasses the time delay, shown as IT in Figure 14, can be set higher than the maximum momentary backfeed current during synchronization. The factors affecting the direction of the power flow and the magnitude of the associated backfeed current in the protectors are:
-
Voltage angle difference at the synchronizing breaker
-
Voltage magnitude difference at the synchronizing breaker
-
Size and impedance of the synchronous generator(s)
-
Number of closed network protectors
-
Size and power factor of the load in the low-voltage system supplied by the spot network
-
Network transformer impedance, either 5% or 7%.
-
Impedance of the low-voltage circuits between the network transformers and the synchronous generator(s).
With induction generators and generation interfaced to low-voltage system through inverters, momentary power flows in the protectors are not expected when the generation is connected to the secondary system. Induction generators are started similar to induction motors, and they usually import both watts and vars from the spot network when first connected to the system.
Adjacent Feeder Faults
Figure 15 shows what is considered an adjacent feeder fault, when generation is in parallel with the secondary side of a spot network. Typically, the adjacent feeder fault is single line-to-ground (SLG), double line-to-ground (DLG), or three-phase to ground (3ϕ) fault. In the discussion that follows, it is assumed that the primary feeders to the network come from the same electrical bus in the substation (all medium-voltage bus-tie breakers closed), and the generation is with synchronous machines.
No Generation on Spot Network
Assuming that the adjacent feeder fault in Figure 15 is on the line-side terminals of feeder breaker 52-4, there are two periods of interest. The first is from time of fault inception until the faulted feeder breaker, 52-4, opens, with the second commencing after the breaker for the faulted feeder opens. If there is no generation connected to the secondary side of the spot network, the network relay sensitive trip criteria at all network protectors in the spot network will not be satisfied, and all network protectors can’t open. Because of voltage gradients along the medium-voltage buses in the substation for the three-phase fault, the voltages applied to the HV terminals of the network transformers in the spot network are not equal, and there could be a reverse power flow in one or more network protectors. But there should always be a forward power flow in at least one network protector, and all protectors will not trip for the adjacent feeder fault.
After the faulted feeder breaker, 52-4, opens in Figure 15, voltage on the substation bus returns to near normal, and any network protectors that opened will auto close if their network relay close characteristics are satisfied. Phasing Voltages In Spot Networks discusses factors affecting the network load on spot networks needed to cause automatic reclosing of an open network protector.

Figure 15:
Spot network with synchronous generation and an
adjacent feeder fault, faulted feeder breaker closed..
Generation on Spot Network
With generation on the spot network, as in Figure 15, tripping of the network protectors in the spot network is possible for the adjacent feeder fault. Determining whether all protectors trip requires detailed simulation of the system, including modeling of the generation source. The simulation must consider the fault type and location, the clearing time for the faulted feeder breaker, 52-4 in Figure 15, either normal or backup, the type of relays in the network protector and their sensitive trip time, the characteristics of the load on the spot network, and the type of generation, either synchronous, induction, or inverter based.
Regardless, for the most severe fault type (bolted three-phase) on the adjacent primary feeder, with synchronous generation on the spot network, usually incorporation of time-delay tripping in the network protectors, with the time delay set higher than the time to clear the fault on the adjacent feeder, by opening of breaker 52-4, the network protector tripping can be prevented. This concept is shown in Figure 15, where the clearing time for the faulted feeder breaker, 52-4, shown with the horizontal dashed blue- colored line, is less than the time delay setting of the network protector relays, shown as “TD-1” with the horizontal green-colored line. Furthermore, the feeder breaker clearing time is less than the operating time of the reverse power relay (device 32) or the underpower relay (device 37) that is monitoring the net import from the spot network. When setting the time delay “TD-1” for the network protector relay, it may be advisable to set it based upon the backup clearing-time should the faulted feeder breaker, 52-4 in Figure 15, fail to trip.
One concern is that, if the protector current during the fault on the adjacent primary feeder is above the setting of the instantaneous current function (IT shown with the vertical orange-colored line in Figure 5) that bypasses the time delay, considering just the trip characteristics of the network protector relays, all protectors in the spot network could trip and form an island for the adjacent feeder fault. This should not be allowed to occur.
Assuming synchronous generators with constant and rated voltage behind sub-transient reactance, Figure 16 plots the current in each backfeeding network protector in percent of protector current transformer (CT) rating, versus the size of the generator, expressed in per unit of the kVA rating of one network transformer in the spot network. The network transformer impedance is assumed to be 5% on transformer rating, and generator sub-transient reactance is taken as 15% on generator kVA rating. It is assumed that the only impedances limiting the backfeed current are those of the generators and the network transformers, so the protector currents given by the curves represent an upper bound for the selected model. The curves reveal that, for most situations, it is possible to set the pickup (IT) of the instantaneous current relay (function) for the network protector relay above the maximum backfeed current, so that the time delay is not bypassed. Furthermore, the curves show that operating with all protectors closed lowers the backfeed current in each protector, allowing a lower instantaneous current setting for the network protector relay. Also, operating with more than 50% of the protectors closed, an IEEE 1547 requirement for connecting the generator(s), assures that at least two protectors are closed, regardless of the number of network transformers in the spot network.

Figure 16:
Current in each backfeeding network protector in
percent of CT rating, versus generator size and number of closed
protectors for a three-phase fault.
For example, if the spot network had three 1000 kVA 5% impedance network transformers, and the synchronous generator were rated 50 kVA, the generator rating in per unit (pu) of network transformer rating would be 0.05 per unit. From the curves in Figure 16, an IT setting 50% should be high enough to prevent protector tripping during the adjacent feeder three-phase fault.
For spot networks with 7% impedance, the current would be somewhat less than shown in Figure 16. Further, detailed modeling of the synchronous generator frequently shows that the currents during the backfeed are less than found from the simple model used here, where the machine reactance is assumed to stay constant at the sub-transient value.
For the three-phase fault on the adjacent primary feeder, several other issues must be considered when determining if all network protectors will trip. Even if the network relay in each backfeeding protector were to make its trip contact for the adjacent feeder three-phase fault at the substation, the protectors may not trip. With the faulted feeder breaker closed, the voltage on the substation bus will drop to zero, or nearly zero. Consequently, the voltage on the spot network bus at the backfeed location will be very low, and close to zero. With the simple model selected for finding the backfeed currents, where only the impedances of the backfeeding network transformer and synchronous generator are included, the voltage on the network bus with the faulted feeder breaker closed can be found and plotted, as shown in Figure 17. The vertical axis gives the bus voltage in per unit of the network transformer rated voltage, and the horizontal axis gives the generator size in per unit of the kVA rating of one network transformer.

Figure 17:
Voltage at each backfeeding network protector versus
synchronous generator size and number of closed protectors for a
three-phase fault.
Plotted with the dashed horizontal orange colored line at 0.075 per unit is the minimum voltage at which the network protector meeting standards must trip under steady state conditions. For voltages below this level, the protector may or may not trip when the network relay makes its trip contact. Manufacturers test network protectors to ensure they will trip at 7.5% of rated voltage under steady-state conditions, but published data on performance below that level is not provided. Thus, from the curves in Figure 17, with smaller synchronous generators and a large number of closed protectors, voltages with the breaker for the faulted feeder closed can be significantly below 7.5%, and some types of network protectors may not trip even if the network relay trip contact is made.
When the network protectors are equipped with microprocessor network relays, or a solid-state relay, when the voltage at their terminals drops below a specified value, the relay power supply will not function under steady-state conditions. For a three-phase fault on the adjacent feeder, and with small amounts of generation, the voltage at the backfeeding network protectors can drop below the level where the relay power supply fails, and the relay may not make its trip contact, even though the theoretical sensitive trip characteristic is satisfied. Shown in Figure 17 with the horizontal dashed black line is the minimum voltage at which the power supply of the MPCV relay will function, being 12 volts on a 125-volt base (0.096 per unit). If the voltage on the network for the adjacent feeder three-phase fault drops below this level, on a steady state basis the relay power supply will not function. But for the adjacent feeder three-phase fault, the voltage can drop below 0.096 per unit, but the duration of the “dip” is the time for the feeder breaker on the adjacent feeder to open. Following opening of the breaker for the adjacent feeder, the voltage on the network bus will return to near 100 percent. There doesn’t appear to be in the various relay manufacturer’s literature data on how the relay performs during momentary voltage drops below the level where the power supply will not function during steady-state conditions. From Figure 17, clearly the momentary voltage dip on the network bus can be below the level where the relay power supply will not function under steady-state conditions.
Until the dynamic response of the network relay and the network protector trip mechanism is known for the voltage dips that occur for the three-phase fault on the adjacent primary feeder, it is prudent to incorporate time-delay tripping in the network protectors in spot networks with synchronous generation. The pickup of the instantaneous current function that bypasses the time delay must be high enough such that it doesn’t pickup for the adjacent feeder three-phase fault, yet low enough so that during backfeed to a multiphase fault on a primary feeder for the network, with the breaker for the faulted primary feeder open, there is no time delay in tripping of a protector supplied from the faulted primary feeder.
Bolted Three-Phase Fault on Network Primary Feeder
In Figure 19, there is a bolted three-phase fault on network primary feeder 1 (FDR 1) that supplies the spot network. As for the fault on the adjacent primary feeder, the pickup (IT) of the instantaneous current relay (function) that bypasses the time-delay tripping of the network protector should be above the maximum backfeed current in any of the network protectors in the spot network. To prevent tripping of the network protectors in the spot network, the time delay, shown with the solid green colored line, TD-1, must be greater than not only the opening time of faulted feeder breaker 52-1, but must be above the time for either the reverse power relay or underpower relay that would initiate disconnection of the synchronous generator. And as shown, the time delay of either the 32 device or the 37 device must be above the clearing time of breaker 52-1 for the faulted primary feeder.

Figure 18:
Three-phase fault on network primary feeder 1 with the
breaker for the faulted feeder closed.
Following opening of the breaker for faulted feeder 1, as shown in Figure 19, the voltage on the substation bus would return to near normal, the power flow in network protector 1 (NWP1) on feeder 1 would be in the reverse direction, and the magnitude of the associated current would be much higher than when the breaker for faulted feeder 1, 52-1, is closed, as in Figure 8. With the breaker for the faulted feeder open, the IT setting for the network protector relay must be below the current in NWP 1 for the backfeed, as shown in Figure 19. In addition, the operating time of service device 32 or device 37 must be higher than the time for the network protector on feeder 1 to open, where in Figure 19 it is assumed the relay sensitive trip time is 3 cycles. Protector opening time would not exceed 6 cycles.
Again, what is important is that with the breaker for the faulted primary feeder closed, as in Figure 18, the network protectors in the spot network must not trip. For the three-phase fault with the breaker for the faulted feeder closed, the issues discussed for the adjacent feeder three phase fault come into play, specifically being the response of the network relay power supply and the network protector trip mechanism during the momentary voltage dip in the network from time of fault inception until the breaker for the faulted primary feeder opens.
The preceding discussions for the adjacent feeder fault, and fault on a network primary feeder has assumed the fault is a three-phase fault, the most severe type. It causes the highest backfeed currents in the network protectors when there is synchronous or induction generators supplied from the spot network, and causes the largest voltage dip on the spot network paralleling bus prior to opening of the breaker for the faulted primary feeder.
For the more common single line-to-ground (SLG) fault and double line-to-ground fault on the primary feeder at the substation, the voltages in the secondary system do not drop to the level where the power supply in the microprocessor relays will cease to function, or to the level where the network protector shunt trip mechanism will not operate, when the network transformers have the delta connected HV winding. Figure 8 of Primary System Grounding shows the network line-to-ground voltages on all three phases for the bolted SLG fault on an adjacent primary feeder at the substation, or for a SLG fault on a feeder that supplies the spot network, when the network transformers have the delta connected primary winding. These are the secondary phase-to-ground voltages that exist with the breaker for the faulted feeder closed.

Figure 19:
Three-phase fault on network primary feeder 1 with the breaker for the
faulted feeder open.
For the adjacent feeder fault, the microprocessor network relay power supply functions under the voltage conditions associated with the SLG and DLG faults at the substation with the breaker for the faulted feeder closed, and there is sufficient voltage to operate the network protector trip mechanism if the relay makes its trip contact. However, during the duration that the breaker for the adjacent feeder is closed, as in Figure 15, or the breaker for the faulted network feeder is closed, as in Figure 18, it is less likely that the network relay sensitive trip criteria will be met, whether the relay has a positive-sequence directional trip characteristic, or does power based calculations as described in Trip Algorithms for Microprocessor Relays, and in Appendix 3. Furthermore, even if the relay sensitive trip criteria are satisfied with the breaker for the faulted feeder closed, the magnitude of the backfeed current in the protectors for the SLG fault is lower than that for the three-phase fault.
If time delay tripping is used to accommodate the three-phase fault on the adjacent or a network primary feeder, with the associated protector currents being less than the pickup of the instantaneous function (IT in Figure 18) to bypass the time delay, the time delay will not be bypassed for the SLG and DLG faults with the faulted feeder breaker closed.
Maximum Allowed DR In Spot Networks Without Time Delay Tripping to Avoid Island Formation for Adjacent Feeder Faults -Constant Power Generation
The maximum generation that can be accommodated in a spot network without tripping the protectors for a fault on the adjacent primary feeder will consider the SLG fault, the DLG fault, and the three-phase fault. In addition, two types of generation will be considered. In the first, it is assumed that the generation output is a constant real power. In the second, the generation output is assumed to be a constant current source. Regardless, it is assumed that the protectors in the spot network have no time-delay tripping, just the sensitive trip characteristic set at 0.2% of CT rating or less.
Figure 20 shows a spot network with a DR whose three-phase output is assumed to be constant power, PGEN, and the load on the spot network is assumed to be balanced constant impedance, whose power drawn is proportional to the square of the spot network bus voltage. During the SLG and DLG fault on the adjacent primary feeder at the substation, the network load can draw considerable real and reactive power with the breaker for the adjacent faulted feeder closed.
The voltages that appear on the network bus during the SLG and DLG faults on the adjacent feeder are determined primarily by the positive- and zero-sequence impedances looking into the substation bus, shown as Z1S and Z0S in Figure 20. For the spot network, each transformer has the same kVA rating, KVAT, the same impedance, ZT, and the number of transformers in the spot network is NT.
Figure 21 is an impedance diagram showing the impedances that will be used to determine the amount of constant power generation, PGEN, that can be on the network without producing a reverse power (watt flow) in the network protectors. The terms on Figure 21 are defined below:
KVAT = kVA rating of each network transformer
NT = Number of transformers in the spot network
KVATEQ = kVA rating of the equivalent network transformer = NT * KVAT
Z1S = Positive-sequence impedance looking into substation bus
Z0S = Zero-sequence impedance looking into substation bus.
Z1L = Positive-sequence impedance of network load
Z2L = Negative-sequence impedance of load = Z1L

Figure 20:
Spot network with constant power generation and
constant impedance load.

Figure 21:
Equivalent circuit for finding maximum for
PGEN that does not cause a reverse power flow.
Single Line-to-Ground Fault on Substation Bus
For the SLG fault on the substation bus, the sequence networks are connected in series at the point of fault, as shown by the orange colored connections in Figure 22. Between the substation bus and the spot network bus, the equivalent network transformer has the same percent impedance as an actual transformer.
For the fault at the substation bus, the sequence voltages in the network, shown as V1N and V2N, are determined primarily by the sequence impedances looking into the substation bus, Z1S and Z0S in Figure 22. For practical purposes, during the SLG fault at the substation, the sequence voltages on the network bus, shown as V1N and V2N, are the same as at the substation bus. Thus:
(17) $$ \ \ \ V_{1N} = V_{1S} $$
(18) $$ \ \ \ V_{2N} = V_{2S} $$
Prior to the fault, assuming balanced three-phase conditions, the real power drawn by the load is:
(19) $$ \ \ \ P_{LOAD-3\phi} = \text{ Load Pre-fault three-phase real power} $$
(20)
$$ \ \ \ P_{LOAD-3\phi} = (P_{AL} + P_{BL} + P_{CL}) = 3 P_{1L-NO Fault} $$
In eq (20) PAL, PBL, and PCL are the individual phase power flows to the load having impedance Z1L, and P1L-NO\ FAULT is the positive-sequence power drawn buy the load in absence of a fault.
With the single line-to-ground (SLG) fault on the substation bus, the power drawn by the load, PSLG-FAULT, is:
(21) $$ \ \ \ P_{SLG-Fault} = P_{ALF} + P_{BLF} + P_{CLF} = 3(P_{1LF} + P_{2LF}) $$
In eq (21), PALF, PBLF, and PCLF are the phase powers drawn by the load during the SLG fault, and P1LF and P2LF are the positive-and negative-sequence powers drawn by the load during the SLG fault on the substation bus.
Because of the relationship given by eq (21), the sum of the three phase power flows during the fault will always be greater than three (3) times the positive-sequence power flow, P1LF, during the fault, as given by eq (22).
(22) $$ \ \ \ P_{ALF} + P_{BLF} + P_{CLF} \gt 3 * P_{1LF} $$
With the assumption that the load is constant impedance, the positive-sequence power drawn by the load during fault, P1LF, is proportional to the product of the square of the per unit positive-sequence voltage during the fault, V1N-PU, and the positive-sequence power drawn by the load prior to the fault, P1L-NO\ FAULT. Equation (23) gives the positive-sequence power drawn by the load during the fault.
(23) $$ \ \ \ P_{1LF} = V_{1N-PU^2} * P_{1L-NO FAULT} $$
Placing the expression for P1LF from eq (23) into eq (22) gives:
(24) $$ \ \ \ P_{ALF} + P_{BLF} + P_{CLF} \gt 3 V_{1N-PU^2} * P_{1L-NO FAULT} $$

Figure 22:
Sequence network connections for the single
line-to-ground fault on the substation bus.
But 3 times P1L-NO\ FAULT is, as shown by eq (20), the three-phase power drawn by the load prior to fault. Equation (24) becomes:
(25) $$ \ \ \ P_{ALF} + P_{BLF} + P_{CLF} \gt V_{1N-PU^2} * P_{LOAD-3\phi} $$
From eq. (25), the net three-phase power drawn by the load during the SLG fault will always be greater than the product of the square of the per unit positive-sequence voltage during the fault times the three-phase power drawn by the load prior to fault. Thus, as long as the net three-phase power drawn by the load during the SLG fault is greater than the generator power output, PGEN-3ϕ, all network protectors can not trip and an island form for a fault on the adjacent primary feeder. Note that during the SLG fault on the adjacent feeder, the constant impedance load will also draw some negative-sequence power. Thus, all network protectors having just a sensitive trip characteristic will not trip for the adjacent feeder fault if the inequality of (26) is satisfied.
(26) $$ \ \ \ P_{GEN-3\phi} \lt V_{1N-PU^2} * P_{LOAD-3\phi} $$
From eq (26), as long as the generator power output is less than the right-hand side of the inequality, an island will not be formed during the fault on the adjacent feeder. During the SLG fault, the positive-sequence voltage on the substation bus is determined by the grounding of the medium-voltage system as discussed in Primary System Grounding.
Figure 23 plots the positive-sequence voltage on the substation bus for the SLG fault, versus the ratio of X0 to X1 at the substation, assuming that reactance grounding is employed for the medium-voltage system supplying the network primary feeders.

Figure 23:
Positive-sequence voltage on substation bus and on spot
network bus for SLG fault on adjacent primary feeder at substation.
From Figure 23, the positive sequence voltage on the spot network bus during the SLG fault on the adjacent feeder is determined by the grounding of the medium-voltage system. As the X0 to X1 ratio increases, the positive-sequence voltage on the network bus increases during the SLG fault, and the power drawn by the constant impedance network load increases. Shown on the curve for X0 to X1 ratios of 1.0 and 3.0 are the positive-sequence voltages in per unit. Given in the last column of Table 14-1 are upper limits on the constant power output of the generator which should not trip all protectors in the spot network for the SLG fault, whether the network relays have the positive-sequence trip characteristic, or have a power-based trip characteristic.
Table 1:
Limit on spot network constant power generation for SLG
fault on adjacent primary feeder.
| X0 / X1 | VIN-PU | PGEN in per unit of PLOAD-3ϕ |
|---|---|---|
| 1.0 | 2/3=0.667 | 4/9 =0.444 |
| 3.0 | 4/5=0.80 | 16/25=0.64 |
Double Line-to-Ground Fault on Substation Bus
If the fault on the adjacent primary feeder at the substation is a double line-to-ground (DLG) fault, then the sequence networks are connected in parallel at the fault point, as shown in Figure 24 with the orange-colored lines. For the DLG fault, the positive-sequence voltage on the substation bus and on the spot network paralleling bus are significantly lower than for the SLG fault, and consequently the constant impedance load on the spot network will draw less power during the DLG fault on the adjacent feeder.

Figure 24:
Sequence network connections for the double
line-to-ground fault on the substation bus.
The positive-sequence voltage on the network bus during the DLG fault is a function of the system grounding, as reflected by the ratio of X0 to X1 at the substation bus. Figure 25 plots the positive-sequence voltage on the spot network bus for the adjacent feeder DLG fault, versus the ratio of X0 to X1 at the substation bus. The positive-sequence voltage in per unit is asymptotic to 0.50.

Figure 25:
Positive-sequence voltage on substation bus and on spot
network bus for DLG fault on adjacent primary feeder at substation.
Table 2 lists for X0 to X1 ratios of 1.0 and 3.0, in the last column the upper limit of the generator power output that will not result in tripping of all network protectors in the spot network for the adjacent feeder DLG fault. The values are in per unit of the balanced three-phase load prior to fault.
From the data in Tables 1 and 2, when solid grounding is used at the substation, the X0 to X1 ratio is approximately 1.0. Considering the SLG fault, the constant power generator should not exceed 44% of the balanced three-phase load, and considering the DLG fault it should not exceed 11.1% of the balanced three-phase load.
Table 2:
Limit on spot network constant power generation for DLG
fault on adjacent primary feeder.
| X0 / X1 | VIN-PU | PGEN in per unit of PLOAD-3ϕ |
|---|---|---|
| 1.0 | 1/3=0.33 | 1/9=0.111 |
| 3.0 | 3/7=0.4286 | 9/48=0.1837 |
Although there can be considerable constant power generation on the spot network without tripping of all protectors for the adjacent feeder SLG and DLG faults, where the protectors have only the sensitive trip characteristic, the limit on constant power generation is based on the three-phase fault on the adjacent primary feeder at the substation.
Three-Phase Fault on Substation Bus
The amount of constant power generation that can be connected to the spot network without satisfying the network relay sensitive trip characteristic can be found from the simplified equivalent circuit at the top of Figure 26.

Figure 26:
Equivalent circuit for adjacent feeder three-phase
fault with constant power generation on spot network, and relay
sensitive trip characteristic.
Assumptions for the analysis are:
-
The generator power output, PG, is assumed to be balanced and stay constant at the pre-fault value.
-
Although there is load connected to the spot network bus, the voltage on the network bus is so low that it is assumed the load draws no real power.
-
The angle of the current in the protector, IT, relative to the network line-to-ground voltage, VN, is determined by the X to R ratio of the leakage (nameplate) impedance of the equivalent network transformer.
-
The constant power generator real power output is absorbed in the resistance, RT, of the equivalent network transformer.
-
The ratio of the rated current of the network protector current transformer to the rated secondary current of the network transformer is “K”
Considered in defining the upper limit for PG are network relays with both a power-based trip characteristic, and a positive-sequence directional overcurrent sensitive-trip characteristic. Further it is assumed that the relay sensitive trip characteristic is a straight line, as shown in the bottom half of Figure 26, but angle θM is adjustable.
Power Based Algorithm Using Actual Network Voltages
Appendix 3 referenced from Network Protector Relaying on network relay trip algorithms, discussed two trip algorithms that can be used for power-based relays. In the first the power seen by the relay is calculated using the actual magnitudes of the line-to-ground (neutral) voltages on the network bus.
With this trip algorithm, the power in per unit of the kVA rating of the equivalent network transformer to satisfy the sensitive trip criteria of the relay is given by eq (26). As long as the generator power output during the three-phase fault on the adjacent feeder is less than this, all protectors having just the sensitive straight-line trip characteristic should not trip.
(26) $$ \ \ \ P_{TRIP-PU-XFR} = 1.0[K\frac{RCT_{﹪}}{100} \frac{\sin(90 + \theta_{M})}{\sin(90 - \theta_{M} - \theta_{Z})}] \cos{\theta_{Z}} \enspace pu \enspace of \enspace nwk \enspace xfr $$
In this equation:
RCT% = sensitive reverse current trip setting at 180o in % of protector CT rating.
K = ratio of protector CT rated current to network. transformer. rated current.
θM = straight-line trip curve shift angle as shown in Figure 26
θZ = impedance angle of the network transformer as shown in Figure 26
Figure 27 plots eq (26) for three different values of angle θM, either 0 degrees, +5 degrees, and – 5 degrees. When θM is zero degrees, meaning the straight line trip curve is perpendicular to the network line to ground voltage (trip-tilt angle of 90 degrees), the generator power output which satisfies the sensitive trip curve is independent of the X to R ratio of the equivalent network transformer, as plotted on the abscissa.
If the network relay has the “gull-wing” sensitive trip characteristic as discussed in Network Protector Relaying, then angle θM is equal to -5 degrees, and the generator power output where all protectors trip is lower. And if angle θM is equal to +5 degrees, which corresponds to a trip-tilt angle of 95 degrees, there can be considerably more constant power generation before the relay trip algorithm is satisfied, as shown by the red curve, especially at the higher X to R ratios for the network transformer leakage impedance.

Figure 27:
Generator constant power output at which protector will
trip for three-phase fault when relay uses network actual voltage
magnitudes for power calculations.
The generator constant power output given in Figure 27 is very conservative, as it is assumed that the load on the spot network bus, represented with RL and XL in Figure 26 draws no power.
When the generator constant power output for the three-phase fault on the adjacent feeder is such that the relay sensitive trip characteristic is satisfied, the voltage on the network bus is very low, below the level where the power supply of microprocessor network relays will function under steady-state conditions, and below the level where the network protector trip mechanism will function under steady state conditions.
Figure 28 plots the spot network bus voltage for the three-phase fault on the adjacent primary feeder at the substation when the generator power output is such that the relay sensitive trip characteristic (power trip algorithm using actual voltage magnitudes) is satisfied, as quantified in Figure 27. From Figure 28, the voltage on the network bus during the three-phase fault never exceeds 5%, and under steady state the network relay would not make its trip contact, and the protector trip mechanism would not function. The duration of the voltage dip is from time of fault inception until the breaker for the faulted feeder opens.
Figure 29 depicts two possible profiles for the spot network bus voltage during the three-phase fault on the adjacent primary feeder. In the top half, the adjacent feeder fault is cleared in about 6 cycles, so the duration of the voltage dip on the network bus is for 6 cycles, down to about 5%. But if the circuit breaker for the faulted adjacent feeder fails to trip, the backup clearing time could be much longer, as shown in the bottom half of Figure 29, and the duration of the voltage dip on the network bus would be much longer.

Figure 28:
Spot network-bus voltage in percent when the generator
power is at the level in Figure 27 that satisfies the network relay
sensitive trip characteristic (power algorithm using actual voltage
magnitudes).
With reference to Figure 29, the response of the network relay power supply to voltage dips as shown is not known, and the response of the network protector trip mechanism to these voltage dips is not known.

Figure 29:
Spot network bus voltage during three-phase fault on
the adjacent primary feeder.
Positive-Sequence Directional Overcurrent Relay
If the output of the DR for the adjacent feeder three-phase fault is constant power, but the network relays have a positive-sequence directional overcurrent trip characteristic, the amount of constant power generation that will result in protector tripping, theoretically, assuming the voltage on the spot network bus doesn’t drop to the level where the relay power supply does not function, is much lower than given in Figure 27.
With the positive-sequence directional trip characteristic, where the network positive-sequence line to ground voltage is just for polarizing, the current required to intercept the straight-line trip curve, with reference to Figure 26 (b), is found from the law of signs. This current, ITRIP-PU-XFR, in per unit of the rated current of the equivalent network transformer, is given by eq (27)
(27) $$ \ \ \ I_{TRIP-PU-XFR} = K\frac{RCT_{﹪}}{100} \frac{\sin{(90 + \theta_{M})}}{\sin{(90 - \theta_{M} -\theta_{Z} )}} \enspace pu \enspace of \enspace nwk \enspace xfr $$
All terms in this equation have been defined before. When the current intercepts the trip curve, the output power of the generator is simply the square of the current given by eq (27) times the resistance of the equivalent network transformer in per unit, RT-PU, as given by eq (28), in per unit of the kVA rating of the equivalent network transformer.
(28) $$ \ \ \ P_{TRIP-PU-XFR} = Z_{T-PU} \cos{\theta_{Z}} I_{TRIP-PU-XFR}^2 \enspace pu \enspace of \enspace nwk \enspace xfr $$
Substituting eq (27) into eq (28), the generator power output when the positive-sequence directional overcurrent relay trip characteristic is satisfied is given by eq (29).
(29) $$ \ \ \ P_{TRIP-PU-XFR} = Z_{T-PU} \cos{\theta_{Z}} [K\frac{RCT_{﹪}}{100} \frac{\sin{(90 + \theta_{M})}}{\sin{90 - \theta_{M} - \theta_{Z}}}]^2 $$
One hundred times eq (29) is plotted in Figure 30, giving the maximum constant power generation in percent of the kVA rating of the equivalent network transformer, equal to NT*KVAT, where NT is the number of transformers in the spot network and KVAT is the kVA rating of each transformer.

Figure 30:
Constant power generation in percent of the kVA rating
of the equivalent network transformer at which the positive-sequence
network relay sensitive trip criterion is satisfied for the three-phase
fault.
Clearly, the analysis for the constant power generation which will satisfy the trip criterion of the positive-sequence directional overcurrent relay assumes that the network relay logic (power supply) continues to function even though the voltage on the network bus drops to near zero for the time required for the breaker for the adjacent primary feeder to trip for the three-phase fault.
The curve given in Figure 30 also applies to a network protector relay that has a power-based trip algorithm that calculates the P and Q values using the magnitude of the nominal voltage. However, as with the sequenced based relay, the issue is whether the relay power supply and logic will continue to function when the voltage on the network bus is depressed to near zero. Figure 31 plots the magnitude of the network bus voltage in percent when the circuit breaker for the adjacent primary feeder is closed. The voltages shown are below the level were under steady-state conditions the power supply of the microprocessor network relays function, and below the level where the network protector trip mechanism will function under steady state conditions.

Figure 31:
Network-bus voltage in percent when the sensitive trip
criteria of the sequence based relay is satisfied as given in Figure
30 for the three-phase fault.
Maximum Constant Power Generation To Limit Spot Network Bus Voltage to six (6) percent
If the voltage on the network bus during backfeed to the three-phase fault on the adjacent feeder does not exceed six percent (0.06 per unit) with the constant power generation, under steady state conditions the power supply of the network relay would not function, and the network protector trip mechanism would not function. Thus, if the output power of the constant power generation did not exceed the value which results in 6% voltage on the bus, the network protectors in the spot network would not trip for a three-phase fault on the adjacent feeder. This applies whether the network microprocessor relay does power-based calculations (using either actual voltage magnitudes or nominal voltage), or has a trip algorithm based on positive-sequence current and positive-sequence voltage.
The constant power output of the generator which results in a spot network bus voltage of six percent is plotted in Figure 32, in per unit of the kVA rating of the equivalent network transformer, KVATEQ. The blue-colored curve applies for spot networks where the individual transformers have 5% impedance, and the green colored curve is for spots with 7% impedance transformers. The curves in Figure 32 are plotted from eq (30)
(30) $$ \ \ \ P_{GEN} = (\frac{V_{BUS-PU}}{Z_{T-PU}})^2 Z_{T-PU} \cos{\theta_{Z}} \enspace pu \enspace of \enspace kVA \enspace of \enspace eq \enspace xfr$$
In this equation, the terms are defined as follows.
VBUS-PU = spot network bus voltage in per unit = 0.06
ZT-PU = impedance of equivalent network transformer in per unit
θZ = impedance angle of equivalent network transformer

Figure 32:
Generator constant power output that results in six
percent voltage on the spot network bus for a three-phase fault on the
adjacent feeder at substation.
The X to R ratio of the network transformer with 5% and 7% impedance typically will be above 6. Based on this, the curves of Figure 32 suggest that as long as the output of the constant power generator does not exceed about 1% of the kVA rating of the equivalent network transformer in the spot network, the protectors would not trip for the adjacent feeder three-phase fault, due to the low voltage on the spot network bus.
Constant Power Generation Limits-For Adjacent Feeder Faults
With constant power generation on the spot network, and assuming that all protectors in the spot network have sensitive trip characteristics, the limits for the constant power output that will not trip all protectors can be summarized for the fault on the adjacent primary feeder.
Single Line-to-Ground Fault
For the SLG fault on the adjacent feeder, all network protectors should not trip if the power output of the constant power generator, PGEN, does not exceed 44% of the spot network load.
PGEN <= 44% of spot network load at time of fault.
Double Line-to-Ground Fault
For the DLG fault on the adjacent feeder, all network protectors should not trip if the power output of the constant power generator, PGEN, does not exceed 11% of the spot network load.
PGEN <= 11% of spot network load at time of fault.
Three Phase Fault
For the three-phase fault on the adjacent primary feeder, all network protectors should not trip if the power output of the constant power generator does not exceed 1% of the kVA rating of the equivalent network transformer. This assumes that the X to R ratio of the equivalent network transformer is not less than 6. Generator power output levels of 1% can produce power reversals in all protectors in the spot network, but the network bus voltage is below the level where the microprocessor relay and protector shunt trip mechanism will function under steady state conditions.
Maximum Allowed DR In Spot Networks Without Time Delay Tripping to Avoid Island Formation for Adjacent Feeder Faults - Constant Current Generation.
In this section, limits are established for constant current generation on the spot network that will not satisfy the network relay sensitive trip characteristic for the fault on the adjacent primary feeder at the substation. It is assumed that the current output of the generation source is balanced three-phase (positive-sequence only). Figure 3 shows a three-unit spot network with positive-sequence constant current generation, I1GEN, and a fault on the adjacent primary feeder. Each network transformer is assumed to be identical, and at the substation all bus-tie breakers are closed. Looking into the substation medium-voltage bus that supplies the network primary feeders, the positive-sequence and zero-sequence impedances, Z1S and Z0S respectively are known.

Figure 33:
Spot-network with balanced (positive-sequence) constant
current generation and fault on adjacent primary feeder.
The load on the spot network paralleling bus is assumed to be constant impedance (balanced), which draws current proportional to the applied sequence voltages respectively. Considered will be the constant current generation limits which will not satisfy the network relay sensitive trip characteristic for the single line-to-ground (SLG) fault, the double line-to-ground fault (DLG), and the three-phase fault.
Single Line-to-Ground Fault
Figure 34 shows the interconnected sequence network for the SLG fault on the adjacent feeder at the substation. To generate the impedances and quantify the constant current generator current, I1GEN, the following terms are defined:
KVAL = kVA rating of the constant impedance load at rated voltage.
PFPU = Load’s power factor (positive-sequence) in per unit
The loads positive-sequence impedance in per unit on a base of KVAL is:
Z1L-PU = 1.00 per unit on a base of KVAL
The positive-sequence current drawn by the load, I1L-PU in per unit on base KVAL at any positive-sequence network voltage, V1N in per unit, is the same as the per unit voltage on the network bus:
(31) $$ \ \ \ I_{1L-PU} = V_{1N-PU} / Z_{1L-PU} = V_{1N-PU} $$
Equation (31) basically states that the positive-sequence current drawn by the constant impedance load, in per unit of the load current at rated voltage, is the per-unit value of the network positive-sequence voltage during the SLG fault.
I1GEN is the balanced (positive-sequence) current output of the constant current generator. As shown by the current phasors in Figure 34, the generator positive-sequence current output shown in red, I1GEN, is assumed to be in phase with the network positive-sequence voltage V1N, shown in blue, which represents the worst case. The current drawn by the load in per unit, shown in orange as I1L, lagging the network positive-sequence voltage by angle θI, where this angle is determined by the load power factor.
Figure 35 shows these current phasors in orange color in more detail, where in per unit the load current I1L is shown as V1N at angle θI.

Figure 34:
Sequence network connections for a SLG fault on the
adjacent primary feeder with constant current generation on the spot
network.

Figure 35:
Details of current phasors at network bus.
In Figure 35, the positive-sequence current in the network protectors, shown as I1 in blue, is in per unit and equals the vector sum of the per unit load current in orange, V1N, and the generator current in per unit, I1GEN shown in red.
Assuming that the network relay has a straight-line trip characteristic with a trip-tilt angle of 95 degrees, or that it has the “gull-wing” trip characteristic, when the generator current, I1GEN, is at the value where the protector current I1 shown in blue lags by 85 degrees, the relay sensitive trip characteristic is satisfied. The value of I1GEN which results in a trip condition is found from eq (32)
(32) $$ \ \ \ I_{1GEN} = V_{1N} [PF_{PU} - \sqrt{1 - PF_{PU}^2} \tan{5\degree}] \enspace per \enspace unit \enspace of \enspace load $$
The value given by eq (32) applies for both the network relay which has the positive-sequence directional overcurrent sensitive trip characteristic, and also a relay with a power-based trip algorithm that uses the nominal voltage magnitude for the P-Q calculations. The approach assumes the load on the spot network draws a current, in per unit of load rated current at rated kVA, which equals the positive-sequence voltage on the network during the fault. Further, the approach is conservative because:
-
It neglects the current and power drawn by the network loads negative-sequence impedance.
-
It assumes that the constant current generator output, I1GEN is in phase with the network line-to-ground voltage, V1N, and supplies only real power.
Double Line-to-Ground Fault
For the double line-to-ground fault (DLG) on the adjacent feeder at the substation, the sequence networks are connected in parallel at the fault point, as shown in Figure 36. For the DLG fault at the substation, the positive-sequence voltage is lower than that for the SLG fault.

Figure 36:
Sequence-network connections for a DLG fault on the
adjacent primary feeder with constant current generation on the spot
network.
Equation (32) also applies for finding the maximum constant current generation that will not trip network protectors for the DLG fault on the adjacent primary feeder, but for the DLG fault the value used for V1N in per unit is that resulting from the DLG fault. As discussed before, for practical purposes the per unit positive-sequence voltage on the network bus for both the SLG and DLG fault on the adjacent primary feeder at the substation is the same as that on the substation bus, or, V1N = V1S. And the positive-sequence voltage on the substation bus during the SLG and DLG faults, assuming solid or reactance grounding, is a function of the X0 to X1 ratio at the substation MV bus.
Figure 37 plots the maximum generator current output, in per unit of the network load current at rated voltage, where the relay sensitive trip criterial will just be met. The red and blue colored curves are for the SLG fault, and the green and purple colored curves are for the DLG fault, where the curves are given for an X0 to X1 ratio of 1.0 (approximately solid grounding), and for a ratio of 3 (upper limit for effective grounding). The curves assume that the reverse current sensitive trip setting at 180 degrees (0.15% or 0.0015 per unit) is small in comparison to the per-unit positive-sequence voltage on the network bus during the fault on the adjacent primary feeder.

Figure 37:
Maximum size constant current generator that will not
result in tripping of protector sin spot network for the SLG and DLG
faults on the adjacent primary feeder.
From Figure 37, conservative guidelines can be stated on the limits for constant current generation in the spot network bus which will not trip all network protectors for the SLG and DLG faults on the adjacent primary feeder. They are based on a network load power factor of 80 percent, and solid grounding of the medium-voltage system at the substation (X0 /X1 = 1.0).
-
For the SLG fault on the adjacent primary feeder, all protectors will not trip if the output current of the constant current generator does not exceed 50% of the rated current of the network load at rated voltage.
-
For the DLG fault on the adjacent primary feeder, all protectors in the spot network will not trip if the output current of the constant current generator does not exceed 25% of the rated current of the network load at rated voltage.
Three-Phase Fault With Constant Current Generation
For the three-phase fault on the adjacent primary feeder at the substation, the spot network is represented with an equivalent transformer between the substation and the spot network bus, as shown in Figure 38. The kVA rating of the equivalent network transformer, KVATEQ, is given by eq (33).
(33) $$ \ \ \ KVA_{TEQ} = N_{T}KVA_{T} $$
Where:
NT = Number of network transformers in the spot network
KVAT = kVA rating of each network transformer
RT = Resistance of equivalent transformer, which in percent is the same as that for each network transformer
XT = Reactance of equivalent transformer, which in percent is the same as that for each network transformer
As shown in Figure 38 (a), the generator output current, IG, is assumed to be balanced (positive-sequence) and stay constant at rated value in per unit of the rated current of the equivalent network transformer. The load on the network bus, represented by resistance RL and reactance XL is assumed to draw no current during the three-phase fault due to the network bus voltage being low. Finally, as shown in Figure 38 (b), the angle of the current in the transformer, IT, relative to the network voltage VN is 180o - θZ, where θZ is the impedance angle of the network transformer.

Figure 38:
Constant current generation on spot network with
three-phase fault on the substation bus.
At the bottom of Figure 38 is the sensitive trip curve of the relay, assumed to be a straight line, with its position relative to VN at angle zero defined by angle θM.
The amount of constant current generation that will result in satisfying the sensitive trip characteristic of the relay depends upon the type of relay in the network protector. Considered are a relay that does a power calculation based on the actual value of the network voltage, a relay which has a positive-sequence directional overcurrent characteristic, and a relay that does a power calculation based on the nominal line-to-ground voltage of the network.
Power Based Relay Using Actual Voltage Magnitudes
The basis for the limit on the generator current output to a level that just satisfies the trip criteria of a power-based relay that uses actual voltage magnitudes is given below.
With reference to Figure 38, the generator current in per unit of the kVA rating of the equivalent network transformer is given by eq (34).
(34) $$ \ \ \ I_{G-PU} = \frac{P_{GEN}}{KVA_{TEQ}} \enspace pu \enspace of \enspace KVA_{TEQ} $$
In this equation, PGEN is the nominal power rating of the constant current generator at rated voltage, and KVATEQ is the kVA rating of the equivalent network transformer representing the spot network.
With a three-phase fault on the substation bus as in Figure 38 (a), the reverse power flow, PBACK, in the network protector on the secondary side of the equivalent network transformer in per unit of the kVA rating of the equivalent network transformer is:
(35) $$ \ \ \ P_{BACK} = I_{G-PU}^2 R_{T-PU} \ I_{G-PU}^2 Z_{T-PU} \cos{\theta_{Z_{Z}}} \enspace pu \enspace of \enspace KVA_{TEQ} $$
In eq (35), ZT-PU is the impedance of the equivalent network transformer in per unit of the kVA rating of the equivalent transformer. This is the same as the per unit impedance of each individual network transformer in the spot network. Angle θZ is the impedance angle of the equivalent network transformer, which is the same as that of each network transformer in the spot network
Placing the value for IG-PU given by eq (34) into eq (35), gives the net reverse real power (watt) flow in the equivalent network transformer for the three-phase fault on the substation bus. The reverse power flow in the protector is simply the I2R losses in the resistance of the equivalent network transformer.
(36) $$ \ \ \ P_{BACK} = (\frac{P_{GEN}}{KVA_{TEQ}})^2 \frac{Z_{T ﹪}}{100} \cos{\theta_{Z}} \enspace pu \enspace of \enspace KVA_{TEQ}$$
Figure 38 (b) shows the sensitive trip characteristic of the network relay. The magnitude of the current required to make the trip contact in terms of angles θM and θZ is given by eq (37). RCT is the 180-degree sensitive trip setting. If RCT is in amperes, then IT is in amperes. If RCT is in percent of CT rating, then IT is in percent of CT rating of the equivalent network protector.
(37) $$ \ \ \ I_{T} = RCT \frac{\sin{(90 + \theta_{M})}}{\sin{(90 - \theta_{M} - \theta_{Z})}} $$
With a network relay having a power trip algorithm using the magnitude of the actual network line-to-ground voltages, the power required to make the trip contact, in per unit of the kVA rating of the equivalent network protector, KVANWP-EQ, for a current at an angle of 180 degrees is:
(38) $$ \ \ \ P_{TRIP-PU-NWP} = \frac{RCT_{﹪}}{100} \enspace pu \enspace on \enspace kVA \enspace rating \enspace of \enspace eq \enspace NWP $$
The ratio of the rated current of the CT for the equivalent network protector, to the rated current for the equivalent network transformer is defined as “K”:
(39) $$ \ \ \ K = \frac{\enspace Rated \enspace Current \enspace of \enspace CT \enspace of \enspace equivalent \enspace NWP}{ \enspace Rated \enspace Current \enspace of \enspace Equipment \enspace NWK \enspace XFR} $$
Thus, the power required to make the network relay trip contact in per unit of the “kVA” rating of the protector is
(40) $$ \ \ \ P_{TRIP-PU-NWP} = \frac{RCT_{﹪}}{100} \frac{\sin(90 + \theta_{M})}{\sin{(90 - \theta_{M} - \theta_{Z})}} \cos{\theta_{Z}} \enspace pu \enspace on \enspace KVA_{NWP-EQ} $$
The power required to make the network relay trip contact in per unit of the kVA rating of the equivalent network transformer is:
(41) $$ \ \ \ P_{TRIP-PU-XFR} = K\frac{RCT_{﹪}}{100} \frac{\sin{(90 + \theta_{M})}}{\sin{(90 - \theta_{M} - \theta_{Z})}} \cos{\theta_{Z}} \enspace pu \enspace on \enspace KFA_{TEQ} $$
Equating PBACK given by eq (36) to PTRIP-PU-XFR as given by eq (41) gives:
(42) $$ \ \ \ (\frac{P_{GEN}}{KVA_{TEQ}})^2 \frac{Z_{T﹪}}{100} \cos{\theta_{Z}} = K\frac{RCT_{﹪}}{100} \frac{\sin{(90 + \theta_{M})}}{\sin{(90 - \theta_{M} - \theta_{Z})}} \cos{\theta_{Z}} $$
Solving for the ratio of PGEN to KVATEQ gives the constant current generator current output in per unit of the rated current of the equivalent network transformer, KVATEQ.
(43) $$ \ \ \ I_{G-PU} = \frac{P_{GEN}}{KVA_{TEQ}} = \sqrt{K\frac{RCT_{﹪}}{Z_{T ﹪}} \frac{\sin{(90 + \theta_{M})}}{\sin{90 - \theta_{M} - \theta_{Z}}}} $$
Figure 39 plots 100 times the value given by eq (43), so it gives constant current generator current in percent of the rated current of the equivalent network transformer where the relay sensitive trip criterion is satisfied. It applies when the network relay has a power-based trip criterion where the power calculations are done using the actual line-to-ground voltage magnitudes on the spot network bus.
From Figure 39, it is seen that a considerable amount of constant current generation can be connected to the spot network without satisfying the network relay sensitive trip criterion. However, this is theoretical as it assumes that for the three-phase fault on the adjacent feeder at the substation, the voltage on the spot network bus is high enough for the network relay power supply and trip logic to function.
Figure 40 plots the voltage on the spot network bus when the constant current generation is at the level where the power-based relay (actual voltages) sensitive trip criterion is satisfied as given in Figure 39. At the constant current generation levels where the sensitive trip criterion of the power based relay is satisfied, the voltage on the spot network bus is at the level where the power supply of the microprocessor relay will not function under steady state conditions, and where the network protector trip mechanism will not operate under steady state conditions. From this it might be concluded that the network protectors in the spot network could not open for the three-phase fault on the adjacent primary feeder.
However, for the three-phase fault on the adjacent primary feeder, the voltage seen by the network relay would be similar that shown in Figure 29, where the duration of the voltage dip on the network bus may only last for 5 or 6 cycles when normal clearing occurs from the substation.

Figure 39:
Maximum size constant current generator current in per
cent of the rated current of the equivalent network transformer for
three-phase fault, power based relay using actual voltage magnitudes,
Until the response of the power supply of the microprocessor network relays during voltage dips as occur for the three-phase fault on the adjacent primary feeder is known, a conservative approach should be taken.
If the constant current generator current exceeds the level in Figure 39, the protector may trip if the microprocessor relay power supply and relay logic functions for the voltage dip on the network bus, and the protector trip mechanism functions for the voltage dip. To prevent opening of all protectors, time delay tripping could be incorporated in the network relay, with the time delay set greater than the time for the breaker to clear the three-phase fault on the adjacent primary feeder.
Positive-Sequence Directional Overcurrent Relay and Power-Based Relay Using Nominal Voltage for Calculations

Figure 40:
Spot-network bus voltage in percent for a three-phase
fault on the adjacent feeder, with constant current generation at the
level where the relay sensitive trip criterion would be met, power based
relay using actual voltage magnitudes.
When the network protectors in the spot network have microprocessor relays with the positive-sequence directional overcurrent trip characteristic, and assuming the relay power supply and relay logic will function during the voltage dip from the three-phase fault on the adjacent primary feeder, the amount of constant current generation that will result in satisfying the sensitive trip characteristic can be found.
The output current of the constant current generator, in per unit on the base kVA of the equivalent network transformer in the spot network is given by eq (44), where PGEN is the rated power of the constant current generator.
(44) $$ \ \ \ I_{G-PU} = \frac{P_{GEN}}{KVA_{TEQ}} \enspace pu \enspace of \enspace KVA_{TEQ} $$
Neglecting the effect of the load connected to the spot network paralleling bus, the generator current will flow back in the equivalent network transformer to the three-phase fault, and as shown in Figure 38 will lead the network line-to-ground voltage by 180-θZ degrees.
Considering the trip characteristic of the positive-sequence directional overcurrent relay, as shown in the bottom half of Figure 38, the magnitude of the current required to intercept the straight-line sensitive trip curve is given by eq (45):
(45) $$ \ \ \ I_{T-PU-NWP} = \frac{RCT_{﹪}}{100} \frac{\sin{(90 + \theta_{M})}}{\sin{(90 - \theta_{M} - \theta_{Z})}} \enspace pu \enspace on \enspace KVA_{NWP-EQ} $$
Equation (45) gives the current in per unit on the kVA rating of the equivalent network protector on the secondary side of the equivalent network transformer.
The current required to intercept the relay trip curve in per unit on the kVA rating of the equivalent network transformer, KVATEQ, is given by eq (46), where “K” is defined by eq (39).
(46) $$ \ \ \ I_{T-PU-TEQ} = K\frac{RCT_{﹪}}{100} \frac{\sin(90 + \theta_{M})}{\sin{(90 - \theta_{M} - \theta_{Z})}} \enspace pu \enspace on \enspace KVA_{TEQ} $$
To find the constant current generator current that will result in a trip, eq (44) is equated to eq (46) giving the following:
(47) $$ \ \ \ I_{G-PU} = \frac{P_{GEN}}{KVA_{TEQ}} = K\frac{RCT_{﹪}}{100} \frac{\sin{(90 + \theta_{M})}}{\sin(90 - \theta_{M} - \theta_{Z})} \enspace pu \enspace on \enspace KVA_{TEQ} $$
One hundred times the value given by eq (47) is plotted in Figure 41, which gives the constant current generator current in percent of the rated current of the equivalent network transformer at which the sensitive trip characteristic is satisfied. The angle of the trip curve, shown as θM in Figure 41 has a significant effect on the current which satisfies the sensitive trip criterion. When θM is 5 degrees as shown by the red colored curve, this corresponds to a straight-line sensitive trip curve with a ‘trip-tilt” angle of 95 degrees. When θM is zero degrees, this corresponds to a trip-tilt angle of 90 degrees. When the network relay has the “gull-wing” trip curve, θM is -5 degrees as shown by the green colored curve in Figure 41.

Figure 41:
Maximum size constant current generator current in per
cent of rated current of the equivalent network transformer for the
three-phase fault, directional positive-sequence overcurrent relay.
As discussed in Network Protector Relaying, the preferred sensitive trip characteristic for network protector relays in dedicated feeder network systems is the “gull-wing” characteristic, as it provides good margins for detecting high-current backfeeds when the network transformers have high X to R ratios, and provides reliable detection of capacitive backfeeds when the primary feeder breaker is opened in absence of a fault.
The curve in Figure 41 also applies to network protector relays which use a power-based algorithm where the nominal voltage magnitude is used for the P and Q calculations.
With microprocessor relays in the network protectors, the response of the relay’s power supply and trip logic during the voltage dip for the three-phase fault on the adjacent primary feeder is not known. Similarly, the effect of the voltage dip on the protector trip mechanism is not known. Assuming that the relay power supply can ride through the dip for the duration required for the breaker for the faulted feeder to trip, the curves in Figure 41 suggest that the protectors could trip, and form an island. If that is true, incorporating time-delay tripping of the network protectors would prevent formation of an island for the three-phase fault on the adjacent primary feeder.
Figure 42 plots the voltage on the spot network bus in percent with the three-phase fault on the adjacent primary feeder when the network relay sensitive trip characteristic is satisfied. Clearly the microprocessor relay power supply, trip logic, and the protector shunt trip mechanism would not function at these voltage levels under steady-state conditions

Figure 42:
Spot-network bus voltage in percent for a three-phase
fault on the adjacent feeder, with constant current generation at the
level where the relay sensitive trip criterion would be met,
positive-sequence based relay..
Summary for Adjacent Feeder Faults Constant Current Generation
-
For the SLG fault on the adjacent primary feeder, the relay sensitive trip criterion should not be satisfied if the constant current generation is less than 50% of the spot network load current at time of fault.
-
For the DLG fault on the adjacent primary feeder, the relay sensitive trip criterion should not be satisfied if the constant current generation is less than 25% of the spot network load current at time of fault.
It should be noted that for the SLG and DLG faults on the adjacent primary feeder, the voltages on the spot network paralleling bus are sufficiently high enough so that the power supply of the microprocessor relays will function, and the network protector trip mechanisms will function.
- For the three-phase fault on the adjacent primary feeder, the network relay with the directional positive-sequence trip characteristic, and with a power based trip characteristic using the nominal voltage magnitude for the P-Q calculations, should not trip if the constant current generator current is less than 1% of the rated current of the equivalent network transformer, assuming that the relay power supply, relay logic, and protector trip mechanism will function during the voltage dip for the adjacent feeder three-phase fault.
Because it is not known how the microprocessor relay power supplies will function during the voltage dip during the three-phase fault, time delay tipping should be used with the network relays in spot networks with DR to avoid forming an island. The time delay would be set higher than the time to clear the fault on the adjacent primary feeder.
Area Network Applications
Determining the impact of generation located in area networks under normal and fault conditions is extremely complex, requiring detailed modeling of the system and generation. Presented in this section are some simple models for the area network and generation sources within the area network. From these models, very conservative estimates can be made for the amount of generation that can be connected to the area network without forming an island during the adjacent feeder fault. It is assumed that the network relays have just the sensitive trip characteristics and settings and that time delay tripping is not permitted in network protectors in the area network, as is the practice in many area networks. The results obtained with the simplified analysis are very conservative, but until the dynamic response of the network relay power supply, the network relay logic, and the network protector trip mechanism are known for the adjacent feeder three-phase fault, and the responses of the distributed generation sources are known during the voltage dips that occur during a three-phase fault on the adjacent feeder, the conservative limits should be adhered to.
In arriving at the limits, the output of the distributed resource during the adjacent feeder fault is assumed to be either constant power (kW) or else balanced constant current. Two sensitive trip characteristics are considered for the network relay.
For the power-based relay, it is assumed the relay trip algorithm makes its calculations using the magnitude of the actual network line-to-ground voltages. For the positive-sequence directional overcurrent relay, the current required to satisfy the sensitive trip criterion is independent of the magnitude of the positive-sequence network voltage. The power-based relay that does its calculations using the magnitude of the network nominal line-to-ground voltage is also considered.
Synchronous Generation in Area Networks
Many network operators do not allow synchronous generators in the secondary of the area (grid) network. The reason for this is discussed with the simple system of Figure 43 and subsequent figures.
Under normal conditions, all network protectors are closed, there are no blown cable limiters, and the grounding of the secondary system is controlled by the utility, though the connections of the network transformers, usually delta wye-grounded.

Figure 43:
Area-network with a synchronous generator at Service 1,
and all network protectors closed.
With the delta wye-grounded connections for the network transformers, at the secondary (LV) terminals of the transformers, the X0 to X1 ratio is about 1. At any point in the secondary grid where most of the Thevenin impedance is due to secondary mains with phase-grouped cables, the X0 to X1 ratio typically is 3 or less, meaning the secondary system is effectively grounded. Thus, if a single line-to-neutral fault occurs, the line-to-neutral voltages at the fault point on the unfaulted phases will not exceed 125% of nominal voltage, and will be less at other points going towards the delta wye-grounded network transformers. But if a section of the secondary became isolates and energized from a synchronous generator, the grounding of the secondary may not be effective, depending on the grounding utilized with the synchronous generator, over which the utility may have little or no control. Low-voltage three-phase four-wire systems must be effectively grounded, preferably solidly grounded.
If cable limiters are blown as shown in Figure 44, where the limiters are blown at manhole 1 (MH1) and at manhole 2 (MH2), with a synchronous generator in the secondary, dropping of load at a service, other than the one with the synchronous generator, can result in island formation.

Figure 44:
Area-network with synchronous generator at Service 1,
blown cable limiters at MH1 and MH2, all protectors closed.
In Figure 44 with the blown cable limiters, as long as the real power output of the synchronous generator, PG, is less than the load powers P1, P2, and P3 in the secondary, the real power flow in network protector 3 (NWP3) will be into the network as shown with the red arrow. With NWP3 closed, the secondary system will be effectively grounded and its voltage controlled by the network transformer associated with NWP 3. Under these conditions:
$$ \ \ \ P1 + P2 + P3 \gt PG $$
However, should a load at a service other than the one with the synchronous generator be disconnected, say load P3+jQ3 in Figure 44, the output of the synchronous generator, PG, could exceed the sum of P1 and P2, and the real power flow in network protector 3 (NWP3) would be in the reverse direction as shown in Figure 45. As most always network protectors supplying the area network have only a sensitive trip characteristic with a sensitive trip time in the 3 to 6 cycle range, when the load P3+jQ3 is disconnected, NWP 3 trips and the island in the secondary is supplied by the synchronous generator. In this island, customers have loads connected from phase-to-neutral and phase-to-phase. With phase-to-neutral loads the system must be effectively grounded to control the phase-to-neutral voltages during normal loading. But with NWP3 open, the grounding of the system is determined by the grounding applied with the synchronous generator at Service 1, over which the utility may have little or no control. With the secondary energized by the synchronous generator, it could result in over and under phase-to-neutral voltages that could damage customer loads at other services.
After the network protector NWP 3 opens as shown in Figure 46, the island is formed, with the voltages and frequency in doubt. If the synchronous generator maintains voltage in the isolated island, it can result in damage to the customer loads at services other than where the synchronous generator is located. Also, if the island remains energized by the synchronous generator as in Figure 46, the voltages on the network and transformer sides of the open network protector, NWP3, are not synchronized. As is possible in spot networks should an island form, at the open network protector the phasing voltage could fall within the close region of the network relay, but by the time the network protector arcing contacts close, there could be significant angle difference between the systems on the opposite sides of the network protector, and equipment could be damaged due to closing out of phase. The network relays were never intended to function between two non-synchronized systems on opposite sides of an open network protector.

Figure 45:
Area-network with synchronous generator at service 1,
with load P3+jQ3 disconnected.
As shown, with synchronous generation in an area network, a combination of blown limiters and load disconnecting can result in formation of an island, with resultant damage to customer load from over/under voltage and frequency, as well as damage to equipment if a network protector closes automatically when the systems on opposite sides are out of phase. It is for these reasons that some system operators will not allow customers to connect synchronous generator to the area (grid) network. However, they will allow synchronous generators on the spot network.
In summary, prior to formation of the island, the X0 to X1 ratio of the secondary system will be less than 3, and the R0 to X1 ratio will be less than 1.0, and the system is suitable for supplying phase-to-neutral load. But following island formation, the system grounding and system voltage with synchronous machines are questionable.
Loading Under Unfaulted Conditions
Although it is possible with the Coulter Procedure to determine the minimum load needed on spot networks to keep all network protectors closed (maintain a forward real power flow), the same is not true for area networks. The impedances of the secondary mains and secondary tie circuits that connect the network protectors are similar to the impedances of the network transformers (see Secondary Grid Design Considerations), with the loads connected to the secondary system at different points throughout the area (grid) network. It is not possible to break the total kW flow in each network protector in an area network into an equal load component and circulating component, as can be done for spot networks.
In the area network of Figure 47, the total load, shown as PLOAD, is due to the load supplied to the customers, plus I2R losses in the secondary main, tie circuits, and services. The division of PLOAD between the network protectors can be determined most accurately from real-time monitoring, or calculated with power flow programs.
If a single generation source is added to the area network as shown in Figure 48, it will reduce the forward power flow in each network protector, but not by the same amount. With the generator added to the area network, the total power flow in each protector consists of the flow without the generator, being into the network, and a negative or reverse flow due to the generator. The reverse or negative flow in each protector is not the same, because of the impedance of the secondary cable circuits in the area network connecting the network transformers, whereas in a spot network these impedances are near zero. As the kW output of the generation in Figure 48 is increased, it reaches a level where in one protector the negative flow from the generation exceeds the positive flow from the load, and that protector will trip. Determining which protector in the area network will trip first when there is just one generation source in the area network is a challenging task. When multiple sources of generation are connected to the area network, determining how much can be added at different points throughout the area network without causing a network protector to trip is a problem with an infinite number of combinations that must be studied.

Figure 46:
Area network with synchronous generator at service 1,
with load P3+jQ3 disconnected and NWP 3 open.

Figure 47:
Area-network without generation sources.

Figure 48:
Area network generator power flow distribution between
the closed network protectors.
It is believed that, if the generation in the area network is limited to the sizes as conservatively determined by considering the adjacent feeder fault, as discussed in the following sections, the generation will have minimum impact on network protector tripping and auto closing during unfaulted conditions. This is referred to as the “de minimus” amount. IEEE 1547.6-2011 states that “De minimus is a legal phrase that translates to a minimal or insignificant effect on the subject in question. Here, de minimus is used to imply a level of DR capacity that may be interconnected to an area network without the need for detailed studies by the utility or installation of additional protective measures.
Adjacent Feeder Fault Model
Figure 49 (b) shows an equivalent model for the area network to determine if the adjacent feeder fault results in tripping of all network protectors (sensitive trip only) and forming an island. Island formation is not allowed. The model applies when the primary feeders to the network emanate from the same electrical bus in the substation (all bus-tie breakers closed). Further, it assumes that the adjacent feeder fault is located at the substation at the terminals of the feeder breaker, and that all network transformers are connected delta on the primary side. The results obtained are very conservative for the allowed size of the DR that will not result in island formation.
In the model of Figure 49 (b), the substation is represented by Thevenin equivalents in the positive-, negative-, and zero-sequence networks. Between the substation and the low-voltage secondary, the system is represented with an equivalent network transformer having a kVA rating equal to the sum of the kVA ratings of all network transformers in the area network, and an impedance found by paralleling the impedances of all network transformers. Thus, the kVA rating of the equivalent network transformer, KVATEQ, is the total installed network transformer kVA in the area network. Associated with the equivalent network transformer is an equivalent network protector whose current transformer (CT) has a rated current equal to a factor, K, times the rated current of the equivalent network transformer, KVATEQ.
The equivalent load is the total load on the area network at the time of interest. It is assumed to be balanced, constant impedance, having the same impedances in the positive-and negative-sequence networks, with no mutual impedances between the loads self-sequence impedances. The model of Figure 49 (b) is the same as that used to determine the limits for the DR on spot networks presented earlier. In effect, for the area network the impedances of the secondary cable circuits are neglected (assumed to be zero) in finding the amount of generation that will not trip all network protectors for the fault on the adjacent primary feeder.
The generation in the area network is treated as either a constant power source delivering during the adjacent feeder fault, the same electrical output power as its rating, or as a constant current source delivering during the adjacent feeder fault a current corresponding to its power rating and nominal voltage. This is the same approach as used for the spot network, so the results for the area network are conservative due to neglecting the impedance of the secondary circuits.
Considered first are the single line-to-ground (SLG) and the double line-to-ground (DLG) fault on the adjacent feeder at the substation, and finally the three-phase fault. By reference to Figure 49 (b), the simplified model used for the area network, and the model used for the spot network in Figures 21 and 26, are basically the same, except for the area network the load is the total on the area network, and the equivalent network transformer has a kVA rating equal to the total kVA of all network transformers feeding the area network. Thus, the guidelines developed for spot networks also apply to the area network, except that the allowed generation on the area network for the SLG and DLG faults is a percentage of the total load on the area network. And for the three-phase fault on the adjacent feeder, the allowed generation that will not satisfy the sensitive trip characteristic of all network relays is a function of the size of the equivalent network transformer, KVATEQ, for the area network As indicated before, the results from this model are very conservative as the impedances of the secondary mains and tie circuits are neglected (assumed to be zero), and the power drawn by the secondary load and secondary I2R losses during the three-phase fault on the adjacent primary feeder is neglected. Further the faults are right at the substation rather than out on the primary feeder.

Figure 49:
Area network model for the adjacent feeder fault
analysis.
SLG and DLG Fault on the Adjacent Primary Feeder-Constant Power Generation
With constant power generation, the power output of the generator is assumed to be balanced and remain constant during the adjacent feeder SLG fault and the DLG fault, The size of the constant power generation which will not trip all protectors for the SLG and DLG fault on the adjacent primary feeder is a function of the grounding of the primary system at the substation, just as with the spot networks. For the SLG and DLG faults on the adjacent primary feeder, the constant impedance load in the area network can draw considerable power. As with the spot network, the size constant power generator that will not trip all protectors for the adjacent feeder faults is a function of the X0 to X1 ratio at the substation, which is determined by the grounding.
Assuming reactance grounding, Tables 3 and 4 list the maximum size for the constant power generation that will not result in tripping of all network protectors, having just the sensitive trip characteristic. The sizes given in the last column are the generator power output, in per unit of the constant-impedance three-phase load on the area (grid) network prior to fault, where there is no reverse power (kw) in the equivalent network transformer. For the SLG and DLG fault on the adjacent primary feeder, the voltage in the secondary is high enough so that the power supply of microprocessor network relays will function, and the network protector trip mechanism will operate and open the protector if the network relay trip contact makes.
Table 3:
Limit on area network constant power generation for SLG
fault on adjacent primary feeder.
| X0 / X1 | VIN-PU | PGEN in per unit of Area Network 3-ϕ Load Prior to Fault |
|---|---|---|
| 1.0 | 2/3=0.667 | 4/9 =0.444 |
| 3.0 | 4/5=0.80 | 16/25=0.64 |
As indicated before, the guides in Tables 3 and 4 are extremely conservative for the area network, as they neglect the impedances and I2R losses of secondary cable circuits.
Another consideration for the adjacent feeder SLG and DLG fault is the clearing time of the feeder breaker. If the clearing time of the feeder breaker is less than the sensitive trip time of the microprocessor relays in the protector, the network protectors in the area network would not trip for the adjacent feeder faults, either SLG, DLG, or three-phase.
Table 4:
Limit on area network constant power generation for DLG
fault on adjacent primary feeder.
| X0 / X1 | VIN-PU | PGEN in per unit of Area Network 3-ϕ Load Prior to Fault |
|---|---|---|
| 1.0 | 1/3=0.33 | 1/9=0.111 |
| 3.0 | 3/7=0.4286 | 9/48=0.1837 |
Adjacent Feeder Three-Phase Fault, Constant Power Generation
For the three-phase fault on the adjacent primary feeder at the substation, the size of the constant power generator that will not satisfy the network relay sensitive trip criterion in all protectors, when the relay has either a positive-sequence directional over current trip characteristic, or if the relay is power based performing the P and Q calculations using the nominal voltage magnitude, is quantified in terms of the size of the equivalent network transformer, KVATEQ. The size of the equivalent network transformer for the area network is found from eq (48).
(48) $$ \ \ \ KVA_{TEQ} = \sum_{i=1}^{I=NT} KVA_{Ti} $$
In eq (48), the terms are defined as follows:
$$ \ \ \ NT = \enspace number \enspace of \enspace transformers \enspace in \enspace area \enspace network $$
$$ \ \ \ KVA_{n} = \enspace kVA \enspace of \enspace network \enspace transformer \enspace i $$
Figure 50 plots the size of the generator kW in percent of the size of the equivalent network transformer, KVATEQ, where the relay sensitive trip characteristic is satisfied, of course assuming the relay power supply functions during the voltage dip in the network for the three-phase fault on the adjacent primary feeder. Three curves are given for different slopes of the straight-line sensitive trip curve, as defined by angle θM in the Figure. When θM is +5 degrees as shown by the red-colored curve, this corresponds to what some relay manufacturers call a trip-tilt angle of 95 degrees. And if θM is -5 degrees as shown by the green colored curve, this corresponds to a trip-tilt angle of 85 degrees. This is also the curve that would apply when the network relay has the “gull-wing” sensitive trip curve as given in Figure 23 of Network Protector Relaying.
From Figure 50, the amount of constant power generation that can be connected to the area network without tripping all protectors, positive-sequence trip characteristic, for the three-phase fault in miniscule.
Figure 51 plots the network “bus” voltage in percent when the relay sensitive trip criterion is satisfied as given in Figure 50. From these curves it is seen that the power supplies of the microprocessor network relays would not function under steady state conditions at the voltage levels given by the curves.in Figure 51.
However, as is the situation for the spot networks, the duration of the voltage shown in Figure 51 is the time required to clear the adjacent feeder three-phase fault. The shape of the voltage applied to the network relay would be similar to that in Figure 29, where the duration of the dip may last for only 6 cycles or less. Even if the network relay power supply and logic works during the adjacent feeder three-phase fault, and the relay makes its trip contact, it is not known if the network protector trip mechanism will function during the voltage dip.

Figure 50:
Amount of constant power generation that can be applied
with area network without tripping all network protectors for adjacent
feeder three-phase fault, sequence based network relay and power based
using nominal voltage for P-Q calculations.

Figure 51:
Voltage in percent in the network during the
three-phase fault on the adjacent primary feeder with the faulted feeder
breaker closed.
With the constant power generation in the area network, it is the author’s opinion that most likely all network protectors would not trip for the adjacent feeder three-phase fault, due to the low-voltage on the network bus as given in Figure 51. Also, as the fault is moved out the primary feeder away from the substation, the voltage on the network will be higher, and the load on the network can draw more power.
Figure 52 plots the size of the constant power generator in the area network, in percent of the kVA rating of the equivalent network transformer, KVATEQ, as given by eq (14-48) which results in the network bus voltage during the adjacent feeder three-phase fault being 6%, or 7.5 volts on a 125-volt base. At 6% voltage, the power supply in the microprocessor relay would not function under steady state conditions. Its response during the voltage dip is not known, but quite likely the relay would not make its trip contact.

Figure 52:
Amount of constant power generation in percent of the
kVA rating of the equivalent network transformer which results in 6%
voltage on the network bus for the three-phase fault on the adjacent
feeder.
In area networks operating at 208Y/120 volts nominal, the X to R ratio of the newer network transformers with low losses and 5% impedance would probably be 6 or higher. From Figure 52, as long as the constant power generation did not exceed about 1% of the kVA rating of the equivalent network transformer as given by eq (48), the voltage on the network bus would not exceed 6 percent for the three-phase fault on the adjacent feeder. Whether the protectors would trip when the voltage drops to 6 percent for a duration between 3 and 6 cycles is not known.
SLG and DLG Fault on the Adjacent Primary Feeder-Constant Current Generation
With a constant current generator in the area network, and either a SLG or a DLG fault on the adjacent feeder at the substation, there is sufficient voltage in the network to allow the constant impedance loads to draw real power. As with spot networks, the voltages on the network bus and in the network are determined by the grounding of the medium-voltage system at the substation, which for solid or reactance grounding is defined by the ratio of X0 to X1. The maximum amount of constant current generation in percent of the current that the network load draws prior to fault is given by Figure 53 for the SLG fault (red- and blue-curves), and for the DLG fault (green- and purple-curves).
From these curves, as long as the current output of the constant current generator does not exceed 50% of the load current for the SLG fault, and 25% of the load current for the DLG fault, all network protectors in the area (grid) network will not trip for the adjacent feeder faults with constant current generation.

Figure 53:
Amount of constant current generation in an area
network, in percent of the rated current of the load on the area
network, which will not trip all network protectors for the SLG and DLG
fault on the adjacent primary feeder
Adjacent Feeder Three-Phase Fault, Constant Current Generation
The approach for finding the maximum size constant current generator that can be applied in an area network without tripping all protectors, having just sensitive trip characteristics, is similar to that for the constant power generator. The impedance of all secondary circuits is ignored, and the system between the substation and secondary is represented with an equivalent network transformer having an equivalent kVA rating, KVATEQ, as defined by eq (48) and repeated below, where NT is the number of transformers in the area network, and KVATi is the kVA rating of network transformer “Ti”.
(48) $$ \ \ \ KVA_{TEQ} = \sum_{i=1}^{i=NT} KVA_{Ti} $$
Figure 54 plots the maximum size for the constant current generator in percent of the rated current of the equivalent network transformer, sized as given by eq (48), that just results in making the network relay trip contact for a three-phase fault on the adjacent primary feeder. The curve applies for protectors which have:
-
Positive-sequence directional overcurrent relays, having trip characteristic described in Trip Algorithms for Microprocessor Relays.
-
Power based network protector relay which does its P and Q calculations using the magnitude of the nominal voltage, as described in Trip Algorithms for Microprocessor Relays.
The curves in Figure 54, for the three-phase fault on the adjacent primary feeder, are plotted versus the X to R ratio of the equivalent network transformer, for trip curve angles, θM, of +5o, 0o, and -50. As discussed before, it is further assumed that the power supply of the microprocessor relays will function during the dip in voltage in the network for the three-phase fault, having a duration as shown in Figure 29.

Figure 54:
Maximum size constant current generator current in
percent of the rated current of the equivalent network transformer,
KVATEQ which just satisfies the sensitive trip criterion for
the three-phase fault, positive-sequence based network relay or power
based using nominal voltages for P-Q calculations.
Figure 55 shows the voltage on the equivalent network bus for the three-phase fault on the adjacent primary feeder when the sensitive trip characteristic of the network relay is satisfied, either a positive-sequence directional overcurrent relay or a power-based relay using nominal voltage for the P and Q calculations.

Figure 55:
Voltage on equivalent network bus with constant current
generation in area network when the network relay sensitive trip
characteristic is satisfied for three-phase fault,, positive-sequence
based network relay or power based using nominal voltages for P-Q
calculations.
If, during the voltage dip in the network for the three-phase fault on the adjacent primary feeder the relay power supply and relay logic function, and if the network protector trip mechanism functions, then all protectors in the area network would trip if the constant current generation exceeded the limits given by Figure 54. Under steady-state conditions, the relay power supply and protector trip mechanism would not function for the voltage occurring in the area network for the three-phase fault on the adjacent primary feeder as given in Figure 55.
Till the response of the network relay power supply and protector trip mechanism are known for the voltage dip for the three-phase fault on the adjacent primary feeder, it seems reasonable to assume that as long as the constant current generation does not exceed the limits given by the green colored curve in Figure 54, angle θM equal to -5o (trip tilt angle of 85o or the “gull-wing trip characteristic), all network protectors in the area network would not trip and form a island. Thus, for practical purposes, if the constant current generation does not exceed 1% of the rated current of the equivalent network transformer, all protectors will not trip. Probably, much higher levels would not trip all protectors because secondary loads and the impedances of the secondary circuits are neglected in this simplified analysis.
Until more detailed simulation and modeling is performed for the adjacent feeder three-phase fault for area networks where the network protectors have only the sensitive reverse current trip characteristic, limiting constant current generation to 1% of the rated current of the equivalent network transformers should not trip all protector for the adjacent feeder three-phase fault. Higher values most likely would also not trip all protectors as the analysis herein neglects the effects on loads in the secondary and the impedances of the secondary circuits (secondary mains, inter-vault tie circuits, etc.). Detailed modeling and simulations of any particular system must be performed to determine higher acceptable limits.
With the constant current generation in the area network limited to 1% of the rated current of the equivalent network transformer, the constant current generation should have negligible effect on network protector operation in the area network.
Summary
When determining the acceptable amount of DR to be allowed on the area or spot network, the following areas should be considered.
-
The DR should not cause any network protector to exceed its continuous current rating or its fault interrupting rating.
-
The DR should not cause any network protector to separate two dynamic system.
-
The DR should not cause any network protector to connect two dynamic systems.
-
The DR should not cause any network protector to operate more frequently than prior to application of the DR (should not cause cycling, pumping).
-
The network relay settings necessary to accommodate the DR in the secondary network should not delay the network protector from opening for faults on the primary feeders of the network system. With time delay tripping in the network relays and systems with delta wye-grounded network transformers, network protector opening will not be delayed for high-current backfeeds to multi-phase faults on the primary feeder. However, for backfeed to the SLG fault with the feeder breaker open, the backfeed current in the protector may not be high enough to bypass the time delay. The effect of this is that more energy goes into the SLG fault path with the primary feeder breaker open, increasing the chance that a SLG fault will propagate into a multi-phase fault after the feeder breaker opens. Furthermore, the possibility of the arcing ground fault persisting and causing other insulation failures during the backfeed is increased.
-
The presence of DR in the secondary network should not delay or prevent automatic closure of the network protectors.
-
The DR should not energize any portion of an area electric power system (EPS) when the area EPS is de-energized.
-
To accommodate the DR, the settings of the network protector relays should not be adjusted without consent of the operator or the area EPS operator.
Although this chapter has concentrated on problems that can be caused by DR in spot and area networks, there are some advantages to be gained. Marc Diaz-Aguilo (2013) has shown that having DR in the area network can help when conservation voltage regulation is adopted to conserve energy. One major operator of secondary networks has indicated that by having distributed resources on spot networks, in large systems this can reduce load on the substation supplying the secondary network and prevent overloading of substation transformers. Also, during certain contingencies of the primary feeders, having DR in the area (grid) network can help to relieve overloads of secondary mains and prevent undervoltages in pockets of the area network most affected by the primary feeder contingencies.
4.15 - Measures to Reduce Arc-Flash Hazards in 480-Volt Spot Networks
MEASURES TO REDUCE ARC-FLASH HAZARDS IN 480-VOLT SPOT NETWORKS
This chapter presents measures to minimize the arc flash hazards when working on 480-volt network protectors. When working on roll-out type network protectors, the protector must be placed on the maintenance rails. This requires removing the protector fuses on the network side of the open protector, and removing the disconnect links on the transformer side near the bottom of the open protector. In 208Y/120-volt systems, it is the practice of some operators to remove the fuses and disconnect links with both sides of the protector energized (hot). Figure 1 shows a submersible type CM-22 network protector with the housing door open. At the top can be seen for the center and right phases the protector fuses. At the bottom can be seen the disconnect links for the center and right phases.

Figure 1:
Type CM-22 network protector with roll-out unit inside
the enclosure (courtesy Eaton).
When removing the fuses and disconnect links with both sides of the protector hot, the preferred approach is to first remove the transformer-side disconnect links at the bottom. To unbolt the disconnect links, insulated tools are used as the transformer side may be energized. From Figure 1, there are interphase barriers and an insulating plate on the bottom of the protector housing, which help to reduce the chance of a phase-to-phase fault or a phase-to-ground fault on the transformer side of the open protector during link removal. With the disconnect links removed, next the network protector fuses are removed, again using insulated tools as the network side of the open protector frequently is energized. When this is done, the buses in the bottom part of the protector and the moving contacts are de-energized, so that if a fuse or nut/captive washer for a fuse were dropped when removing the fuse, it is less likely to start a fault. Note from Figure 1 that there are also interphase barriers at the top of the protector to minimize the chance of a phase-to-phase or phase-to-ground fault when removing the fuses.
In 208-volt systems, it is fairly common to remove the transformer-side disconnect links and protector fuses with both sides of the protector energized (hot), although some utilities will de-energize the network transformer, in which case the transformer side of the open protector is de-energized. Limited testing and experience have shown that the probability of a sustained arcing fault is quite small in 216-volt network protectors. But in 480-volt network protectors of roll-out design, there have been sustained arcing events which resulted in severe injuries or fatalities.
The first network protector design intended to eliminate the removal of energized disconnect links and energized protector fuses was the type CM-D shown in Figure 2, first introduce around 1975. This draw-out unit of this protector has disconnect-fingers just like medium-voltage and low-voltage power circuit breakers, and was designed to allow racking out the protector from the enclosure after the protector breaker was tripped and held trip free. In this network protector, the fuses are in the external housing located on the top of the protector main enclosure.

Figure 2:
Type CM-D draw-out dead-front network protector with
draw-out unit in enclosure (courtesy Eaton) .
Since the development of the CM-D network protector, both Eaton and Richards have developed newer draw-out type network protectors, as shown in Network Unit Equipment in Figures 43 and 44 for the Eaton design, and Figure 6-39 for the Richards design.
The remainder of this chapter first presents simplified arc-flash calculations to show that if an arcing fault occurs on the network side of an open 480-volt network protector with rollout construction when removing the fuses, the incident arc energy allowed by protector fuses can exceed 100 cals/cm2. Further, if the disconnect links are removed from the protector with the network transformer energized, and a fault occurs on the transformer side of the open protector, since the fault is in the unprotected zone in the conventional system, the incident energy can be much higher.
Removing Disconnect Links and Fuses in Roll-Out Unit
Figure 3 shows a roll-out type network protector installed in its housing with the disconnect links and fuses bolted in place, but the protector main contacts are open. Further, both the transformer side and network side of the protector are energized.

Figure 3:
Roll-out type network protector with disconnect links
and fuses installed, main contacts open.
To remove the roll-out unit from the enclosure with both sides hot, the following steps are taken.
-
Recommended that disconnect links at bottom be removed before the fuses at the top are removed.
-
Nuts with captive washers for the disconnect links at the bottom are unbolted using insulated tools, and the disconnect links removed. As per Figure 1, there are interphase barriers and an insulating plate on the bottom of the protector to minimize the chance of fault initiation.
-
Nuts with captive washers for the protector fuses are unbolted using insulated tools. If a nut/captive washer is dropped, bottom half of protector is de-energized. However, the housing bus-bars from the network-side terminals of the network transformer to where the disconnect-links are connected are still energized.
When these steps are carried out, extremely high fault currents are available from both the network side of the open protector and from the transformer side of the open network protector. Figure 4 shows the network protector when the roll-out unit has been placed on the maintenance rails for work and inspection. Note that the housing bus bars that connect to the network transformer, and the buses at the top of the network protector that are connected to the LV network are also energized.

Figure 4:
Roll-out type network protector with disconnect links
and fuses removed, and roll-out unit on maintenance rails.
With the network roll-out unit on the rails as in Figure 4, the upper limit on the available three-phase fault current on the transformer side of the open network protector, IFT, and on the network side of the open protector, IFN, are given by eqs. (1) and (2) respectively.
(1) $$ \ \ \ I_{FT} = \frac{KVA_{T}}{0.48\sqrt{3}} \frac{100}{Z_{T ﹪}} \enspace Amperes $$
(2) $$ \ \ \ I_{FN} = (N_{T} - 1 ) I_{FT} \enspace Amperes $$
In these equations:
NT = Number of transformers in the spot network
KVAT = Network transformer rating in kVA
ZT% = Network transformer impedance in percent
For a fault at the top terminals of the network protector that is open, the current available for the bolted three-phase fault is equal to or greater than that available at the transformer side of the open protector. A fault at the top terminals of the open network protector, in a conventional spot network system, would be cleared by blowing of the fuses in the other network protectors feeding the spot network paralleling bus.
Calculating Incident Energy Levels For Arcing Faults
Whenever the available current for a bolted fault is known, designated as Ibf in kA, IEEE standard 1584 indicates that the current for an arcing fault, designated as Ia in kA is found using eq (3). In this equation, the terms are:
K = -0.153 for open configurations, -0.097 for box configurations.
G = distance between buses where the arcing occurs in mm . (1 inch = 25.4 mm)
V = System voltage in kV = KVS
(3) $$ \ \ \ I_{a} = 10^{[K + 0.662\log{(I_{bf})} + 0.0966V + 0.000526G + 0.5588V \log{(I_{bf})} - 0.00304 G \log{(I_{bf})}]} \enspace KA $$
The incident energy from the arc, En, normalized to a distance of 24 inches (610 mm) and for an arcing duration of 0.20 seconds is given by eq. (4) in Joules/cm2.
(4) $$ \ \ \ E_{n} = 10^{(K_{1} + K_{2} + 1.081\log(I_{a}) + 0.0011G)} Joules/cm^2 $$
In eq (4), the terms are:
K1 = -0.792 for open configuration, -0.555 for box configurations
K2 = 0 for ungrounded and high resistance grounded systems
= -0.113 for grounded systems
The incident energy in calories per cm2 is found from eq (5).
(5) $$ \ \ \ E = C_{f}E_{n} \frac{t}{.20} {(\frac{610}{D})}^X \enspace cal/cm^2 $$
In this equation, the terms are defined as follows:
Cf = calculation factor for 95% confidence, 1.5 for LV systems
t = fault duration in seconds
D = distance to subject in mm
x = distance exponent =1.473 for switchgear
= 1.641 for motor control centers and panels
The spot network system shown in Figure 5 will be used, with the equations presented above to illustrate the incident energy on a worker if the arcing fault on the network side of an open protector in a spot network is cleared by blowing the fuses in the adjacent network protectors. In this system:
N = number of closed protectors supplying paralleling bus
= NT - 1
Ibf = current for three-phase bolted fault on the bus in kA
Ia = current for arcing three-phase fault on bus in kA, as found from eq (3)
For the illustration, it will be assumed that each network transformer in the spot network is rated 1000 kVA, 480-volts, and having a 5% leakage impedance. Further, it is assumed that the HV side of each network transformer is supplied from an infinite bus for purposes of calculating the current, Ibf, for a bolted fault on the network paralleling bus,
The network protector is rated 1875 amperes, and two different protector fuses are considered, the Y22.5 and the Z25 fuse for finding the fuse clearing times. Figures 6 and 7 show the time-current curves for the two fuses, with the X and Y coordinates for each point on the curve. Between the points the fuse characteristic is represented with straight line segments, so that for any fuse current on the abscissa the fuse time can be easily calculated.

Figure 5:
Spot-network for illustrating the incident arc energy
calculation when cleared by network protector fuses.
With reference to Figure 5, the total arcing fault current is current, Ia, is assumed to divide equally between the number of closed network protectors, N. Thus, the time for the protector fuses to clear for a fault on the paralleling bus, or a fault at the network terminals of the open protector will be a function of the number of closed protectors.

Figure 6:
Time-current characteristics of Y22.5 fuse represented
with straight-line segments

Figure 7:
Time-current characteristics of Z25 fuse represented
with straight-line segments
Figure 8 plots the time for the Y22.5 fuse and the Z25 fuse to clear for a fault on the paralleling bus, assuming that the arcing fault current as found from eq (3) divides equally between the closed network protectors. Considered are cases were there are from one to four protectors on 1000 kVA transformers connected to the paralleling bus in Figure 5.

Figure 8:
Network protector fuse time in seconds versus the number
of network transformers connected to the bus.
Having the protector fuse clearing time as given in Figure 8 versus the number of protectors connected to the bus, N, the incident arc energy in cals/cm2 can be calculated with eq (5). It is assumed that the distance to the subject is 2.0 feet (D= 609.5 mm). The results of this are plotted in Figure 9 versus the number of 1000 kVA network transformers connected to the paralleling bus, for both the Y22.5 fuse and the Z25 fuse.
From Figure 9, it is seen that when the spot network has two or more 1000 kVA transformers feeding the paralleling bus, the incident energy is over 100 cals/cm2, a totally unacceptable level for working on the network protector.

Figure 9:
Incident energy levels when protector fuses clear for a
fault on the paralleling bus with 1000 kVA network transformers.
If the fault were on the transformer side of the open protector in Figure 5, the current for both the bolted and arcing fault are less than the current for a fault on the paralleling bus, but the incident energy levels could be much higher than those for a fault on the paralleling bus, as in a typical system the circuit breaker for the primary feeder will not trip for a fault in the secondary. This makes time “t” in eq (5) quite large.
Figure 10 is a picture of a 480-volt submersible network protector with an internal fault and the door bolted closed. Note the gases and fire expelled thru the door gasket.

Figure 10:
Photo of an arcing fault inside of a submersible
network protector with the door bolted closed (courtesy Dallas Power and
Light).
For the incident energy levels given in Figure 9, where the network has 1000 kVA 480-volt transformers, personnel protective equipment (PPE) with a rating of at least 100 cals/cm2 would be needed if work is performed with the network bus energized. Higher protective levels would be needed if the work were done on spot networks with larger 480-volt transformers such 1500, 2000, and 2500 kVA.
Figure 11 shows workers in an industrial environment with PPE rated for 8 and 40 cals/cm2. Wearing PPE rated for 100 cals/cm2 or higher makes working in the network vault extremely difficult.

Figure 11:
Personnel Protective Equipment (PPE) in an industrial
environment rated for 8 cals/cm2 and 40 cals/cm2
(photos courtesy of Oberon)
Measures to Reduce Arc Flash Energy on Both Sides of Open Network Protector
To allow removing the network protector disconnect links with the transformer side of the open protector de-energized, some operators will open the feeder breaker at the substation, as in Figure 12, and all protectors on the feeder should open if their network relays have a sensitive reverse current trip setting.

Figure 12:
Primary feeder and network transformer de-energized to
de-energize transformer side of open protector.
With the feeder breaker at the substation open and all network protectors on the feeder open, there could be a small voltage on the transformer side of the open network protector in Figure 12, due to sneak circuits across the open contacts of the open protectors on the feeder. However, the available fault currents for a fault at the location of the disconnect links would be relatively low, as the impedances across the open contacts of the protectors will limit the current. Practically the bottom disconnect links can be removed with minimal risk of an arc flash event. Unfortunately, there doesn’t seem to be any test data available on the voltage that appears at the disconnect links in actual systems. However, limited data as shown in Table 10-4 of Network Protector Relaying suggests that the voltages to ground would not exceed about 10 volts.
With the transformer side of the open protector “de-energized as in Figure 12, the bottom disconnect links can be removed, giving the situation shown in Figure 13. However, even with the bottom disconnect links removed, there could be some voltage on the transformer side of the roll-out unit of the open protector due to sneak circuits across the open contacts of the protector being worked on.

Figure 13:
Transformer side of open protector de-energized with
disconnect links removed.
With the disconnect links removed in Figure 13, high fault currents are available when removing the protector fuses at the top terminals of the roll-out unit, and the incident arc energies can be very high. The incident energies for removal of the protector fuses can be reduce to low levels if the other protectors in the spot network have modern microprocessor network relays.
Arc Flash Reduction For Faults on Network Side of Open Protector – Removing Protector Fuses
The microprocessor network relays of all three suppliers are equipped with features that will limit the incident energy levels for an arcing fault on the network side of the open protector in spot networks. Eaton refers to this as their Arc Flash Reduction Module. When this feature is enabled in the other protectors in the spot network energizing the paralleling bus, the protectors will trip when the current in any one phase exceeds 250% of the protector CT rating. Should a fault occur at the top terminals of the protector, when removing the protector fuses, the other network protectors trip rapidly, such that PPE rated 8 cals/cm2 provides worker protection. Note that the trip is based on current magnitude, which exceeds 250% of the protector CT rating. When this protection mode is enabled, should a fault occur on one of the HV primary feeders supplying a closed protector, it most likely would trip all closed protectors in the spot, and cause a network outage. This is acceptable as worker safety is more important than service continuity.
In the DigitalGrid network relay, this functionality is available by activating the Safe Service Mode. And in the ETI MNPR microprocessor relay, this functionality is available by enabling the Instantaneous Over Current Trip-Maintenance Mode. The relay manufacturer’s literature should be consulted for information on settings and enabling of this function.
Reconnecting Network Protector Roll-Out Unit
With the disconnect links and protector fuses removed, the roll-out unit can be placed on the rails to allow for inspection and maintenance as shown in Figure 14. Assuming that the disconnect links and protector fuses have been removed with the “safe service mode” enabled, after the protector maintenance has been completed, it can be returned to service with the transformer side de-energized, and the “safe service mode” enabled on the other protectors in the spot.

Figure 14:
Protector roll-out unit on rails with fuse and links
removed, network transformer de-energized.
After the maintenance work and testing have been completed, the roll-out unit is inserted back into the housing as in Figure 15, so that the fuses and disconnect links can be installed. The transformer side of the open protector is de-energized, and the “safe service mode” of the other protectors in the spot network is enabled.
Many practitioners install the protector fuses before the disconnect links. The thought behind this practice is that if the fuses are installed when the transformer side of the protector is disconnected, and a nut/captive washer for the fuses is dropped into the protector rollout unit, a fault is less likely to be started.
When the protector fuses are installed in Figure 15, if there is a short to ground on the buses on the network side of the roll-out unit of the open protector, or if there is a short between phases, installing the fuse will initiate a high-current fault. A procedure adopted by some utilities when installing fuses and disconnect links is to first energize the buses in the protector roll-out unit thru a low-ampere current limiting fuse, in an enclosure with test leads as in Figure 16

Figure 15:
Protector roll-out unit in housing in preparation for
installation of fuses and disconnect links.

Figure 16:
Test lead with low-ampere current limiting fuse for use
when installing fuses and disconnect links (courtesy Eaton).
The procedure for installing the protector fuses utilizing the test lead is as follows, with reference to Figure 15 and 16.
-
Put test lead 1 on the left-side network bus in the protector housing, and put test lead 2 on the left-side network bus of the protector roll-out unit.
-
Check the continuity of the test fuse. If it has not opened, install the protector fuse on the left side (phase) of the open protector.
-
Put test lead 1 on the center network bus in the protector housing, and put test lead 2 on the center network bus (phase) of the protector roll-out unit.
-
Check the continuity of the test fuse. If it has not opened, this indicates there is not a fault to ground from the center network bus of the rollout unit, or from the left-side bus of the roll-out unit to the center network bus of the roll-out unit. If the fuse has not opened, install the protector fuse on the center phase.
-
Put test lead 1 on the right network bus in the protector housing, and put test lead 2 on the right-side bus of the protector roll-out unit.
-
Check the continuity of the test fuse. If the test fuse has not blown, install the protector fuse on the right-side phase.
This procedure can not be used when installing the disconnect links on the bottom of the protector if the network transformer is de-energized. But if the disconnect links are installed with the network transformer energized, as may be the case in 208Y/120- volt systems, this procedure should be followed.
De-Energizing Transformer Side With Mag Break HV Disconnect and Grounding Switch
The transformer side of the open network protector can also be de-energized by leaving the primary feeder energized, but by opening of the HV disconnect and grounding switch, providing (a) it has mag break capability, and (b) the utilities operating and safety practices allow opening of the liquid filled HV switch in an underground vault.
With reference to Figure 3, when the HV disconnect and grounding switch has mag break capability, it can be opened providing the network protector is open. HV Disconnect and Grounding Switch discusses interlock arrangements for the mag break HV disconnect and grounding switch. This then keeps the primary feeder energized, avoids creating a single contingency for the secondary network but de-energizes the network transformer and network protector as shown in Figure 17.
With the transformer side de-energized and the protecor open, the bottom disconnect links in Figure 17 can be removed, although there may be a small voltage on them due to relay and control circuit impedance across the open contacts of the protector. As discussed before, if the other protectors in the spot network have the “safe service mode” or equivalent enabled, the fuses can be removed with the top half of the open protector energized after enabling the “safe service mode”

Figure 17:
Network transformer de-energized by opening mag break
HV disconnect and grounding switch.
Isolating Network Side of Open Protector
Some utilities have installed disconnect switches in 480-volt spot networks between the network-side terminals of the open protector and energized 480-volt paralleling bus. Such an application is shown in Figure 18. With the network protector in the open position, the disconnect switches can be opened to isolate the network side of the open protector from high sources of fault current. These switches should be opened only after the protector is opened, as they may not be suitable for interrupting load current.

Figure 18:
Disconnect switch between network side terminals of
protector with roll-out unit (courtesy Entergy).
Available today from two manufacturers are disconnect devices intended to be applied between the network terminals of the protector and the energized 480-volt paralleling bus. These allow removing the fuses from the roll-out type open network protector with the network side de-energized. The concept is illustrated in Figure 19, where the disconnect device is attached to the network-side terminals of the protector.

Figure 19:
Disconnect devices between network terminals of
roll-out protector and 480-volt paralleling bus.
Eaton’s device for this function is called the Viso Block, and Richards refers to this as the link box. Rather than being attached to the top terminals of the network protector, these devices may be separately mounted on a vault wall.
When the Link Box or Viso Block is opened as illustrated in Figure 20, voltage is removed from the network side terminals of the open network protector. Then the internal protector fuses can be removed with no fault current available from the network side of the open protector.

Figure 20:
Network protector with external disconnect device on
network side open.
Figure 21 depicts the Richards Link Boxes installed on the top terminals of the network protector. For the left and center phases the front cover is removed. For the left-phase, the link is closed, and in the center phae the link is open. The link is opened using insulated tools, with a long handle to give distance between the link and the operator. With the links enclosed in an insulated housing, the probability of a fault when opening is minimal. However, it is imperative that the protector be opened before opening of the link box.

Figure 21:
Richards Link Boxes on top terminal of a roll-out type
network protector (courtesy Richards Manufacturing).
Figure 22 depicts the Eaton Viso Blocks mounted on the top (network side) terminal of the protector enclosure. The devices incorporate a Kirk Key interlock, so that they can be opened only if the network protector operating handle is in the open position. This minimizes the chance that the Viso Block would be opened under load. Further, this device can be operated with a remote operator. With the Link Box and theViso Block, when the devices are operated, an extra level of safety is introduced if the “safe service mode” on the other network protectors in the spot network is enabled.

Figure 22:
Eaton Viso Blocks mounted on the top terminals of a a
network protector (courtesy Eaton).
Figure 23 is a photo of the Eaton Viso Blocks installed on CM-52 protectors in a spot network of Xcel Energy.

Figure 23:
Viso Blocks on type CM-52 network protectors (photo
from 2018 ENSC meeting presentation by Rich Kernan of Xcel Energy)
If the network protector fuses are installed on the open protector with the Link Boxes open, or the Viso Blocks open, when they are closed it is possible that a short could have occurred on the network side of the open protector. A testing procedure should be devised to detect such a fault before the Link Boxes or Viso Blocks are closed when the fuses are installed inside the network protector.
Similarly, if the disconnect links are installed on the transformer side of the open protector, with the transformer de-energized either because the HV disconnect and grounding switch is open, or because the feeder breaker at the substation is open, a testing procedure should be devised to check for faults on the transformer side of the open network protector roll-out unit.
De-energizing Both Sides of the Protector When Removing and Installing Disconnec Links and Protector Fuses
From the preceeding discussion, it is seen that there are ways to de-energize both the transformer side of the open network protector and the network side before removing from rollout type protectors both the disconnect links and the protector fuses. Similarly, the fuses and disconnect links can be installed with both sides of the open protector de-energized. When installing the fuses and disconnect links with both sides of the protector de-energized, a testing procedure should be developed to assure there are no faults in the buses on both sides of the protector roll-out unit.
De-energizing Network Transformer With Vacuum Breaker on HV side of Network Transformer
As discussed in 480-volt-spot-network, some operators have installed in 480-volt spot networks vacuum circuit breakers on the HV side of the network transformers. The purpose of the breakers is to de-energize the network transformer if there is a fault in the unprotected zone of the network protector, or to de-energize the transformer if there is a fault downstream of the network protector in the utility system. Such faults might be detected with heat sensors, or ground fault relaying schemes.
Figure 24 shows a vacuum interrupter (VI) installed on the HV side of the network transformer, to be tripped for faults on the secondary side. It is assumed that there is no overcurrent relaying installed with the VI, although that may not be the situation. Coordination of Vacuum Interrupter on HV Side of Network Transformer With Station Breaker discusses the coordination of phase and ground overcurrent relays on a HV vacuum interrupter with the station breaker, the network protector fuses, and tripping of the network protector under high-current backfeed.
Regardless, when a vacuum interrupter (VI) is installed on the HV side of the network transformer, as in Figure 24, it can be opened to de-energize the transformer side of the open network protector so that disconnect links can be removed with the transformer-side bus nearly de-energized.
When the vacuum interrupter (VI) is opened, as in Figure 25, the netwok protector on the secondary side will see the exciting current of its own network transformer, and perhaps some charging current of the primary cable between the VI and the netwok transformer. If the network transformer has low losses, and the protector has a typical default sensitive trip setting of 0.20% of network protectror CT rating, the protector may not open. A lower sensitive trip setting may be required to open for the condition of Figure 25. Even if the protector does trip when the VI is opened, to work on the protector, a good practice is to place the protector operating handle in the open position so that it can not close should the network transformer be inadvetently energized from the HV side.

Figure 24:
Network unit for 480-volt spot network with vacuum
interrupter on HV side of network transformer closed.

Figure 25:
Network unit for 480-volt spot network with vacuum
interrupter on HV side of network transformer open, but protector
closed.
Assuming that when the VI on the HV side is opened, the network protector trips on the exciting current and lossses of its own network transformer, then practically the transformer side of the open network protector is isolated from the LV network and from the HV primary feeder. This condition is shown in Figure 26. However, as shown by the test data in Table 4 of Network Protector Relaying, voltage will appear on the transformer side bus of the open network protector, due to impedances across the open contacts of the protector. In the measurements summarized in Table 4, the transformer side voltages did not exceed 6 volts in a 208Y/120-volt protector. Higher voltage would be expected in 480-volt protectors.
Regardless, removing the disconnect links under the circumstances shown in Figure 26 should not create conditions where high-energy arcs could be established from either phase-to-ground or phase-to-phase faults on the transformer side of the open protector. Even if the protector trips when the VI is opened, the protector operating handle should be moved from the automatic position to the open position to asssure the protector does not reclose if the network transformer were inadvetently energized. As indicated before, there are interphase barriers and an insulating plate on the bottom of the protector to minimize the chance of a fault when removing the disconnect links.
With the disconnect links removed from the protector as in Figure 27, and the protector main contacts open, the network side terminals of the protector are still energized from the network paralleling bus. With a Link Box or Viso Block on the network terminals of the protector, and the protector opened, the protector can be isolated from the energized network by opening of the Link Boxes as shown in Figure 27. The question is should the Viso Block or Link Box be opened before or after the disconnect links at the bottom of the protector are removed. By opening the Link Boxes or Viso Blocks before removing the disconnect links at the bottom of the protector, there should be no (zero) voltage on the disconnect links when they are removed.

Figure 26:
Network unit for 480-volt spot network with vacuum
interrupter on HV side of netwrk transformer open and network protector
open.

Figure 27:
Network unit for 480-volt spot network with vacuum
interrupter on HV side of network transformer open, network protector
open, disconnect links removed, and Link Boxes open.
With the Link Boxes or Viso Blocks open, the HV vacuum interrupter open, and the protector open, and the disconnect links open as in Figure 27, there should be no voltage on the network side buses of the open protector, and the protector fuses can be removed with minimal chance of an arc flash.
As a backup safety measure, when the Link Boxes or Viso Block are opened, which is done only if the protector is open, the “safe service mode” feature or equivalent, in the closed protectors in the spot network energizing the network paralleling bus should be enabled.
Limiting Arc Flash Energy When Disconnect Links and Fuses Are Removed With Both Sides Hot
In some situations, in past years, it may not have been possible to de-energize the transformer side of an open protector when removing the disconnect links in 480-volt spot networks. First, it may not be possible to take the primary feeder out-of-service by tripping of the feeder breaker at the substation, perhaps being due to another contingency or the primary feeder is non-dedicated. Second, it may be that the HV disconnect and grounding switch on the network transformer does not have mag break capability.
If the disconnect links and fuses must be removed with both sides of the protector hot, there are several steps that can be taken to minimize the arc energy for faults on either the network side of the open protector or on the tranformer side of the open protector, shown in Figure 28.
From the previous discussion, after the main contacts of the protector are open, if the are no Link Boxes or Viso Blocks on the network side of the open protector, the arc energy for a fault on the network side of the open protector can be minimized by enabling the ”safe service mode” or equivalent function of the network relays in the other protectors supplying the spot network paralleling bus.
To minimize the arc energy for a fault on the transformer side of the open protector when the disconnects are being removed, with the protector open, apply hot line tags to the instantaneous phase relays for the primary feeder breaker at the substation, such that an instantaneous phase relay will pickup for faults on the transformer side of the open network protector. The hot-line tag is applied only to the feeder supplying the protector that is to be removed from service.
Figure 28:
Network protector in 480-volt spot network with main
contacts open, and both sides hot.
Figure 29 shows the normal phase and ground overcurrent relay settings used by a utility in a four-feeder 13.8 kV network system. Also shown in the Figure are the time-current characteristics of the Y25 fuse applied to a 500 kVA 216-volt network transformer, the Z37.5 fuse applied with a 750-kVA 216-volt network transformer, and the Y25 fuse applied with a 1000 kVA 480-volt network transformer, where the fuse curves are plotted vs. amperes at 13.8 kV.

Figure 29:
Primary feeder normal phase and ground relay settings
Plotted with the vertical black dashed lines in Figure 29 are the maximum through fault currents for faults on the secondary side of 750 kVA and 1000 kVA 5% impedance network transformers. From this it is seen that the the network protector fuses are selectively coordinated with the phase relays for faults in the secondary system. Of course, with delta wye-grounded network transformers, the primary feeder ground relay would not be expected to operate for faults in the secondary system or for faults on other primary feeders.
The red-colored curves show the pickup of the phase instantaneous relays for the feeder breaker, and the minimum and maximum operating time for the phase instantaneous relay. The pickup of the phase instantaneous relay is 3600 amperes, significantly above the maximum currents for a thru fault on the secondary side of a 1000 kVA 480-volt network transformer. The feeder phase instantaneous relays will not reach thru the 1000 kVA network transformer and see faults on the secondary.
When the hot line tag is applied to the phase relays, the pickup of the phase instantaneous unit is 200 amperes (240*0.83), as shown by the vertical solid red colored line in Figure 30. Whenever the hot-line tag is applied, the primary feeder load current must be closely monitored to assure the primary feeder breaker doesn’t trip from load current.

Figure 30:
Primary feeder normal phase and ground relay settings
with hot line tags applied.
Arc Energy On Transformer Side With Hot Line Tags
The arc energy for a fault on the transformer side of the open network protector with the hot line tag enabled will be calculated to illustrate its effectiveness. The calculations will be for a 1000 kVA 480-volt 5% impedance network transformer.
With an infinite bus at the HV side of the transformer, the current in the fault path for a bolted three-phase fault is 24.06 kA at 480-vols. Equation (3) can be used to calculate the current for the arcing fault, Iaf, from the bolted fault current, Ibf. For this calculation, the values used for the variables in eq (3) are:
Ibf = 24.06 kA
G = 32 mm, distance between the buses where the arcing occurs
K = -0.097, for arcing in a box
V = 0.48 kV, system voltage in kV
Placing these values into eq (3) gives the arcing fault current, Ia in kA.
Ia = 13.084 kA
Next eq (4) is used to calculate the incident energy, normalized to a distance of 24 inches (609.5 mm) and an arcing time of 0.20 seconds. In evaluating eq (4), the values for the constants K1 and K2 are:
K1 = -0.555 for box configurations
K2 = -0.113 for grounded systems
Substituting into eq (4) give for En:
En = 3.7532 Joules / cm2
The incident energy in cals/cm2 is found from eq (5) as shown below.
(6) $$ \ \ \ E = 1.5 * 3.7532 \frac{t}{0.20} (\frac{610}{609.5})^{1.641} \enspace cal/cm^2 $$
At issue is the value of time, “t”, to use in eq (6) for finding the incident energy in cal/cm2. The rms value of the arcing fault current, Ia, at 480-volts is 13.084 kA, which reflected to the 13.8 kV side is 455 amperes. From the time current curve in Figure 30 with the hot line tag applied, the maximum relay time is about 0.02 seconds. Assuming the opening time of the feeder breaker at the substation is 6 cycles or 0.10 seconds, the total time is 0.12 seconds for “t” in eq (6). With t set to 0.12 seconds in eq (6), the calculated incident enrgy is 3.378 cal/cm2
(7) $$ \ \ \ E = 1.5 * 3.7532 \frac{0.12}{0.20} (\frac{610}{609.5})^{1.641} = 3.378 \enspace cal/cm^2$$
It should be noted that the calculated incident energy of 3.378 cal/cm2 assumes that after the feeder breaker at the substation opens, fault currnt flow on the transformer side of the oen protector is stopped. In actuallity, after the feeder breaker at the subsation opens, some fault current will flow into the fault on the transformer side of the open protector until all other network protectors on the feeder with the hot-line tag open. It is expected that in most systems the energy associated with this current would not exceed that due to current from the substation side.
Figure 31 shows the feeder microprocessor relay which can have a hot line tag enabled. Applying a hot-line tag to the feeder breaker at the substation may be for some operators a means to control incident arc energies to less than 8 cal/cm2 for faults on the transforeme side of he open protector Calculations as described here can be made for other size network transformers and protectors. In addition, means must be incorporated to limit the arc energy for faults on the network side of the open protector. That could be with installation of Link Boxes or Visio Blocks, or by enabling a “safe sevice mode” or equivalent function in the other network protectors in the 480-volt spot network.

Figure 31:
SEL -751 relay with hot-line tags (Courtesy of United
Illuminating).
4.16 - Special System Events
SPECIAL SYSTEM EVENTS
This chapter discusses events which have happened in actual LV network systems, the purpose being that we can learn from the experiences of others, as we can’t live long enough to experience all of them ourselves.
Network Protector Tripping In Spot Network On Initial Energization
A utility was asked to supply an internet farm, and a three-unit spot network was selected as this provides very reliable service. Figure 1 shows the system, having three 2000 kVA 480-volt network transformers with 3500 ampere network protectors. The relays on the network protectors were type MPCV, with a sensitive reverse current trip setting of 0.2%, and with time delay set at 2 minutes. See Time Delay Tripping of Network Protectors for discussion on time delay tripping.
The customer’s load consisted of a UPS system, miscellaneous loads, and a large three-phase motor. With the network paralleling bus energized, when the customer’s main breaker was closed, after the 2-minute time delay the closed network protector tripped. A check with the UPS supplier revealed that the UPS has a high lagging power factor.

Figure 1:
Three-unit spot network system for data center.
Figure 2 shows the sensitive gull-wing trip characteristic of the MPCV relay (see Network Protector Relaying for more information on relay trip characteristics and settings). With the sensitive gull-wing trip characteristic, the sensitive-trip criterion will be satisfied if the power factor of the load current is less than 8.72 %, either leading or lagging. As discussed in Other Sensitive Trip Characteristics in Microprocessor Relays, the sensitive trip characteristic is also satisfied if the load on the spot network has zero power factor, if the current in the protector is 11.43 times the reverse current trip setting at 180o, shown as RT in Figure 2.
Further discussions with the engineer responsible for commissioning of the electrical system for the internet farm revealed that the power factor of the system would not be as low as 8.72%, but much higher. Subsequent discussions with the utility revealed that the MPCV relays in the network protectors were set up for the “boomerang” watt-var trip characteristic as shown in Figure 3. Further, as shown in Figure 1, on the line side of the motor contactor for the three-phase motor was a power factor correction capacitor that was connected even when the motor contactor was open. As shown with the orange-colored current phasor in Figure 3, with the capacitor connected to the system at startup, with the power factor of the total load less than 86.6%, the current in the protectors lay in the trip region of the boomerang watt-var trip characteristic, and the protector tripped 2 minutes after the customer’s main breaker was closed.

Figure 2:
Gull-wing trip characteristic of the MPCV relay.

Figure 3:
Boomerang watt-var relay trip characteristic selected
for network relay at startup.
Two solutions were identified to prevent the tripping of the network protectors during startup of the internet farm system.
-
Relocated the power factor correction capacitor for the three-phase motor to the load side of the motor contactor.
-
Change the MPCV relay sensitive trip characteristic from “boomerang watt-var” to the “gull-wing” watt trip characteristic as shown in Figure 2.
Failure of Network Protector to Trip In Absence of Fault
As indicated in Network Protector Relaying, with low-loss network transformers, when a primary feeder breaker or switch is opened in absence of a fault, a network protector with a typical sensitive trip setting of 0.2% of protector current transformer (CT) rating may not open. In this section, discussed are two situations where the protectors would not open on the excitation current and no-load losses of the network transformers in the system.
Spot Network System 1, Four-Unit With HV Switch & Fuses
For the system in Figure 4, when the fused switch is opened for any network transformer, it is desired that the network protector on the secondary side opens automatically. However, if the network transformers have low no-load losses and low exciting current, the relay sensitive trip characteristic may not be satisfied for a typical sensitive trip setting of 0.2% of protector CT rating.

Figure 4:
Four-unit spot network with three-pole switches on HV
side.
In the system of Figure 4, where the protector failed to open when the HV switch was opened, the network relay sensitive trip setting was 0.20% of CT rating, or 3.2 amperes at 480 volts. Figure 5 shows the relay gull-wing sensitive trip curve, the transformer exciting current, IE, the primary cable charging current reflected to the secondary side, IC, and the current in the network protector, INWP. The exciting current of the 1000 kVA network transformer, IE, was 0.18% of transformer rated current (1202.8 amperes at 480-volts) or 2.165 amperes shown with the red-colored phasor. With the no-load losses of the transformer being 1357 watts, the angle by which the exciting current, IE, leads the network line-to-ground voltage is 180 degrees minus 41.08 (θE) degrees, or 138.92 degrees as shown in Figure 5 with the red-colored arrow. The total current in the protector, INWP shown with the black-colored phasor in Figure 5 is the transformer exciting current, IE, plus the charging current, IC, of the 40 feet of 4/0 PILC cable between the transformer and the switch. This charging current reflected to the secondary side, is 0.413 ampere. The total current in the network protector, INWP, is 1.919 amperes leading the network voltage by 148.25 degrees as shown by the black-colored phasor in Figure 5. With the total current in the protector, INWP, being 1.919 amperes, and with sensitive reverse current trip setting, RT, of 3.2 amperes, it is clear that when the primary HV switch in the system of Figure 3 is opened, the network protector will not trip.
With reference to Figure 6, for the current in the network protector, INWP, 1.919 amperes at 148.25o, to intercept the sensitive gull-wing trip curve, the sensitive reverse current trip setting, “RT” must be reduced from 3.2 amperes to a lower value. Figure 6 shows that if RT is set to 1.720 amperes, which is 0.1075 % of CT rating, the sensitive trip characteristic will just be satisfied.

Figure 5:
Current phasors superimposed on the gull-wing sensitive
trip characteristic.
To assure that the network protector will open when the switch on the HV side is opened, a relay sensitive trip setting of about 80% of the calculated setting should be made, which is 0.086% of CT rating.

Figure 6:
Reverse current trip setting at which relay will make
its trip contact.
Then the HV switch can be opened to confirm that the protector will open automatically with the lower sensitive trip setting.
With reference to Figure 7, there are several other areas that need to be addressed for this system when considering faults on the primary feeders. In Figure 7, faults are considered at two different locations on the primary feeders.

Figure 7:
Location for faults on primary feeder.
For a multi-phase fault at location 1, between the feeder breaker at the substation and the primary fuses in the switchgear, 50E SM-5 fuses, the 50E fuses must not blow, as the fault must be cleared by opening of the backfeeding network protector(s). Practically, if the 50E fuse is no faster than the network protector fuses, the 50E fuse will not blow for a high-current backfeed between the station breaker and the 50E primary fuses.
For a fault at location 2 in Figure 7, the 50E fuses in the faulted phases will blow, creating a simultaneous fault-blown fuse condition. The trip characteristic of the network protector relay must be selected such that faults with blown fuse in the faulted primary phases will be detected. See Trip Algorithms for Microprocessor Relays and appendix 3 for details.
For a fault at location 2 in Figure 7, if the feeder breaker at the substation has both instantaneous current relays and time overcurrent relays, it is possible that the fuse(s) in the faulted phase(s) will blow, and the instantaneous current relay (device 50) for the station breaker will pick up, tripping the station breakers. The response depends upon fuse size and time-current characteristics, the available fault current, and the pickup of the instantaneous current relays for the station breaker.
System 2 Where Protector Failed to Trip on Backfeed
Figure 8 shows a network feeder with a three-way switch, with the switch for one leg open. There are just two 2000 kVA 480-volt network transformers on the feeder beyond the switch leg that is closed. When the utility with this system opened the feeder breaker at the substation, only one of the two network protectors on the feeder opened automatically. The feeder remained live on backfeed.
For the 2000 kVA network transformer in spot network 1 (SPOT 1), the exciting current was 0.21% of network transformer rated current, with a no-load loss of 2063 watts. For the 2000 kVA network transformer for spot network 2 (SPOT 2), the exciting current was 0.22 % of transformer rated current, with a no-load loss of 2066 watts.
When the feeder breaker in Figure 8 was opened, the exciting current and no-load losses for the two network transformers were supplied from the secondary side of the transformers. In addition, since the voltage on the secondary side of the two network transformers in spot networks 1 and 2 were different, there was a circulating current when both protectors were closed. This produced a reverse power flow in the closed protector at spot network 2, of sufficient magnitude that the relay sensitive trip characteristic was satisfied, and the protector at SPOT 2 tripped, giving the condition shown in Figure 9. But the protector in the spot network at spot network 1 did not open automatically.

Figure 8:
System where protector failed to trip in absence of
fault.

Figure 9:
System with protector at spot network 2 open.
The network relay in the closed protector in spot network 1 had a reverse current trip setting of 8.8 mA, which is 0.176 % of the network protector CT rating. This corresponds to a current of 5.28 amperes in the protector. Figure 10 shows the sensitive trip characteristic of the relay used on the CM-52 protectors, where the reference phasor, the network line-to-ground voltage shown with the blue-colored phasor, VN, is drawn horizontal rather than vertical as in Figure 2.
The current phasors in Figure 10 are drawn to scale, where the sensitive reverse current trip setting, “RT” is 5.28 amperes at 180 degrees. Adding the excitation current of the two network transformers, the vector resultant is 10.343 amperes as shown with the red-colored phasor, leading the network line-to-ground voltage, VN, by 118.7 degrees. Adding the primary cable charging current reflected to the 480-volt side, or 30.223 amperes at an angle of -90 degrees, to the resultant transformer exciting current gives the current in the network protector, INWP, shown with the orange-colored phasor in Figure 10. For the selected trip characteristic for the relay in this application, it is seen from Figure 10 that the network protector current does not lie in the trip region of the network relay.
Note from Figure 10 that for the network relay used in this application, the angles of the sensitive trip curve are adjustable. For the top half of the trip curve, the angle of the trip curve relative to the network voltage is 85 degrees, just as with the MPCV gull-wing sensitive trip characteristic. But for the bottom half of the curve, the angle of the trip curve is perpendicular to the network line-to-ground voltage reference, VN. From the trip curve and current phasors in Figure 10, it is seen that the relay sensitive trip characteristic is not satisfied.
If the relay in this application is configured so that the trip curve emulates the gull-wing characteristic of the MPCV, as shown in Figure 11, the current in the network protector in Spot 1 will lie in the trip region, as shown by the orange-colored phasor where RT is still set at 5.28 amperes at 480-volts.
To provide greater margin and allow for tolerances in the relay and in system data, setting the reverse current trip setting to 0.10 % of protector CT rating, or 3.0 amperes as shown in Figure 12, results in the protector current, the orange-colored phasor, lying well within the trip region. Note from Figure 12 that the trip characteristic is the same as that of the MCV relay (gull-wing) characteristic with an RT setting of 0.10 percent of protector CT rating.
Some operators, who have a standard reverse current trip setting of 0.20% of protector CT rating, may be hesitant to lower it to 0.10%. In most spot network systems where the primary feeders come from the same electrical bus in the substation (closed bus-tie breakers), lowering RT from 0.20% to 0.10 % of CT rating will have no effect on protector operation under normal loading, and will not result in protectors cycling or pumping under normal loading conditions.
Effect of Unequal Network Transformer Tap Settings on Operation Of Two-Unit Spot Network
In spot network systems where the primary feeders come from the same substation with closed MV bus-tie breakers, the taps settings on all network transformers should be the same. If transformer taps are off by 1 position, it affects the network load needed to prevent a protector from tripping, but it has a much greater effect on the load needed for automatic reclose of the open network protector.
The two-unit spot network in Figure 13 will be used to illustrate the effect of having different tap settings on the network transformers in the spot network

Figure 10:
Current phasors superimposed on sensitive trip

Figure 11:
Current phasors superimposed on sensitive gull-wing
trip characteristic.

Figure 12:
Current phasors superimposed on sensitive
gull-wing trip characteristic with RT of 0.10%.
In the system of Figure 13, the primary system voltage is 13.2 kV, and the spot network has two 1000 kVA 480-volt network transformers with an impedance of 5.25% and an X to R ratio of 7.50. The network protectors have CT’s rated 1600 to 5, with a straight-line trip characteristic that is perpendicular to the network line-to-ground voltage, with a sensitive reverse current trip setting of 0.2% of CT rating. The network relay master close characteristic is also a straight line rotated 7.5 degrees counter-clockwise from the line that is perpendicular to the network line-to-ground voltage, with a zero-degree close setting of 3.3 volts on a 480-volt base (1.5 volts on a 125-volt base). The slope of the phasing line is -5o with an offset of 1.10 volts at 60 degrees leading the network line-to-ground voltage. The system data is summarized in Figure 13. Note that primary feeder 2 is longer than primary feeder 1, and heavier loaded, so that when the load on the spot network is reduced, the protector fed from primary feeder 2, transformer T2, will trip.
Equal Tap Settings, Both Set 13.2 kV to 480-Volts
When both network transformers have the same tap setting, 13.2 kV to 480-volts, as the spot network load is reduced to 32 kVA, the protector from feeder 2 trips as shown in Figure 14. Figure 14 is a screen capture from a Turbo Pascal program the author prepared, whereas the load on the network is varied with both protectors closed, the current phasors move relative to the relay tip curve. Shown in the PHASOR BOX in Figure 14 are the two current phasors when the sensitive trip characteristic for protector 2 on transformer T2 is satisfied.
The current phasers and relay 180-degree trip setting are drawn to scale in the PHASOR BOX, where the horizontal and vertical distance from the origin to the box edge is 4.0% in current as indicated by the Current Range being +/- 4%..

Figure 13:
System and relay data for determining effect of unequal
tap settings.
When the spot network load is varied, the current phasors in the PHASOR BOX move relative to the trip curve shown in green and labeled, “MT”. The current in protector 1 is shown with the yellow colored phasor, and the violet colored phasor is for the current in protector 2. At 32 kVA network load (85% power factor), the protector fed from Feeder 2 trips

Figure 14:
Equal tap settings on network transformers, network
load at which NP2 trips = 32 kVA.
After the protector fed from feeder 2 (transformer T2) trips, protector 2 will auto close when the load on the spot network increases to a level where the network relay close characteristic is satisfied. Figure 15 shows that when the network load reaches 405 kVA, or 40.5% of the kVA rating of one network transformer, the protector on T2 auto closes. The left-side of Figure 15 shows in the PHASOR BOX the master close characteristic with the red-colored curve, and the phasing close characteristic with the yellow-colored curve. The scale for the box is 6.5 volts from the origin to the edge of the box in both the vertical and horizontal direction. When the network load is 405 kVA, the phasing voltage is 5.11 volts at an angle of 57.63 degrees, and it intercepts the master close curve as shown. As the network load is varied, the phasing voltage shown with the green-colored phasor moves relative to the relay close curves.

Figure 15:
Equal tap settings on network transformers, network
load at which NP2 auto closes = 405 kVA.
Unequal Tap Settings, T1 set 12.87 kV, T2 set 13.2 kV
When transformer T1 tap is set at 12.87 kV and transformer T2 tap is set at 13.2 kV, the effect with both protectors closed is to cause a circulating var flow from primary feeder 1 to primary feeder 2 through the spot network. As the load on the spot network is reduced, the trip characteristic of the relay for the protector on T2 is satisfied, as shown in the PHASOR BOX on the left side of Figure 16, where the violet-colored phasor intercepts the sensitive trip curve when the load on the spot network is 115 kVA. At time of trip, as shown in the figure the reverse power flow in the protector on T2 is 2.95 kW. At time of trip, the reactive flow in the protector on T2 is 245.23 kVAr as shown next to the network protector for transformer T2 in Figure 16.

Figure 16:
Unequal tap settings, T1 set 12.87 kV, T2 set 13.2 kV,
network load at which T2 trips = 115.0 kVA.
After the network protector fed from transformer T2 opens, the voltage on the transformer side of the open protector on T2 is very low relative to that on the spot network bus. This results in the phasing voltage at the open protector, shown with the green-colored phasor, being 7.23 volts at an angle of 172.74 degrees as shown in the PHASOR BOX in Figure 17, where the scale from the center of the box to an edge is 8.0 volts in both the horizontal and vertical directions. With T2 tap set at 13.2 kV, a very large load is needed on the spot network bus to satisfy the master close characteristic at the open network protector on transformer T2, shown with the red-colored curve labeled “MC” in Figure 17. As the load on the spot network is increased, the phasing voltage will intercept the master close curve.

Figure 17:
Unequal tap settings, T1 set 12.87 kV, T2 set 13.2 kV,
phasing voltage at NP 2 following trip at 115 kVA.
As the load on the spot network increases from 115 kVA to the level where the protector on T2 tripped, in Figure 17 the locus of the phasing voltage with increasing network load is basically a straight line, similar to that shown in Figure 79 of Network Protector Relaying. When the spot network load reaches 1044 kVA, the master close characteristic of the protector on transformer T2 is satisfied, as shown in the PHASOR BOX in Figure 18. The phasing voltage shown with the green-colored phasor is 11.47 volts at an angle of 80.89 degrees when the master close characteristic is satisfied. Note that the scale for the PHASOR BOX in Figure 18 is different than that in Figure 17, where the scale in Figure 18 is 12.50 volts. Regardless, the network load needed for auto close of the open protector on transformer T2 is greater than 100 % of the kVA rating of the 1000 kVA network transformer.
Unequal Tap Settings, T1 set 13.2 kV, T2 set 12.87 kV
When transformer T1 tap is set at 13.2 kV, and transformer T2 tap is set at 12.87 kV as shown in Figure 19, and both protectors are closed, it causes a reactive flow from primary feeder 2 to primary feeder 1 thru the spot network. As the load (85% power factor) on the spot network is lowered, when it reaches 34.0 kVA as shown in Figure 19, the network protector for transformer T1 trips as shown in the PHASOR BOX in Figure 19, where the current in protector 1 is 14.24% of CT rating at an angle of 90.9 degrees, as shown with the yellow-colored phasor. The current in the protector on T2 is 15.76% of protector CT rating, and it is shown with the violet-colored phasor in the PHASOR BOX in Figure 19, but not in its entirety as the maximum current scale for the box is 15.0% of protector CT rating.

Figure 18:
Unequal tap settings, T1 set 12.87 kV, T2 set 13.2 kV,
phasing voltage at NP 2 for auto close, 1044 kVA.

Figure 19:
Unequal tap settings, T1 set 13.2 kV, T2 set 12.87 kV,
network load at which NP 1 trips, 34 kVA.
When the network protector on transformer T1 opens when the network load drops to 34.0 kVA, the voltage on the transformer side of the open protector on transformer T1 is very low relative to the voltage on the network side. As a result, the phasing voltage at the open protector is 5.60 volts at an angle of 172.81 degree as shown in the PHASOR BOX in Figure 20, by the green-colored phasor. In this figure, the scale for the PHASOR BOX is 8.0 volts as indicated at the bottom of the box.
As a result, the load on the spot network must increase considerably from 34.0 kVA, where the trip occurred, to produce sufficient phasing voltage to intercept the master close curve for the network protector on transformer T1, shown as “MC” in the PHASOR BOX in Figure 20. As the network load increases the locus of the phasing voltage is a straight line as shown in Figure 79 of Network Protector Relaying. When the load on the spot network reaches 820 kVA as shown in Figure 21, the phasing voltage for the protector on transformer T1, shown with the green-colored phasor, intercepts the master line, and the protector closes automatically.
Summary of Effect of Different Tap Settings
Tables 1 summarizes the effect of transformer tap settings on the network load where a protector trips, and the network load where it auto closes. The data is for the straight- line close characteristic with a relay zero-degree close setting of 1.5 volts (3.3 volts reflected to the 480-volt system).
If instead the relay close setting were 1.0 volts (2.2 volts on the 480-volt side), the load for trip is not affected, but the protector will auto close at a lower load on the spot network. This is summarized in Table 2. Table 3 shows the effect of the circle close characteristic with a 1.0-volt relay close setting on the load needed for auto close of the protector.

Figure 20:
Unequal tap settings, T1 set 13.2 kV, T2 set 12.87 kV,
phasing voltage at NP 1 following trip at 34 kVA.

Figure 21:
Unequal tap settings, T1 set 13.2 kV, T2 set 12.87 kV,
phasing voltage at NP 1 for auto close, 820 kVA.
Table 1:
Summary of network loads for trip and auto close with
same and different tap settings for network transformers, relay 1.5 Volt
close setting, straight-line close characteristic.
TRANSFORMER 1 HV TAP SETTING IN KV |
TRANSFORMER 2 HV TAP SETTING IN KV |
NETWORK LOAD IN % OF NETWORK TRANSFORMER RATING |
|
|---|---|---|---|
| NWP TRIPS | NWP AUTO CLOSES | ||
| 13.2 | 13.2 | #2 @ 3.2% | #2 @ 40.5% |
| 12.87 | 13.27 | #2 @ 11.5% | #2 @ 104.4% |
| 13.2 | 12.87 | #1 @ 3.4% | #1 @ 82.8% |
Table 2:
Summary of network loads for trip and auto close with
same and different tap settings for network transformers, relay 1.0 Volt
close setting, straight-line close characteristic.
TRANSFORMER 1 HV TAP SETTING IN KV |
TRANSFORMER 2 HV TAP SETTING IN KV |
NETWORK LOAD IN % OF NETWORK TRANSFORMER RATING |
|
|---|---|---|---|
| NWP TRIPS | NWP AUTO CLOSES | ||
| 13.2 | 13.2 | #2 @ 3.2% | #2 @ 30.7% |
| 12.87 | 13.27 | #2 @ 11.5% | #2 @ 94.8% |
| 13.2 | 12.87 | #1 @ 3.4% | #1 @ 72.4% |
Table 3:
Summary of network loads for trip and auto close with
same and different tap settings for network transformers, relay 1.0 Volt
close setting, Circle close characteristic with left-hand master line at
90 degrees.
TRANSFORMER 1 HV TAP SETTING IN KV |
TRANSFORMER 2 HV TAP SETTING IN KV |
NETWORK LOAD IN % OF NETWORK TRANSFORMER RATING |
|
|---|---|---|---|
| NWP TRIPS | NWP AUTO CLOSES | ||
| 13.2 | 13.2 | #2 @ 3.2% | #2 @ 20.8% |
| 12.87 | 13.27 | #2 @ 11.5% | #2 @ 86.2% |
| 13.2 | 12.87 | #1 @ 3.4% | #1 @ 61.3% |
Effect Of Open on HV Side of Delta Wye Network Transformer
A utility having a four-unit spot network with a remote monitoring system noticed that in one of the network protectors the load currents were badly unbalanced. Figure 22 (a) shows the spot network, where three of the units are combined into one, and in the fourth units the phase current were practically equal in magnitude, taken as 100%. However subsequent measurements showed that in two of the phases of one protector the currents were 100%, and in the third phase it was between 9% and 13% as shown in Figure 22 (b).

Figure 22:
Measured currents in network protectors (a) normal
conditions, (b) abnormal conditions.
Various reasons were suggested by different individuals for the current in phase A supplied from network transformer terminal X1 being low. Included were:
-
Blown fuse in protector phase “A”.
-
An open in the secondary winding connected to network transformer terminal X1.
-
Network protector arcing and main contacts in phase “A” open.
However, for these three hypothesized reasons the current in phase “A” of the network protector would be zero, assuming an accurate remote monitoring system. Other reasons mentioned for cause of the low current in phase “A” were:
-
Problem with protector phase “A” current transformer or with the auxiliary current transformer used for the remote monitoring system.
-
Bad reading from the remote monitoring system.
-
Bad connection or high contact resistance in phase “A” of the network protector.
Reasons 4 and 5 were possible, but reason 6 most likely would have produced excessive temperatures in the network protector, which would not have gone unnoticed.
The two final reasons suggested were:
-
An open in a HV line lead, as shown in Figure 22 (b), marked as “OPEN 1”, or:
-
An open in a HV winding or tap changer shown in Figure 22 (b), marked as “OPEN 2”.
In the process of trying to determine the cause of the low current reading in just one phase, it was learned that the network transformer, connected delta wye, was constructed on a three-legged core, as depicted in Figure 23.

Figure 23:
Delta Wye windings on a three-legged core (courtesy
Westinghouse).
Open in HV Line Lead
No Load on Secondary (protector open)
If an open exists in a HV line lead, as shown in Figure 24, where the open is in the lead from terminal H1, and if no load is connected to the secondary winding (network protector open), this condition can be detected by measuring the secondary side phase-to-ground (neutral) voltages.

Figure 24:
Open in HV line lead, no load on secondary.
The left-side of Figure 24 show how the delta-connected HV windings and wye-connected LV windings are placed on the three-legged core, where the core legs are designated LEG 1, LEG2, and LEG3 from left to right. With the open in line lead to H1, rated voltage is applied to the HV winding on LEG3, designated as EH3-H2 on the right-hand side of Figure 24. The voltage across the HV winding on LEG1 and LEG2, designated as ELEG1 and ELEG2 respectively will be less than rated, but their sum should equal EH3-H2. These legs serve as the return path for LEG 3 flux, ϕL3.
Thus, the voltage on the secondary winding from X3 to ground should be normal in magnitude and angle, but the magnitude of the voltages on the secondary windings from X2 to ground (LEG2), and from X1 to ground (LEG1) would be less than rated under no load conditions.
Load on Secondary (protector closed)
With an open in the H1 line lead as shown in Figure 25 and the network protector closed, current in the two secondary phases connected to terminals X1 and X2 must be equal in magnitude and angle. The reason for this is that the current in the HV winding on LEG1 and the current in the HV winding on LEG 2 must be equal when the open is in the line lead for terminal H1. And by ampere-turn balance, the current in the coupled secondary windings, connected to terminals X1 and X2 must be equal. Further, the current exiting low voltage terminal X3 must be greater in magnitude.

Figure 25:
Open in HV line lead with load connected to secondary
side.
Thus, it can be concluded that the unbalanced secondary currents measured with the remote monitoring system where two of the currents were 100%, and the third secondary line current was between 9% and 13% was not the result of an open in a HV line lead under load conditions.
Open in Delta Connected HV Winding
No Load on Secondary (network protector open)
If the open is in one of the HV delta connected windings as shown in Figure 26, the winding on LEG 1, and no load is connected to the secondary windings (network protector open), then all three phase-to-ground voltages on the secondary side will be of normal magnitude and angle.
With reference to Figure 26, with the open in the HV winding on LEG 1, and no load on the secondary, the return path for the flux from the energized HV winding on LEG2 (EH2-H1), ϕl2, and for the flux from the energized HV winding on LEG 3 (EH3-H2), ϕl3, is core Leg 1. Thus, with the open in the HV winding on LEG 1, the flux in LEG1 is the same as if the winding were not open and with voltage EH1-H3 applied. Under these conditions, the three secondary phase-to-ground voltages will be of normal magnitude and angle if they were measured under no load conditions.

Figure 26:
Open in HV winding connection, no load on secondary
side.
Load on Secondary (network protector closed)
With the open in the HV winding on LEG1 as shown in Figure 27, no current can flow in the HV winding wound on LEG1, as indicated on the right-side of the figure by “0A”. The impedance between the HV winding and LV winding on LEG 2, and the impedance between the HV and LV winding on LEG 3 is simply the leakage impedance of the network transformer, either 5% or 7%.

Figure 27:
Open in HV winding connection, with load on secondary
side.
However, the impedance between the HV winding and LV winding on LEG1, secondary phase A is almost infinite, as no current can flow in the HV winding on LEG1 to produce an ampere-turn balance. But there is coupling between the LV winding on LEG1 and the HV windings on LEG2 and LEG 3 through the three-legged core. Because of this coupling, there is an impedance between the LV winding on LEG1 and the HV windings on LEG2 and LEG3, although this impedance is much higher than the transformer leakage impedance, as the coupled windings are not wound on the same core leg. The effect of this is that impedance reflected to the secondary (LV) side in phase A is much greater than the transformer leakage impedance, which appears in phases B and C. Thus, the current in two secondary phases of the protector should be near normal, 100%, but the current in the third secondary phase will be much lower due to the much higher impedance reflected to the secondary side.
Subsequent inspection of the network transformer after it was taken out-of-service showed that there was on open in the tap changer mechanism for one HV winding.
Effect of Starting Large Motor on Two-Unit Spot Network With One Protector Open
A utility was monitoring the voltage and current for a test when a large motor on a two-unit spot network was started, with just one of the two type CM-52 network protectors closed. Figure 28 shows the system, where there are two 2500 kVA network transformers, with the protectors having the MPCV network relays.
Monitored were the phase-to-phase voltage at the bus, and the current to the motor, labeled IM. As shown, there was some small non-motor load supplied from the network bus, so the current in the closed network protector, INWP, was somewhat higher than motor current IM, during starting.

Figure 28:
Two-unit spot network with one network protector open
when large motor started.
Figure 29 plots with the red-colored curve one phase-to-phase voltage during the motor start, and with the blue-colored curve is the current in on phase to the motor, IM. On the time axis, the motor contactor closes at time equal to 3 seconds, as evidenced by the dip in the network bus voltage given by the red-colored curve. Two seconds later or at a time 5 seconds on the time axis, the bus voltage and motor current undergoes a step increase due to protector 2 closing.
When the motor was first connected, the MPCV relay close characteristic was satisfied, and after 0.5 seconds the MPCV relay made its close contact. With the close time of the CM-52 network protector being between 1.5 and 1.6 seconds, the total time for the open protector to close should be in the range of 2.0 to 2.1 seconds, as shown by the actual tests.
The motor current given by the blue colored curve in Figure 29 also shows that when the open protector closed at 5 seconds on the time axis, a step increase in the motor starting current and bus voltage occurred, due to a lowering of the impedance looking back into the spot network bus.

Figure 29:
Recorded current and phase-to-phase voltage when large
motor started.
When the motor is connected, it drops the voltage on the network paralleling bus as shown in Figure 29. Assuming that the same voltage (magnitude and angle) existed at the HV terminals of both network transformers, the network load needed to satisfy the relay close characteristic can be plotted versus the power factor of the load in the closed protector. This is done in Figure 30, where the orange colored curve gives the network load needed for auto close when the relay has the straight-line close characteristic, and 2500 kVA network transformers are assumed to have an impedance of 7.0% with an X to R ratio of 9.5. The red-colored curve gives the network load needed for auto close assuming the network transformer impedance is 7.52% with an X to R ratio of 13.

Figure 30:
Calculated network load in kVA for auto close of the open network
protector, NWP2, in Figure 28.
The blue colored curve gives the network load needed for auto close assuming a transformer impedance of 7.52% with and X to R ratio of 13, and the network relay having a circle close characteristic set at 2.0 volts. The horizontal black line gives the motor kVA corresponding to a starting current of 610 amperes, which corresponds to 507 kVA at 480-volts. With the network transformer impedance being 7.52%, it is seen that the voltage dip caused by the motor starting is sufficient to satisfy the close characteristic of the MPCV relay, whether it be set for the straight-line or circle close characteristic. The point to be made from this discussion is that it is possible to calculate the load needed on the in-service network transformer needed for auto close of an open protector. See the discussion in Phasing Voltages In Spot Networks for the basis for such calculations.
Network Protectors Tripping on Starting of Large Motor With Wye-Delta Starter in Spot Network
In a two-unit spot network as shown in Figure 28, with just one network protector closed, a large three-phase motor was started with a wye-delta motor starter. Figure 31 shows the contactors for a wye-delta motor starter and a six-lead motor. The start was unsuccessful, as the network protector in the spot network tripped, and de-energized the network paralleling bus.
With such a starter the motor is first connected to the line with the motor windings connected in wye to limit the inrush current. For this contactors 1M and 1S in Figure 31 are closed, and contactors 2S and 2M are open.
Next, as the motor reaches a certain speed, contactor 2S closes, with 2M open, which connects the resistors in parallel with the wye connected motor windings. Following this, contactor 1S opens which connects a resistor in series with each motor winding and the combination in delta. Last contactor 2M closes, shorting the resistors, and placing the motor windings directly across the line. Contactor 2M is mechanically interlocked with contactor 1 S so that contactor 2M can close only after contactor 1S opens.

Figure 31:
Contacts for a typical wye-delta motor starter with six
lead motor.
Figure 32 plots with the red-colored curve the rms value of one phase-to-phase voltage, and with the blue-colored curve the rms value of phase A motor current during the motor starting. On the time axis, the motor windings are energized in wye at 5 seconds. At approximately 11.8 seconds on the time axis, the resistors are inserted and the motor windings reconnected in delta. About 0.2 seconds after that the resistors are shorted out and the motor windings are in delta across the line.
At approximately 12.4 seconds on the time axis, the network protector trips, and the phase-to-phase voltage decays to zero at about 13 seconds on the time axis.

Figure 32:
Network protector phase A current and bus voltage
during start of motor with wye-delta starter.
Figure 33 shows phase A current wave with the blue-colored curve and one phase-to-phase voltage with the red colored curve. Between 50 and 100 mS on the time axis, the motor windings are connected in wye. Between 100 mS and 250 mS on the time axis, the motor windings are connected in delta with a resistor in series with each winding, which results in a significant increase in line current from that with the windings connected in wye.

Figure 33:
Phase A current wave and one phase-to-phase voltage
during wye-delta motor start.
At 250 mS on the time axis, the resistors are shorted and the motor windings connected in delta across the line. Between 250 mS and 400 mS on the time axis, the current wave relative to the voltage wave lags (drops) behind by 69 degrees. Subsequently the network protector tripped, 23 cycles after the resistors were shorted based on the rms current and voltage plots in Figure 32, although this was not captured in the waveforms of Figure 33.
The position of phase A current vector relative to phase A network line-to-ground voltage at 250 mS when the resistors were shorted was not known, although it would have been lagging the network line-to ground voltage as shown in Figure 34. But between 250 mS and 400 mS as shown in Figure 34 it dropped behind by 69 degrees. There is no doubt that it continued to drop behind further and intercepted the network relay sensitive trip curve in either the first or fourth quadrant.

Figure 34:
Shift in network current phasor between 250 mS and 400 mS.
When the motor windings were reconnected in delta and the resistor shorted, this advances the motor internal voltage relative to the system voltage, which results in a momentary reversal in the network protector. The solution to prevent protector tripping during startup with the wye-delta starter was to use time delay tripping on the protector, with the time delay set high enough to allow the momentary reversal.
Figure 35 shows the network relay trip characteristic with time delay. The instantaneous current setting, IINST that bypasses the time delay must be above the reverse current caused by shorting the resistors when the motor windings are placed across the line in delta. In addition, IINST must be less than the current in the protector for backfeed to a multi-phase fault on the primary feeder, so that such faults are cleared from the network side without time delay. Reference
Time Delay Tripping of Network Protectors for more information on time delay tripping and settings for network relays.

Figure 35:
Straight-line sensitive trip characteristic with time
delay tripping.
Effect of Source Voltage Magnitude and Phase Angle Differences on Spot Network Power and Var Flows
As mentioned in many chapters of this book, having the primary feeders to a network come from the same substation with closed bus-tie circuit breakers results in the most stable operation possible for the network protectors in the grid and spot networks. With closed bus tie breakers and no reactors in the substation bus, the same voltage is applied to all primary feeders of the network at the substation end.
Contained in this section are the results obtained from remote monitoring of three- and four unit 480-volt spot networks supplied from a substation with a closed ring bus, but with phase reactors in the ring bus to help limit the short circuit currents. Figure 36 shows the substation that supplies the spot networks for which the loading on each network protector in the spot network is available. The feeders supplying the spot networks are labeled FDR 19, FDR 20, FDR 97, FDR 98, and FDR 99. FDR 19 and FDR 20 have the same voltage applied to them at the substation end as there is no reactor between bus sections 4 and 5. But the voltage applied to FDR 97, FDR 98, and FDR 99 are different due to the bus reactors, and different than the voltage applied to FDR 19 and FDR 20.
Flows in Spot Networks from Remote Monitoring
Figures 37 thru 43 show the kW and kVAr flow in each protector in six different spot networks supplied from the substation in Figure 36. Note that for each unit in the spot networks the primary feeder is identified, using the same color for the feeder as in the substation single-line diagram in Figure 36. Also indicated in each figure is the substation bus section to which the feeder is connected
Spot Network Alpha
Figure 37 shows the kW and kVAr flows in the three units of spot network Alpha, which is made from three 1500 kVA network transformers. The kW flows in the units fed from FDR 98 and FDR 99 are much larger than the kW flow in FDR 19. This would suggest that the voltage on bus section 4 that supplies FDR 19 is lagging the voltage on bus sections 6 and 1 that supply FDR 98 and FDR 99 respectively. Also listed in Figure 37 is the total kW and kVAr load supplied by the spot network, 1127 kW and 453 kVAr. Shown in light-green is the network kW load at which the protector fed from FDR 19 would trip, being 624 kVA, which is 42% of the kVA rating of one network transformer. Next to each protector is the counter reading, CTR. As expected, the protector fed from FDR 19 has a much larger number of operations than the others. This is what would happen if the voltage on bus section 4 were lagging that on bus sections 6 and 1, yet bus section 4 voltage magnitude was higher. Spot Network Application Considerations discusses in detail the method used to calculate the spot network kW load at which the first network protector will trip.

Figure 36:
Substation with reactors in ring-bus that supplies spot
networks from feeders

Figure 37:
kW and kVAr flows in spot network Alpha, three 1500 kVA
transformers. See Figure 36 for feeder connections to substation ring
bus.
Note that the kVAr flow in the unit fed from FDR 19 is high, suggesting that bus section 4 voltage is relatively high.
Spot Network Beta
Figure 38 shows the kW and kVAr flows in each protector in four-unit spot network Beta having four 2000 kVA network transformers, fed from FDR 97, FDR 98, FDR 99, and FDR 20. From the kW flows in the four units, it is seen that the voltage on substation bus section 5, that supplies FDR 20, which is the same as that on substation bus section 4 that supplies FDR 19, is lagging that on the bus sections supplying FDR 97, FDR 98, and FDR 99. Apparently, the current flows in the bus-tie reactors are such that the voltage on bus section 4 and 5 lags that on the other bus sections. Voltage Regulation and Capacitors in Secondary Network Systems discusses the phase shift that occurs across a reactor when current of a known power factor is flowing in it, and that can be quite large.
For spot network Beta, if the network kW load were to drop down to 1152 kVA, which is 58% of the kVA rating of one network transformer, the network protector fed from FDR 20 (bus section 5) would trip, of course assuming it has a sensitive trip setting.

Figure 38:
kW and kVAr flows in spot network Beta, four 2000 kVA
transformers. See Figure 36 for feeder connections to substation ring
bus.
Spot Network Gamma
Figure 39 shows spot network Gamma, with four 2000 kVA network transformers fed from the same feeders that feed spot network Beta in Figure 38. Again, the network unit fed from FDR 20 supplies much less of the network kW load. If the total kW load on spot network Gamma dropped down to 960 kW or 48% of the rating of one network transformer, the network protector fed from FDR 20 will trip.

Figure 39:
kW and kVAr flows in spot network Gamma,. four 2000 kVA
transformers. See Figure 36 for feeder connections to substation ring
bus.
Spot Network Delta
Figures 40 shows the kW and kVAr flows in each protector in spot network Delta, consisting of three 1500 kVA network transformers, but the protector fed from FDR 20 is open (Sub Bus 5). The kw supplied by the protector fed from FDR 99 is 2.34 times that in the protector fed from FDR 19. However, note the kVAr flow in the two protectors is nearly equal, suggesting that the voltage on Bus 1 leads that on Bus 4, but the voltage magnitudes on the two substation buses are nearly equal. Should the network kW load drop down to 320 kW, or 21% of the kVA rating of one network transformer, the protector fed from FDR 19 will trip. This would then create a single feed to the load via FDR 99, with the concern being if FDR 99 were taken out of service due to a fault or for work, there would be a momentary outage to the load served from spot network Delta.

Figure 40:
kW and kVAr flows in spot network Delta, three 1500 kVA
transformers. See Figure 36 for feeder connections to substation ring
bus.
Spot Network Epsilon
Figure 41 shows the kW and kVAr flows in the two closed protectors in three-unit spot network Epsilon, where the network transformers are rated 1000 kVA. The kW supplied by the protector on FDR 97 is 4.9 times that supplied by the protector on FDR 20, again suggesting that the angle of the voltage on substation bus 5 is lagging that on substation bus 2. This is consistent with the high counter reading for the protectors fed from FDR 19 and FDR 20.

Figure 41:
kW and kVAr flows in spot network Epsilon, three 1000
kVA transformers. See Figure 36 for feeder connections to substation
ring bus.
Spot Network Zeta
Figure 42 shows the kW and kVAr flows in another four-unit spot network having 2000 kVA network transformers. The kW supplied by the protectors fed from FDR 97, FDR 98, and FDR 99 are nearly equal, but the kW supplied by the protector fed from FDR 20 (sub bus 5) is significantly lower, due to the angle of the voltage on sub bus section 5 lagging that on the other three bus sections. Note from the counter readings that the protector on feeder FDR 20 fed from bus section 5 is more the 40 times that of the other protector in the spot network. Given at the bottom of Figure 42 is the network kW load at which the protector fed from FDR 20 would trip, 1096 kW, which is 55% of the kVA rating of one 2000 kVA network transformer.

Figure 42:
kW and kVAr flows in spot network Zeta, four 2000 kVA
transformers. See Figure 36 for feeder connections to substation ring
bus.
Spot Network Eta
For three-unit spot network Eta fed from FDR 19, FDR 20, and FDR 99 with 1500 kVA network transformers, the kW and kVAr flows in the protectors fed from FDR 19 and FDR 20 are nearly equal, as shown in Figure 43. This is what would be expected as FDR 19 and FDR 20 have the same voltage applied to them at the substation.

Figure 43:
kW and kVAr flows in spot network Eta, three 1500 kVA
network transformers. See Figure 36 for feeder connections to
substation ring bus.
But the kW flow in the protector fed from FDR 99 is about 2.76 times that in the protectors fed from FDR 19 and FDR 20. This is consistent with the observations made for the other spot networks, due to the angle of the voltage on substation buses 4 and 5 lagging those on the other buses supplying the network feeders. Also notice the high counter readings for the network protectors fed from FDR 19 and FDR 20.
Spot Network Theta
Spot network Theta, consisting of three 1500 kVA network transformers is fed from a substation which has a medium-voltage ring bus, but there are no reactors in the ring bus. Thus, the same voltage is applied to each network feeder at the substation end. From the listed kW and kVAr flows in each of the three network protectors, it is seen the flows are well balanced.

Figure 44:
kW and kVAr flows in spot network Theta, three 1500 kVA
transformers. All three feeders come from a closed ring bus with no
reactors.
Should the kW load on spot network Theta in Figure 44 drop down to 45 kVA, which is just 3% of the kVA rating of one 1500 kVA network transformer, the network protector fed from feeder FDR 12 would trip. This just illustrates that when the feeders to a network come from the same electrical bus in the substation, the load on a spot network can be quite low before the first network protector opens, creating a single contingency condition.
Summary
The examples presented in this section and the results are consistent with the theoretical analysis presented in other chapters, showing that if significant voltage magnitude and angle differences exist between the voltage applied to the network primary feeders at the substation end, load division in spot networks can be poor, and protectors may experience a large number of operations, due to either cycling or pumping as defined and discussed in Impact of Relay Settings on Tripping & Closing in Spot Networks.
4.17 - Appendix 1
APPENDIX 1
FAULTS ON RADIAL SERVICES
When a short-circuit occurs in a set of phase-grouped cables in a service which has two or more parallel sets of cable, the current in the fault path, the current in the limiter at the manhole end, and the current in the limiter at the service end are a function of numerous parameters, including the location of the fault between the manhole end and the service end. Presented in this appendix are the equations for determining these currents before any limiter blows, and then equations for finding the current in the limiter at the service end after the limiter at the manhole end blows, and equations for finding the current in the limiter at the manhole end after the limiter at the service end blows. Also presented are curves for the case where the three-phase and single-line to ground fault current available at the manhole end are 25 kA and 20 kA respectively.
Fault With No Blown Limiters
Figure 1 shows a radial reach (service) with NSET sets of phase-grouped cables, with a fault in on just one set. It is assumed that each set is identical and in a separate duct. The length of the service is “L” feet, and the distance of the fault from the manhole end is “K” per unit of the total length of the reach, “L”. The current in the cable limiter at the manhole end of the faulted set is IL1, and the current in the cable limiter at the service is IL2. The current in the fault path is IF.

Figure 1:
Radial reach with NSET sets of phase-grouped
cables.
Eq (1) gives the current in the fault path, IF, for a three-phase fault as a function of the number of sets of cable in the reach.
(1) $$ \ \ \ I_{F} = \frac{E_{LN}}{Z_{1S} + \frac{(N_{SET} -1)K(1 - K) + K}{N_{SET}}Z_{1SET} \frac{L}{1000}} AMP $$
In this equation, the terms are:
Z1S = positive-sequence impedance of the source system feeding the manhole, in Ohms
Z1SET = positive-sequence impedance of one set of cables in Ω/1000 ft.
L = length of reach (service) in feet
ELN = System line-to-neutral voltage, taken as the nominal value of 120 volts rms
In evaluating this eq (1), impedances Z1SET and Z1S are complex numbers.
The current in the limiter at the manhole end, IL1, with no blown limiters is given by eq (2), and the current in the limiter at the service end, IL2, of the reach is given by eq (3).
(2) $$ \ \ \ I_{L1} = \frac{(N_{SET} - 1 )(1 - K) + 1}{N_{SET}}I_{F} AMP $$
(3) $$ \ \ \ I_{L2} = \frac{(N_{SET} - 1) K}{N_{SET}}I_{F} AMP $$
The distance from the manhole to the fault which results in limiter L1 and L2 seeing the same current, is found by equating eq (2) to eq (3), and solving for K.
(4) $$ \ \ \ K_{L1=L2} = \frac{N_{SET}}{2(N_{SET} - 1)} $$
The distance from the manhole to the fault where the total current in the fault path, IF, is minimum, is found by taking the derivative of eq (1) with respect to K, and setting the result to zero. The result is given by eq (5).
(5) $$ \ \ \ K_{I_{F}=MIN} = \frac{N_{SET}}{2(N_{SET} - 1)} $$
Thus, the fault location which makes the current in the limiters at the manhole end and service end equal, KL1-L2, also is the location, KIF=MIN, where the current in the fault path, IF in Figure 1, is minimum. Table 1 lists, for different number of sets of cables, the per unit distance to the fault, “K”, where the current in the limiters at the manhole end and at the service end are equal.
Table 1:
Per Unit Distance From Manhole to Fault Where Current in
Limiters at Manhole End and Service End are Equal
| Number of Sets of Cable (NSET) | Per Unit Distance From Manhole End (K) |
|---|---|
| 2 | 1.0 |
| 3 | 0.750 |
| 4 | 0.667 |
| 5 | 0.625 |
| 6 | 0.600 |
| 7 | 0.583 |
Fault With Blown Limiter At Manhole End
When the distance to the fault from the manhole end is less than that given by eq (4), most likely the limiter at the manhole end will blow first. With the limiter at the manhole end blown, the current in the fault path, IF-L1=0 equals the current in the limiter at the service end, IL2-L1=0. The current in the fault path with the limiter at the manhole end blown and in the limiter at the service end are given by eq (6)
(6) $$ \ \ \ I_{F-L1=0} = \frac{E_{LN}}{Z_{1S} + \frac{(N_{SET} - 1 )(1 - K) + 1}{N_{SET} - 1} Z_{1SET} \frac{L}{1000}} Amp $$
From eq (6), the current in the fault path with limiter L1 at the manhole-end blown will be minimum when the fault is located at the manhole end (K = 1) in Figure 1.
Fault With Blown Limiter At Service End
When the distance to the fault from the manhole end is greater than that given by eq (4), most likely the limiter at the service end will blow first. With the limiter at the service end blown, the current in the fault path, IF-L2=0, equals the current in the limiter at the manhole end, IL1-L2=0, is given by eq (7).
(7) $$ \ \ \ I_{F-L2=0}= \frac{E_{LN}}{Z_{1S} + KZ_{1SET} \frac{L}{1000} } $$
From eq (7), with the limiter at the service end blown, the current in the fault path will be minimum when the fault is located right at the service end (K = 1).
Example Plots Of Fault-Path and Limiter Currents
Given in this section are the results of example calculations using the equations presented earlier, for both the three-phase fault, and the single line-to-ground (SLG) fault on one set of cables between the manhole end and service end. With reference to Figure 1, at the manhole the available three-phase fault current is 25 kA, and the available SLG fault current is 20 kA. The ratio of X1S to R1S of the system is taken as 2.0, and the ratio of X0S to R0S is taken as 1.5. Each set of cables has four 500 kcmil insulated cables with the following sequence impedances. See Sequence Impedances of Phase Grouped Cables for calculation of sequence impedances of phase-grouped cables.
Z1-SET = 0.0247 + j0.0321 Ω/kft
Z0-SET = 0.0987 + j0.1151 Ω/kft
Further, it is assumed for the illustrations that the length of the service, “L”, is 200 feet
In each of the figures, 2 thru 5, the solid curves apply for the three-phase fault, and the dashed curves apply for the SLG fault. The blue-colored curves give the current in the fault path, the red-colored curves give the current in the limiter at the manhole end, and the green-colored curves give the current in the limiter at the service end. The currents are plotted versus the per unit distance from the manhole to the fault, “K”.
The plots in Figures 2 thru 5 are for services with two thru five sets of cables, as indicate in the figure captions.

Figure 2:
Currents for three-phase and single line-to-ground
faults with two sets of cables.

Figure 3:
Currents for three-phase and single line-to-ground
faults with three sets of cables.

Figure 4:
Currents for three-phase and single line-to-ground
faults with four sets of cables.

Figure 5:
Currents for three-phase and single line-to-ground
faults with five sets of cables.
Calculating Fault Clearing Time
When a fault occurs in a single set of cables in a radial reach as in Figure 1, the last limiter to blow will see two values of fault current. The fault currents needed to determine the time from fault inception till the last limiter blows are given, assuming that the fault is close to the manhole, such that the limiter at the manhole end blows first. Specifically, for the example it is assumed the per-unit distance to the fault, “K”, is 0.30, and there are three sets of cables in the reach.
IL1 = Current in limiter L1 at manhole end before it blows.
IL2-NB = Current in limiter L2 at service end prior to the blowing of limier L1 at manhole end.
IL2-L1B = Current in Limiter L2 after limiter L1 blows
Figure 6 shows for a 200-foot service with three sets of cables, with the solid curves the currents before any limiters blow. The total current in the fault path, IF is shown with the blue curve, the current in the limiter at the service end, IL2-NB, with the solid green colored curve, and the current in the limiter at the manhole end, IL1 with the solid red colored curve, The current values for K = 0.30 are marked on the time-current curve for a 500 kcmil limiter in Figure 7.

Figure 6:
Limiter currents with three sets of cables for a
three-phase with per unit distance to fault, “K”, of 0.30, no blown
limiters.
The procedure described below is used to find the time from fault inception until the second limiter at the service end, L2, blows to isolate the faulted set of cables. Reference should be made to the limiter time-current curve in Figure 7, which identifies the currents IL1, IL2-NB, and IL2-L1B.
-
From the limiter time-current curve, determine the time for limiter L1 at the manhole end to blow at current IL1. Designate this time as tL1.
-
Calculate the I2t input to limiter L2 at the service end seeing current IL2-NB, from t = 0 to time tL1. Designate this a I2tL2-NB.
$$ \ \ \ I^2 t_{L2-NB} = I_{L2-NB}^2 t_{L1} $$
-
From the limiter time-current curve, determine the time for limiter L2 to blow at current IL2-L1B, that is with just the current in limiter L2 after limiter L1 blows, assuming there is no I2t input to L2 from time equal zero (fault initiated) until limiter L1 at the manhole-end blows at time tL1. Designate this at tL2 as shown on Figure 7.
-
Calculate the I2t required for limiter L2 at the service end to blow at current IL2-L1B, neglecting any I2t input to the service-end limiter L2 from time 0 till the first limiter (L1) blows at time tL1. That is, calculate the I2t needed to blow limiter L2 at current IL2-L1B, assuming there is no current in limiter L2 from time of fault inception until limiter L1 at the manhole end blows. Designate this as I2tL2-L1B. It is calculated as follows.
$$ \ \ \ I^2 t_{L2-L1B} = I_{L2-L1B}^2 t_{L2} $$

Figure 7:
Limiter time-current curves with current values for
fault at K= 0.30 per unit.
- Since there was I2t input to service-end limiter L2 from time of fault inception (t = 0) up to the time limiter L1 at the manhole end blows at time tL1, the incremental or additional I2t input needed to blow limiter L2 after limiter L1 blows, taking into account the I2t input to limiter L2 from current IL2-NB from time = 0 to time equal tL1 is:
$$ \ \ \ \Delta I^2 t_{L2-L1B} = I_{L2-L1B}^2 t_{L2} -I_{L2-NB}^2 t_{L1} $$
- Calculate the time that current IL2-LB must flow to produce the incremental I2t needed to blow limiter L2 at the service end. Designate this time as ∆tL2-L1B.
$$ \ \ \ \Delta t_{L2-L1B} = \frac{t_{L2-L1B}^2 t_{L2} - I_{L2-NB}^2 t_{L1}}{I{L2 - L1B}^2} $$
- Finally calculate the total time from fault inception until limiter L2 at the service end blows, which is designated as tL2-TOTAL.
$$ \ \ \ t_{L2 - TOTAL} = t_{L1} + \Delta t_{L2-L1B} $$
The use of this procedure will be demonstrated assuming that the distance to the fault is 0.30 per unit (K = 0.30) in Figure 6. The currents of interest are the current in manhole-end limiter L1 with no blown limiters, designated as IL1, and the current in service-end limiter L2 with no blown limiters, designated as IL2-NB. From the curve in Figure 6 with K = 0.3:
IL1 = 14289 Amperes
IL2-NB = 3572 Ampere
These currents are shown on the limiter time-current curve in Figure 7. The time for manhole-end limiter L1 to blow, tL1, is shown in red on time-current curve in Figure 7.
tL1 = 0.235 s
The I2t input to service-end limiter L2 from fault inception at t=0 till limiter L1 blows at time tL1 is:
$$ \ \ \ I^2 t_{L2-NB} = 3572^2 * 0.235 = 2.998 * 10^6 A^2 \text{ s} $$
The I2t needed to blow service-end limiter L2 at current IL2-L1B, the current in limiter L2 after the limiter at the manhole end blows, neglecting the I2t input from t=0 till limiter L1 blows at time tL1 is:
$$ \ \ \ I^2 t_{L2-L1B} = 8298^2 * 0.83 = 57.151 * 10^6 A^2 \text{ s} $$
The incremental I2t needed to blow service-end limiter L2 at current IL2-L1B, after limiter L1 blows at time tL1 is:
$$ \ \ \ \Delta I^2 t_{L2-L1B} = (57.151 - 2.998) * 10^6 = 54.153 * 10^6 A^2 \text{ s} $$
The incremental time that current IL2-L1B must flow after manhole-end limiter L1 blows to melt limiter L2 at the service end is:
$$ \ \ \ \Delta t_{L2-L1B} = \frac{54.153 * 10^6}{8298^2} = 0.7865 \text{ s} $$
From the time-current curve in Figure A7-1, at 8298 amperes, the time for limiter L2 to blow is 0.83 seconds when the I2t input to the limiter from t = 0 to t = 0.235 seconds is neglected. But when the effect of the I2t from time of fault inception till limiter L1 blows is included, this is reduced to 0.7865 seconds.
The total time from fault inception until limiter L2 blows is:
$$ \ \ \ t_{L2-TOTAL} = 0.235 + 0.7865 = 1.0215 \text{ s}$$
This procedure also can be used to determine the time from fault inception until both limiters blow, regardless of which limiter blows first.
4.18 - Appendix 2
APPENDIX 2
PROTECTOR & SERVICE FUSE COORDINATION
In 480-volt spot networks, where multiple network protectors feed a paralleling bus, services are supplied from the paralleling bus. Frequently a large current-limiting fuse is either at the tap from the paralleling bus to the service entrance conductors, or the service entrance main consists of a fused switch with a current-limiting fuse, and on services rated above 1000 amperes or higher ground fault relaying is installed per the NEC requirements.
Should a fault occur on the service downstream of the service current-limiting fuse, and assuming that enhanced protection is not incorporated in the spot network, as discussed 480-volt-spot-network, it is desired that the service fuse be selectively coordinated with the network protector fuses. A fault downstream of the service fuse should only result in blowing of the service fuse. This appendix contains time-current curves showing the coordination between current-limiting service fuses with ampere ratings from 1200- amperes to 6000-amperes, with the network protector fuses.
Considered are network protectors with the silver-sand type fuses, such as the Eaton NPL fuse, and the Richards Manufacturing Type 317. Also considered are network protectors with either the type Y or type Z copper fuses.
Network Protectors With Silver Sand Fuses
Table 1 shows in the first column the size service fuses considered. They are the type AB4Y fuses, with the time current characteristics given in Figure 1 for fuses rated from 600 amperes to 6000 amperes.
Table 1 shows that for each service size in the first column, two network designs that were considered in evaluating the coordination between the service fuse and the silver-sand network protector fuse. For example, for the service with the 1200 ampere fuse, the coordination is shown when supplied from a spot with two (2) 1000 kVA transformers, and when supplied from a spot network with three (3) 500 kVA transformers.
:
Network designs considered for evaluating coordination of
service fuse and protector fuses
Service Fuse AB4y (Amps) |
Network Design 1 | Network Design 2 | ||||
|---|---|---|---|---|---|---|
No of Xfrs |
Xfr Size (kva) |
NPL Fuse Amps |
No of ‘Xfrs | Xfr Size (kva) |
NPL Fuse Amps |
|
| 1200 | 2 | 1000 | 1875 | 3 | 500 | 800 |
| 1600 | 2 | 1500 | 2825 | 3 | 750 | 1200 |
| 2000 | 2 | 1500 | 2825 | 3 | 1000 | 1875 |
| 2500 | 2 | 2000 | 3000 | 3 | 1000 | 1875 |
| 3000 | 2 | 2500 | 3750 | 3 | 1500 | 2825 |
| 4000 | 3 | 1500 | 2825 | 4 | 1000 | 1875 |
| 5000 | 3 | 2000 | 3000 | 4 | 1500 | 2825 |
| 6000 | 3 | 2500 | 3750 | 4 | 1500 | 2825 |
Figure 2 shows the time-current characteristics of the Eaton type NPL silver-sand fuse for application in network protectors, with the highest rated fuse being 3750 amperes. Figure 3 shows the time-current characteristics of the Richards Manufacturing type 317 silver sand fuse, where these fuses are produced by Ferraz Shawmut. Note that the shapes of the time-current curves of the NPL and Richards fuse are different. This will become more apparent when the two are plotted together. The NPL fuse curves are plotted from 0.10 seconds to 1000 seconds, and the Richards fuses are plotted from 0.01 seconds to 1000 seconds. Although these fuses are current-limiting at high available fault currents, in the normal application on a network protector they do not operate in a current-limiting fashion on through fault currents, as the through fault current is limited by the impedance of the associated network transformer. Also notice that the Richards fuses for the network protector are available up to just 3000 amperes.

Figure 1:
Time-current characteristics of A4BY Class L Service
Fuses. Reference curve is Ferraz Shawmut 86259
Contained in the remainder of Network Protectors With Silver-Sand Fuses are time-current curves showing the coordination between the service fuse and the network protector fuses. In preparing the coordination curves, it is assumed that the current in the service fuse divides equally between the network protectors that are connected to the paralleling bus. This is a reasonable assumption when the network transformer impedance predominates over other impedances in the system.
In the coordination plots presented herein, the Eaton NPL fuse time-current characteristic is plotted with the red-colored curve, either solid or dashed, and the Richards 317 fuse characteristic is plotted with the orang-colored curve, either solid or dashed. The time-current characteristic of the service fuse is plotted with the blue-colored curve.

Figure 2:
Time-current characteristics of type NPL network
protector fuses.
Figure 4 shows the coordination between the 1200 ampere service fuse and the network protector fuse in a two-unit spot network with 1000 kVA network transformers and 1875 ampere network protector fuses. For the protector fuses, the solid curves apply when both protectors are closed, and the dashed curves apply when one protector is closed. Also shown with the vertical black line is the maximum backfeed current for a three-phase fault on the primary feeder with the breaker for the faulted feeder open. Notice that the fuse times at this maximum backfeed current are sufficiently long to allow the network protector to open before the protector fuse would blow.
Figure 5 shows the coordination between the 1200 ampere service fuse, and the network protector fuse in a three-unit spot network with three 500 kVA network transformers, and 800 ampere network protector fuses. Given are the protector fuse curves when all three protectors are closed, and when just one protector is closed. With just one closed protector, the coordination between the 1200 ampere service fuse and 800 ampere network protector fuse is marginal. But with two or three closed protectors, the coordination is selective and only the service fuse will blow.

Figure 3:
Time current characteristic of ETI 317 network protector
fuses.

Figure 4:
1200 A service fuse, two 1000 kVA Xfrs

Figure 5:
1200 A service fuse, three 500 kVA Xfrs.
Figure 6 shows the coordination between the 1600 ampere service fuse, and the network protector fuse in a two-unit spot network with 1500 kVA network transformers, and 2825 ampere network protector fuses. Given are the protector fuse curves when both protectors are closed, and when just one protector is closed. With just one closed protector, the coordination between the 1600 ampere service fuse and 2825 ampere network protector fuse is selective, for both the Eaton fuse and the Richards fuse. At the maximum backfeed current in the two-unit spot network, the protector fuses are slow enough to allow the network protector to open without damaging the protector fuses.
Figure 7 shows the coordination between the 1600 ampere service fuse, and the network protector fuse in a three-unit spot network with 750 kVA network transformers, and 1200 ampere network protector fuses. Given are the protector fuse curves when all three protectors are closed (solid curves), and when just one protector is closed (dashed curves). With just one protector closed, the coordination between the 1600 ampere service fuse and 1200 ampere network protector fuse is marginal. But with two or three closed network protectors, the coordination is selective and only the service fuse will blow for a fault downstream of the service fuse. Further notice that at the maximum backfeed current to a three-phase fault on the primary feeder with the feeder breaker open, the protector fuse is sufficiently slow to allow the network protector to open without damaging the protector fuse.

Figure 6:
1600 A service fuse, two 1500 kVA Xfrs.

Figure 7:
1600 A service fuse, three 750 kVA Xfrs.
Figure 8 shows the coordination between the 2000 ampere service fuse, and the network protector fuse in a two-unit spot network with 1500 kVA network transformers, and 2825 ampere network protector fuses. Given are the protector fuse curves when both network protectors are closed (solid-curves), and when just one protector is closed. With just one closed protector, the coordination between the 2000 ampere service fuse and 2825 ampere network protector fuse is selective, for both the Eaton fuse and the Richards fuse. Also, at the maximum backfeed current in the two-unit spot, the protector fuses are slow enough to allow the protector to open without damaging the protector fuses.
Figure 9 shows the coordination between the 2000 ampere service fuse, and the network protector fuse in a three-unit spot network with 1000 kVA network transformers, and 1875 ampere network protector fuses. Given are the protector fuse curves when all three protectors are closed, and when just one protector is closed. With just one protector closed, the coordination between the 2000 ampere service fuse and 1875 ampere network protector fuse is marginal. But with two or three protectors closed, the coordination is selective and only the service fuse will blow. Further notice that at the maximum backfeed current to a three-phase fault on the primary feeder with the feeder breaker open, the protector fuse is sufficiently slow to allow the protector to open without damaging the protector fuses.

Figure 8:
2000 A service fuse, two 1500 kVA Xfrs
Figure 10 shows the coordination between the 2500 ampere service fuse, and the network protector fuse in a two-unit spot network with 2000 kVA network transformers, and 3000 ampere network protector fuses. Given are the protector fuse curves when both protectors are closed, and when just one protector is closed. With just one closed protector, the coordination between the 2500 ampere service fuse and 2825 ampere network protector fuse is selective, for both the Eaton fuse and the Richards fuse. Also notice that at the maximum backfeed current in the two-unit spot network, the protector fuses are slow enough to allow the protector to open without damaging of the protector fuse.

Figure 9:
2000 A service fuse, three 1000 kVA Xfrs
Figure 11 shows the coordination between the 2500 ampere service fuse, and the network protector fuse in a three-unit spot network with 1000 kVA network transformers, and 1875 ampere network protector fuses. Given are the protector fuse curves when all three protectors are closed, and when just one protector is closed. With just one closed protector, the coordination between the 2500 ampere service fuse and 1875 ampere network protector fuse is marginal. But with two or three closed protectors, the coordination is selective and only the service fuse will blow. Further notice that at the maximum backfeed current to a three-phase fault on the primary feeder with the feeder breaker open, the protector fuse is sufficiently slow to allow the protector to open without damaging the protector fuse.
Figures 12 and 13 show the coordination between the 3000 ampere service fuse, and the protector fuses in a two-and three-unit spot network respectively, with two 2500 kVA network transformers, and three 1500 kVA transformers. With only one 1500 kVA transformer feeding the bus, the coordination with the 3000 ampere service fuse is marginal as seen from Figure 13.

Figure 10:
2500 A service fuse, two 2000 kVA Xfrs

Figure 11:
2500 A service fuse, three 1000 kVA Xfrs.

Figure 12:
3000 A service fuse with two 2500 kVA Xfrs.

Figure 13:
3000 A service fuse with three 1500 kVA Xfrs.
Figures 14 shows the coordination between the 4000 ampere service fuse, and the 2825 ampere network protector fuses in a three-unit spot network with 1500 kVA network transformers. As long as two network protectors are closed, the 2825 ampere protector fuses are selectively coordinated with the 4000 ampere service fuses.

Figure 14:
4000 A service fuse with three 1500 kVA Xfrs
Figure 15 shows the coordination between the 4000 ampere service fuse, and the 1875 ampere protector fuses in a four unit spot network with 1000 kVA network transformers. When only two protectors are closed, the current in each protector fuse is one half of the current in the service fuse, and the coordination is marginal. But with three or four protectors closed, the coordination is selective.
Figures 16 shows the coordination between the 5000 ampere service fuse, and the 3000 ampere network protector fuses in a three-unit spot network with 2000 kVA network transformers. As long as two network protectors are closed, the 3000 ampere protector fuses are selectively coordinated with the 5000 ampere service fuses. A fault downstream of the 5000 ampere service fuses should not blow the protector fuses.
Figures 17 shows the coordination between the 5000 ampere service fuse, and the 2825 ampere network protector fuses in a four-unit spot network with 1500 kVA network transformers. As long as two network protectors are closed, the 2825 ampere protector fuses are selectively coordinated with the 5000 ampere service fuses.
The largest size service fuse considered is the 6000 ampere A4BY, supplied from spot networks with either three 2500 kVA network transformers, or four 1500 kVA network transformers.

Figure 15:
4000 A service fuse with four 1000 kVA Xfrs

Figure 16:
5000 A service fuse with three 2000 kVA Xfrs.

Figure 17:
5000 A service fuse with four 1500 kVA Xfrs
Figures 18 shows the coordination between the 6000 ampere service fuses, and the 3750 ampere NPL network protector fuses in a three-unit spot network with 2500 kVA network transformers. At the time this curve was prepared, the largest silver-sand fuse available from Richards was 3000 amperes. As long as two network protectors are closed, the 3750 ampere NPL protector fuses are selectively coordinated with the 6000 ampere service fuses. A fault downstream of the 6000 ampere service fuses should not blow the protector fuses.
Figures 19 shows the coordination between the 6000 ampere service fuse, and the 2825 ampere network protector fuses in a four-unit spot network with 1500 kVA network transformers. As long as three network protectors are closed, the 2825 ampere protector fuses are selectively coordinated with the 6000 ampere service fuses. But if only two network protectors are closed, the coordination between the 6000 ampere service fuses and the 2825 ampere network protector fuses is marginal.
It should be remembered that in preparing the curves in this appendix, it is assumed that the total current in the service fuse divides equally between the network protector fuses whose protectors are closed. This is never 100% correct, as the impedances of the buses between the protectors and the point where the service is connected is not zero. See Table 4 and 5 in Network System Modeling to compare the impedance of short sections of LV bus and the impedance of network transformers reflected to the LV side.

Figure 18:
6000 A service fuse with three 2500 kVA Xfrs

Figure 19:
6000 A service fuse with four 1500 kVA Xfrs.
Network Protectors with Y and Z Fuses
Some users prefer the Y or Z copper fuses for network protectors in 480-volt spot networks, as they provide better through fault protection to the network transformer than that provided by the silver-sand fuses should a protector fail to open under a high-current backfeed. This is shown by the time current curves in Appendix 4. In this section, given are time-current curves showing the coordination between silver-sand service fuses of the size in Table 2, and either Y or Z network protector fuses in spot networks.
In evaluating the coordination, it is assumed, just as when the network protectors have the silver-sand fuses, that the current in the service fuse divides equally between the fuses in the closed network protectors in the spot network.
Table 2:
Network designs considered for evaluation coordination of
service fuse and Y and Z protector fuses
Service Fuse AB4y (Amps) |
Network Design 1 | Network Design 2 | ||||
|---|---|---|---|---|---|---|
No of Xfrs |
Xfr Size (kva) |
NWP Fuse |
No of ‘Xfrs | Xfr Size (kva) |
NWP Fuse |
|
| 1200 | 2 | 1000 | Y22.5 | 3 | 500 | Y11 |
| 1600 | 2 | 1500 | Y25 | 3 | 750 | Y15 |
| 2000 | 2 | 1500 | Y25 | 3 | 1000 | Y22.5 |
| 2500 | 2 | 2000 | Z37.5 | 3 | 1000 | Y22.5 |
| 3000 | 2 | 2500 | Z50 | 3 | 1500 | Y25 |
| 4000 | 3 | 1500 | Y25 | 4 | 1000 | Y22.5 |
| 5000 | 3 | 2000 | Z37.5 | 4 | 1500 | Y25 |
| 6000 | 3 | 2500 | Z50 | 4 | 1500 | Y25 |

Figure 20:
1200 A service fuse with two 1000 kVA Xfrs and Y22.5
fuses.

Figure 21:
1200 A service fuse with three 500 kVA Xfrs and Y 11
fuses.

Figure 22:
1600 A service fuse with two 1500 kVA Xfrs and Y 25
fuses.

Figure 23:
1600 A service fuse with three 750 kVA Xfrs and Y 15
fuses.

Figure 24:
2000 A service fuse with two 1500 kVA Xfrs and Y 25
fuses.

Figure 25:
2000 A service fuse with three 1000 kVA Xfrs and Y 22.5
fuses.

Figure 26:
2500 A service fuse with two 2000 kVA Xfrs and Z37.5
fuses.

Figure 27:
2500 A service fuse with three 1000 kVA Xfrs and Y22.5
fuses

Figure 28:
3000 A service fuse with two 2500 kVA Xfrs and Z 50
fuses.

Figure 29:
3000 A service fuse with three 1500 kVA Xfrs and Y25
fuses

Figure 30:
4000 A service fuse with three 1500 kVA Xfrs and Y25
fuses.

Figure 31:
4000 A service fuse with four 1000 kVA Xfrs and Y22.5
fuses.

Figure 32:
5000 A service fuse with three 2000 kVA Xfrs and Z37.5
fuses.

Figure 33:
5000 A service fuse with four 1500 kVA Xfrs and Y25
fuses.

Figure 34:
6000 A service fuse with three 2500 kVA Xfrs and Z50
fuses.

Figure 35:
6000 A service fuse with four 1500 kVA Xfrs and Y25
fuses.
Summary of Protector and Service Fuse Coordination
A review of the time-current curves in Network Protectors With Y and Z Fuses for protectors with the Y or Z fuses, Figures 20 through 35, allows determining for each A4BY service fuse the number of protectors that must be closed in order that the service fuse of a given ampere rating is selectively coordinated with the protector Y or Z fuses. The results of this are summarized in Table 3. It is clear from the time-current curves that the Y and Z protector fuses do not coordinate as well as current-limiting protector fuses with the service fuse, due to the differences in the shape of their time-current curves.
A review of the time-current curves in Network Protectors With Silver-Sand Fuses for network protectors that have the silver-sand network protector fuses also allows determining the number of transformers/protectors that must be closed to allow selective coordination with the A4BY service fuse and the silver-sand network protector fuses. The results of this are summarized in Table 4, based upon the review of the time-current curves in Figures 4 through 19. The silver-sand protector fuses coordinate with the silver-sand service fuses better than the protector Y and Z fuses, due to the similarity in the shape of their time-current curves.
Table 3:
Number of transformers/closed protectors with Y or Z
fuses needed to coordinate with A4BY service fuse.
SERVICE FUSE A5BY (A) |
TRANSFORMERER/ PROTECTOR |
NO CLOSED NP FOR COORDINATION |
|
|---|---|---|---|
XFR (KVA) |
NWP FUSE |
||
| 1200 | 1000 | Y25 | 2 |
| 1200 | 500 | Y11 | 2 |
| 1600 | 1500 | Y25 | 2 |
| 1600 | 750 | Y15 | 3 |
| 2000 | 1500 | Y25 | 2 |
| 2000 | 1000 | Y22.5 | 2 |
| 2500 | 2000 | Z37.5 | 2 |
| 2500 | 1000 | Y22.5 | 3 |
| 3000 | 2500 | Z50 | 2 |
| 3000 | 1500 | Y25 | 3(1) |
| 4000 | 1500 | Y25 | 3(1) |
| 4000 | 1000 | Y22.5 | 4(1) |
| 5000 | 2000 | Z37.5 | 3(1) |
| 5000 | 1500 | Y25 | 4(1) |
| 6000 | 2500 | Z50 | 3 |
| 6000 | 1500 | Y25 | 5 |
- Small range of currents where coordination is marginal.
Table 4:
Number of transformers/closed protectors with silver-sand
fuses needed to coordinate with A4BY service fuse.
SERVICE FUSE A5BY (A) |
TRANSFORMERER/ PROTECTOR |
NO CLOSED NP FOR COORDINATION |
|
|---|---|---|---|
XFR (KVA) |
NWP FUSE (A) |
||
| 1200 | 1000 | 1875 | 1 |
| 1200 | 500 | 800 | 2 |
| 1600 | 1500 | 2825 | 1 |
| 1600 | 750 | 1200 | 2 |
| 2000 | 1500 | 2825 | 1 |
| 2000 | 1000 | 1875 | 1(1) |
| 2500 | 2000 | 3000 | 1 |
| 2500 | 1000 | 1875 | 2 |
| 3000 | 2500 | 3750 | 1 |
| 3000 | 1500 | 2825 | 2 |
| 4000 | 1500 | 2825 | 2 |
| 4000 | 1000 | 1875 | 3 |
| 5000 | 2000 | 3000 | 2 |
| 5000 | 1500 | 2825 | 2 |
| 6000 | 2500 | 3750 | 2 |
| 6000 | 1500 | 2825 | 3 |
The coordination between the service fuse and the protector fuse in this appendix is based on the service fuse being the Ferraz Shawmut A4BY. The silver-sand Class L fuse of other manufacturers, such as Bussmann or Littlefuse, will have different time-current characteristics, and for these fuses the coordination between the protector fuses and service fuse must be evaluated separately. In evaluating the coordination between the network protector fuses and the fuses at the 480-volt service entrance, recognize that the service will have ground fault relaying, which for the SLG fault or DLG fault may be much faster than the service fuse.
4.19 - Appendix 3
APPENDIX 3
NETWORK RELAY TRIP CURVE ANGLES
In secondary network systems with dedicated primary feeders, the only protective device for each primary feeder is the circuit breaker at the substation and its overcurrent relays. Faults on the primary feeder or in the network transformers result in opening of all three phases of the feeder at the substation, followed by opening of all network protectors associated with the faulted primary feeder. Some systems have fuses in the primary circuit between the circuit breaker at the substation and the network transformer, as in Fig. 1. The tap circuits for the spot network are connected to the main primary feeder through fuses, so that a fault in the tap circuit between the fuses and the network transformer does not trip the feeder circuit breaker. Application of fuses in the tap circuits also provides more sensitive protection for phase faults in the network transformer than provided with the phase relays for the primary feeder breaker at the substation.
Without fuses at the junction between the OH and UG tap circuits to the network transformers for the spot network, a fault on the tap circuit trips the station breaker and causes an outage to the non-network loads served from the radial feeder. With fuses, faults between the fuses and network transformers blow just the fuses in the faulted phases, establishing a simultaneous fault and blown fuse condition which must be detected by the network protector (NP) relay. The NP relay will detect the simultaneous fault only if the NP relay trip curve angles are set properly. Manufacturers literature provides no guidance on setting these angles, which are adjustable in some relays. The currents and voltages seen by the NP relays in a representative system were determined, and the response of NP relays with three different trip algorithms were evaluated to find the trip curve angles needed to reliably detect the fault and blown fuse conditions. Considered are the single line-to-ground (SLG), double line-to-ground (DLG), and the line-to-line (LL) faults. Equally important, the NP relay in the protector supplied from the unfaulted primary feeder must not trip

Figure 1:
Primary feeders with two-unit spot network fed with
fuses at the OH to UG transition.
System Parameters For Studies
The system for generating the currents and voltages seen by the NP relays during the simultaneous faults is shown in Figure 1. Nominal voltage of the primary system is 13.8 kV, with all bus-tie circuit breakers in the substation closed. The available three-phase and SLG fault currents on the 13.8 kV substation bus are 12.5 kA and 13.125 kA respectively, with the X to R ratio of the positive-and zero-sequence impedances being 15. The sequence impedances of the overhead and underground cable circuits are listed in Table A3-1. Appendix A3-a shows the interconnected sequence networks for simulating a SLG fault with a blown fuse. The network transformers are rated 1000 kVA, 13.8 kV to 480Y/277 volts, 5.0% impedance. The X to R ratio of the transformer impedance is varied to show the effect on the currents and voltages at the NP relay, and the required trip curve angles. The OH feeders from the substation to the tap circuit for the network are 1 mile long, use 477 kcmil aluminum phase conductors and a 4/0 copper neutral conductor, with the phase GMD being 3.18 ft., and the GMD from the phases to the neutral being 6.37 ft. The tap circuits to the network transformers are 300 feet long using 2/0 Al cable with a one third size copper multi-wire concentric neutral.
Table 1:
Sequence impedances of circuits in Figure 1
Circuit Type |
Positive-Sequence |
Zero-Sequence |
||
|---|---|---|---|---|
R-Ω/kft |
X-Ω/kft |
R-Ω/kft |
X-Ω/kft |
|
OH |
0.0375 |
0.1113 |
0.0903 |
0.3697 |
UG |
0.0750 |
0.175 |
0.470 |
0.245 |
The current transformers (CT) in the 480-volt network protectors (NP) in Figure 1 have a 1600 to 5 ratio, and the NP relay sensitive reverse current trip setting is 0.15% of CT rating.
Network Relay Trip Algorithms
Three different algorithms for NP relays to generate the trip characteristic were evaluated. The first is the positive-sequence directional current characteristic in Figure 2, where the adjustable trip curve shift angles are θSH1 and θSH2. This trip characteristic is available in the relay of [1] and [3].
Positive-Sequence Trip Characteristic
For this trip characteristic, the positive-sequence component of the network voltages, V1N, is the reference at zero degrees. The sensitive trip setting, RCT% is the positive-sequence current at 180o, in percent of CT rating, required to make the trip contact. The position of the sensitive trip curve in quadrant 2 is defined by shift angle θSH2, and in quadrant 3 & 4 by shift angle θSH1, with the positive direction being counter clockwise for both shift angles.
In the NP connected to the faulted feeder, the positive-sequence current, I1, most always lies in the 1st or 2nd quadrant, and the current in the NP connected to the unfaulted primary feeder normally lies in the 3rd or 4th quadrant. I1MAG is the magnitude of the positive-sequence current in the protector, I1, that intercepts the trip curve. The angle of I1 relative to V1N, is θ1rly, where the angle usually is positive in the NP connected to the faulted primary feeder, and negative in the NP connected to the unfaulted primary feeder.

Figure 2:
Positive-sequence current trip characteristic in system
amperes.
The magnitude of the positive-sequence current in the protector, I1MAG, and its angle, θ1rly, which is either positive or negative in sign, are obtained from simulations of the system in Figure 1 for the fault and blown fuse condition. The NP relay shift angle, θSH, where current I1MAG will just intercept the trip curve, for either positive or negative values of θ1rly, is given by eq (1).
(1) $$ \ \ \ \theta_{SH} = a \tan{(\frac{-K \cos{\theta_{1rly} - 1}}{K \sin{\theta_{1rly}}})}$$
In eq (1), K is the magnitude of the current in the NP, in per unit of the current at 180 degrees, required to intercept the trip curve, as given by eq (2).
(2) $$ \ \ \ K = \frac{I_{1MAG}}{CT * RCT_{﹪}/100} $$
When θ1rly is positive, θSH from eq. (1) is the maximum value for θSH2 (Figure 2) at which the relay in the protector connected to the faulted feeder will detect the fault. Angle θSH2 must be less than θSH obtained from eq (1) to assure reliable fault detection. When θ1rly is negative, shift angle θSH from eq (1) is the angle where the sensitive trip characteristic of the relay in the protector fed from the unfaulted feeder is satisfied. Angle θSH1 (Figure 2) for the NP relay must be less than angle θSH from eq (1) to assure that the protector fed from the unfaulted primary feeder does not trip.
Power Based Trip Characteristic
Two algorithms for power-based relays are evaluated to determine allowed trip-curve shift angles. They are similar, where one calculates the net real and net reactive powers in the network protector using the actual voltage magnitudes at the protectors, and the other does the calculations with the nominal voltage magnitude. Figure 3 shows the relay sensitive trip curve in the P-Q plane.

Figure 3:
P-Q plane for defining power-based trip characteristics
and algorithms.
In both cases the actual current magnitudes and actual angles between the currents and network phase-to-ground voltages are used. The convention is that vars into the network are “+Q”, and vars from the network back towards the primary are “-Q”. PSET in Figure 3 is the three-phase real power corresponding to the sensitive reverse current trip setting, RCT%, in percent of CT rating, and VNOM is the nominal phase-to-ground voltage, normally either 125 volts or 277 volts.
(3) $$ \ \ \ P_{SET} = 3V_{NOM} \frac{RCT_{﹪}}{100} CT watts $$
The trip curve consists of two straight-line segments, one in quadrant 2, having shift angle θSH2, and the second in quadrant 3-4, having shift angle θSH1, with the positive direction for both shift angles being counter clockwise.
For the first trip algorithm, the relay calculates the net three-phase real power and reactive power in the protector in accordance with the conventions of Figure 3, shown as
(4) $$ \ \ \ P_{NET} \sum_{i=A}^{i=C} \text{RE}(V_{iN} I_{i}^*) $$
(5) $$ \ \ \ Q_{NET} \sum_{i=A}^{i=C} \text{lm}(V_{iN}I_{i}^*) $$
In eq (4) and eq (5), ViN and Ii* are network phase “i” line-to-ground voltage and the complex conjugate of the protector phase current, both being complex numbers. The sign of both PNET and QNET can be either “+” or “-“. The reference direction for the current in each phase of the NP is into the network for calculation of PNET and QNET. If the point defined by PNET and QNET lies on or to the left of the sensitive trip curve in Figure 1, the sensitive trip characteristic is satisfied.
Given PNET and QNET, recognizing sign conventions of Figure 3, and that PSET is a positive number as in eq (3), the trip curve shift angle θSH where the P-Q point just lies on the trip curve is given by:
(6) $$ \ \ \ \theta_{SH} = a \tan{\frac{P_{NET} + P_{SET}}{Q_{NET}}} $$
It can be shown that the P-Q point will lie to the left of the sensitive trip curve if he following inequality is satisfied.
(7) $$ \ \ \ \sum_{i=A}^{i=C}(V_{iMAG}I_{iMAG} \cos{(\theta_{li} - \theta_{Vi} - \theta_{SH})}) \lt - P_{SET} \cos{\theta_{SH}} $$
In eq (7), ViMAG is the magnitude of phase”i” voltage, IiMAG is the magnitude of phase “i” current, θIi is the angle of phase “i” current, and θVi is the angle of phase “i” voltage. The sign before PSET on the right side is negative.
For the second power trip algorithm, the relay calculates PNET-NOMINAL and QNET-NOMINAL in accordance with eq (8) and eq (9). This is the algorithm for the NP relay described in [2].
(8) $$ \ \ \ P_{NET-NOMINAL} = \sum_{i=A}^{i=C} \text{RE} (V_{iN}I_{i}^* \frac{V_{NOM}}{iMAG})$$
(9) $$ \ \ \ Q_{NET-NOMINAL} = \sum_{i=A}^{i=C} \text{lm}(V_{iN}I_{i}^* \frac{V_{NOM}}{iMAG})$$
This power trip algorithm calculates the P-Q point using the angle between the network line-to-ground voltage and protector current, the magnitude of the protector current, but the nominal voltage magnitude rather than the magnitudes of the network actual line-to-ground (neutral) voltages.
Required Trip Curve Angle for SLG Faults
Y-Y Network Transformers
For the SLG fault with the blown fuse in the faulted phase, and Y-Y network transformers, the maximum shift angle where the NP relay in the protector on the faulted feeder just detects the fault, θSH2, is plotted in Figure 4 vs the X to R ratio of the network transformers, for a network load of 1000 kVA (solid curves) and 100 kVA (dashed curves). The blue-colored curves are for the sequenced based relay. The green- and red-colored curves are respectively for the power-based relay that use the nominal voltage and actual voltage magnitudes for the P-Q point.
Network transformer X to R ratio, and network load have a significant effect on relay trip curve angle θSH2 needed for fault detection. Angle θSH2 must be less than the value given by the curves in Figure 4 to detect the fault. Figure 5 plots the maximum shift angle, θSH2, vs network load where the relay just detects the SLG fault with blown fuse, for a network transformer X to R ratio of 13, worst case. This shows there is not much difference between the sequence-based relay (blue-colored curve) and power-based relay (green-colored curve) that uses the nominal voltage in the P-Q calculation.
From Figure 5, shift angle θSH2 of a power-based relay that calculates P and Q with actual voltage magnitudes must be considerably less than that required for the other algorithms, when the network transformer X to R ratio is 13. Also, with angle θSH2 of +5o, as used in the past in some relays, the SLG fault with blown fuse will not be detected in systems with high X to R network transformers.

Figure 4:
Faulted unit maximum shift angle, θSH2, at
which a SLG fault is detected, vs network transformer X to R ratio. YY
network transformers.

Figure 5:
Faulted unit maximum shift angle, θSH2, at
which a SLG fault is detected, vs network load, network transformer X/R
= 13, YY connections.
Delta Wye Network Transformers
Figure 6 and Figure 7 plot the maximum value for shift angle θSH2 for the NP relay in the protector connected to the faulted feeder, for the same conditions as in Figures 4 and 5, except that the network transformers have the delta wye connections.

Figure 6:
Faulted unit maximum shift angle, θSH2, at
which a SLG fault is detected, vs network transformer X to R ratio.
delta wye network transformers.

Figure 7:
Faulted unit maximum shift angle, θSH2, at
which a SLG fault is detected, vs network load, Network transformer X/R
= 13, delta wye connections.
In the two-unit spot network, it is equally important that the trip criteria for the relay in the protector supplied from the unfaulted primary feeder is not satisfied. With reference to either Figure 2 or Figure 3, if shift angle θSH1 is too large, the NP connected to the unfaulted feeder trips. Figure 8 plots, for spot networks with YY network transformers, shift angle θSH1 at which the NP fed from the unfaulted feeder trips. To prevent tripping, shift angle θSH1 must be less than the value given on the curves. Figure 9 is for the same conditions as in Figure 8, except it applies for spot networks with delta wye network transformers.
From either Figure 8 or 9 giving shift angle θSH1, as network load decreases, it is more likely that a NP fed from the unfaulted primary feeder will trip, incorrectly. In contrast, under light load, shift angle θSH2 at which the relay in the NP for the faulted feeder can detect the SLG fault with blown fuse increases, with either the wye-wye or delta wye network transformer connections.

Figure 8:
Unfaulted unit shift angle, θSH1, at which
the sensitive trip is satisfied, versus network transformer X to R
ratio, *YY* network transformers.

Figure 9:
Unfaulted unit shift angle, θSH1, at which
the sensitive trip is satisfied vs network transformer X to R ratio,
delta wye network transformers.
Required Trip Curve Angles for LL Faults
Ungrounded line-to-line (LL) faults in shielded cable circuits are rare, but they do occur in overhead circuits. Considered first is the LL fault between the tap circuit fuses and the network transformer, with the fuses in both faulted phases blown as in Figure 10. System parameters for determining the maximum shift angles, θSH2 and θSH1, for the NP relays in protectors fed by the faulted and unfaulted primary feeders respectively are the same as for the SLG fault conditions.
YY Network Transformers
For a two-unit spot network having the wye-wye connected network transformers, Figure 11 plots the maximum shift angle θSH2, at which the LL fault with two blown fuses is detected for network loads of 100 and 1000 kVA, vs network transformer X to R ratio. A comparison of these curves with those in Figure 4 for the SLG fault shows that, under heavy load conditions (1000 kVA), the LL fault will be detected when the relay has a larger shift angle. Figure 12 shows the value for θSH1 at which the unit fed from the unfaulted feeder trips vs network transformer X to R. Angle θSH1 must be less than this value to prevent tripping of the network protector on the unfaulted primary feeder.

Figure 10:
Ungrounded LL fault with two blown fuses in faulted
phases.

Figure 11:
Faulted unit maximum shift angle θSH2 at
which LL fault can be detected, vs network transformer X to R ratio,
YY network transformers.

Figure 12:
Unfaulted unit shift angle θSH1 at which the
sensitive trip is satisfied vs network transformer X to R ratio, *YY*
network transformers, LL fault.
Should the LL fault blow the primary fuse in just one primary phase as shown in Figure 13, whether the NP relay in the faulted and unfaulted unit responds correctly depends upon the phase with the blown fuse.
With the blown fuse in the leading phase as in the top half in Figure 13, the relays respond correctly. Table 2 lists in the second column, for the protector connected to the faulted feeder, the angle, θ1rly, by which the positive-sequence current leads the positive-sequence voltage as defined in Figure 2. The positive-sequence current lies well within the trip zone for typical values of relay shift angle θSH2 (-5o < θSH2 < +5o). With reference to Figure 3, the third and fourth columns of Table 2 list the P and Q values for a relay that calculates using the actual voltage magnitudes, and the fifth and sixth columns list the P and Q values for a relay which calculates using the nominal voltage magnitude. From these it is clear the power-based relays will detect the fault condition in the top-half in Figure 13, where the blown fuse is in the “leading” faulted phase.

Figure 13:
Ungrounded LL fault with blown fuse in just one phase.
Table 2:
NP relay parameters for NP connected to faulted feeder 2,
LL fault with blown fuse in leading phase, 1000 kVA load, 85% PF
Nwk Xfr X/R |
θ1rly (Deg) |
P&Q Actual Volts |
P&Q Nominal Volts |
||
|---|---|---|---|---|---|
MW |
MVAr |
MW |
MVAr |
||
6 |
138.84 |
-2.081 |
+0.350 |
-4.458 |
+0.830 |
13 |
133.92 |
-2.066 |
+0.175 |
-4.469 |
+0.477 |
Table 3 gives the same information as Table 2, except it applies to NP relays in the protector fed from the unfaulted primary feeder (blown fuse in leading phase). The relays in the NP fed from the unfaulted feeder will not make their trip contact for selectable values of trip curve shift angle θSH1 (-5o < θSH1 <+5o).
Table 3:
NP relay parameters for NP connected to unfaulted feeder
1, LL fault with blown fuse in leading phase, 1000 kVA load, 85% PF
Nwk Xfr X/R |
θ1rly (Deg) |
P&Q Actual Volts |
P&Q Nominal Volts |
||
|---|---|---|---|---|---|
MW |
MVAr |
MW |
MVAr |
||
6 |
-39.92 |
2.658 |
+0.008 |
5.133 |
-0.411 |
13 |
-44.20 |
2.647 |
+0.185 |
5.146 |
-0.058 |
But with the open phase in the lagging phase as on the bottom half in Figure 13, the protector connected to the unfaulted feeder will trip for the L-L fault. Table 4 lists the relay parameters for the unit connected to the faulted feeder, unit 2 in Figure 13. For normal shift angles for the trip curves, θSH2, neither the sequence based or power-based relays in the protectors on the faulted feeder will detect the LL fault with blown fuse in the lagging phase.
But the NP relays in the protector supplied from the unfaulted feeder, feeder 1 in Figure 13, both the sequence and power-based relays, as shown by the data in Table 5, will make their trip contacts for typical shift angles (-5o < θSH1 <+5o), (-5o < θSH2 < +5o) and the NP supplied from the unfaulted primary feeder will trip, incorrectly.
Table 4:
NP relay parameters for NP connected to faulted feeder 2,
LL fault with blown fuse in lagging phase, 1000 kVA load, 85% PF
Nwk Xfr X/R |
θ1rly (Deg) |
P&Q Actual Volts |
P&Q Nominal Volts |
||
|---|---|---|---|---|---|
MW |
MVAr |
MW |
MVAr |
||
6 |
58.07 |
2.625 |
-0.584 |
5.066 |
-1.058 |
13 |
53.47 |
2.708 |
-0.411 |
5.177 |
-0.710 |
Table 5:
NP relay parameters for NP connected to unfaulted feeder
1, LL fault with blown fuse in lagging phase, 1000 kVA load, 85% PF
Nwk Xfr X/R |
θ1rly (Deg) |
P&Q Actual Volts |
P&Q Nominal Volts |
||
|---|---|---|---|---|---|
MW |
MVAr |
MW |
MVAr |
||
6 |
-113.90 |
-2.047 |
+0.943 |
-4.389 |
+1.477 |
13 |
-118.49 |
-2.130 |
+0.770 |
-4.501 |
+1.129 |
The fault in Figure 13 occurred at one utility. In an overhead line with vertical construction, a tension splice failed, creating first just an open phase. Then the conductor on the load-side end made contact with a lower phase conductor. Fortunately, the open was in the leading phase and the NP relays responded correctly. For the condition in Figure 13, the currents in the source feeder with LL fault and blown fuse generally are not high enough to trip the station breaker. When the network transformers have the delta wye connections, rather than the wye-wye connections, the response is similar for the sequence and power-based relays when the transformers have the wye-wye connections.
Delta Wye Connected Network Transformers
Figures 14 and 15 plot the shift angles for the LL fault with two blown fuses vs network transformer X to R ratio for the faulted and unfaulted unit respectively, when the network transformers have the delta connected primary windings.

Figure 14:
Faulted unit maximum shift angle θSH2 at
which LL fault can be detected, vs network transformer X to R ratio, two
blown fuses, delta wye connections.
From Figure 14, with a shift angle θSH2 of +5 degrees, detecting the LL fault with two blown fuses may be marginal with high X to R ratio network transformers. From Figure 15, with shift angle θSH1 being +5 degrees, there is a possibility that the NP connected to the unfaulted primary feeder might trip under light-load conditions when the network transformers have a high X to R ratio. The default shift angles in some early microprocessor relays were +5 degrees (trip-tilt angle of 95o).

Figure 15:
Unfaulted unit shift angle θSH1 for LL fault
at which the sensitive trip is satisfied vs X to R ratio, DY network
transformers, two blown fuses.
Required Trip Curve Angle for DLG Faults
With a double line-to-ground (DLG) fault downstream of the fuses in the system of Figure 1, the fuses in both faulted phases blow. After both blow, the NP relay in the unit connected to the faulted feeder must detect the fault. When the network transformers have the YY connections, Figure 16 shows the maximum shift angle, θSH2, at which the fault can be detected. And the unit connected to the unfaulted primary feeder must not trip. Figure 17 shows the shift angle, θSH1, at which the unit connected to the unfaulted feeder makes its trip contact. The setting for shift angle θSH1 must be less than shown in Figure 17.

Figure 16:
Faulted unit maximum shift angle θSH2 at
which DLG fault can be detected, vs network transformer X to R ratio,
YY network transformers, two blown fuses.
Low-loss network transformers are desirable from an energy loss standpoint, but they have high X to R ratios, making more demanding requirements on the NP relays.
Although the DLG fault blows the fuse in both faulted phases, one fuse blows first, with the time for the second fuse to blow determined by the available currents, fuse pre-loading, and the fuse time-current characteristics. With one fuse blown, it can be in either the leading or lagging phase.
Until the second fuse blows, it is important that the NP connected to the unfaulted feeder doesn’t trip. With the blown fuse in the leading phase as on the top half of Figure 18, both the sequence based and power-based relays respond correctly, as shown by the quantities listed in Table 6 for the protector connected to the faulted primary feeder, and in Table 7 for the protector connected to the unfaulted primary feeder.

Figure 17:
Unfaulted unit shift angle θSH1 for DLG
fault at which the sensitive trip is satisfied vs X to R ratio, YY
network transformers, two blown fuses.

Figure 18:
DLG fault with blown fuse in just one phase
Table 6:
NP relay parameters for NP connected to faulted
feeder 2, DLG fault with blown fuse in leading phase, 1000 kVA load, 85%
PF, YY network transformers.
Nwk Xfr X/R |
θ1rly (Deg) |
P&Q Actual Volts |
P&Q Nominal Volts |
||
|---|---|---|---|---|---|
MW |
MVAr |
MW |
MVAr |
||
6 |
109.08 |
-0.781 |
-1.251 |
-1.267 |
-4.264 |
13 |
104.05 |
-0.650 |
-1.329 |
-0.871 |
-4.376 |
Table 7:
NP relay parameters for NP connected to unfaulted
feeder 1, DLG fault with blown fuse in leading phase, 1000 kVA load, 85%
PF, YY network transformers.
Nwk Xfr X/R |
θ1rly (Deg) |
P&Q Actual Volts |
P&Q Nominal Volts |
||
|---|---|---|---|---|---|
MW |
MVAr |
MW |
MVAr |
||
6 |
-66.55 |
1.176 |
1.496 |
1.777 |
4.580 |
13 |
-71.09 |
1.047 |
1.575 |
1.382 |
4.693 |
From the data of Table 8 (blown fuse in lagging phase), if the network relays have a straight-line trip characteristic with θSH2 and θSH1 both set to either +5 degrees, or 0 degrees, as in early versions of some microprocessor relays, the NP connected to the faulted feeder (Table 8) would not trip. From Table 9, with both θSH2 and θSH1 set to +5 degrees, the sequence-based relay, and power-based relay using actual voltage magnitude for the P-Q calculation in the protector connected to the unfaulted feeder would trip. The power-based relay using nominal voltage for the P-Q calculation may or may not trip, depending on transformer X to R ratio and θSH1 setting.
Table 8:
NP relay parameters for NP connected to faulted
feeder 2, DLG fault with blown fuse in lagging phase, 1000 kVA load, 85%
PF, YY network transformers.
Nwk Xfr X/R |
θ1rly (Deg) |
P&Q Actual Volts |
P&Q Nominal Volts |
||
|---|---|---|---|---|---|
MW |
MVAr |
MW |
MVAr |
||
6 |
84.94 |
0.650 |
-1.514 |
0.089 |
-4.513 |
13 |
80.02 |
0.800 |
-1.478 |
0.502 |
-4.519 |
Table 9:
NP relay parameters for NP connected to unfaulted
feeder 1, DLG fault with blown fuse in lagging phase, 1000 kVA load, 85%
PF, YY network transformers.
Nwk Xfr X/R |
θ1rly (Deg) |
P&Q Actual Volts |
P&Q Nominal Volts |
||
|---|---|---|---|---|---|
MW |
MVAr |
MW |
MVAr |
||
6 |
-88.80 |
-0.252 |
1.760 |
0.421 |
4.829 |
13 |
-93.45 |
-0.402 |
1.725 |
0.0087 |
4.836 |
When the fuse in the lagging phase is blown for the DLG fault, the shift angle for the relay in the protector connected to the faulted feeder, needed to detect the fault, θSH2, is listed in columns 2, 3, and 4 of Table A3-10. From the second, third, and fourth columns, shift angle θSH2 for all relays must be negative in unit 2 to detect the fault. And in the NP connected to the unfaulted feeder, it is possible that the relay would trip the protector, depending on particulars.
The NP relays respond properly for the DLG and LL faults after the fuses in both faulted phases blow. Thus, the likelihood of the protector connected to the unfaulted feeder tripping can be eliminated if the NP relay trip time is greater than the time for the HV fuses to blow in both faulted primary phases.
Table 10:
Maximum shift angle at which relay in backfeeding unit
detects fault (θSH2) and limit on shift angle
(θSH1) in unfaulted unit to prevent tripping. DLG fault with
blown fuse in lagging phase. Sensitive trip setting of 0.15% of CT
rating, YY network transformers.
| X/R | Backfeeding NP # 2 θSH2 (deg) |
Forward NP #1 θSH1 (deg) |
||||
|---|---|---|---|---|---|---|
“+” Seq |
PWR actual |
PWR Nom. |
“+” Seq |
PWR actual |
PWR nom |
|
| 6 | -5.09 | -22.3 | -1.16 | 1.22 | -8.10 | 5.01 |
| 13 | -10.0 | -28.5 | -6.37 | -3.42 | -13.0 | 0.127 |
In relays where shift angles θSH2 and θSH1 are adjustable, settings may be available to allow proper operation of both protectors for specific situations. With these angles set to -5 and +5 degrees respectively, correct response occurs for most faults.
Summary and Conclusions
Trip curve shift angles, θSH2 and θSH1, are defined in Figure 2 and Figure 3. Parameters impacting the shift angles for proper NP operation during simultaneous fault and blown fuse conditions are network load, and X to R ratio of the network transformers. The shift angle required to detect the fault and blown fuse conditions practically are the same with the sequence-based relay, and power-based relay which calculates the P-Q point with nominal voltages. But for the power-based relay that calculates the P-Q point using actual voltage magnitudes, shift angle θSH2 must be smaller to detect the fault.
In commercially available microprocessor relays, for the “watt” trip characteristic shift angle θSH2 can be set as high as +5 degrees. From the work reported herein, such a setting would not detect many simultaneous fault conditions, especially with high X to R ratio network transformers and heavy network loads. The relay of [1] has θSH2 fixed at -5 degrees, and with the relays of [2] and [3] the smallest setting for θSH2 is also -5 degrees. When the relay “watt-var” trip charcteristic is selectd, θSH2 can be set lower than -5 degrees. A setting of -10 to -15 degrees will reliably detect the simultaneous faults.
During unfaulted conditions, it is desired that shift angle θSH2 be as large as possible, and shift angle θSH1 be as small as possible. This allows NP’s in two-unit spot networks to remain closed down to very low loads on the spot network. Further, angle θSH1 must be large enough such that the relay will reliably detect capacitive backfeeds, yet small enough so that the NP on the unfaulted feeder will not trip. In early microprocessor relays having θSH2 = +5o, detecting high current backfeeds to multi-phase faults on the primary was marginal. Sequence and power-based network relays are available with trip-curve angle settings to give reliable fault detection [1], [2], [3].
Appendix A3-a
Voltages and currents for the system of Figure 1 were found by analyzing the three sequence networks, with interconnections for the blown fuse(s), and for the shunt fault, either SLG, LL, or DLG. Figure 19 shows the sequence networks for the system in Figure 1, with a SLG fault on any phase, and a blown fuse in any primary phase, with Y-Y network transformers. Ideal transformers with ratios 1 to C1, and 1 to C2, interconnecting the sequence networks represent the constraints for an open in any one phase. Ideal transformers with ratios of 1 to K1, 1 to K2, and 1 to 1 interconnecting the sequence networks represent the SLG fault. Table A3-11 lists values for C1, C2, K1, and K2 as a function of the phases involved.
Table 11:
Constraint constants for open in any one phase and SLG
fault on any phase
Constant |
Open Phase |
Shorted Phase |
||||
|---|---|---|---|---|---|---|
A |
B |
C |
A |
B |
C |
|
C1 |
1 |
a2 |
a |
---- |
---- |
---- |
C2 |
1 |
a |
a2 |
---- |
---- |
---- |
K1 |
---- |
---- |
---- |
1 |
a2 |
a |
K2 |
---- |
---- |
---- |
1 |
a |
a2 |
In Table 11:
a = ej120
a2 = e-j120
In Figure 19, Z1S and Z0S are the positive-and zero-sequence impedances representing the substation feeding the two primary feeders. Impedance Z1BR and Z0BR are the sum of the positive- and zero-sequence impedances respectively for the OH feeder, the cable circuit, and the network transformer of circuit 1, reflected to the HV side of the transformer. Impedance Z1FDR2 and Z0FDR2 are the sequence impedances of OH circuit 2 from the substation to the fuse (fault) location in Figure 1. Impedances Z1BR2 and Z0BR2 are the sum of the sequence impedances of circuit 2 cable and network transformer 2, reflected to the primary side of the network transformer. Network load is represented by sequence impedances Z1L, Z2L, and Z0L. When the network transformers have the delta connected primary, Z0BR1 and Z0BR2 are infinite.

Figure 19:
Interconnected sequence networks for a SLG fault with a
blown fuse in any one phase, YY network transformers.
4.20 - Appendix 4
Appendix 4
TRANSFORMER THRU FAULT PROTECTION
In Network Unit Equipment, in Figure 76 were time-current curves showing the through-fault protection provided to a 500 kVA 216-volt network transformer during backfeed by several different types of network protector fuses that would be in a 1600 or 1875 ampere network protector. This appendix contains time-current curves that show the through fault protection provided to 480-volt network transformers with silver-sand protector fuses, either the Eaton NPL fuse or the Richards 317 fuse. Also contained are curves showing the through fault protection provided with the type Y or Z network protector fuses.
Silver Sand Network Protector Fuse Transformer Through-Fault Protection
Table 1 lists in the first column the size 480-volt network transformers for which curves showing through fault protection are included, as well as for each size transformer, the Eaton and Richards silver-sand fuse in the protector.
Table 1:
Silver-sand fuse sizes for evaluating through-fault
protection to 480-volt network transformers.
Network Transformer Size (kVA) |
Eaton NPL Fuse Size (A) |
Richards 317 Fuse Size (A) |
|---|---|---|
| 500 | 800 | 800 |
| 750 | 1200 | 1200 |
| 1000 | 1600/1875 | 1875 |
| 1500 | 2500/2825 | 2825 |
| 2000 | 3000 | 3000 |
| 2500 | 3750 | --- |
Figure 1 shows the protection provided to the 500 kVA 480-volt network transformer with the Eaton 800 A fuse, blue-colored curve, and the Richards 800 A protector fuse, the green-colored curve. The approximate time at which the two fuse curves intersect with the transformer through-fault protection curve, shown in red, are labeled. As long as the backfeed current with a stuck-closed protector is above the intersect point between the fuse curve and the transformer protection curve, the fuse would be assumed to protect the transformer. Also shown with the vertical dashed black lines are the backfeed currents for a three-phase fault on the primary with the faulted feeder breaker open, for two-, three-, and four-unit spot networks The right-most vertical dashed black line show the maximum through fault current for a fault on the secondary, assuming an infinite bus on the HV side of the network transformer.
Figure 2 shows the through-fault protection for the 750 kVA 480-volt network transformer, and gives the time at which the fuse curves intersects the transformer through-fault protection curve, as well as the maximum backfeed current for two-, three-, and four-unit spot networks with 750 kVA network transformers. As indicated in Network Unit Equipment, the higher the backfeed currents the more likely that the protector fuse will protect the network transformer should the protector fail to open. This is especially important for utilities who will apply a three-phase ground to the primary feeder if the feeder is live on backfeed.

Figure 1:
Through-fault protection for 500 kVA 480-volt network
transformer with silver-sand fuses.

Figure 2:
Through-fault protection for 750 kVA 480-volt network
transformer with silver-sand fuses.
Figure 3 shows the through-fault protection provided to the 1000 kVA 480-volt network transformer with the 1875 ampere network protector fuses. Also plotted with the vertical black dashed lines are the maximum backfeed currents in two-, three-, and four-unit spot networks, assuming an infinite bus at the HV terminals of the network transformers on the unfaulted primary feeders.

Figure 3:
Through-fault protection for 1000 kVA 480-volt network
transformer with silver-sand fuses.
Figure 4 applies for a 1500 kVA network transformer with the network protector having 2825 ampere network protector fuses. Notice from the curves in Figure 3 and 4 that the Eaton NPL fuse intersects the network transformer through fault protection curve at a lower current than the Richards (ETI) 317 fuse, although the difference is not that great. Also shown in these curves is the maximum backfeed current for a three-phase fault on the primary feeder with the feeder breaker open, for two-, three-, and four-unit spot networks.
Figure 5 applies for the 2000 kVA network transformer with the network protector having 3000 ampere silver-sand protector fuses.
The fuse curve and the network transformer through-fault protection curve for the 2500 kVA transformer are given in Figure 6. The fuse applied is the type NPL rated 3750 amperes. At the time this document was prepared, Richards did not list a silver-sand fuse rated 3750 amperes. However, most likely a Ferraz Shawmut fuse rated 4000 amperes could be used on a 2500-kVA 480-volt transformer.

Figure 4:
Through-fault protection for 1500 kVA 480-volt network
transformer with silver-sand fuses.

Figure 5:
Through-fault protection for 2000 kVA 480-volt network
transformer with silver-sand fuses.

Figure 6:
Through-fault protection for 2500 kVA 480-volt network
transformer with silver-sand fuses.
Table 1 lists the currents at which the Eaton NPL and Richards 317 silver-sand fuse curves intersect the transformer protection curve for 480-volt transformers, given by the curves in Figures 1 through 6. If the backfeed current for the three-phase fault exceeds the value given in Table 1, the fuse protects the transformer should the protector fail to open. For backfeed to the DLG fault, the protection analysis is more complex. As discussed in the text, during backfeed to the DLG fault, the current in one phase practically is the same as the current for a three-phase fault, and the current in the other two phases is approximately 50% of that for a three-phase fault. Further, following blowing of the fuse which sees the same current as for the three-phase fault, the current in the two phases which had the 50% value decreases to a lower value.
Table 1:
Intersect current for silver-sand fuse curve and network
transformer through fault protection curve, 480-volt transformers.
Size (kVA) |
Eaton NPL Fuse | Richards 317 | ||
|---|---|---|---|---|
Size (A) |
Intersect Current (kA) |
Size (A) |
Intersect Current (kA) |
|
| 500 | 800 | 3.7 | 800 | 4.5 |
| 750 | 1200 | 6.1 | 1200 | 6.8 |
| 1000 | 1600/1875 | 8.8 | 1875 | 11.9 |
| 1500 | 2500/2500 | 13.3 | 2825 | 18.5 |
| 2000 | 3000 | 14.5 | 3000 | 15.6 |
| 2500 | 3750 | 16.5 | ----- | |
Y and Z Copper Fuse and Alloy Fuse Transformer Through-Fault Protection
Given in this section of Appendix 4 are curves showing the through-fault protection provided by the Y and Z copper fuses, and the alloy fuse for the 480-volt network transformers applied in spot networks. From these curves, it is seen that the Y and Z copper fuses provide better through-fault protection to the network transformer than silver-sand fuses should the backfeeding protector fail to open. With the Y and Z copper fuses, the current where the protector fuse curve intersects with the transformer through-fault protection curve is lower than with the silver-sand fuses.
The curves for the alloy fuse are plotted from the referenced Westinghouse fuse curves, where they apply for a 40o C vault ambient with a 100 percent preload on the fuse. At lower ambient and no preload, the alloy fuse times are higher than shown on the following curves.
Figure 7 shows the through-fault protection provided a 500 kVA 480-volt network transformer with the Y 11 copper fuse with the blue-colored curve, and with the 800-ampere alloy fuse with the solid green-colored curve. The solid green curve applies for a vault ambient of 40o C, and 100% preload. The alloy fuse curve plotted with the dotted green curve is an attempt to show the maximum time for the alloy fuse when there is no preload on the protector, and the protector has an open or ventilated enclosure.

Figure 7:
Through-fault protection for 500 kVA 480-volt
transformer with copper and alloy fuses.
From the GE curve for the alloy fuse given in Figure 77 of Network Unit Equipment, the current needed to melt the fuse at no preload and a 25oC ambient to that required to melt at a 40oC ambient in a submersible unit with full-load preload varied depending on time. At 100 seconds, the ratio ranged between about 1.6 and 1.9. At a time of 10 seconds, the ratio ranged between about 1.7 and 2.1. The fuse curve plotted with the dotted-green-colored curve is that of the solid-green colored curve, shifted to the right by a factor of 1.75.
From Figure 7, the Y 11 copper fuse provides good through fault protection to the transformer, intersecting the transformer through-fault protection curve at 350 seconds. At the maximum backfeed current in a two-unit spot network, about 6.0 kA, the Y 11 fuse clearing time is less than 2 seconds. The alloy fuse with a 40oC vault ambient and 100% preload intersects the protection curve at about 600 seconds. But with no preload, the intersection occurs at about 55 seconds. However, at the maximum backfeed current to a three-phase fault in a two-unit spot network, 6 kA, the alloy fuse with no preload will protect the network transformer. If the backfeed were to a double line-to-ground fault, the current in a two-unit spot network in two of the phases is just 3.0 kA, half of that for backfeed to a three-phase fault. At 3 kA backfeed, is about where the alloy fuse curve with no preload intersects the transformer protection curve. The protection the alloy fuse provides the transformer is clearly dependent on the preload and vault ambient prior to the backfeed.
Figure 8 shows the protection provided to the 750-kVA 480-volt network transformer with the solid-blue curve for the Y 15 copper fuse, and the 1200 ampere alloy fuse with the solid and dotted green-colored curve. For backfeed to a DLG fault in a two-unit spot network, the current in two-phases is about 4.5 kA. The Y 15 copper fuse provides through fault protection at this current, but the alloy fuse with no preload (dotted green colored curve) lies slightly above the 750 kVA through-fault protection curve at 4.5 kA.
Figure 9 shows the protection provided to the 1000-kVA 480-volt network transformer with the solid-blue curve for the Y 22.5 copper fuse, and both the 1600 ampere alloy fuse with the solid and dotted green-colored curves, where the dotted green curve is an estimate of the fuse characteristic at 25oC vault ambient and no preload. Shown with the dashed orange colored curve is the characteristic of the 2000 ampere alloy fuse with 100% preload and a 40oC vault ambient. Clearly the best protection is provided with the Y22.5 copper fuse.
Figure 10 shows the protection provided to the 1500-kVA 480-volt network transformer with the solid blue-colored curve for the Y 25 copper fuse, and both the 2000 ampere alloy fuse with the solid and dotted green-colored curves, where the dotted green-colored curve is an estimate of the fuse characteristic at 25oC vault ambient and no preload. Shown with the dashed orange colored curve is the characteristic of the 2500 ampere alloy fuse with 100% preload and a 40oC vault ambient. Clearly, as with the smaller size network transformers, the best protection is provided with the Y 25 copper fuse.

Figure 8:
Through-fault protection for 750 kVA 480-volt
transformer with Y 15 copper and alloy fuses.

Figure 9:
Through-fault protection for 1000 kVA 480-volt
transformer with Y 22.5 copper and alloy fuses.

Figure 10:
Through-fault protection for 1500 kVA 480-volt
transformer with Y 25 copper and alloy fuses.
Figure 11 shows the protection provided to the 2000-kVA 480-volt network transformer with the solid blue-colored curve for the Z 37.5 copper fuse, and both the 2500 ampere alloy fuse with the solid and dotted green-colored curves, where the dotted green curve is an estimate of the fuse characteristic at 25oC vault ambient and no preload. Shown with the dashed orange colored curve is the characteristic of the 3000-ampere alloy fuse with 100% preload and a 40oC vault ambient. Clearly the best protection is provided with the Y25 copper fuse.
Figure 12 shows the protection provided to the 2500-kVA 480-volt network transformer with the solid blue-colored curve for the Z 50 copper fuse, and the 3500 ampere alloy fuse with the solid and dotted green-colored curves, where the dotted green curve is an estimate of the fuse characteristic at 25oC vault ambient and no preload. Clearly the best protection is provided with the Y25 copper fuse.
Table 2 lists the currents at which the Y, Z, or alloy fuse curve intersects the transformer protection curve for 480-volt transformers, read from the curves in Figures 7 through 11. If the backfeed current for the three-phase fault exceeds the value given in Table 2, the fuse protects the transformer should the protector fail to open. For backfeed to the DLG fault, the protection analysis is more complex. As discussed in the text, during backfeed to the DLG fault, the current in one phase practically is the same as the current for a three-phase fault, and the current in the other two phases is 50% of that for a three-phase fault. But after the fuse which sees the same current as that for a three-phase fault blows, the current in the fuses which saw the 50% current decreases even further.
A comparison of the intersect currents with the Y or Z fuse as given in Table 2 with those given in Table 1 for the silver-sand network protector fuses shows the intersection currents with the transformer protection curve are much lower with the Y and Z fuses.

Figure 11:
Through-fault protection for 2000 kVA 480-volt
transformer with Y 37.5 copper and alloy fuses.
Table 2:
Intersect current for Y, Z, or alloy fuse curve and
network transformer through fault protection curve, 480-volt
transformers.
| KVA | Y or Z Fuse |
Alloy Fuse 1 |
Alloy Fuse 2 |
|||
|---|---|---|---|---|---|---|
Size (A) |
Inter- sect Current. (kA) |
Size (A) |
Inter- Sect Current (kA) |
Size (A) |
Inter sect Current (kA) |
|
| 500 | Y11 | 1.75 | 800 | 1.5 | ||
| 750 | Y15 | 2.40 | 1200 | 2.15 | ||
| 1000 | Y22.5 | 3.10 | 1600 | 3.1 | 2000 | 6.05 |
| 1500 | Y25 | 3.85 | 2000 | 3.85 | 2500 | 10.2 |
| 2000 | Z37.5 | LT 5.0 | 2500 | 5.40 | 3000 | 12.5 |
| 2500 | Z50 | 6.85 | 3500 | 7.90 | ||
Although the Y and Z fuses provide better through-fault protection than the silver sand fuses, it must be recognized that there are other areas to consider. The silver-sand fuses have a much higher interrupting rating, which can be important if a fault occurs inside the network protector main enclosure, with the fuses mounted externally to the main enclosure. With the Y and Z fuses, mounted internal to the protector, the fuses generate significant heat. As discussed in Network Unit Equipment, this is why Con Edison of New York worked with Chase Shawmut to develop the low loss type S fuse. Of course, the losses with the alloy fuse are less than those of the Y or Z fuse, allowing the protector to run cooler than with the copper fuses. But the melting time of the alloy fuses is strongly affected by not only the vault ambient, but also by the preload. The melting time with no preload and a 25oC vault ambient can be much greater than that with a 40oC vault ambient and 100% preload, for which the fuse time-current curves are given.

Figure 12:
Through-fault protection for 2500 kVA 480-volt
transformer with Z 50 copper and alloy fuses.
4.21 - Appendix 5
APPENDIX 5
NETWORK RELAY RESPONSE FOR ROLLED AND CROSSED PHASES
In secondary network systems with dedicated primary feeders, the only protective device for each primary feeder is the circuit breaker at the substation and its phase and ground overcurrent relays. Faults on the primary feeder or in the network transformers result in opening of all three phases of the feeder at the substation, followed by opening of all network protectors associated with the faulted primary feeder.
If work is done on a primary feeder to replace a section of cable between two manholes, with all network protectors open, but if phases are rolled or crossed, when the feeder is re-energized by closing the feeder breaker at the substation, the network protectors will not auto close. The response of the network relays at an open protector with rolled or crossed phases is discussed in detail in Rolled and Crossed Phase Phasing Voltages
The probability of an open network protector auto closing is extremely low with rolled or crossed phases on the primary feeder. However, one way that the system could be energized with rolled or crossed phases in one feeder is if the system was de-energized (network dropped) and work had been done on a primary cable. If the system were then re-energized by simultaneous closing of all feeder breakers at the substation, the response of the network relays in protectors on the feeder with the rolled or crossed phases, and on the other feeder with correct phasing is needed.
The system of Figure 1 will be used to investigate the response of the sequence-based and power-based network relays to the rolled and crossed phases. This is the same system used in Appendix 3 to examine the network relay responses to faults on the primary with blown fuses in the primary system. As indicated in Figure 1, the rolled or crossed phases are assumed to exist in feeder 2 at the transition between the overhead and underground feeders.
Considered are spot networks with network transformers having the delta grounded wye winding connections, and transformers with the grounded-wye connections for both the primary and secondary windings.
Although the system in Figure 1 is for a two-unit spot network, the effect of the rolled or crossed phases in one feeder in a larger spot network can be simulated by increasing the size of the network transformer fed from feeder 1. For example, for a four-unit spot network, the network transformer on Feeder 1, T1, is given a kVA rating equal to three times the kVA rating of the network transformer on Feeder 2 which has either the rolled or crossed phases on the primary feeder.
System Parameters For Studies
The system for generating the currents and voltages seen by the network protector (NP) relays during the rolled and crossed phases on Feeder 2 is the same as used for simulating the simultaneous faults as shown in Figure 1 of Appendix 3. Nominal voltage of the primary system is 13.8 kV, with all bus-tie circuit breakers in the substation closed. The available three-phase and SLG fault currents on the 13.8 kV substation bus are 12.5 kA and 13.125 kA respectively, with the X to R ratio of the positive-and zero-sequence impedances being 15. The sequence impedances of the overhead circuits and underground cable circuits are listed in Table 1. The network transformers are rated 1000 kVA, 13.8 kV to 480Y/277 volts, 5.0% impedance. The X to R ratio of the transformer impedance is varied to show the effect on the quantities that affect the response of both the sequence based and power-based network relays. The OH feeders from the substation to the tap circuit for the network are 1 mile long, use 477 kcmil aluminum phase conductors and a 4/0 copper neutral conductor, with the phase GMD being 3.18 ft., and the GMD from the phases to the neutral conductor being 6.37 ft. The tap circuits to the network transformers are 300 feet long using 2/0 aluminum cable with a one third size copper multi-wire concentric neutral.

Figure 1:
Primary feeders with two-unit spot network with rolled
or crossed phases at transition from OH to UG feeder.
Table 1:
Sequence impedances of circuits in Figure A3-1
Circuit Type |
Positive-Sequence |
Zero-Sequence |
||
|---|---|---|---|---|
R-Ω/kft |
X-Ω/kft |
R-Ω/kft |
X-Ω/kft |
|
OH |
0.0375 |
0.1113 |
0.0903 |
0.3697 |
UG |
0.0750 |
0.175 |
0.470 |
0.245 |
The current transformers (CT) in the 480-volt network protectors (NP) in Fig. A5-1 have a 1600 to 5 ratio, and the NP relay sensitive reverse current trip setting is 0.15% of protector CT rating.
Figure 1-ab shows on the left-side the crossed phase condition, where phases B and C are crossed at the transition between the overhead circuit and the underground circuit in feeder 2. On the right-hand side of Figure 1-ab is shown the rolled phase condition on feeder 2 at the transition between the overhead and underground circuit for feeder 2. It is emphasized that for the crossed or rolled phase conditions, if the network protectors downstream are open, the network relay will not make its close contacts. Some network relays at the open protector will make their trip contact for the rolled and crossed phase conditions.

Figure 1-ab:
Connections at transition from OH to UG feeders for
crossed phases in feeder 2 (left-side) and for rolled phases
(right-side) in feeder 2.
Network Relay Trip Algorithms
Three different algorithms for NP relays to generate the trip characteristic were evaluated. The first is the positive-sequence directional current characteristic in Figure 2, where the adjustable trip curve shift angles are θSH1 and θSH2. This trip characteristic is available in the relay of [1] and [3].
Positive-Sequence Trip Characteristic
For this trip characteristic, the positive-sequence component of the network line-to-ground voltages, V1N, is the reference at zero degrees. The sensitive trip setting, RCT% is the positive-sequence current at 180o, in percent of CT rating, required to make the trip contact. The position of the sensitive trip curve in quadrant 2 is defined by shift angle θSH2, and in quadrant 3 and 4 by shift angle θSH1, with the positive direction being counter clockwise for both angles.

Figure 2:
Positive-sequence current trip characteristic in system
amperes.
In the NP connected to the faulted feeder, the positive-sequence current, I1, most always lies in the 1st or 2nd quadrant, and the current in the NP connected to the unfaulted primary feeder normally lies in the 3rd or 4th quadrant. I1MAG is the magnitude of the positive-sequence current in the protector, I1, that intercepts the trip curve. The angle of I1 relative to V1N, is θ1rly, where the angle usually is positive in the NP connected to the faulted primary feeder, and negative in the NP connected to the unfaulted primary feeder.
The magnitude of the positive-sequence current in the protector, I1MAG, and its angle, θ1rly, which is either positive or negative in sign, are obtained from simulations of the system in Figure 1 for the rolled and crossed phase conditions. The NP relay shift angle, θSH, where current I1MAG will just intercept the trip curve, for either positive or negative values of θ1rly, is given by eq (1).
(1) $$ \ \ \ \theta_{SH} = a \tan{(\frac{-K \cos{\theta_{1rly}} - 1}{K \sin{\theta_{1rly}}})}$$
In eq (1), K is the magnitude of the current in the NP, in per unit of the current at 180 degrees, required to intercept the trip curve, as given by eq (2).
(2) $$ \ \ \ K = \frac{I_{1MAG}}{(CT * RCT_{﹪}) \text{/100 }} $$
When θ1rly is positive, angle θSH from eq. (1) is the maximum value for θSH2 (Figure 2) at which the relay in the protector connected to the faulted feeder will detect the fault. Angle θSH2 must be less than θSH obtained from eq (1) to assure reliable fault detection. When angle θ1rly is negative in sign, shift angle θSH from eq (1) is the angle where the sensitive trip characteristic of the relay in the protector fed from the unfaulted feeder is satisfied. Angle θSH1 (Figure 2) for the NP relay must be less than angle θSH from eq (1) to assure that the protector fed from the unfaulted primary feeder does not trip.
In network relays with the positive-sequence trip characteristic, angle θSH2 is typically between -5o and +5o, which means the angle of the positive-sequence current, θ1rly must lead the positive-sequence voltage by between 85o and 950 for the protector to trip. Similarly, angle θSH1 is typically between 0o and +5o, which means that in the protectors connected to the unfaulted feeder, the positive-sequence current should not lag the positive-sequence voltage by more than 85 to 90 degrees so that the protector on the unfaulted feeder does not trip.
In the following sections which give the results from the simulation of the rolled and crossed phases, given is the angle of the positive-sequence current, θ1rly, from which it can be determined if the relay in the protector on the feeder with the rolled or crossed phases will trip, and if the relay in the protector on the other feeder, feeder 1 in Figure 1, will trip for typical shift angles, θSH2 and θSH1.
Power Based Trip Characteristic
Two algorithms for power-based relays are evaluated to determine allowed trip-curve shift angles. They are similar, where one calculates the net real and net reactive powers (P&Q) in the protector using the actual voltage magnitudes at the protectors, and the other does the calculations with the nominal voltage magnitude. Figure 3 shows the relay sensitive trip curve in the P-Q plane.

Figure 3:
P-Q plane for defining power-based trip characteristics
and algorithms.
In both cases the actual current magnitudes and actual angles between the currents and phase-to-ground voltages are used to calculate PNET and QNET. The convention is that vars into the network are “+Q”, and vars from the network back towards the primary are “-Q”. PSET is the three-phase real power corresponding to the sensitive reverse current trip setting, RCT%, in percent of CT rating, and VNOM is the nominal phase-to-ground voltage, normally either 125 volts or 277 volts.
(3) $$ \ \ \ P_{SET} = 3V_{NOM} \frac{RCT_{﹪}}{100} \text{ CT watts}$$
For the example system of Figure 1, PSET with a reverse current trip setting of 0.15% of CT rating, or 1600 amperes, with VNOM = 277 is 1994 watts, or 0.00199 MW. For the rolled and crossed phase conditions simulated, given in the following sections is the value for PNET and QNET in MW and MVARs, from which it can be determined if the P-Q point will lie in the trip or non-trip region of the network relay
The trip curve consists of two straight-line segments, one in quadrant 2, having shift angle θSH2, and the second in quadrant 3-4, having shift angle θSH1, with the positive direction for both shift angles being counter clockwise.
For the first trip algorithm, the relay calculates the net three-phase real power and reactive power in the protector in accordance with the conventions of Figure 3, shown as:
(4) $$ \ \ \ P_{NET} = \sum_{i=A}^{i=C} \text{RE}(V_{iN} I_{i}^*) $$
(5) $$ \ \ \ Q_{NET} = \sum_{i=A}^{i=C} \text{lm}(V_{iN} I_{i}^*) $$
In eq (4) and eq (5), ViN and Ii* are network phase “i” line-to-ground voltage and the complex conjugate of the protector phase current, both being complex numbers. The sign of both PNET and QNET can be either “+” or “-“. The reference direction for the current in each phase of the NP is into the network for calculation of PNET and QNET. If the point defined by PNET and QNET lies on or to the left of the sensitive trip curve in Figure 3, the sensitive trip characteristic is satisfied. Practically, when the units for the P axis and Q axis are in MW and MVAR, the sensitive trip curves pass through the origin.
Given PNET and QNET, recognizing sign conventions of Figure 3, and that PSET is a positive number as in eq (3), the trip curve shift angle θSH where the P-Q point just lies on the trip curve is given by:
(6) $$ \ \ \ \theta_{SH} = a \tan{\frac{P_{NET} + P_{SET}}{Q_{NET}}}$$
It can be shown that the P-Q point will lie to the left of the trip curve if the following inequality is satisfied.
(7) $$ \ \ \ \sum_{i=A}^{i=C}(V_{iMAG} I_{iMAG} \cos{(\theta_{li} - \theta_{vi} - \theta_{SH} )}) \lt - P_{SET} \cos{\theta_{SH}} $$
In eq (7), ViMAG is the magnitude of phase”i” voltage, IiMAG is the magnitude of phase “i” current, θIi is the angle of phase “i” current, and θVi is the angle of phase “i” voltage. On the right side of the inequality is a minus sign before PSET.
For the second power trip algorithm, the relay calculates PNET-NOMINAL and QNET-NOMINAL in accordance with eq (8) and eq (9). This is the algorithm for the NP relay described in [2].
(8) $$ \ \ \ P_{NET-NOMINAL} = \sum_{i=A}^{i=C} \text{RE}(V_{iN}I_{i}^* \frac{V_{NOM}}{V_{iMAG}}) $$
(9) $$ \ \ \ Q_{NET-NOMINAL} = \sum_{i=A}^{i=C} \text{Im}(V_{iN}I_{i}^* \frac{V_{NOM}}{V_{iMAG}}) $$
This power trip algorithm calculates the P-Q point using the angle between the network line-to-ground voltage and protector current, the magnitude of the protector current, but the nominal voltage magnitude rather than the magnitudes of the network actual voltages.
CROSSED PHASES ON FEEDER 2
Y-Y Network Transformers, Two Unit Spot Network
For the cross phase condition on Feeder 2 in Figure 1, and Y-Y network transformers, Figure 4 plots with the green-colored curve the angle of the positive-sequence current, θ1rly, in the protector feed from Feeder 2 with the crossed phases, and with the red-colored curve the angle of the positive-sequence current, θ1rly, in the protector fed from Feeder 1, versus the X to R ratio of the network transformers.

Figure 4:
Positive-sequence current angle in protector on feeder
with crossed phase (faulted feeder) and in protector on feeder with
correct phasing, Y-Y transformers, two-unit spot,.
From Figure 4, it is seen that the angle of the current in the protector fed from the feeder with the crossed phases will lie in the trip region, and the angle of the current in the protector fed from feeder 1 with correct phasing will lie in the non-trip region for typical trip curve angles.
Figure 5 plots in the P-Q plane the PNET and QNET point for the power-based relay that does its P-Q calculation using the magnitude of the actual network line-to-ground (neutral) voltages and the angle between the actual network voltages and protector phase currents. Notice that there is only one point shown, as practically varying the network transformer X to R ratio from 6 to 13 has no effect on the P-Q point when plotted. Note that the units of the X axis are in MW, and the units of the Y axis are in MVAr. Further, the PNET-QNET point is the same in both the unit fed from feeder 2 with the crossed phases, and in the unit fed from feeder 1 with correct phasing. Thus, the relay in neither protector would issue a trip signal, and the fault would be cleared by blowing of the network protector fuses.

Figure 5:
P-Q point for protector fed from feeder with crossed
phases, and for protector fed from feeder with correct phasing., P-Q
point calculated with actual voltage magnitudes, Y-Y transformers,
two-unit spot network..
Figure 6 plots the P-Q point for network relays that use the nominal voltage magnitude in the P-Q calculations. Again, practically when plotted on a MW and MVAr scale, the network transformer X to R ratio has no noticeable effect on the location of the PNET-NOMINAL-QNET-NOMINAL point. Regardless it is seen that the network relay in neither protector would make its trip contact, and the network protector fuses most likely would blow to clear the crossed phase condition.

Figure 6:
P-Q point for protector fed from feeder with crossed
phases, and for protector fed from feeder with correct phasing, P-Q
point calculated with nominal voltages, Y-Y network transformers,
two-unit spot.
Table 2 lists the currents in amperes in the network protectors on the 1000 kVA 480-volt network transformers in the two-unit spot network. Network protector 2 is fed from feeder 2 which has the crossed phases, and network protector 1 is fed from feeder 1 which has the correct phasing. Since this is a two-unit spot network, it is seen that fuses in both network protectors could blow, resulting in a partial outage to the load served from the spot network. As is always the situation, when a protector fails to open in a two-unit spot network under high-fault current conditions, coordinating the protector fuses is usually not possible.
Table 2:
Network protector phase currents with crossed phases on
Feeder 2, two-unit spot with Y-Y network transformers.
Network Protector 2 |
Network Protector 1 |
||||
|---|---|---|---|---|---|
ϕA (Amps) |
ϕB (Amps) |
ϕC (Amps) |
ϕA (Amps) |
ϕB (Amps) |
ϕC (Amps) |
590.4 |
16912 |
17372 |
590.4 |
17373 |
16912 |
Y-Y Network Transformers, Four Unit Spot Network
For the four-unit spot network, of interest is the response of the network relay associated with the feeder with the crossed phases, and for the network relay in each protector fed from the feeders with the correct phasing. To simulate the four-unit spot network, in the system of Figure 1 the size of the transformer fed from feeder 1 was three times that of the transformer fed from the feeder with the crossed phases.
Figure 7 plots with the green-colored curve the angle of the positive-sequence current, θ1rly, in the protector on the feeder with the crossed phases versus network transformer X to R ratio. The red-colored curve plots the angle of the positive-sequence current in each protector on the feeders with the correct phasing. From this it is seen that for typical trip curve angles, the positive-sequence relay in the protector on the feeder with the crossed phases will make its trip contact, and the positive-sequence relay in the protector on the feeder fed from each feeder with the correct phasing (red-colored curve) will not make its trip contact.

Figure 7:
Positive-sequence current angle in protector on feeder
with crossed phase (faulted feeder) and in each protector on feeder
(unfaulted feeder) with correct phasing, Y-Y network transformers, four
unit spot.
Figure 8 shows the locus of the P-Q point versus network transformer X to R ratio with the green colored curve for the network protector associated with the feeder with the crossed phase. The red-colored curve gives the locus of the PNET-QNET point for each network protector on a feeder that has the correct phasing. For these curves, the P-Q points are calculated using the magnitude of the actual network line-to-ground voltages. From this it is seen that the protectors on the feeder with the crossed phase would not trip, but the protectors on the feeder with the correct phasing would trip. This is not the desired response.

Figure 8:
Locus of P-Q point versus network transformer X to R
ratio for protector fed from feeder with crossed phases, and for each
protector fed from feeder with correct phasing., P-Q point calculated
with actual voltage magnitudes.
Figure 9 shows the locus of the P-Q point versus network transformer X to R ratio when the P-Q points are calculated using the nominal network line-to-ground voltage. The green-colored curve is for the network protector associated with the feeder with the crossed phase. The red-colored curve gives the locus of the PNET-NOMINAL-QNET-NOMINAL point for each network protector on a feeder that has the correct phasing. The network transformer X to R ratio affects where the P-Q point lies, but its effect is minor.

Figure 9:
Locus of P-Q point versus network transformer X to R
ratio for protector fed from feeder with crossed phases, and for each
protector fed from feeder with correct phasing, P-Q point calculated
with nominal voltages, Y-Y transformers, four-unit spot.
From Figure 9, the network protectors on the feeders with the correct phasing would trip, which is not the desired response. The effect of this would be to change the phase sequence on the spot network bus, which could be damaging to three-phase motors supplied from the spot network bus.
Delta-Y Network Transformers, Two Unit Spot Network
This subsection presents the responses of the network relays in the two-unit spot network which have the delta wye-grounded connections for the network transformers when the phases are crossed on feeder 2 in Figure 1. Figure 10 shows with the green-colored curve the angle of the positive-sequence current in the protector fed from the feeder with the crossed phases, feeder 2 in Figure 1. The red-colored curve in Figure 10 shows the angle of the positive-sequence current, θ1rly, in the protector fed from the feeder with the correct phasing. For typical angles for the sensitive trip curve of relays with the positive-sequence trip characteristics, the protector on the feeder with the crossed-phases would trip, and the protector on the feeder with correct phasing would not trip.

Figure 10:
Positive-sequence current angle in protector on feeder
with crossed phase (faulted feeder) and in protector on feeder with
correct phasing (unfaulted feeder). Delta Wye network transformers, two-unit spot.
Figure 11 shows for the power-based relay in the P-Q plane the location of the PNET- QNET point for the crossed phase condition on Feeder 2 in Figure 1 It is seen from this that for both the protector on the feeder with the crossed phases, and on the feeder with the correct phasing, the network relay trip contact would not make as both PNET and QNET are positive. Further, for the scale used, as the X to R ratio of the network transformers is varied from 6 to 13, it has minimal effect on the location of the PNET and QNET point. Neither protector would trip for this condition, and protector fuses would blow.

Figure 11:
P-Q point for protector fed from feeder with crossed
phases, and for protector fed from feeder with correct phasing., P-Q
point calculated with actual voltage magnitudes, Delta Wye transformers,
two-unit spot.
Although neither relay in the protectors would make their trip contact, the currents in the network protectors are high, and network protector fuses would blow. Table 3 lists the phase currents in the network protector associated with the feeder with the crossed phases, feeder 2, and in the protector on the feeder with the correct phasing, feeder 1 in Figure 1. From these currents which are very high in comparison to the 1200 ampere rating of the 1000 kVA 480-volt network transformer, it is clear that fuses in the protectors fed from both feeders will blow. This will cause an outage to the load supplied from the spot network bus.
Table 3:
Network protector phase currents with crossed phases on
Feeder 2, two-unit spot with Delta-Y network transformers.
Network Protector 2 |
Network Protector 1 |
||||
|---|---|---|---|---|---|
ϕA (Amps) |
ϕB (Amps) |
ϕC (Amps) |
ϕA (Amps) |
ϕB (Amps) |
ϕC (Amps) |
10293 |
9504 |
19791 |
9504 |
10298 |
19791 |
Figure 12 shows the locus of the P-Q point versus network transformer X to R ratio when the P-Q points are calculated using the nominal network line-to-ground voltage, VNOM. The green-colored curve is for the network protector associated with the feeder with the crossed phase. The red-colored curve gives the locus of the PNET-NOMINAL-QNET-NOMINAL point for each network protector on a feeder that has the correct phasing. The network transformer X to R ratio affects where the PNET-NOMINAL-QNET-NOMINAL point lies, but its effect is minor.
From Figure 12, it is clear that for the two-unit spot network with delta wye connected network transformers, the protector connected to the feeder with the correct phasing, feeder 1 in Figure 1, would trip. This would change the phase rotation on the secondary side, and could damage three-phase motors supplied from the spot network.

Figure 12:
P-Q point for protector fed from feeder with crossed
phases, and for protector fed from feeder with correct phasing, P-Q
point calculated with nominal voltages, Delta Wye transformers, two-unit
spot network.
Delta-Y Network Transformers, Four Unit Spot Network
The impact of crossed phases on one feeder of a four-unit spot network was investigated with the model of Figure 1, where the size of the network transformer on feeder 1 was three times the size of the transformer on feeder 2 with the crossed phases.
Figure 13 shows with the green-colored curve the angle of the positive-sequence current, θ1rly, relative to the network positive-sequence line-to-ground voltage. And the red-colored curve shows the angle of the positive-sequence current in each protector on the feeder supplied from the feeders with correct phasing. From this it is seen that the relays with the positive-sequence trip characteristic will respond correctly in the four-unit spot network.

Figure 13:
Positive-sequence current angle in protector on feeder
with crossed phase (faulted feeder) and in each protector on feeder with
correct phasing (unfaulted feeder), Delta -Y network transformers,
four-unit spot network..
Figure 14 shows for the power-based relay with the green-colored curve the locus of the PNET-QNET point in the protector connected to the feeder with the crossed phases, and the locus in each protector fed from a feeder with correct phasing, for the four-unit spot network. It applies when the actual network line-to-ground (neutral) voltage magnitudes are used for the calculation of the P-Q point. The relays respond correctly, and the protector associated with the feeder with the crossed phases trips. The other three protectors remain closed.

Figure 14:
Locus of PNET-QNET point versus
network transformer X to R ratio for protector fed from feeder with
crossed phases, and for protector fed from feeder with correct phasing.,
P-Q point calculated with actual voltage magnitudes, Delta-Y network
transformers, four-unit spot.
Figure 15 shows the same information as in Figure 14, except that the P-Q point is calculated using the nominal voltage magnitudes. Again, the green-colored curve is for the protector fed from the feeder, feeder 2, with the crossed phases, and the red-colored curve is for the protector fed from each feeder with correct phasing. The relays respond correctly. Note from Figure 15 that for the protector fed from the feeder with crossed phases, the PNET-NOMINAL-QNET-NOMINAL point lies well within the trip region, and for each protector fed from the feeder with correct phasing, the PNET-NOMINAL-QNET-NOMINAL point lies well within the non-trip region.

Figure 15:
Locus of P-Q point versus network transformer X to R
ratio for protector fed from feeder with crossed phases, and for each
protector fed from feeder with correct phasing, P-Q point calculated
with nominal voltages. Delta-Y network transformers
Rolled Phases on Feeder 2
Figure 16 shows the sequence networks for the rolled phases on Feeder 2 as shown in Figure 1.
In Figure 16, Y1S and Y0S are the positive-and zero-sequence admittances representing the substation feeding the two primary feeders. Admittance Y1BR and Y0BR are the the equivalent positive- and zero-sequence admittances respectively for the OH feeder, the cable circuit, and the network transformer of circuit 1, reflected to the HV side of the transformer. Admittance Y1FDR2 and Y0FDR2 are the sequence admittance of OH circuit 2 from the substation to the location of the rolled phases in Figure 1. Admittances Y1BR2 and Y0BR2 are the equivalent sequence admittances of circuit 2 cable and network transformer 2, reflected to the primary side of the network transformer. Network load is represented by sequence admittances Y1L, Y2L, and Y0L, reflected to the HV side. When the network transformers have the delta connected primary windings, impedances Z0BR1 and Z0BR2 are infinite (admittances zero).

Figure 16:
Sequence networks for rolled phase on primary feeder 2
in Figure 1. Zero-sequence network is for case with wye-wye network
transformers.
With the rolled phase condition on primary feeder 2, the rolled phases cause no coupling between the sequence networks, unlike that for faults and open conductors as shown in Appendix 3. However, during the rolled phase condition, there can be negative-sequence and zero-sequence currents on the secondary side of the network transformers from unbalanced loading in the secondary system.
In the sequence networks of Figure 16, all impedances or admittances are in Ohms or Mhos respectively referred to the primary side of the network transformers. When the network transformers have the Wye-Wye connections, there is no phase shift in either the positive-sequence or negative-sequence networks between the HV and LV side of the network transformer. But with the delta-wye connections, in the positive-sequence network both the current and voltage on the secondary side lag those quantities on the primary side by 30 degrees. The significance of this is that the response of the network relays to the rolled phase on primary feeder 2 is the same for the wye-wye network transformers and the delta-wye connected network transformers.
Considered in the following two subsections are the response of the sequence-based and power-based network relays in two-unit spot network, and then in four-unit spot networks for the rolled phases on feeder 2.
Two-Unit Spot Networks With Rolled Phases
Figure 17 shows with the green-colored curve and the red-colored curve respectively the angle of the positive-sequence current, θ1rly, in the protector on the feeder with the rolled phases, and in the protector on the feeder with the correct phasing. From this it is seen that the protector on the feeder with correct phasing will trip, and the protector on the feeder with the rolled phases will not trip. This will not change the phase sequence applied to the load supplied from the spot network. The curves apply for both wye-wye and delta-wye connected network transformers.

Figure 17:
Positive-sequence current angle in protector on feeder
with rolled phase (faulted feeder) and in protector on feeder with
correct phasing (unfaulted feeder). Wye-Wye and Delta-Wye network
transformers, two-unit spot.
Figure 18 shows the locus of the P-Q point versus network transformer X to R ratio with the green-colored curve for the protector connected to the feeder with the rolled phases, and with the red-colored curve for the protector on the feeder with the correct phasing. For these curves, the relay calculates the P-Q point, PNET, and QNET, using the actual network line-to-ground voltages. From this it is seen that the protector connected to the feeder with the rolled phases will not trip, but the protector fed from the feeder with the correct phasing will trip. This is the same response as occurs with the sequence-based network protector relay.
Figure 19 shows the locus of the P-Q point versus network transformer X to R ratio with the green-colored curve for the protector connected to the feeder with the rolled phases, and with the red-colored curve for the protector on the feeder with the correct phasing. For these curves, the relay calculates the P-Q point, PNETNOMINAL, and QNET-NOMINAL, using the nominal network line-to-ground voltages. From this it is seen that the protector connected to the feeder with the rolled phases will not trip, but the protector fed from the feeder with the correct phasing will trip. This is the same response as occurs with the sequence-based network relay.

Figure 18:
P-Q point for protector fed from feeder with rolled
phases, and for protector fed from feeder with correct phasing., P-Q
point calculated with actual voltage magnitudes, Delta Wye and Wye-Wye
network transformers.
It is re-emphasized that if the network protector is open and phases have been rolled on the primary feeder, the network relay close characteristics in network protectors downstream of the rolled or crossed phases will not be satisfied and the network protector will not auto close. Further, some microprocessor network relays will make their trip contact under these rolled-phase conditions.

Figure 19:
P-Q point for protector fed from feeder with rolled
phases, and for protector fed from feeder with correct phasing, P-Q
point calculated with nominal voltages, Delta Wye and Wye-Wye
transformers, two-unit spot network.
Four Unit Spot Network With Rolled Phases
The relay responses with rolled phases on the primary of feeder 2 are the same with the Wye-Wye and the Delta-Wye network transformers in the four-unit spot network.
Figure 20 shows the angle of the positive-sequence current, θ1rly, relative to the positive-sequence network line-to-ground voltage with the green-colored curve for the protector on the feeder with the rolled phases, and with the red-colored curve for each protector on a feeder with the correct phasing. The three protectors on the feeder with the correct phasing would trip, creating a triple contingency condition.

Figure 20:
Positive-sequence current angle in protector on feeder
with rolled phase (faulted feeder) and in each protector on feeder with
correct phasing (unfaulted feeder), Delta -Y and Y-Y network
transformers, four-unit spot.
Figures 21, and 22 show for the power-based relay with the green-colored curve and the red-colored curve respectively the locus of the P-Q point for X to R ratios between 6 and 13 for respectively a relay which calculates the PNET-QNET point using actual network line-to-ground voltage magnitudes, and a relay that uses the network nominal line-to-ground voltage magnitude to calculate the PNET-NOMINAL and QNET-NOMINAL point.
For either calculation procedure for the P-Q point, it is seen that the relay in the protector associated with the primary feeder with the rolled phases would not make its trip contact, and the relay in each protector fed from a feeder with correct phasing would make its trip contact. This could result in a triple contingency for the four-unit spot network. Again, the response for the rolled phases is the same with the delta-wye and wye-wye connected network transformers.

Figure 21:
Locus of P-Q point versus network transformer X to R
ratio for protector fed from feeder with rolled phases, and for each
protector fed from feeder with correct phasing.,
PNET-QNET point calculated with actual voltage
magnitudes, Delta-Y and Y-Y network transformers.

Figure 22:
Locus of P-Q point versus network transformer X to R
ratio for protector fed from feeder with rolled phases, and for each
protector fed from feeder with correct phasing.,
PNET-NOMINAL-QNET-NOMINAL point calculated with
nominal voltage magnitudes, Delta-Y and Y-Y network transformers, four
unit spot network.
Other System Configurations
The analysis for the crossed and rolled phase conditions presented in previous sections of the appendix has been for two-unit and four-unit spot networks. As indicated before, if phases are crossed or rolled and the protectors downstream are open, they will not reclose automatically. With some microprocessor relays, at the open protector the network relay trip contact will be made.
The concern is if a network is dead, and then re-energized by simultaneous closing of all feeder breakers. With either rolled or crossed phases in one of the feeders, the response of the network relays in protectors may not be what is desired, as shown in the previous sections. Although network transformer connections make a difference in the response to crossed phases on one of the primary feeders, network transformer connections have no effect on relay response when phases are rolled on one of the primary feeders during re-energization of the spot networks.
Examining the effect of the rolled or crossed phases in a primary on network relay response in protectors feeding the area (grid) network when re-energizing a dead network is beyond the scope of this appendix. It is expected such a detailed analysis of an actual system will show that the relay response, regardless of the transformer connections, may not be desirable. This just emphasizes the importance of checking phasing whenever primary cable are spliced following a compete outage of a secondary network system.
5 - Interest Groups
EPRI hosted distribution underground interest groups
The North American Dense Urban Utilities Working Group (NADUUWG)
An interest group that brings together representatives from utilities that serve densely populated urban centers to share practices and to discuss and pursue solutions to specific challenges.
The interest group was the brainchild of a small group of utilities dedicated to facing the challenges and constraints of meeting their projected demand and service needs with older underground system designs. These challenges include high costs of redundant systems for maintaining N-1 or better service levels, increasing fault currents, aging equipment, limited physical space to expand the system traditionally, low equipment utilization factors, and sharp growth in new load types and distributed generation. –>
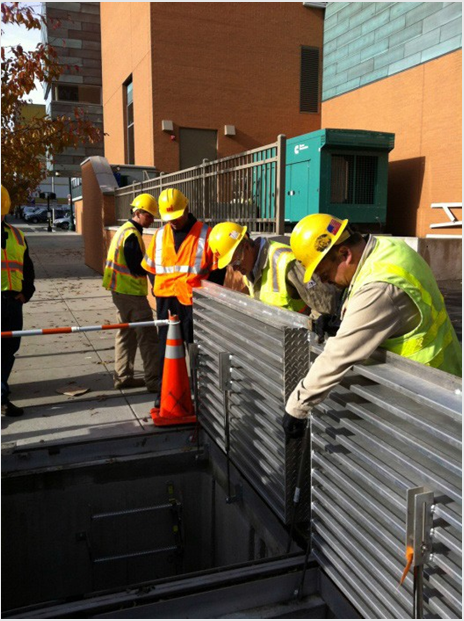
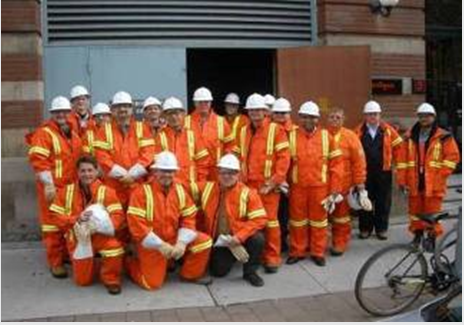
EPRI facilitates the interest group, which is open to all utility companies. Meetings typically are hosted by a participating utility and include presentations from all companies present. Discussions focus on functional issues, practices, and on industry challenges and potential solutions. In most cases the host company offers a field tour. Sessions are closed to vendors, suppliers and consultants. On occasion, a session following the meeting may target a technology and include vendor(s) specifically to provide a deep dive into that technology.
The North American Dense Urban Utilities Working Group offers the opportunity to share practices associated with managing urban underground systems with peer companies. The requirements for each participant are:
-
Prepare and deliver a presentation on a topic associated with urban underground/network systems (15 min. + 10 min. of Q&A).
-
Sign a non-disclosure agreement, to ensure that the information shared among the group stays within the group.
Undergrounding for Distribution Interest Group (U-DIG)
U-DIG is an interest group that focuses on industry collaboration to improve the efficiency and reduce the costs associated with proactively converting overhead facilities to underground. For more information on U-DIG and our past webcasts, please visit our U-DIG site for more info!
For more information, contact John Tripolitis, EPRI Program Manager, at either 610.385.0884 or jtripolitis@epri.com, or the EPRI Customer Assistance Center at either 800.313.3774 or askepri@epri.com.
6 - Apps for Low-Voltage Network Scenarios
Several models of network scenarios including backfeeds and phasing issues
6.1 - Background on Network-Protector Relaying
Details on different protector tripping characteristics used in the network apps
Historic Perspective for Network Protector Relaying
With reference to Figure, the first non-dedicated feeder applications, where the two-unit spot network was fed from overhead multi-grounded neutral feeders were made in the 1960’s when the only relays available for network protectors were the electromechanical type, such as the Westinghouse CN-33, and the General Electric CHN. Studies were performed simulating the most common type of fault on the cable circuit to the spot network transformers, the single-line-to-ground fault with the blown fuse in just the faulted phases. These studies showed that the standard CN-33 relay or the GE CHN relay would not reliably detect the SLG fault with the blown fuse in the faulted phase. Important parameters affecting the relay response were the X to R ratio of the network transformers, and the loading on the spot network paralleling bus at the time of the SLG fault with blown fuse. And if the relay does not detect the SLG fault with blown fuse in the faulted phase, then the fuses in the network protector associated with the faulted phase can blow. But in a two-unit spot network, the fuse associate with the faulted phase in both protectors could blow, creating a single phase condition for the spot network, thereby defeating the purpose of the spot network which is to provide reliable service to the load for faults on the primary system.
Manufacturers and utility engineers looked at what could be done to the standard electromechanical network relays to allow them to reliably detect the SLG fault with blown fuse in the faulted phase. With the Westinghouse CN-33 relay, it was determined that by changing the connections to the relay current coils from the protector current transformers, a trip characteristic was developed that would reliably detect the SLG fault with blown fuse. The relay with the revised connections from the protector CT’s to the relay current coils was referred to as the “watt-var” relay. Figure 1 shows the CN-33 relay standard (“watt”) trip characteristics under balanced three-phase conditions.
Although the “watt-var” connections to the CN-33 relay would reliably detect the SLG fault with blown fuse, there were some short comings to the connections. Figure 2 shows the CN-33 relay trip characteristics under balanced three-phase conditions when the watt-var connections are made. First, the protector would trip for leading power factor network loads if the power factor were less than 86%. Second, if the relay with “watt-var”connections were used in a dedicated feeder network, where he backfeed could be capacitive if the feeder breaker were opened in absence of a fault, the “watt-var” relay would not detect the capacitive backfeed.
Although the characteristics shown in Figure 1 and in Figure 2 apply to the Westinghouse electro-mechanical network protector relays, there was a similar arrangement for the General Electric electro-mechanical relays that allowed them to reliably detect the SLG fault on the primary feeder with a blown fuse in the faulted phase.
In today’s microprocessor relays for network protectors, some relays allow adjusting the angles of the trip curve relative to the reference phasor. Considered in these apps are three trip algorithms that can be used for a microprocessor relay.

Figure 1:
CN-33 electromechanical relay “watt” trip characteristic
under balanced three-phase conditions

Figure 2:
CN-33 electromechanical relay “watt-var” trip
characteristic under balanced three-phase conditions
Microprocessor Relay Trip Algorithms
Three trip algorithms are included in the apps for network microprocessor relays. The first is the positive-sequence directional overcurrent trip characteristics. The other two are power based trip algorithms.
Positive-Sequence Directional Overcurrent Trip Characteristic
The positive-sequence directional overcurrent trip characteristic is shown in Figure 3. The relay extracts the positive-sequence component of the network line-to-ground voltage, shown as V1N in Figure 3. This is the reference for the relay trip characteristic. The relay also calculates the positive-sequence component of the three phase currents in the network protector, designated as I1. The angle between the positive-sequence current, I1, in the network protector and the positive-sequence component of the network line to ground voltage is θ1rly as shown in Figure 3.
The relay trip curve consists of two segments, one in quadrant 2 identified as TC2, and the other in quadrant 3 and 4 identified as TC1. The positive-sequence current at 180 degrees required to make the relay trip contact is equal to the protector current transformer rating times the 180 degree trip setting in percent of CT rating, divided by 100. Both TC2 and TC1 pass thru this point.

Figure 3:
Positive-sequence directional overcurrent trip characteristic
The angle of TC2 is defined by angle θSH2, and the angle of TC1 is defined by angle θSH1, where the positive direction for both angles is counter-clockwise as shown in Figure 3. In general, the current in the protector associated with the faulted primary feeder lies in quadrant 2, and the positive-sequence current in the protector associated with the unfaulted feeder lies in quadrant 3 or quadrants 3 and 4.
In Figure 3, current I1MAG is the magnitude of the current in the protector associated with the faulted feeder as calculated by the apps. The apps then calculate the shift angle θSH2, at which the positive-sequence current having magnitude I1MAG will just intercept trip curve 2. For the relay in the protector to reliably detect the fault, the shift angle for TC2 should be less than θSH2 to allow for tolerances and errors in the relay.
Similarly, the apps calculate for the network protector associated with the unfaulted primary feeder the angle of trip curve segment TC1, angle θSH1 where the positive-sequence current will just intercept trip curve segment TC1. So that the protector associated with the unfaulted primary feeder does not trip, the shift angle for TC1, must be less than the calculated value of θSH1.
For the Eaton MPCV relay, when the watt trip characteristic is selected, angle θSH2 is fixed at -5 degrees, and angle θSH1 is fixed at +5 degrees. For the MPCV relay when the watt-var trip characteristic is selected, angle θSH2 is at -60 degrees, and angle θSH1 is fixed at +5 degrees. The apps give angle θSH2 and angle θSH1, from which it can be determined if the MPCV relay in the protector connected to the faulted feeder, and in the protector connected to the unfaulted feeder will respond correctly.
The DigitalGrid network relay can be programed to have the positive-sequence directional overcurrent trip characteristic as shown in Figure 3. With this relay, settings can be made, referred to as “trip tilt angle” and “trim angle” that allow the user in effect to set shift angles θSH2 and θSH1 to any desired value. The apps provide the information needed for the user to set the DigitalGrid network relay so that the protector associated with the faulted feeder will trip, and the network protector associated with the unfaulted feeder will not trip.
Power Based Trip Algorithm Using Network Actual Line-to-Ground Voltage Magnitudes
The first power-based trip characteristic is shown in Figure 4, where the horizontal axis is the real power flow in the network protector, and the vertical axis is the reactive flow in the network protector. The trip curve also consists of two straight line segments, one in the second quadrant, segment TC2 having shift angle θSH2, and one in the third and fourth quadrant, TC1 having shift angle θSH1. Both segments pass through the point having a P value of PSET, and a Q value of zero as shown. PSET is calculated using the nominal line-to-ground voltage, typically either 120-volts or 277 volts, and the relay reverse current trip setting in percent of current transformer rating, RCT%, and the current transformer primary current rating, CT.

Figure 4:
Power based trip characteristic using network actual
line-to-ground voltage magnitudes for calculation of P and Q
The apps calculate in each network protector for the simultaneous fault the net three-phase power flow, PNET, which is the sum of the power flows in the three phases of the protector, and it calculates the net three-phase reactive flow in the protector, QNET, which is the sum of the reactive flows in the three phases of the network protector. If this point lies on or to the left of the relays sensitive trip curve shown in Figure 4, the sensitive trip criteria is satisfied.
In the network protector associated with the faulted HV feeder, the P-Q point lies in either the first or second quadrant in Figure 4. And in the network protector associated with the unfaulted HV feeder, the P-Q point lies in the fourth or third quadrant in Figure 4.
Given PNET, QNET, and PSET, for the protector associated with the faulted HV feeder, the apps calculate the shift angle θSH2 such that the P-Q point just lies on the trip curve segment TC2. For the relay in the protector associated with the faulted primary feeder, the actual shift angle must be less than calculated angle θSH2 to assure that the P-Q point will lie in the trip region. Similarly, in the network protector associated with the unfaulted HV feeder, the apps calculate shift angle θSH1 for trip curve segment TC1 shown in Figure 4 where the P-Q point just lies on the trip curve. To prevent the protector associated with the unfaulted HV feeder from tripping, the shift angle for TC1 for the protector on the unfaulted feeder must be less than the calculated value of angle θSH1 in Figure 4 to assure the protector does not trip.
Power Based Trip Algorithm Using Network Nominal Line-to-Ground Voltage Magnitude
The second power-based trip algorithm in the apps is very similar to the first, in that the P-Q point is calculated using for each phase the nominal line-to-ground voltage, the phase current, and the angle between the actual network line-to-ground voltage and the line current. This is done for each phase, and the net P and Q for the three phases, designated PNETnom and QNETnom is calculated. This method for calculating the P-Q point is described in the instruction book for the SEL 632-1 network relay.
In the protector associated with the faulted HV feeder, the PNETnom-QNETnom point normally lies in the first or second quadrant, and in the protector supplied from the unfaulted primary feeder the PNETnom-QNETnom point normally lies in the fourth or third quadrant.
For the network protector associated with the faulted feeder, the apps calculate the shift angle, θTC2, for trip curve segment TC2 where the PQ point will just lie on the trip curve. For the relay to reliably detect the fault, the shift angle for TC2 should be less than the calculated value for θTC2, to allow for tolerances and uncertainties in the system data used for the analysis.
For the network protector associated with the unfaulted primary feeder, the apps calculate the shift angle for trip curve segment TC1, angle θTC1, where the P-Q point just lies on trip curve segment TC1. To assure that the protector associated with the unfaulted feeder does not trip, the shift angle for TC1 should be less than the calculated value for θTC1, to account for tolerances and uncertainties in the system data used for the calculation of the currents and voltages in the network protectors.
Other Trip Algorithms for Microprocessor Network Protector Relays
These apps for simulating simultaneous fault and blown fuse conditions solve for the currents and voltages in the network protectors in the two-unit spot networks. The apps then use these currents and voltages to evaluate the response of microprocessor network protector relays that have the trip algorithms discussed in the preceding sections. In particular, the apps find the trip curve shift angle for the protector on the faulted feeder to assure that it will reliably detect the fault. And the apps determine the trip curve angle at which the protector associated with the unfaulted primary feeder will trip.
Since the apps give the protector currents and voltages, the user can use these to evaluate the performance of other microprocessor network protector relays if the relay manufacturer provides the algorithm that his relay uses to make the trip decision. The phase voltage and current magnitudes, along with their angles, can be used to evaluate the relays performance.
6.2 - Network Backfeeds for an Open Feeder
Models backfeeds on a network protector with an open primary feeder breaker with or without a fault
Purpose: This app can be used to model the expected currents and voltages at a back feeding network protector onto a medium-voltage feeder which has locked out at the substation, and with all other protectors on the feeder opened, including the case where the MV feeder has locked out because of a MV fault. The app can be used to examine and determine network protector relay trip characteristics and settings to assure that the protector opens on backfeed in these conditions. The app can also be used to examine system conditions and predict system behaviors in a case where the protector fails to open on backfeed, such as because of a mechanical failure. Under these conditions, network protector fuses may blow, which can be simulated with the app.
Background: Network protectors which are properly maintained and “set” are designed to open when a medium voltage (MV) feeder at the substation locks out, either with or without a fault on the MV feeder. They do this by detecting the backfeed from the secondary, and then open, preventing backfeed onto the MV feeder or into a cable fault. If the network protector fails to open on backfeed, either because of improper settings or other issues, this can result in varied conditions depending on factors such as the type of fault, system voltage, the stiffness of the LV network at the backfeed location, and the amount of cable charging on the primary circuit. This app enables exploration of various scenarios associated with backfeed through a network protector onto an open faulted or non faulted feeder. The fault types considered on the primary feeder are the single line-to-ground and the double line-to-ground faults. One app also simulates backfeed to an open feeder breaker with no fault on the primary feeder. The effects of blown fuses in the backfeeding protector can be examined by specifying the protector phase that has the blown fuse. The app applies to systems where the network transformers have the delta connected HV windings and the wye connected LV windings.
If there is a backfeed to a single line-to-ground fault when the primary cable charging kvar is high, overvoltages may occur in the secondary network at the backfeed location, that can damage customer loads or electronic components in the network protector. The apps allow examining the effect of shunt reactors placed on the primary feeder for limiting the voltage rise in the secondary network to acceptable levels.
In the network diagram below, hover over network elements to see detailed results.
Results
Results applicable to three different relay characterics are shown. For more background, see here.
Positive-Sequence Directional Relay Response
For this trip characteristic, the positive-sequence component of the network voltages, V1N, is the reference at zero degrees. The sensitive trip setting, RCT% is the positive-sequence current at 180°, in percent of CT rating, required to make the trip contact. The position of the sensitive trip curve in quadrant 2 is defined by shift angle θSH2, and in quadrant 3 and 4 by shift angle θSH1, with the positive direction being counter clockwise for both shift angles. See Figure 1.
To ensure that NWP 2 trips, its relay shift angle θSH2 must be less than the angle θSH given above.
To ensure that NWP 1 does not trip, its relay shift angle θSH1 must be less than the angle θSH given above.
In some microprocessor relays settings can be made such that angle θSH2 and angle θSH1 are adjustable and different. In the Eaton MPCV relay, angle θSH2 is fixed at -5 degrees, and angle θSH1 is fixed at +5 degrees, which gives the “gull wing” trip characteristic.
Power-Based Relay Responses
The first power-based relay response uses net real and net reactive power to determine tripping. Positive reactive power means a flow into an inductive load. The trip curve consists of two straight-line segments, one in quadrant 2, having shift angle θSH2, and the second in quadrant 3-4, having shift angle θSH1, with the positive direction for both shift angles being counter clockwise. See Figure 2.
If the point defined by PNET and QNET lies on or to the left of the sensitive trip curve in Figure 2, the sensitive trip characteristic is satisfied.
To ensure that NWP 2 trips, its relay shift angle θSH2 must be less than the angle θSH given above.
To ensure that NWP 1 does not trip, its relay shift angle θSH1 must be less than the angle θSH given above.
The second power-based relay response calculates PNET-nominal and QNET-nominal using the nominal voltage magnitude instead of actual voltages. The tripping criteria is the same after that. This is the response used by the SEL 632 relay.
Other Notes
This app can be used to show the following:
-
If the primary feeder cable charging is modest, as in most 15-kV class systems, the backfeed currents in the network protector are usually not high enough to blow the fuses in the backfeeding network protector should it fail to open. Further the phase-to-ground voltages at the backfeeding network protector are not excessively high, and damage to customer load is not expected.
-
If the primary feeder cable charging is high, as encountered in systems operating at 23 kV, 27 kV, 33 kV, and 34.5 kV, excessive overvoltages can occur at the backfeeding network protector which can damage customer loads. However, by applying a shunt reactor on the primary feeder, whose zero-sequence impedance is less than its positive-sequence impedance, the overvoltages at the backfeeding network protector are prevented. This is indeed what some utilities do on their 23 kV, 27 kV, and 33 kV primary feeders.
-
The two parameters which have the greatest effect on the voltages at the backfeeding network protector are the stiffness of the LV network at the backfeed location, and the amount of cable charging on the primary circuit. Backfeed from a weak location in the network to a primary feeder with high cable charging can produce excessive overvoltages in the secondary system.
Here are some cases to try:
6.3 - Network-Protector Operations with a Primary-Side Blown Fuse
Models a two-bank spot network fed by an overhead system with a fault and fuses blown on one primary supply
This app calculates the system response for a fault on the cable side of the fuse for underground cable #2 that supplies network transformer T2. The fuse(s) in the faulted phase(s) are blown, but the fuses in unfaulted phases are not blown. For more background, see here.
Purpose: This app can be used to model the expected behavior of a spot network that is fed from non-dedicated network feeders, such as overhead feeders with radial load, when a fault occurs on the system. In these cases, the fault may result in a single phase tap fuse blowing (where the underground to the spot network takes off from the overhead system, for example). It is important that the network protector relay settings are established such that the protector will open on the faulted feeder in these conditions. This app enables the user to model this type of fault and determine appropriate network protector relay settings to assure that the protector will open.
Background: In a network system with dedicated feeders, the only protective devices on the primary feeder are circuit breakers at the substation. When a fault occurs on the primary feeder, the circuit breaker at the substation opens. Following this, the network relays in the network protector associated with the faulted feeder will detect the fault and open. This isolates the fault on the primary feeder from the load served from the secondary network, and the customers served from the secondary network do not experience a power outage.
In some cases, utilities will supply spot networks from overhead primary feeders. In these cases, the spot network may be supplied from fused taps from the overhead feeder. If a fault occurs on the cable circuit (the underground portion feeding the spot network), this could result in the fuse on the faulted phase blowing, rather than the substation breaker opening. If the protector relay does not have the correct trip characteristic and is not set properly, this condition could result in in the protector not opening, the blowing of network protector fuses, and a single phase condition for the load supplied by the spot network.
In the network diagram below, hover over network elements to see detailed results.
Results
Results applicable to three different relay characterics are shown. For more background, see here.
Positive-Sequence Directional Relay Response
For this trip characteristic, the positive-sequence component of the network voltages, V1N, is the reference at zero degrees. The sensitive trip setting, RCT% is the positive-sequence current at 180°, in percent of CT rating, required to make the trip contact. The position of the sensitive trip curve in quadrant 2 is defined by shift angle θSH2, and in quadrant 3 and 4 by shift angle θSH1, with the positive direction being counter clockwise for both shift angles. See Figure 1.
To ensure that NWP 2 trips, its relay shift angle θSH2 must be less than the angle θSH given above.
To ensure that NWP 1 does not trip, its relay shift angle θSH1 must be less than the angle θSH given above.
In some microprocessor relays settings can be made such that angle θSH2 and angle θSH1 are adjustable and different. In the Eaton MPCV relay, angle θSH2 is fixed at -5 degrees, and angle θSH1 is fixed at +5 degrees, which gives the “gull wing” trip characteristic.
Power-Based Relay Responses
The first power-based relay response uses net real and net reactive power to determine tripping. Positive reactive power means a flow into an inductive load. The trip curve consists of two straight-line segments, one in quadrant 2, having shift angle θSH2, and the second in quadrant 3-4, having shift angle θSH1, with the positive direction for both shift angles being counter clockwise. See Figure 2.
If the point defined by PNET and QNET lies on or to the left of the sensitive trip curve in Figure 2, the sensitive trip characteristic is satisfied.
To ensure that NWP 2 trips, its relay shift angle θSH2 must be less than the angle θSH given above.
To ensure that NWP 1 does not trip, its relay shift angle θSH1 must be less than the angle θSH given above.
The second power-based relay response calculates PNET-nominal and QNET-nominal using the nominal voltage magnitude instead of actual voltages. The tripping criteria is the same after that. This is the response used by the SEL 632 relay.
Other Notes
Here are some cases to try:
6.3.1 - Background on Network-Protector Operations with a Primary-Side Blown Fuse
Details and background on the app modeling a two-bank spot network fed by an overhead system with a fault and fuses blown on one primary supply
Figure 1 is a single-line diagram of a two-unit spot network where there are two feeders protected with phase and ground relays at the substation. Normally, in secondary network systems the only protective devices on the primary feeder are three-pole circuit breakers at the substation. When a fault occurs on the primary feeder, the circuit breaker at the substation opens. Following this, the network relays in the network protector associated with the faulted feeder will detect the fault, and the network protectors fed from the faulted feeder open. This then isolates the fault on the primary feeder from the load served from the secondary network, and the customers served from the secondary network do not experience a power outage.
In some situations, utilities have applied spot networks fed from overhead primary feeder in suburban area, for important loads such as airports, computer centers, hospitals and critical manufacturing facilities. The utility will supply the spot network from taps taken from the overhead feeder, which for most utilities is a three-phase four-wire multi-grounded neutral feeder, which has distribution transformers whose primary windings are connected from phase-to-neutral, and between phases.

Figure 1:
System for the app simulating faults with blown HV fuses
The network transformers in the spot network, shown as a two-unit spot network in Figure 1, are fed through cable circuits, most always made with single-conductor cables with a flat-strap or multi-wire concentric neutral. If a fault occurs on the cable circuit, and if the cable circuit were connected to the overhead feeder without fuses, a fault on the cable circuit would result in tripping of the feeder breaker at the substation, and cause an outage to the customers served radially from the overhead feeder. To prevent this from happening, the cable circuits for the spot network are connected to the overhead feeder through fuses, either distribution fuse cutouts or a separate switch and fuses.
A similar situation can exist in a dedicated primary feeder network, if network transformers in the spot network are connected to the primary feeder through a three-phase switch with primary fuses. In such applications, the ampere rating of the fuse is typically less than the pickup of the phase relays for the primary feeder at the substation, and the fuses provide more sensitive protection for incipient faults in the HV or LV windings of the network transformers.
Whether the two-unit spot network in Figure 1 is fed from non-dedicated overhead primary feeders with radially connected distribution load, or from network dedicated primary feeders, when a fault occurs on the tap circuit to the network transformer on Feeder 2, all three phases do not open on the primary. For example, if a single line-to-ground fault occurs on the cable circuit, only the fuse in the faulted phase will blow. The fuses in the two unfaulted phases will not blow. It is important that the network protector relay in the protector fed from the faulted feeder with blown fuse will detect the fault, and open the network protector on the faulted feeder. If the relay does not detect the fault, and the protector does not open, then network protector fuses associated with the faulted phases will open. Furthermore, if the spot network is a two-unit spot network, and the protector doesn’t open, then fuses in both network protectors can blow, creating a single-phase condition for the load supplied from the spot network.
With reference to Figure 1, in the app the kVA rating of each network transformer in the spot network is specified, along with its impedance, X to R ratio of the impedance, and the rated voltage on the HV and LV side of the network transformer. Although the single line shows a two-unit spot network, it can be used to find the response in spot networks with three or four network transformers. This is accomplished by doubling or tripling the kVA rating of the network transformer supplied from primary feeder cable UG1 in Figure 1.
The other issue that impacts the system response for this scenario are the winding connections for the network transformers, either delta-wye or wye-wye. If the spot network is fed from non-dedicated multi-grounded neutral overhead primary feeders with line-to-neutral connected distribution transformers, the network transformers in the spot network should have the wye-wye winding connections. If the delta-wye connections are selected and a single line-to-ground fault (SLG) occurs on the overhead primary feeder, the voltage on the unfaulted primary phases rise up to full phase-to-phase voltage, and a 73% overvoltage is applied to the load supplied from the line-to-neutral connected distribution transformers on the unfaulted phase. On a 120-volt basis, the 120 volt load have 208 volts applied to them, and they will be damaged if a protector fails to open, or if the protector has time delay tripping.
If the primary feeder from the substation in Figure 1 are network dedicated primary feeders where all network transformers have their primary windings connected in delta, then the network transformers in the two-unit spot network can have the delta connected primary windings.
The app considers three fault types on the cable circuit to network transformer 2. The first is the single line-to-ground fault on any one phase, with a blown fuse in any one phase, which normally would be the same phase with the fault. The second is the ungrounded line-to-line fault between any two phases, with blown fuses in any two phases as specified in the app. However, with an ungrounded line-to-line fault, one fuse may blow before the other, so the app allows simulating the ungrounded line-to-line fault with a blown fuse in either one of the faulted phase, as specified by the user of the app. The third fault type is the double line-to-ground (DLG) fault on any two phases, with a blown fuse in any two phases, where the blown fuses would be in the two faulted phases. But with the DLG, the fuse in one faulted phase could blow first, so the app allows simulating the DLG fault with a blown fuse in just one of the faulted phases.
6.4 - Crossed or Rolled Phases on the Primary
Models a spot network where one primary supply has phasing issues
Purpose: This app models system conditions and network protector behavior associated with a spot network in the situation where work was performed on the MV feeder, and phases were inadvertently rolled or crossed on the MV feeder prior to re-energizing the feeder.
Background: In a situation where phases are rolled or crossed on an energized primary feeder with the network protectors open, the network protectors will not auto close after the primary feeder has been energized. With some network protector relays, with the protector open and rolled or crossed phases on the primary feeder, the network relay will make its trip contact. However, when entire networks are dropped, and the system is then re-energized by simultaneous closing of all feeder breakers at the substation, the response of the network relays in protectors on the feeder with the rolled or crossed phases, and on the other feeder with correct phasing is needed. In some cases, protectors may be locked in the closed position as part of the network pick up strategy. This app can help engineers predict system conditions in the case of rolled or crossed phases when a de-energized network is picked up with rolled or crossed phases on one primary feeder.
In the network diagram below, hover over network elements to see detailed results.
Results
Results applicable to three different relay characterics are shown. For more background, see here.
Positive-Sequence Directional Relay Response
For this trip characteristic, the positive-sequence component of the network voltages, V1N, is the reference at zero degrees. The sensitive trip setting, RCT% is the positive-sequence current at 180°, in percent of CT rating, required to make the trip contact. The position of the sensitive trip curve in quadrant 2 is defined by shift angle θSH2, and in quadrant 3 and 4 by shift angle θSH1, with the positive direction being counter clockwise for both shift angles. See Figure 1.
To ensure that NWP 2 trips, its relay shift angle θSH2 must be less than the angle θSH given above.
To ensure that NWP 1 does not trip, its relay shift angle θSH1 must be less than the angle θSH given above.
In some microprocessor relays settings can be made such that angle θSH2 and angle θSH1 are adjustable and different. In the Eaton MPCV relay, angle θSH2 is fixed at -5 degrees, and angle θSH1 is fixed at +5 degrees, which gives the “gull wing” trip characteristic.
Power-Based Relay Responses
The first power-based relay response uses net real and net reactive power to determine tripping. Positive reactive power means a flow into an inductive load. The trip curve consists of two straight-line segments, one in quadrant 2, having shift angle θSH2, and the second in quadrant 3-4, having shift angle θSH1, with the positive direction for both shift angles being counter clockwise. See Figure 2.
If the point defined by PNET and QNET lies on or to the left of the sensitive trip curve in Figure 2, the sensitive trip characteristic is satisfied.
To ensure that NWP 2 trips, its relay shift angle θSH2 must be less than the angle θSH given above.
To ensure that NWP 1 does not trip, its relay shift angle θSH1 must be less than the angle θSH given above.
The second power-based relay response calculates PNET-nominal and QNET-nominal using the nominal voltage magnitude instead of actual voltages. The tripping criteria is the same after that. This is the response used by the SEL 632 relay. Note that there are some numerical issues with this approach if the voltages on any phases are nearly zero. This happens with the crossed phases with a delta-wye transformer.
Other Notes
If work is done on a primary feeder to replace a section of cable between two manholes, with all network protectors open, but if phases are rolled or crossed, when the feeder is re-energized by closing the feeder breaker at the substation, the network protectors will not auto close.
However, one way that the system could be energized with rolled or crossed phases in one feeder is if the system was de-energized (network dropped) and work had been done on a primary cable. If the system were then re-energized by simultaneous closing of all feeder breakers at the substation, the response of the network relays in protectors on the feeder with the rolled or crossed phases, and on the other feeder with correct phasing is needed.
Here are some cases to try:
7 - Underground Practices Repository
Repository of practices and knowledge from participating utilities
7.1 - About the Repository
EPRI Urban Underground Practices Repository
Introduction Acknowledgements EPRI Contact Information
Introduction
Overview
A key objective of EPRI’s research into distribution system practices is to identify, document and provide practice summary descriptions to research participants in a format that facilitates comparison and aids decision-makers in identifying those practices in place at other utilities that can be applied to their utility to improve performance. In order to facilitate comparisons, EPRI has issued practice results in an online repository, which places like practices employed by multiple companies one against the other. By organizing practices in this fashion, a funding company representative can use the EPRI Practice Repositories to compare and contrast practices used by peer companies to address like challenges.
Background
Underground systems are a crucial part of the electric utility industry infrastructure, delivering high levels of reliability to customers. Underground systems also present challenges to industry leaders, such as aging infrastructure and high construction and maintenance costs. Moreover, the loss of experienced staff to mergers and attrition has left many utilities with a gap in experience needed for optimal planning, design and engineering, construction, operations, and maintenance of underground systems. In 2007, EPRI embarked upon a multiyear effort to identify and illustrate noteworthy practices in managing urban underground systems. Originally focused on secondary network systems, EPRI expanded the scope of its practices research (at the request of participant utilities) to include practices employed in non-network designs such as radial ducted manhole systems, and non-network dual feeds to major urban customers. While some of the challenges faced by utilities with network systems are unique to network systems (e.g., network protector maintenance), many of the challenges operators of network systems face are similar to those faced by operators of non-network designs. For this reason, EPRI has expanded its research to identify noteworthy practices it believes valuable to utilities of both network and non-network systems. Beginning in 2012, EPRI expanded its research scope to include urban underground system practices employed by international (non-U.S.) utilities; specifically, ESB Networks in Dublin Ireland, and Energex in Brisbane, Australia. Research into international company practices presents an opportunity to identify unique practices and alternate ways of conducting business. A significant finding from EPRI’s review of these companies is that the fundamental design of the urban underground infrastructure serving their central business districts is significantly different than the urban design approach used by most U.S. utilities. Most U.S. utilities utilize a low-voltage meshed secondary underground network to serve urban customers. In this design, the meshed secondary system is supplied from multiple primary feeders. Because the secondary system is meshed, if one (or more) of the primary feeders go out of service, the secondary network continues to be supplied from the remaining primary feeders, ensuring uninterrupted customer service. The international approach is similar in that it utilizes an expansive secondary system to serve customers. However, the secondary system is not meshed, but radially designed, with multiple normally open tie points that can be used to facilitate restoration in an outage. Beginning in 2020, EPRI expanded the repository to include survey and practice information associated with underground residential and commercial distribution (URD and UCD). The ultimate research goals are deliverables that can aid utilities in managing underground distribution systems by identifying noteworthy industry practices information that can reduce time, cost, and uncertainty of dealing with these systems, and improve safety and reliability.
Approach
Successful management of underground distribution systems requires a confluence of people, processes, and technology practices. For example, performing a distribution feeder load flow analysis requires people with the appropriate educational background and training, and standards that define when and why such an analysis should be performed. Performing a feeder load flow analysis also requires a defined process, or set of activities that describe how such an analysis should be performed, and positions that set of activities within a larger process (e.g., overall capacity planning). Performing load flow analysis also entails the application of technology, such as load flow software and automated mapping systems. For this reason the EPRI research team focused on identifying People practices, Process practices, and Technology practices:
• People practices include things such as organizational designs, educational requirements, training, management controls such as policies, standards and audits, and performance management practices. These practices are descriptions of “who does things” and “how people are prepared.” • Process practices focus on the structure and performance of the activities involved in executing business processes in each key functional area. These practices summaries are descriptions of “how things are done.” • Technology practices focus on the application of tools, equipment, and information technology to support the execution of the processes. These practices summaries are descriptions of the “tools used to get things done.”
Summaries of practices in this repository are presented in a “People”, “Process”, and “Technology” format. In addition, the EPRI project team has also gathered practices information using surveys. Results from surveys are used to help members better understand common and contrasting practices among utility peers for managing underground systems. Survey results have been summarized and are included in the data repository.
Acknowledgements
EPRI wishes to acknowledge the high levels of cooperation, openness, and information sharing by all of the study participants from the companies who have participated in the practices immersions thus far and whose practices are represented in this repository, including: Seattle City Light (SCL), Con Edison, FirstEnergy (The Illuminating Company - CEI), Hawaiian Electric Company (HECO), CenterPoint Energy, Duke Energy, Pacific Gas & Electric (PG&E), National Grid, Ameren, ESB Networks, Energex, Georgia Power, and AEP.
In particular, EPRI wishes to acknowledge the following individuals for their leadership in helping to create and shape this practices repository:
| Mr. Hamed Zadehgol | SCL |
| Mr. Frank Doherty | Con Edison |
| Mr. Matt Slagle | FirstEnergy |
| Mr. Roger Savako | FirstEnergy |
| Ms. Charlyne Nakamura | HECO |
| Mr. Lance Miyahara | HECO |
| Mr. Larry Neal | CenterPoint |
| Mr. Mark Mitchell | CenterPoint |
| Mr. Jeff Hesse | Duke Energy |
| Mr. Jerry Ivey | Duke Energy |
| Ms. Tuyet La | Duke Energy |
| Mr. Bob Malahowski | PG&E |
| Mr. Robert Sheridan | National Grid |
| Mr. Robert Schwarting | National Grid |
| Mr. Greg Ringkamp | Ameren |
| Mr. Ken Worland | Ameren |
| Ms. Theresa Fallon | ESB Networks |
| Mr. Michael Moran | ESB Networks |
| Mr. Paul Rainbird | Energex |
| Mr. Lee Welch | Georgia Power |
| Mr. Perry Pettigrew | Georgia Power |
| Mr. Roy Middleton | AEP |
| Mr. Tom Weaver | AEP |
Find more information on participating utilities here.
EPRI Contact Information
John Tripolitis JTripolitis@EPRI.com (610) 385-0884
Josh Perkel JPerkel@EPRI.com (704) 595-2568
7.2 - Company Summaries
7.2.1 - AEP - Ohio
2015
Name |
AEP Ohio |
|---|---|
| Utility Type | Investor Owned: American Electric Power |
| Web Site | https://www.aepohio.com/ |
| Contact | Roy Middleton |
| Number of Electric Customers | Approx. 1.5 million customers |
| Location Description | Networks in metropolitan Columbus and Canton, Ohio |
| Network Organization | The network group is an operating unit within the AEP parent company. |
| Workers Represented by Collective Bargaining? | Yes: Network Mechanics. |
| Job Progression | Advancement within Network Mechanic job family based on attainment of training objectives and testing. There are expected times to advance to next level, but not an “up or out” program. |
| Number of Field Network Electrical Workers | Approximately 30 field resources, 6 Network Crew Supervisors, 2 support positions and 1 Supervisor for support of the Columbus networks. |
| Number of Distinct
Secondary Networks Served |
Four networks in Columbus, supplied by three stations. All serve combination of grid load and spot load.
Two networks in Canton, OH |
| Network Primary Operating Voltage(s) | Columbus networks operated at 13.8 kV
Canton network operated at 23 kV |
| Network Secondary Voltages | 125/216-V secondary grid; 480-V spot networks |
| Number of Primary Feeders Supplying each Network | Six feeders |
| Design Contingency | N-2 in Columbus, N-1 in Canton |
| Number of Network Distribution Transformers | Metro Columbus –320
Canton – 50 Total - 370 |
| Network Transformer Sizes | 500/750/1000 kVA at 208 V; 500/750/1000/1500/2000/2500 kVA at 480 V |
| Network Protector Sizes | 1600A/1875A/2000A/2250A/2825A/3000A/3500A/4500A |
| Primary Cable Sizes | 1/0 TR-XPLE (URD)
4/0 TR-XPLE 500 copper flat strap EPR with thin jacket to fit 3” to 31/2” ducts. Use compact stranding and reduced wall. 750 Cu and Al used for station exits |
| Secondary Cable Sizes | All secondary cable is being replaced with 750 EAM (ethylene-alkene copolymer) copper and aluminum. |
| Civil Construction | 17 crew members, including equipment operators |
| Peak Network Load | 120 MVA in Columbus and 20 MVA in Canton |
| Annual Network Load Growth | 1% |
| Preventive Maintenance Programs | |
| Network Protector Inspection, Maintenance and Testing | 1-year cycle for inspections; 4-year cycle for complete maintenance |
| Network Transformer Inspection, Maintenance and
Oil Testing |
1-year cycle for inspections; 4-year cycle for complete maintenance |
| Vault Inspections | 1-year cycle |
| Vault Environmental Cleanup | Utilize vacuum trucks, as required. |
| Manhole Inspections | Four year cycle |
7.2.2 - Ameren Missouri
2011
| Name | Ameren Missouri |
|---|---|
| Utility Type | Investor Owned |
| Website | |
| EPRI Contact | Ken Worland |
| Number of Electric Customers | 2.4 million electric customers in Missouri and Illinois (Ameren)
St. Louis network - 5100 meters St. Louis downtown radial – 1400 meters |
| Location Description | Ameren Missouri network system serves portions of the City of St. Louis, MO. |
| Network Organization | Part of the Distribution Services. UG network design and construction performed by Underground Division. Network equipment maintenance and operations performed by Distribution Operations. |
| Workers Represented by Collective Bargaining? | Yes, field workers and Energy Service Consultants (Estimators) represented by IBEW. |
| Automatic Mode of Progression? | No journeyman program in UG Construction Distribution Service testers advance to journeyman after aggressive 20 week training program, |
| Number of Field Electrical workers | 10 Dist Serv Techs
12 Cable Splicers |
| Number of Distinct Secondary Networks Served | 4 networks, each sourced by separate substation |
| Network Primary Operating Voltage(s) | 13.8kV |
| Network Secondary Voltages | 125/ 216 V Grid and spots
277/480 V spot networks |
| Number of Primary Feeders Supplying Each Network | 2 networks are fed by 8 dedicated feeders
1 network is fed by 7 dedicated feeders 1 network is fed by 6 dedicated feeders |
| Design Contingency | N-1, including planning for a substation bus outage. |
| Number of Network Distribution Transformers | 265 network units in St. Louis |
| Network Transformer Sizes | Most common size – 500 and 750 kVA on the Grid. 1000 kVA spots. |
| Network Protector Sizes | Current Standard: 1875, 2000, 2250, 2825, 3000 Amps |
| Primary Cable Types | 13.8kV – PILC, EPR
EPR used as primary sections are replaced |
| Primary Cable Sizes | 15kV - 750 cu, 500 cu, 350 cu, 4/0 Al
35 kV - 750 cu, 350 cu, 1/0 Al |
| Secondary Cable Sizes | 500 cu for mains |
| Civil Construction | Have poured in place, brick and mortar, and precast construction in the network. Current standard - precast construction |
| Peak Network Load | St Louis – 207 MVA |
| Annual Network Load Growth | Flat, some residential growth, as downtown buildings are converted to lofts. |
| Preventive Maintenance Programs | |
| Network Protector Inspection | Annual |
| Network Protector Maintenance And Testing | 2 year cycle |
| Network Transformer Inspection, Maintenance And Oil Testing | 2 year cycle, part of vault inspection. Separate programs for sampling oil from transformer and from primary termination compartment. |
| Vault Inspections | Visual inspection annually. More detailed inspection of equipment on a 2 Year cycle |
| Vault Environmental Cleanup | Number of cleanups based on findings from annual vault inspection |
| Manhole Inspections | Detailed inspection on every 4 years. |
7.2.3 - BC Hydro
2022
Name |
Company Name |
|---|---|
| Utility Type | BC Hydro |
| Web Site | |
| Contact | Stefano Ghirardello, |
| Number of Electric Customers | Approximately 1.9M customers.
The urban underground network in Victoria serves ~2700 customers |
| Location Description | Networks in downtown Victoria, serving a geographic area of about 124 acres, or 50 hectares |
| Network Organization | Electric utility (crown corporation) which handles G, T & D |
| Workers Represented by Collective Bargaining? | Field workers and Design, yes. Engineering and Planning, no |
| Job Progression | 4-year apprenticeship |
| Number of Field Network Electrical Workers | Total crew 3-4 + flagging |
| Number of Planners and Designers | 1 Planner and typically 1 Designer (neither are dedicated to the network) |
| Annual Network Load Growth | ~750kVA |
| Number of Distinct
Secondary Networks Served |
1 |
| Number of Spot Networks | 6 |
| Miles of MV UG cable in networks | |
| Miles of LV UG cable in networks | |
| Network Primary Operating Voltages | 12.47kV |
| Network Secondary Voltages | 120/208V, SPOT networks are 347/600V |
| Number of Primary Feeders Supplying each Network | 7 |
| Design Contingency | N-2 |
| Number of Network Distribution Transformers | 108 (12 of which are for SPOT networks) |
| Network Transformer Sizes | Area networks – 500kVA
Spot networks – 1500kVA |
| Network Protector Sizes | 1600A -2000A(SPOTS) |
| Primary Cable Types | PILC and XLPE |
| Primary Cable Sizes | #2 KCM, 400kCM-600kCM Cu PILC and 500 kCM Cu XLPE |
| Secondary Cable Types | Cu |
| Secondary Cable Sizes | 4c 500kCM Cu and 7c (6x4/0 and 1x450kCM neutral) Cu |
| Civil Construction | All civil work on the Network is performed by our contractor. All work is constructed in place (no pre-cast). |
| Preventive Maintenance Programs | |
| Network Protector Inspection, Maintenance and Testing | 5 year frequency |
| Network Transformer Inspection and Maintenance | 5 year frequency |
| Transformer Oil Testing | 5 year frequency |
| Vault Inspections | 5 year max |
| Vault Environmental Cleanup | 5 year max |
| Manhole Inspections | 5 years max |
7.2.4 - CEI - The Illuminating Company
2008
| Name | The Illuminating Company |
|---|---|
| Utility Type | Investor Owned |
| Website |
https://www.firstenergycorp.com/The_Illuminating_Company/index.html |
| EPRI Contact | Matt Slagle
(216) 479-1100
|
| Number of Customers | 745,000 |
| Location Description | The City of Cleveland, Ohio and surrounding areas |
| Network Organization | Dedicated organization for underground construction , operation and maintenance, including network and non – network underground systems. Dedicated section within regional Engineering Services for underground systems design, including network and non-network systems. |
| Workers represented by collective bargaining? | Yes, Field Force is represented by UWUA, Local 270.
Engineers are not represented by collective bargaining. |
| Automatic Mode of Progression? | Employees are not mandated to advance to a journeyman position within a given period of time, but can achieve the journeyman level in six years with time in grade, formal and on-the-job training, and testing. Management determines the number of positions at each classification. |
| Number of Field Electrical workers | 48, work with network and non-network distribution |
| Number Of Network Planners And Designers | 2 |
| Number of Network Customers Served | Total – 600. Most downtown load in Cleveland is not served by the secondary network system. |
| Number of Distinct Secondary Networks Served | Total – 1 network
2 spot networks with 120/208 V secondary |
| Miles of Underground Cable | 16,000 ft of network primary cable
37,000 ft of network secondary cable |
| Network Primary Operating Voltage(s) | 11 kV |
| Network Secondary Voltages | 120/ 208 V, with cable limiters |
| Number of Primary Feeders Supplying Each Network | 5 primary feeders supply the network.
All network feeders are sourced from the same area substation. |
| Design Contingency | N-1 |
| Number of Network Distribution Transformers | Total - 61 |
| Network Transformer Sizes | 500-1000 kVA |
| Network Protector Sizes | 1600 and 2000 amps @ 120 V |
| Primary Cable Types | PILC
EPR (current standard - used for new construction) XLP (used in substation getaways – non – network feeders) |
| Primary Cable Sizes | Typically, 600 Kcmil cu, 3 conductor PILC; 500 Kcmil cu, 1- conductor EPR |
| Secondary Cable Sizes | Standard – 500 Kcmil cu |
| Civil Construction | Pre-cast vaults |
| Peak Network Load | 12 MVA |
| Total Company Peak Load | |
| Annual Network Load Growth | 0 %, load is declining. |
| Preventive Maintenance Programs | |
| Manhole Inspection | 5-year cycle |
| Network Vault Inspection | Every 6 months |
| Network Protector Maintenance | 6-year cycle |
| Network Relay Maintenance | 6- year cycle |
| Network Transformer Oil Sampling | 2-year cycle |
| Network Protector Operational Test | Annual |
7.2.5 - CenterPoint Energy
2009
| Name | CenterPoint Energy |
|---|---|
| Utility Type | Investor Owned |
| Website | http://www.centerpointenergy.com/home/ |
| EPRI Contact | Larry Neal
(713) 207-4530
|
| Number of Electric Customers | 2 Million |
| Location Description | The City of Houston, Texas and surrounding metropolitan area (5000 Sq mile territory) |
| Network Organization | Dedicated organization for major underground design, construction, operation and maintenance, including network and non – network underground systems. |
| Workers represented by collective bargaining? | Yes, Field Force is represented by IBEW. Local 66.
Engineers are not represented by collective bargaining. |
| Job Progression | Advancement through the Network Tester and Cable Splicer job families involves a three year apprenticeship program that includes a combination of training, job skills demonstration, and testing. Workers must complete the required training and testing to remain in the program and advance to a journeyman level. |
| Number of Field Electrical workers | 110, work with network and non-network distribution |
| Number of Planners And Designers | 30, work with network and non-network distribution design. |
| Number of Distinct Secondary Networks Served | 5 networks, served by from 6 to 10 feeders each. Feeders are sourced out of three different substations. |
| Miles of Underground Cable (Major Underground, excluding URD) | 624 miles of 12kV
233 miles of 35kV 28 Miles of UG Network Secondary |
| Underground Primary Operating Voltage(s) | 12.47 kV and 34.5 kV |
| Network Secondary Voltages | 120/ 208 V, grid and spot networks
277/480 V spot networks 2400/4160 V spot networks |
| Number of Primary Feeders Supplying Each Network | From 6 – 10, depending on the network.
All network feeders supplying a given network are sourced from the same substation. CenterPoint has three different subs that supply its Houston networks |
| Design Contingency | N-1 |
| Number of Network Distribution Transformers | 148 |
| Network Transformer Sizes | 480Y/277V to 208Y/120V – 300kVA
208Y/120V – 600kVA and 750kVA 480Y/277V – 1000kVA, 1500kVA, 2500kVA |
| Number of Network Protectors | 278 |
| Network Protector Sizes | 800, 1600, 2000 and 2500 amps @ 208 V
800, 1200, 1600, 2500 amps @ 480V |
| Primary Cable Types (Major Underground) | PILC (existing, not used currently)
Butyl Cable (existing, not used currently) EPR (current power cable standard for Major Underground, installed in conduit) TR-XLPE – used in Direct Buried URD applications |
| Primary Cable Sizes | 750 and 1000 MCM AA EPR at 12kV
2/0, 500, and 1000 MCM Cu EPR at 12 KV 1250 MCM AA at 35 kV 2/0 and 350 MCM Cu EPR at 35 kV 1/0 AL TR XLPE at 12 kV and 35 kV |
| Civil Construction | CenterPoint ‘Pours in place” to build new manholes. Precast units are usually the choice of customers who are providing manholes. |
| Preventive Maintenance Programs | |
| Manhole Inspection | 1 year, 5 year, or 10 year cycle depending on the manhole criticality |
| Vault Inspection | 1 year cycle, though some critical vaults inspected more often |
| Network Protector Maintenance | 5 year testing, 1 year inspection |
| Three phase pad-mounted transformer Inspection | 1 year cycle |
7.2.6 - Central Hudson Gas & Electric
2022
Name |
Central Hudson Gas & Electric |
|---|---|
Utility Type |
Investor Owned |
Web Site |
https://www.cenhud.com/ |
Contact |
Taryn Black, tblack@cenhud.com |
Number of Electric Customers |
Approximately 309,000 customers throughout the service territory. In total, the three individual urban underground network systems serve approximately 1,500 customers. |
Location Description |
The entire service territory spans the Mid-Hudson Valley region of NY. In total, serving a geographic area of about 2,700 sq miles. Networks service portions of the City of Poughkeepsie, City of Newburgh, and City of Kingston. |
Network Organization |
There is no dedicated section for UG construction, it’s all a part of Distribution Engineering and Operations. UG network design and planning is performed by Engineers in the Distribution Engineering Division. Network equipment construction and maintenance performed by Splicing and Substation Technician crews who work on both network and non-network systems. |
Workers Represented by Collective Bargaining? |
Operation field forces are represented by the IBEW Local 320. Engineers are not represented by collective bargaining. |
Job Progression |
Field forces start as 3rd Class and are in that role for 24 months before testing into 2nd Class. The 2nd Class timeline is approximately 36 months before testing into 1st Class. After approximately 36 months in the 1st Class role, they are eligible to sit for a Working Foreman test. It’s a similar progression for all field forces. |
Number of Field Network Electrical Workers |
9 Splicers (not dedicate) 12 Substation (Relay) Technicians (not dedicated) 8 Equipment Operators (Rigging) (not dedicated) |
Number of Planners and Designers |
1-2 Engineers |
Annual Network Load Growth |
This is not tracked but the network load has always represented less than 1% of the total system load. |
Number of Distinct Secondary Networks Served |
3 separate networks. (1) the City of Poughkeepsie, (1) the City of Newburgh, (1) the City of Kingston |
Number of Spot Networks |
None |
Miles of MV UG cable in networks |
Approximately 12 miles |
Miles of LV UG cable in networks |
Approximately 203 miles |
Network Primary Operating Voltages |
4.16/2.4 kV and 14.4 kV |
Network Secondary Voltages |
125/216V grid networks |
Number of Primary Feeders Supplying each Network |
3 non-dedicated feeders per area network |
Design Contingency |
N-1 |
Number of Network Distribution Transformers |
40 total (29-3Ø network units, 11-banks of 3x1Ø units) |
Network Transformer Sizes |
167kVA(x3), 500kVA, 750kVA, and 1000kVA |
Network Protector Sizes |
1600amp, 2500amp, 3000amp |
Primary Cable Types |
PILC and EPR with flat strap concentric neutrals, PILC is being replaced by EPR. |
Primary Cable Sizes |
4/0 Cu is the standard |
Secondary Cable Types |
EPR is the standard but old VCL and old Rubber Braid still exist. |
Secondary Cable Sizes |
500 Cu mains, 500 Cu, 350 Cu, 4/0 Cu, and 1/0 Cu for services. |
Civil Construction |
Civil construction is contracted out to local companies. The contractor builds forms pours the duct banks in place. The manhole and pullbox structures are precast by another company and delivered to the site. |
Preventive Maintenance Programs |
|
Network Protector Inspection, Maintenance and Testing |
Visual inspections completed on a 5 year cycle, electrical and mechanical testing on a 6 year cycle. |
Network Transformer Inspection and Maintenance |
Completed on a 5 year cycle. |
Transformer Oil Testing |
None |
Vault Inspections |
Completed on a 5 year cycle. |
Vault Environmental Cleanup |
No cyclic programs but vaults are thoroughly vacuumed if work is occurring in them. |
Manhole/Pullbox Inspections |
Completed on a 5 year cycle. |
7.2.7 - Con Edison - Consolidated Edison
2008
| Name | Consolidated Edison (Con Edison) |
|---|---|
| Utility Type | Investor Owned |
| Website | |
| EPRI Contact | Frank Doherty
212-460-3342
|
| Number of Customers | 3.2 million |
| Population Service | 9.1 million |
| Location Description | The five boroughs of the city of New York, and Westchester County; Orange and Rockland Counties in New Jersey. Focus of EPRI was the boroughs of Manhattan and Brooklyn. |
| Network Organization | Dedicated network resources for network planning, design, construction, and maintenance. |
| Workers represented by collective bargaining? | Yes, Field Force is represented by IBEW. Manhattan – Local 12
Engineers are not represented by collective bargaining. |
| Automatic Mode of Progression? | Employees are not mandated to advance to a journeyman position within a given period of time. Employees can advance with time in grade, formal and on-the-job training, and testing. |
| Number of Network Customers Served | Manhattan – 699,831
Total – 2,364,000 |
| Number of Distinct Secondary Networks Served | Manhattan – 35 networks
Brooklyn/Queens – 18 Bronx – 6 Staten Island / Westchester – (some small networks) Total – 59 networks |
| Miles of Underground Cable | 94,000 miles, Manhattan 20,408 miles |
| Network Primary Operating Voltage(s) | 13.8 kV, 26.4 kV |
| Network Secondary Voltages | 125/ 216 V, with cable limiters
480Y/277, with cable limiters |
| Number of Primary Feeders Supplying Each Network | From 8 to 29 primary feeders supply each network.
(Average 16 feeders per network) All network feeders for a given network sourced from the same area substation. |
| Peak Load per Feeder | Peak load ranges from 60 to 400 MW |
| Design Contingency | N-2 in Manhattan, parts of Brooklyn and Queens, N-1 elsewhere |
| Number of Network Distribution Transformers | Manhattan 9,593
Brooklyn/Queens 11,654 Bronx/Westchester 4,643 Staten Island 263 Total 26,153 |
| Network Transformer Sizes | 500-2500 kVA |
| Network Protector Sizes | 2250 and 4500 amps @ 120 V; 5100 amp @ 265 V |
| Primary Cable Types | PILC (22%)
XLP EPR (current standard - used for new construction) |
| Primary Cable Sizes | Various, typically 750 or 1000 Kcmil for main lines at 13.8, with 2/0 to the transformers; 500 or 750 Kcmil for main lines at 27 kV with 2/0 taps to the transformers |
| Secondary Cable Sizes | Standard – 500 Kcmil |
| Civil Construction | Pre-cast and poured in place vaults |
| Total Company Peak Load | 13,141 MW, Summer 2006, 5404 MW - Manhattan |
| Annual Network Load Growth | 3-4% Manhattan |
| Preventive Maintenance Programs | |
| Network Distribution Equipment Inspection Includes inspection and maintenance of vault or manhole, and all equipment including network transformers, and network protectors |
Routine Inspection of 208 V vault with RMS (remote monitoring system) – 5 year cycle.
Routine Inspection of 208 V vault without RMS (remote monitoring system) – from 18 month to 3 year cycle depending on equipment age. (>25 years old, 18 month cycle) Routine Inspection of 460 V vault with RMS – 18 month cycle. Routine Inspection of 460 V vault without RMS – 18 month cycle – with test box. Non “routine” inspections performed more frequently depending on vault classification based on vault location, nature of customer, and equipment type, age, and condition. Non-routine inspection locations are predefined. |
| Network Protector Maintenance—with Test Box | Routine test box inspection of 208 V with RMS – not performed cyclically, inspection driven by other factors
Routine test box inspection of 208 V without RMS – 6 year cycle Routine test box inspection of 460 V without RMS – 18 months. Non “routine” inspections performed more frequently depending on vault classification based on vault location, nature of customer, and equipment type, age, and condition. Non-routine inspection locations are predefined. |
7.2.8 - Duke Energy Florida
2016
| Name | Duke Energy Florida – Clearwater | Duke Energy Florida – St. Petersburg |
|---|---|---|
| Utility Type | Investor Owned: Duke Energy Florida | Investor Owned: Duke Energy Florida |
| Web Site | ||
| Contact | Glenn Hilditch | Glenn Hilditch |
| Number of Electric Customers Total
Number of Electric Customers - Networks |
1,715,771 –Total in Florida
500 |
|
| Location Description | Clearwater, FL | St. Petersburg, FL |
| Network Organization | 3 | 5 |
| Workers Represented by Collective Bargaining? | 3 | 5 |
| Job Progression | Electric Apprentice (EA) to Network Specialist (NS) | Electric Apprentice (EA) to Network Specialist (NS) |
| Number of Field Network Electrical Workers | 3 | 5 |
| Number of Civil Construction workers | Normally Contracted | Normally Contracted
(5 Contractor Crews at time of immersion) |
| Number of Distinct Secondary Grid Networks Served | 1 True Network | 8 Spot Networks |
| Number of Spot Networks Service | 0 | 8 |
| Network Primary Operating Voltage(s) | 7200/12470 | 7200/12470 |
| Network Secondary Voltage(s) | 125/216 | 125/216
277/480 |
| Number of Primary Feeders Supplying each Network (Grids and Spots) | 3 | 7 feeders that supply downtown St Pete. All spot network locations fed by two feeders. |
| Design Contingency | N-1 | N-1 |
| Number of Network Distribution Transformers | 20 | 34 |
| Network Transformer Sizes | 500 | 500, 750 |
| Network Protector Sizes | 1600 & 1875 | 1600, 2500, 3500 & 1200 |
| Primary Cable Sizes | 4/0 | 4/0 and 1000mcm |
| Secondary Cable Sizes | 500 CU | 500 CU & 4/0 |
| Peak Network Load | ||
| Annual Network Load Growth | <1% | <1% |
| Preventive Inspection & Maintenance Programs | ||
| Network Protector Inspection | Done in conjunction with Vault Inspections
3 x per year to 6 x per year depending on vault criticality |
Done in conjunction with Vault Inspections
1 x per year |
| Network Protector Maintenance and Testing | Every 2 years | As needed based on inspection findings |
| Vault Inspections | 3 x per year to 6 x per year depending on vault criticality | 1 x per year |
| Network Transformer Inspection and Maintenance | Done in conjunction with Vault Inspections
3 x per year to 6 x per year depending on vault criticality |
Done in conjunction with Vault Inspections
1 x per year |
| Network Transformer Oil Testing | N/A Piloting dissolved gas monitoring sensor technology |
N/A |
| Vault Environmental Cleanup | 3 x per year to 6 x per year depending on vault criticality | 1 x per year |
| Manhole Inspections | Every 5 years | Every 5 years |
| Network Feeder Sectionalizing Switches (RAs) – inspection and exercise | 3 x per year | N/A |
7.2.9 - Duke Energy Ohio
2009
| Name | Duke Energy |
|---|---|
| Utility Type | Investor Owned |
| Website | |
| EPRI Contact | Jerry Ivey |
| Number of Electric Customers | Duke Energy Ohio – 685,000 |
| Location Description | Duke Energy Ohio network system serves the City of Cincinnati, Ohio and surrounding metropolitan area |
| Network Organization | Centralized, part of the Dana Avenue Construction and Maintenance Organization. |
| Workers represented by collective bargaining? | Yes |
| Automatic Mode of Progression? | Yes, a 4 year mode of progression to a Journey worker position |
| Number of Field Electrical workers | 46 |
| Number of Planners And Designers | 4 |
| Number of Distinct Secondary Networks Served | 4 distinct network systems, 120/208V |
| Network Primary Operating Voltage(s) | 13.2kV |
| Network Secondary Voltages | 120/ 208 V
277/480 V spot networks |
| Number of Primary Feeders Supplying Each Network | Three of the four networks in downtown Cincinnati are supplied by eight feeders, each, and the fourth network, by four feeders. |
| Design Contingency | N-1 |
| Number of Network Distribution Transformers | Total 414 |
| Network Transformer Sizes | Most common is size – 600 kVA Also use 750 kVA units |
| Network Protector Sizes | Most common, 2000A, 2825A |
| Primary Cable Types | PILC
EPR (network feeders) |
| Primary Cable Sizes | 750 cu EPR flat strapped neutral cable
4/0 cu EPR cable (without flap strapped neutral) 400 and 600 MCM PILC cables Duke Energy Ohio will pull three conductors bundled together through a single duct. |
| Secondary Cable Sizes | 500 cu EPR |
| Civil Construction | Use both precast and poured in place, depending on application |
| Peak Network Load | 170 MVA (1989 – 1990)
2009 Peak: 136 MVA |
| Annual Network Load Growth | In the network, load growth has been declining, driven by the implementation of a chiller system (by Duke) and end use efficiency. |
| Preventive Maintenance Programs | |
| Network protector drop tests | Weekly |
| Manhole inspections | Six year cycle |
| Vault inspections | Four times per year (quarterly) |
| Network transformer oil sampling | Four year cycle |
7.2.10 - Energex
2014
| Name | Energex |
|---|---|
| Utility Type | State-owned |
| Website | |
| EPRI Contact | Paul Rainbird, |
| Number of Electric Customers | 1.3 million residential, industrial, and commercial customers across a population base of around 3.1 million |
| Location Description | City of Brisbane |
| Organization | Energex has a Service Delivery organization that is organized geographically. Field resources assigned to the center(s) with responsibility for downtown Brisbane support the Central Business District. |
| Job Progression (Electrical Jointer) | 3 ½ Year jointer apprenticeship program, including formal training, testing, on the job training, and time in grade. In the first 18 months after completing the apprenticeship, participants must complete a "basket of skills" required by the electrical office. |
| Selected Job Classifications | Substation Technicians (work with sub breakers / relay protection)
Substation Fitter Mechanics (work with relay operated switchgear, and serve as rapid responders) Power Workers (Civil Work) Electrical Jointers (Cable work, splicing) Diagnostic Testing technicians Electrical Fitter Mechanics (Fully qualified electricians and “fitters1”) |
| Primary Operating Voltage(s) | 11 kV – Medium-voltage primary serving Brisbane |
| Secondary Voltages | 230/400 V, 50 Hz
Single Phase delivery range of 207 V to 253 V |
| Number of Primary Feeders Supplying Each Network | Normally three-feeder mesh |
| Design Contingency | N-1, including planning for a substation bus outage. |
| Number of Distribution Transformers | Approximately 40,000 system-wide |
| MV Transformer Sizes | Most common size – 60 or 80 mVA |
| Cable Population | Varied: PILC, XPLE, others |
| Primary Cable Sizes | The standard XLPE is a triplex cable, using stranded aluminum conductors (400 mm2). In areas of restricted conduit diameter, Energex uses XLPE insulated copper conductors (240 mm2). |
| Secondary Cable Sizes | 4 conductor bundled, jacketed, stranded sector H68 Aluminum, with XLPE insulation |
| Civil Construction | Primarily through contractors |
| Peak Network Load | Approximately 4000 MW |
| Preventive Maintenance Programs | Network circuit breaker
Network transformer Work depot inspections Substation inspections Customer substation inspections Vegetation management |
The term “Fitter”, refers to the mechanical aspects of a journey worker lineman, such as line construction.↩︎
7.2.11 - ESB Networks
2015
| Name | ESB Networks |
|---|---|
| Utility Type | Regulated monopoly |
| Website | http://www.esb.ie/esbnetworks/en/home/index.jsp |
| EPRI Contact | Michael Moran |
| Number of Electric Customers | 2.3 million electric customers in the Republic of Ireland |
| Location Description | ESB Networks UG Networks serves City of Dublin. |
| Network Organization | Meshed network in Dublin, radial distribution. |
| Workers Represented by Collective Bargaining? | Six separate unions. |
| Automatic Mode of Progression? | Through training and certification. Active recruitment internally and externally. |
| Primary Operating Voltage(s) | 10 kV – MV primary serving Dublin
20 kV – MV primary serving much or Ireland |
| Secondary Voltages | 230/400 V, 50 Hz
Single-phase delivery range of 207 V to 253 V in accordance with European Standard EN50160 |
| Design Contingency | N-1, including planning for a substation bus outage. N-2 in Dublin. |
| Number of Distribution Transformers | 253,000 |
| MV Transformer Sizes | Most common size – 400, 630, and 1000 kVA |
| Cable Population | 400 kV: 2 km
220 kV: 135 km 110 kV: 290 km 38 kV: 915 km MV (10/20 kV): 8000 km/1300 km (Note – Primary distribution system serving Dublin is 10 kV LV Mains : 10250 km |
| Primary Cable Sizes | XPLE, PILC in some locations |
| Secondary Cable Sizes | 4 x 185 sq mm Al LV mains cable for all new developments
35/25sq mm Al service cable standard |
| Civil Construction | Have poured in place, brick and mortar, and precast construction in the network. Current standard precast construction |
| Peak Network Load | 5100 MW (Ireland) |
| Annual Network Load Growth | The UG system across ESB Networks has expanded by 100% in the past 10 years. |
| Preventive Maintenance Programs | |
| Cable inspection | Quarterly. Looking at remotely monitoring sheathing. |
| MV substations | Once every four years |
7.2.12 - Georgia Power
2013
| Name | Georgia Power |
|---|---|
| Utility Type | Investor Owned |
| Web Site | www.georgiapower.com |
| EPRI Contact | Lee Welch |
| Number of Electric Customers | More than 2.4 million |
| Location Description | Metro Atlanta, Savannah, Athens, Columbus, Augusta, Valdosta, and Macon, Georgia |
| Network Organization | Network Group is self-contained operating unit within Georgia Power |
| Workers Represented by Collective Bargaining? | Yes. Some field workers, including Cable Splicers, Duct Line Mechanics, Winch Truck Operators (WTO), Journeymen |
| Automatic Mode of Job Progression? | Yes, with training objectives and testing: three-year progressions for WTO, Cable Splicers, and Duct Line Mechanics; training and progression for Senior Engineers |
| Number of Field Electrical Workers | Total Union – 72 workers
Cable Splicers – 28 in Atlanta, 3 in Augusta, 6 in Savannah Duct Line Mechanics – 12 |
| Number of Distinct
Secondary Networks Served |
35 networks in Atlanta |
| Network Primary Operating
Voltage(s) |
19.8 kV, 13.8 kV, 12.47 kV |
| Network Secondary Voltages | 120/208 V secondary grid; 277/480 V spot networks |
| Number of Primary Feeders
Supplying Each Network |
5, sometimes 6 feeders (about 40 mVA per network) |
| Design Contingency | N-1 |
| Number of Network
Distribution Transformers |
Metro Atlanta – 1533
Other (Outside Atlanta) – 506 Total - 2039 |
| Network Transformer Sizes | 500/1000 kVA at 208v; 500/1000/2000 kVA at 480v; C57.12.40 with some modifications |
| Network Protector Sizes | 1600/1875 Amp; 3000 Amp |
| Primary Cable Sizes | 300 MCM 3-conductor copper/paper/lead compact sector;350 MCM copper/EPR in some cases, but not aggressively replacing lead
1000 MCM copp/EPR 1000 MCM alum/XLPE |
| Secondary Cable Sizes | 2000 MCM copper, 600 V on secondary collector buses
500 MCM copper, 600v EPR on street mains 350 MCM copper, 600v EPR on street mains #4/0 copper, 600v EPR on street mains |
| Civil Construction | 17 crew members, including equipment operators |
| Peak Network Load | approx 700 MW |
| Annual Network Load
Growth |
New network in Buckhead area; downtown Atlanta flat; some new projects in Savannah (Note: new business has increased in all areas after this immersion visit) |
| Preventive Maintenance Programs | |
| Network Protector Inspection,
Maintenance And Testing |
5-year cycle, separate program from vault inspections |
| Network Transformer
Inspection, Maintenance And Oil Testing |
5-year, performed as part of vault inspections |
| Vault Inspections | 5-year cycle |
| Vault Environmental
Cleanup |
Cleaning trucks with oil socks; vacuum trucks with hazmat disposal |
| Manhole Inspections | 6-year cycle |
7.2.13 - HECO - The Hawaiian Electric Company
2009
| Name | The Hawaiian Electric Company |
|---|---|
| Utility Type | Investor Owned |
| Website | |
| EPRI Contacts | Charlyne Nakamura
(808) 543 - 7984 |
| Number of Customers | 293,740 |
| Population Served | 905,034 |
| Location Description | The Island of O’ahu, Hawaii, including the City of Honolulu |
| Network Organization | Dedicated organization for underground construction, operation and maintenance, including network and non – network underground systems. Underground Group does all network cable work, all work with lead cable in or out of the network, all fault locating. Substation group maintains network transformers and network protectors. (Note – HECO also has an “Overhead” group that works with poly cables in the 12 kV system, including cable pulling and splicing.) |
| Workers represented by collective bargaining? | Yes, Field Force is represented by IBEW, Local 1260
Engineers are not represented by collective bargaining. Load and Trouble Dispatchers are represented by IBEW. |
| Automatic Mode of Progression? | Yes, 3 years to Lineman First Year, 4 years to Journeyman.
In UG Group, the Cable Splicer position filled from Journeyman Lineman position. After one year as a Cable Splicer, with OJT, a person moves to a Senior Cable Splicer. Mode includes time in grade, formal and on-the-job training, and testing. |
| Number of Field Electrical workers | 20, work with network and non-network distribution. (Not including a percentage of the “Overhead” workforce that works with non lead underground cables, and substation workers who manage network equipment) Approximately 3 field electrical workers focus on the network |
| Number Of Network Planners And Designers | 1 Planning engineer works on Network Planning. This individual has non-network responsibility as well. |
| Number of Planners and Designers focused on Underground | HECO has 7 total distribution planning engineers that do all of the Overhead and underground planning. |
| Number of Network Customers Served | 1594. Most of downtown load in Honolulu is not served by the secondary network system. HECO uses a dual feed non-network service, with a throwover switch, to serve large customers |
| Number of Distinct Secondary Networks Served | Total – 7 networks, 208y/120 V secondary
27 spot networks with 480y/277 V secondary |
| Primary Distribution Operating Voltage(s) | 11.5 kV – Network
Non – Network 11.5 kV 12.47 kV 24.94 kV |
| Network Secondary Voltages | 120/ 208 V, with cable limiters
277 / 480 V Spot networks |
| Number of Primary Feeders Supplying Each Network | From 4 through 13 feeders supply the 7 HECO network areas. The secondary grid networks in these areas are each fed by four circuits.
All network feeders are sourced from the same area substation. |
| Design Contingency | N-1 including network and non network distribution. |
| Number of Network Distribution Transformers | Total – 140. |
| Network Transformer Sizes | 500-2000 kVA |
| Network Protector Sizes | 125/216V – 1200A -3000A
277.480V spots - 800A - 3000A |
| Primary Cable Types | PILC (installed plant, but no longer standard)
XLPE (Standard for new construction for non-network distribution. Not used in the network because of conduit size constraints) EPR (used in areas where a smaller cable diameter is required) |
| Primary Cable Sizes | Typically, 1000 Kcmil Al, 3-1/c (three singles, parallel wound) conductor XLPE for main runs
For network feeders, most installed cable is 3-1/c 750MCM PILC, and 301/c 4/0 PILC. Upon failure, the feeders are replaced with the 3-1/c cu EPR equivalent. |
| Secondary Cable Sizes | Network secondary cables are 3-1/c 500KCM 600V EPR with 1/c 4/0 BC neutral.
Non-network secondary cables are 2-1/c 350KCM Al 600V XLPE with 1/c 4/0 neutral triplexed for the secondary mains. |
| Civil Construction | Pre-cast vaults |
| Peak Network Load | 46MW |
| Preventive Maintenance Programs | |
| Manhole Inspection | Planned annual inspection and Amp readings of secondary limiters for network manholes
Non – network inspection frequency is being developed by C&M |
| Network Vault Inspection | Transformer vaults inspected as part of transformer and NP service and testing, every 2-3 years. |
| Network Protector Maintenance | Network Protector Service performed every 2 - 3 years |
| Network Transformer Inspection | Network Transformer Inspection performed every 2 - 3 years |
7.2.14 - National Grid (Albany)
2011
| Name | National Grid |
|---|---|
| Utility Type | Investor Owned |
| Website | |
| EPRI Contact | Rob Sheridan |
| Number of Electric Customers | The Albany network serves about 2786 customers. There are 10 customers fed by 11 spot networks and 1 dual fed customer through a padmounted switchgear on the 13.2kV general network feeders. There are 14 customers fed by spot networks and 2 dual fed primary customers on the 34.5 kV primary feeders. |
| Location Description | The National Grid Albany network system serves portions of the downtown Albany NY, |
| Network Organization | Part of the NY Underground Lines East, serving eastern NY state, including Albany. |
| Workers represented by collective bargaining? | Yes, IBEW in Albany. (National Grid also has resources represented by UWUA). |
| Automatic Mode of Progression? | Yes, 42 month year mode of progression to a Journey worker position. (C Cable Splicer, or C Maintenance Mechanic) |
| Number of Field Electrical workers – NY Eastern Division | 23 Cable Splicers
6 Maintenance Mechanics |
| Number of Field Non-Electrical workers – NY Eastern Division | 13 Mechanics
5 Equipment Operators 1 Machinist 1 Welder 3 Haz Mat Mechanics |
| Number of Distinct Secondary Networks Served | The UG group located in Albany (The NY Eastern Region) is responsible for networks in Albany (2786 custs), Troy (1583 custs), Schenectady (1,120 custs) and Glens Falls. (220 custs)
|
| Network Primary Operating Voltage(s) | Albany
Grid System (and some spot networks) 13.2kV Spot Network system 34.5kV |
| Network Secondary Voltages | 125/ 216 V grid and spots.
277/480 V spot networks |
| Number of Primary Feeders Supplying Each Network | Albany network fed by 10 dedicated 13.2 network feeders.
Spot networks fed by 5 34.5 kV feeders. (34.5 system feeds 277/480V spot networks only) |
| Design Contingency | N-2 |
| Number of Network Distribution Transformers | 251 |
| Network Transformer Sizes | 500 to 1000 kVA on the Grid; 500 to 2500 kVA on the spots. |
| Network Protector Sizes | Current Standard: 1200, 1875, 2825, 3500 Amps at 216Y/125V , 800, 1200, 1875, 2825, 3500 and 4500 Amps at 480Y/277V |
| Primary Cable Types | 13.2kV – PILC and EPR , concentric and flat strapped
34..5kV – PILC and EPR, concentric and flat strapped. EPR used as primary sections are replaced |
| Primary Cable Sizes | 1000 Cu, 750 cu, 500 cu, 350 cu (replaced with 500 cu as fails) |
| Secondary Cable Sizes | 500 Cu mains; 500 Cu, 4/0 Cu, and #2 Cu services
Lead and EPR with a Hypalon Jacket (Current standard) |
| Civil Construction | Use primarily pre cast construction |
| Annual Network Load Growth | Flat |
| Preventive Maintenance Programs | |
| Network Protector Maintenance And Testing | Five Years (Except for CMD protectors which are maintained on a two year cycle) |
| Network Protector Operational (Drop) testing | Annual |
| Vault Inspections | Annual |
| Manhole Inspections | Five Years |
7.2.15 - PG&E
2010
| Name | PG&E |
|---|---|
| Utility Type | Investor Owned |
| Website | |
| EPRI Contact | Bob Malahowski |
| Number of Electric Customers | 685,000 |
| Location Description | PG&E network system serves portions of the Cities of San Francisco and Oakland, California. |
| Network Organization | Part of the Maintenance and Construction (M&C) Electrical Network group, with resources in San Francisco and Oakland. |
| Workers Represented by Collective Bargaining? | Yes, IBEW. |
| Automatic Mode of Progression? | Yes, 30 month year mode of progression to a Journey worker position. (Cable splicer) |
| Number of Field Electrical workers | 17 , San Francisco (Cable Splicers)
3, Oakland |
| Number of Distinct Secondary Networks Served | 12 networks
|
| Network Primary Operating Voltage(s) | 12kV and 34.5kV |
| Network Secondary Voltages | 120/ 208 V Grid and spots.
277/480 V spot networks |
| Number of Primary Feeders Supplying Each Network | 10 are 12kV. Each individual networks fed by 6 dedicated network feeders.
2 are 34.5 kV- one fed by 4 feeders and one by 5 feeders. (34.5 system feeds 277/480V spot networks only) |
| Design Contingency | N-1 |
| Number of Network Distribution Transformers | 221 network units in Oakland.
1128 network units in San Fran. |
| Network Transformer Sizes | Most common is size – 500 and 750 kVA on the Grid. 1000 kVA spots. |
| Network Protector Sizes | Current Standard: 1875, 2825, 3500 Amps |
| Primary Cable Types | 12kV – PILC
35kV – XLPE, EPR (more recent standard) EPR used as primary sections are replaced |
| Primary Cable Sizes | 12kV - 750 cu, 500 cu, 250 cu, #2 cu
35 kV - 1100 Al, 700 Al, 350 Al, 1/0 Al |
| Secondary Cable Sizes | 1000 cu for transformer ties; 250 or 500 cu for the street mains. |
| Civil Construction | Use primarily poured in place construction in the network because of varying field conditions. Will use precast construction in other locations. |
| Peak Network Load | San Francisco – 300 mVA
Oakland - 68 mVA |
| Annual Network Load Growth | Flat since 2007. |
| Preventive Maintenance Programs | |
| Network Protector Inspection | Annual |
| Network Protector Maintenance And Testing | Three years |
| Network Transformer Inspection, Maintenance And Oil Testing | Annual |
| Vault Inspections | Annual |
| Vault Environmental Cleanup | Number of cleanups based on findings from annual vault inspection |
| Manhole Inspections | Three years |
7.2.16 - Portland General Electric
2022
The term CORE is used to describe the group that is responsible for the central Portland underground infrastructure, including the network. The term stems from this infrastructure being at the core of their downtown.↩︎
Name |
Portland General Electric |
|---|---|
Utility Type |
Public utility |
Web Site |
|
Contact |
John Watkins; John.Watkins@pgn.com Kenneth Atagabe; Kenneth.Atagabe@pgn.com |
Number of Electric Customers |
Approximately 1.9 million customers. The urban underground network in Portland, OR serves 2200 customers |
Location Description |
Networks in downtown Portland, serving a geographic area of about 1.5 mi2 (3.9 km2) |
Network Organization |
The network group operates as part of the Portland Service Center in the Eastern Region. This is referred to as the CORE 1. |
Workers Represented by Collective Bargaining? |
Yes, IBEW. |
Job Progression |
Journeyman Linemen enter the underground group as a Cable Splicer Assistant and advance to Cable Splicer after one year. The apprenticeship to become a journeyman lineman is a 3 ½ year mandatory progression with testing and training. |
Number of Field Network Electrical Workers |
There are currently 16 people working in CORE, including 4 non-journeymen, 11 journeymen (assistant cable splicers, cable splicers, foremen), and a Special Tester. |
Number of Distinct Secondary Networks Served |
Two substations serve five networks. Our 11kV networks were cutover to a 12.4 substation in 2019. One substation (Canyon. Open bus) supplies three area networks, and the other substation (Marquam. GIS ring bus built in 2019) supplies two area networks and has the capacity to source 5 total area networks. |
Network Primary Operating Voltages |
Both substations operate at 12.4 kV. |
Network Secondary Voltages |
125 kV/216 kV and 27 kV/480 kV (all spots) volt systems |
Number of Primary Feeders Supplying each Network |
Four |
Design Contingency |
N-1 (in some locations, can provide N-2) |
Number of Network Distribution Transformers |
280 |
Network Transformer Sizes |
500 kVA, 750 KVA or 1000kVA. For spot networks, transformers can be 500, 750, 1000, or 1500 kVA |
Network Protector Sizes |
1875 A, 2825 A and 3500 A |
Primary Cable Sizes |
PGE has a combination of in-service PILC and EPR insulated cable. The company’s current standard is to use EPR, and the company has a proactive lead cable replacement program underway. Standard size is 500 cu, with a flat strap neutral. The EPR cable is designed to fit conduits of less than 4 in. (10.2 cm) in diameter. (PGE installs three tri-plexed conductors.) PGE has 3.5 in. (8.9 cm) in clay tile ducts in many locations. |
Secondary Cable Sizes |
500 MCM diameter copper cables, and a reduced insulation 750 MCM |
Civil Construction |
Mostly external contractors |
Annual Network Load Growth |
Load growth in the network has been moderate. Most of the load gains are from load that was lost in 2020 when COVID forced most workers to work from home or businesses closing their doors. |
Preventive Maintenance Programs |
|
Network Protector Inspection, Maintenance and Testing |
Testing is annual for 480-V units and every two years for 216-V units. Maintenance is performed with the primary feeder energized and is accompanied by complete vault inspection |
Network Transformer Inspection and Maintenance |
An informal cycle is used, and is usually performed in conjunction with NP maintenance. We are currently working on a comprehensive maintenance plan for the UG Core. The project starts with taking an audit of all our Vaults and MHs. Then create a cycle for inspections and/or maintenance based on what is in the vault of MH. |
Transformer Oil Testing |
A four-year cycle is used, and is accompanied by complete vault inspection. |
Vault Inspections |
An informal cycle is used, and is usually performed in conjunction with equipment maintenance and testing. We are currently working on a comprehensive maintenance plan for the UG Core. The project starts with taking an audit of all our Vaults and MHs. Then create a cycle for inspections and/or maintenance based on what is in the vault of MH. |
Vault Environmental Cleanup |
Clean vaults as part of inspection. We are currently working on a comprehensive maintenance plan for the UG Core. The project starts with taking an audit of all our Vaults and MHs. Then create a cycle for inspections and/or maintenance based on what is in the vault of MH. |
Manhole Inspections |
An informal cycle is used, and is generally inspected every year. We are currently working on a comprehensive maintenance plan for the UG Core. The project starts with taking an audit of all our Vaults and MHs. Then create a cycle for inspections and/or maintenance based on what is in the vault of MH. |
The term CORE is used to describe the group that is responsible for the central Portland underground infrastructure, including the network. The term stems from this infrastructure being at the core of their downtown.↩︎
7.2.17 - SCL - Seattle City Light
2007
| Name | Seattle City Light |
|---|---|
| Utility Type | Municipal |
| Website | http://www.ci.seattle.wa.us/light/ |
| EPRI Contact | Hamed Zagehgol, P.E.
206 233 2186
|
| Number of Customers | 375,000 |
| Population Service | 738,000 |
| Location Description | The city of Seattle, WA, and surrounding area. |
| Network Organization | Dedicated network resources for network planning, design, construction and maintenance. |
| Workers represented by collective bargaining? | Yes, Field Force is represented by IBEW, Local 77, and Engineers are represented by IFPTE, Local 17. |
| Automatic Mode of Progression? | Yes, transition from apprentice to journeyman Cable Splicer in three years. |
| Number of field electrical | 87 |
| Number of field Civil | 36 |
| Number of network planners and Designers | 23, (8 System, 8 Service Engineers, and 7 IT support individuals for their NetGIS system) |
| Total Network Employees | 146 |
| PHYSICAL / GENERAL INFORMATION | |
| Number of Network Customers Served | 22917 meters |
| Number of distinct secondary networks served | 15 “Sub – networks” (a sub-network is an isolated secondary network usually sourced by six primary feeders) |
| Network primary operating voltage(s) | 13.8kV, 26.4kV
Downtown networks (12 subnets) supplied at 13.8 kV First Hill and University District networks supplied at 26.4 kV |
| Network Secondary voltages | 208Y/120, with cable limiters
480Y/277, with cable limiters |
| Number of primary feeders supplying each network | 6 primary feeders per each sub network.
(3 sub networks are sourced by less than 6 feeders) All network feeders for a given network sourced from the same substation. |
| Design Contingency | N-1 |
| Number of Network distribution Transformers | Approx 1200 |
| Network Transformer sizes | 500-2500 kVA |
| Network Protector Sizes | 1875 – 4500 Amp |
| Primary Cable Types | PILC ( 8 %)
XLP (majority of the installed cable) EPR (Used for new construction at 13kV) |
| Primary Cable Sizes | Various, from AWG #4 to 1000 kcmil cu |
| Secondary Cable Sizes | Various, from AWG #2 to 750 kcmil cu |
| Civil Construction | Precast vaults (for new vaults other than locations where it is not possible – in these, use concrete poured in place) |
| Total Company Peak Load | 2025 MW |
| Peak Network Load | 339 MVA |
| Annual Network Load Growth | .9% Company load growth
2-2.5% Local Network Growth |
| Preventive Maintenance Programs | |
|
4 year cycle, includes manhole inspection, switch maintenance, transformer maintenance |
|
4 year cycle, performed independently of the feeder maintenance program, primary feeder remains energized |
7.2.18 - Tampa Electric
2022
Name |
Tampa Electric |
|---|---|
Utility Type |
Investor-Owned Utility |
Web Site |
|
Contact |
Scott Hartlage / Travis Ammann |
Number of Electric Customers |
Approximately 700K customers. The urban underground network in Tampa serves 50 buildings / vaults |
Location Description |
Networks in downtown Tampa, FL, serving a geographic area of about 0.45 mi2 |
Network Organization |
CSA Network Operations Installs, Troubleshoots, Locates Faults, Repairs, and Maintains Network Txs, Network Protectors, Primary & Secondary Cable, PILC Splices, Switches/Switchgears, Transition Modules, and Viso Blocks. |
Workers Represented by Collective Bargaining? |
19 |
Job Progression |
4 ½ year apprenticeship to become a Network Specialist. |
Number of Field Network Electrical Workers |
9 Network Specialists and 9 Apprentice Network Specialists |
Number of Planners and Designers |
4 |
Annual Network Load Growth |
0 |
Number of Distinct Secondary Networks Served |
5 Distinct Secondary Networks |
Number of Spot Networks |
22 |
Miles of MV UG cable in networks |
|
Miles of LV UG cable in networks |
|
Network Primary Operating Voltages |
13.2 kV |
Network Secondary Voltages |
480Y/277 Spot, 208Y/120 Spot, 216Y/125 Grid |
Number of Primary Feeders Supplying each Network |
6 |
Design Contingency |
N-1, N-2 |
Number of Network Distribution Transformers |
93 |
Network Transformer Sizes |
500 kVA, 750 kVA, & 1000 kVA for 216V Grid 1000 kVA for 208V Spot,750,1000,1500,2000,2500 kVA for 480V Spot |
Network Protector Sizes |
1200A,1600A,1875A,2000A,2500A,3000A,3500A |
Primary Cable Types |
PILC / TR-XLPE / EPR |
Primary Cable Sizes |
#2 PILC,350,500,&750 MCM PILC,4/0 ALJCN TR-XLPE & 500 MCM EPR |
Secondary Cable Types |
TR-XLPE |
Secondary Cable Sizes |
500 MCM CU |
Civil Construction |
Indicate whether civil construction is performed by in house or contractor resources. Developer or Contractor Also indicate whether UG structures are typically precast, or poured in place. Poured in Place |
Preventive Maintenance Programs |
|
Network Protector Inspection, Maintenance and Testing |
Yes, annually. |
Network Transformer Inspection and Maintenance |
Yes, annually. |
Transformer Oil Testing |
No. |
Vault Inspections |
Yes, annually and infrared just before entering a vault. |
Vault Environmental Cleanup |
Yes, when needed. |
Manhole Inspections |
Yes, annually and infrared just before entering a manhole. |
List any other preventive maintenance programs |
|
7.3 - Construction
7.3.1 - Account Management-Scheduling
7.3.1.1 - Portland General Electric
Construction & Contracting
Account Management - Scheduling
People
The Planning and Scheduling Department is responsible for assigning work to crews, scheduling projects, and ensuring efficient usage of human resources.
Process
Scheduling: PGE moved from an all-paper system to a work management system using Maximo. All the work provided to the crews is scheduled in Maximo and sent to the field through electronic field devices. Early in the adoption of this system, PGE experienced a learning curve. Some work orders became lost, and workers struggling to utilize the new system. An intensive information technology (IT) training program targeted to field workers rectified these challenges.
Until about two years ago, the CORE area was “siloed” in that the CORE group management made scheduling decisions without involving other organizations. CORE work now passes through the Planning and Scheduling Department, which looks at resourcing and scheduling across the company. PGE tracks work using metrics.
One unique restriction on work scheduling in the CORE is that during the Portland Rose Festival, the city limits the number of permitted road closures and PGE’s access to network infrastructure.
Technology
PGE uses IBM’s Maximo for Utilities 7.5 system for work management, and the system supports all work types. The system allows users to create detailed work estimates and manage field crews. Maximo can integrate with a number of systems, including fixed-asset accounting, mobile workforce management solutions, and graphical design systems. The Maximo Spatial system is compatible with map-based interfaces, such as ESRI ArcGIS, and follows J2EE standards [1].
Maximo for Utilities supports estimating compatible units (CUs) and managing field crews. With the support of a CU library, planners and designers can estimate CUs when creating a project, and users can manage crews and track crew type and composition [2].
[1] T. Saunders, J. Souto Maior, and V. Garmatz. “IBM Maximo for Utilities.” IBM, 2012. ftp://ftp.software.ibm.com/software/tivoli_support/misc/STE/2012_09_11_STE_Maximo_for_Utilities_Upgrade_Series_v4.pdf (accessed November 28, 2017). [2] IBM. “IBM Maximo for Utilities, Version 7.5.” IBM.com. https://www.ibm.com/support/knowledgecenter/en/SSLLAM_7.5.0/com.ibm.utl.doc/c_prod_overview.html (accessed November 28, 2017).
7.3.2 - Cable Installation and Replacement
7.3.2.1 - AEP - Ohio
Construction & Contracting
Cable Installation / Cable Replacement
People
Electrical work with network infrastructure at AEP Ohio, including cable replacement, is performed by Network Mechanics, which is a bargaining unit position responsible for performing all network construction and maintenance activity, including cable pulling, cable splicing, and network equipment construction and maintenance. Organizationally, network field resources are centralized, with the field resources who work with the Columbus networks reporting out of one service center, and resources who work with Canton networks reporting out of another. These service centers are led by a supervisor, and consist of Network Crew Supervisors, the front line leadership position, and the Network Mechanics. Organizationally, the service centers are part of Regional Operation reporting ultimately to the Vice President of Distribution Regional Operations.
Project work orders, repairs, and maintenance are scheduled and dispatched from the Service Centers. Some replacement is outsourced to contractors, working alongside AEP Ohio field crews.
At the time of the practices immersion, AEP had embarked upon a system-wide effort to replace selected secondary network cables to improve the reliability of the network infrastructure, with each operating company deciding what parts of the network infrastructure should be targeted for replacement. This work is being performed primarily by contractor resources.
In addition, AEP Ohio is proactively replacing selected primary network cables primary cables in high risk and congested areas.
Process
After a number of incidents involving fire in manholes caused by faulty secondary cables, AEP Ohio performed a risk assessment of its secondary network infrastructure to identify what part of the cable fleet should be considered for replacement. The comprehensive assessment of the secondary cable system included the following:
- On-the-ground inspection of cables s by camera during cable fire investigations
- Scientific modeling of the existing secondary cable and its loads
- Load flow models to identify cables that are overloaded or nearly fully loaded
- Examination of failed secondary cable at AEP Ohio, as well as outside testing by a third party consultant.
As a result of these studies, AEP Network Engineers found that existing styrene butyl cable was primarily responsible for the incidents that had occurred in the system. Analysis found that its insulation breaks down due to overheating and may produce combustible gases. These gases may contribute to manhole fires.
AEP has decided to replace the entire butyl cable fleet, prioritizing the effort based on various factors including visual inspection and load analyses performed by Network Engineering.
In addition, AEP Ohio has found that while secondary lead cables fail infrequently, when they do fail, they can result in a hot fire, which can potentially threaten other cables in the duct lines. Therefore, lead cables are also scheduled for replacement under this revitalization and refurbishment project.
AEP Ohio had initially prioritized the secondary cable replacement according to conditions and loads as shown on Figure 1. Subsequent to the EPRI practices immersion, AEP has since updated the risk model for mitigation of secondary network cable failures to a 12 step model.

Figure 1:
AEP Ohio mitigation and prioritization strategy for secondary cable replacement
The cable replacement project, totaling $300 million, will ultimately replace nearly 60,000 feet of secondary cable at AEP Ohio. The Network Engineering Supervisor meets weekly with service center leadership to review the progress of the secondary cable replacement effort in Columbus and Canton. AEP has a protocol in which if any area becomes more than 20% behind schedule, the rationale for the schedule must be shared with an officer of the company who becomes involved in developing a solution. At the time of the immersion, the project was ahead of schedule at AEP Ohio (see Figure 2).

Figure 2:
Target and actual secondary cable replacement curves for AEP Ohio
From its experience, some of the potential challenges have been:
-
Identifying and assuring adequate crew leadership for both company and contractor crews.
-
Weather can adversely impact schedules.
-
Choice of crab and size of crab support, based on limited manhole size and desired mounting orientation.
Secondary butyl and other cable types are being replaced with 750 cu EAM insulated cables. The 750 EAM cable was chosen by the engineers because it is the largest sized cable that will fit in the current duct lines (3 ½ inch) and has the capacity and thermal rating required by the network. The older butyl cable was rated at 70 degrees C, whereas the 750 EAM is rated at 90 degrees C (see Figure 3). AEP seeks to maximize the use of duct space, including keeping open ducts available for communications. Figure 4 shows new secondary cables being installed.

Figure 3:
750 cu EAM secondary replacement cable rated"

Figure 4:
New secondary cables being installed
For network primary cables, AEP Ohio design criteria specify that there cannot be more than two circuits supplying any one network in the same manhole. For distribution (non-network) circuits, the company limits the number of circuits in any one manhole to three. AEP engineers reviewed circuit maps to identify congested locations in the network and initiated targeted projects to modify construction to adhere with the criteria.
Technology
AEP Ohio uses cable ratings and load flow analysis in CYMECAP and CYME SNA to identify overloaded cables and cable designs that are due for replacement. The AEP Ohio NEED database is used to record and track all serialized assets and cables, including on-site inspection of cables that are deemed in need of replacement. Once cable is replaced it is updated in the AEP mapping systems and in the Smallworld GIS system for company-wide access.
AEP has sent cable samples for testing (to both internal and external laboratories) to better understand the condition of selected cable populations. Figure 5 shows an AEP Ohio cable pulling truck.

Figure 5:
AEP Ohio cable pulling truck
7.3.2.2 - Duke Energy Florida
Construction
Cable Installation / Cable Replacement
People
Duke Energy Florida has a formal primary cable replacement program in place, which includes replacement of cables for both network and non-network feeders. The St. Petersburg and Clearwater replacement program is a two-year program, with a goal to replace 60,000 feet of older cable per year in the South Coastal Region.
The cable replacement is being performed by contractor crews (six people), who are performing the complete installation, including cable pulling and cable splicing. The crew is on a two-year contract, working on 35-40 cable pulling locations that involve network infrastructure. The contractors provide all equipment, such as cable pulling gear, heavy trucks, etc. The crews start the workday at a remote mustering point, and report to a Duke Energy Network Specialist who has been temporarily appointed to provide contractor oversight. Because of the size of the project, it is also being managed by the Resource Management group, who meets twice per month with the contractor for progress updates.
In addition to the cable replacement program, Duke Energy Florida network crews are replacing secondary mole connections throughout the Clearwater and St. Petersburg network system for network hardening. Duke Energy Florida has proactively targeted replacement for older mole connections in manholes prone to long periods of time underwater. Duke Energy Florida has found that these secondary cable mole connections are subject to bloating and cracking over time.
Process
One driver for the cable replacement program was that the company had experienced a high amount of faults on older cables due to a deterioration of the metal type center plug used at T-body connections. The standards group decided to replace the metal type body center plugs and cable to harden the underground network system. Figure 1 shows a typical center plug with a metal ring used on the Duke Energy Florida network system.

Figure 1:
Center plug with metal ring
Historically, Duke Energy Florida’s cable design called for the use of T-bodies (600A separable connectors) for both straight as well as Y and H splices, so that cables could be easily separated for fault locating, maintenance and for future system enhancements. Historically, the center plugs used in the T-bodies were designed with an exposed metal ring which was prone to deterioration / corrosion with age and with prolonged submersion in water. Figure 2 shows a crack on a failed center plug with a metal ring.

Figure 2:
Crack in failed center plug
Recognizing they had a high concentration of cables with the T-bodies with the suspect center plug component in downtown St. Petersburg, and that the cables were of an older vintage (early 1980s) nearing the end of the cable life, Duke Energy Florida elected to perform a targeted cable replacement, rather than solely replace the center plugs associated with T bodies. Figure 3 shows the replacement center plugs currently being installed. Figure 4 shows a close up of the Elastimold center plug without an exposed metal body.

Figure 3:
Replacement center plugs

Figure 4:
Close-up, replaced plug, no metal exposed
Duke Energy Florida noted that it is virtually impossible to just replace the center plugs, because before unbolting and parting the cable, their process calls for spiking the cable to confirm that it is de-energized, thus damaging additional infrastructure that must be replaced. When they encounter a vault or manhole that contain T-bodies with the older center plugs, they will not enter the hole while the cable is energized. They will schedule for replacement, sectionalizing to de energize and isolate the section, before performing replacement with new components.
Duke Energy Florida has already identified approximately 43 locations with T-body connections with the older style center plugs to be replaced. At most of these locations, the T-bodies are submerged. Their experience has shown failures often occur after the water is removed. The primary reason for the failure is because the water serves to pass the electrical stresses across the center plug. After the water is removed, the plugs tend to fail because of additional electrical stress on the plug.
Duke Energy Florida is also performing a further assessment in the other portions of its service territory to identify other cable populations that may also be built with T-bodies with the metal ringed center plug component, in order to determine whether to expand the replacement program.
Technology
Duke Energy Florida is installing Elastimold K651CP connecting plugs as replacements for the older metal body T plugs previously used. The Elastimold K651CP is a deadbreak connector that can be removed when the cable is energized to facilitate work on the connected cable.
7.3.2.3 - ESB Networks
Construction & Contracting
Cable Installation / Cable Replacement
People
Cable installation at ESB Networks is performed by Network Technicians, the journey worker position. The Network Technician is a mutli-faceted position, performing both line work, such as building pole lines, and electrical work, such as making connections at a transformer. Network Technicians work on all voltages from LV through transmission voltages (110 kV). Note that ESB Networks created the Network Technician position in the 1990s by combining a former Line Worker position and Electrician position.
Work specialization for Network Technicians is by assignment. In Dublin, where the majority of the distribution infrastructure is underground, Network Technicians work mainly as cable jointers, installing underground cables and accessories. ESB Networks rotates Network Technician work assignments as business needs require.
Much of the cable installation and replacement in the ESB Networks underground network is performed by contractors. In the past, graduate student engineers were used on line work, but this has become far less frequent in recent years. Otherwise, cable replacement and installation is performed by Network Technicians, who work on all cable voltages.
ESB Networks has a four-year apprentice training program for attaining the journeyman Network Technician position. Network Technicians who worked as cable jointers work closely with both the Training group and the Asset Management groups at ESB Networks. Network Technicians readily bring information about problems with particular cable joints back to these groups.
The Training and Underground Networks group within the Assets & Procurement organization share the process of performing forensic analysis of failed joints and in preparing the failed component summary reports. Within both groups, ESB Networks has significant cable/cable accessory expertise. Both groups work closely with Network Technicians to ensure that they understand the science of cable joints and have an appreciation for the importance to long-term joint reliability of performing the proper steps associated with cable joint preparation.
Process
ESB Networks has installed significant amounts of MV (10-kV and 20-kV) cables over the past 10 years. Thirty-four percent of the total in-service MV cable has been installed in the past few years. Most of this installation has been outside of Dublin, in both rural and urban areas. Figure 1 shows the total amount of installed MV cable from 2000 to 2012.

Figure 1:
Installed MV cable
ESB Networks has also installed significant amounts of LV cables – used for their LV network mains. Thirty-seven percent of the total in-service LV network cables have been installed within the past seven years (statistic includes replacement of cables). Figure 2 shows the total amount of installed LV cable from 2000 to 2012.

Figure 2:
Installed LV cables
Technology
ESB Networks has embarked on a five-year cable replacement program and is spending €11.4M on replacing oil filled cables and terminations due to higher than acceptable failure rates in recent years. The company is also replacing lead cable by retrofitting 38 kV PILC cables with XLPE, especially within the business district.
ESB Networks’ approach in developing its replacement plan includes determining ESB Networks’ overall risk profile, comparing age versus performance of cables older than 65 years. In all, ESB Networks will replace 18 km of cables that are the critical feeds for the city. ESB Networks estimates this replacement will reduce the risk of failures by approximately 50 percent. As part of its replacement program, ESB Networks is also targeting older (pre-1982) XLP insulated cables, as this cable had been experiencing an average of eight faults per 100 km.
7.3.2.4 - Georgia Power
Construction & Contracting
Cable Installation / Cable Replacement
People
Georgia Power utilizes a combination of PILC cable and EPR insulated cable in its Atlanta network. They continue to use lead cable in some locations where they may be limited by conduit size, or locations where they may require a Y splice in a limited space. However, the company is increasing its use of EPR cable for new installations where practical.
Note: in Savannah, Georgia Power has replaced its lead secondary cable with EPR insulated cable.
Cable replacement is supervised by a senior engineer in the Network Underground group. Senior Cable Splicers within the group perform any needed cable replacement.
The Georgia Power Network Underground group has not historically performed routine diagnostic testing of network cables other than fault location testing and some proof testing after cable repair. Therefore, cable is replaced on an as-needed basis as determined by inspection, cable failure, or on recommendation of the supervising engineer.
Process
Because of its durability and space constraints in older duct lines Georgia Power is maintaining the use of lead cables in its four-inch duct lines and wherever it is currently performing well (See Figures 1 through 3.). If a lead cable fails in a larger duct or a manhole with room to accommodate newer EPR cable splicing, the group will replace the lead with EPR insulated cables and accessories. (Georgia Power engineers noted that an EPR-type Y-splice at 20kV takes up virtually all the wall space in the manhole at most locations, and thus reduces their flexibility for future expansion. A lead Y splice is far more compact.)

Figure 1:
Lead cable joints

Figure 2:
Lead cable joint preparation

Figure 3:
Lead secondary cables - Atlanta
The Network Underground group is concerned that there is only one domestic source for its lead cable, and thus may become more aggressive in the future in replacing lead, particularly if a smaller form-factor EPR proves reliable (See figure 4.).

Figure 4:
EPR secondary cables - ring bus, Savannah
Technology
Georgia Power‘s lead cable system is extremely reliable. They establish performance goals for cable in terms of cable failures per year. For example, the goal for 2013 was to have no more than 23 cable failures. Cable failure performance is tied in with the overall performance management process at Georgia Power.
The utility industry is moving away from the use of lead-covered cables because of limited availability, environmental concerns, and complex splicing and terminating requirements. GPC’s Network Underground group is actively researching and testing other cable types as a replacement for lead. They are using more solid-dielectric cable at medium and low voltage. New and improved cold-shrink splices and terminations are being evaluated and will accelerate the move toward solid-dielectric cable
7.3.2.5 - Portland General Electric
Construction & Contracting
Cable Installation / Cable Replacement
People
PGE has a proactive cable replacement program aimed at replacing PILC primary network cables with EPR insulated cables.
Three Distribution Engineers focus on both the networks and non-network infrastructure in the CORE. The engineers provide technical data and perform risk assessments used for the Strategic Asset Management Program, which evaluates the economic benefits of programs, such as cable replacement.
The CORE underground falls within the Portland Service Center (PSC). The resources focused on the CORE are responsible for both non-network (radial) underground and network systems. The CORE resources perform cable replacement.
Process
The PILC network cable replacement program is part of an initiative called the Performance Improvement Assessment (PIA), which utilizes detailed root-cause analyses performed by the Network Engineers to drive actions to improve performance. The scope of the program is to replace all current lead primary feeders with EPR insulated cables. PGE is focusing on replacing primary cables before moving towards a proactive secondary lead cable replacement program planned for the future. PGE often performs lead cable replacement at night because of city restrictions on closing the streets during the day.
As part of its Strategic Asset Management Program, in 2013, PGE developed an economic lifecycle model to evaluate cable, using data gathered by crews over the past 40 years. This supported a model that used the correlation between age and insulation type, which recommended a program of replacement and/or injecting XLPE cable.
PGE assessed that targeted cable replacement would improve reliability by removing a significant risk posed by aging cable. As part of a strategic asset management program, PGE’s model evaluated approximately 11,300 conductor miles (18,185 km) of cable and determined which sections were most likely to experience failure. After this, the model determined which areas would cause the most disruption according to loading and/or customer numbers. In total, PGE has replaced 203 conductor miles (327 km) of cable [1].
Note that the use of the economic lifecycle model described above has not yet been applied to network cables. Because the replacement of lead cables in the network was already occurring from the PIA, the Strategic Asset Management Group deferred inclusion of an analysis of network cables in the economic lifecycle model though it still plans to include it in the program.
PGE does not presently perform any routine diagnostic cable testing on the network. In the past, they have performed some diagnostic testing on primary network cables crossing the river. Before commissioning new cable or returning a de-energized primary circuit to service, crews perform a direct current (DC) high potential (hipot) test. Very low frequency (VLF) testing is performed on the getaway cables at substations. PGE is not performing a tan delta test.
Technology
For connecting lead cable to EPR, PGE uses Raychem Transition Splices. Although the company prefers pulling EPR all the way, that is, fully replacing the lead cable with EPR insulated cable, the Raychem splices are used if this is not possible.
Before cutting a cable, crews test it using a device called a hummer to verify its de-energized state. If the cable is energized, the device will “hum” significantly [2]. Note that use of the hummer is not foolproof. PGE relies on a combination of maps, tags, and the hummer device to identify de-energized cables. The standard work practice is to cut a cable remotely by placing a “guillotine” cutter on the cable and activating it from outside the vault.

Figure 1:
A “hummer” to verify the de-energized state of a cable
- Smart Grid Report. Portland General Electric, Portland, OR: 2017. http://edocs.puc.state.or.us/efdocs/HAQ/um1657haq16327.pdf (accessed November 28, 2017).
- D. Johnson, BIS Consulting, “A stepwise approach to building a cable program.” Presented at the WEI Operations Conference, Newport Beach, CA (April 19, 2017). https://uploads.westernenergy.org/2017/05/05103408/EAM_Thu_1000_1of2_Johnson_WEI-2017-Underground-cable-program-draft-032617.pdf (accessed November 28, 2017).
7.3.2.6 - References
EPRI Underground Distribution Systems Reference Book (Bronze Book)
7.3.3 - Cable Pulling
7.3.3.1 - Ameren Missouri
Construction & Contracting
Cable Pulling
People
Cable pulling at Ameren Missouri is normally performed by underground construction resources within the Underground Construction group, led by a Construction Superintendent. The Underground Construction group is part of the Underground Operations Center.
The Underground Construction group is comprised of Cable Splicers, Construction Mechanics, and Assistant Journeymen, a new position at Ameren Missouri that combines the duties of Construction Mechanics and Cable Splicers. The group also has a Utility Worker classification, an entry level position from which Cable Splicer and Construction Mechanic positions are filled. Cable Pulling can be performed by any of these classifications, and is sometimes contracted.
Cable pulling design, including calculation of pulling tensions, is performed by Estimators (Energy Services Consultants) or engineers, part of the Division Engineering group. Note that most cable runs in downtown St. Louis are relatively short; thus, the calculation of cable pulling tensions is not required.
Process
Ameren Missouri estimators perform cable pull calculations using in-house cable pulling software based on Excel. Most cable runs in downtown St. Louis are so short, that the calculation of cable pulling tensions is not required. However, estimators noted that they periodically must perform pulling calculations for installations where services are being pulled from the street grid into a building, as these services utilize 600 V secondary network cable with a rubber jacket that tends to create more friction, and increases sidewall bearing pressure. In these situations, installation crews must work at a low enough winch speed to prevent damage to cable or conduit.

Figure 1:
Cable trailer
Technology
Ameren Missouri is using an in - house, Excel based software to perform cable pulling calculations. This in – house software is based upon the Ameren Missouri engineering design standards, and allows the estimator to enter known variables to calculate safe tolerances for cable pulling. For example, the Excel spreadsheet allows the user to select the cable and conduit types, the number and severity of bends, and the coefficient of friction estimates for the pulls. Note that Ameren Missouri is considering acquiring the DSTAR (Distribution Systems Testing, Application and Research program) Cable Pulling Assistant.
Ameren Missouri is using a reduced wall cable design so that they can utilize older, narrower ducts for cable replacement, avoiding the cost of installing bigger conduits to handle thicker conventional diameter insulated cables. See Cable Design
Ameren Missouri is using the OK Champion Cable Scrapper truck to remove, and cut abandoned cable.

Figure 2:
OK Champion Cable Scrapper
7.3.3.2 - CEI - The Illuminating Company
Construction & Contracting
Cable Pulling
People
Cable pulling is performed by the UG Electricians who work in the Underground Network Services Department.
Process
In most cases, CEI is not performing any cable pulling calculations to determine pulling tensions, nor using a dynamometer to monitor the tension of a pull. They design their pulls so that they are well within the tolerances of the cable and “pull the cable not to break it”, using their experience. They will only use a dynamometer to monitor tension very large cable pulls.
Technology
When CEI does calculate pulling tensions, they do so manually. CEI corporate Design Standards is currently evaluating a piece of software for performing cable pulling calculations, sidewall pressure, etc.
CEI uses specialized cable pulling trucks to facilitate cable installation.


Figure 1 and 2:
Cable pulling truck
7.3.3.3 - CenterPoint Energy
Construction & Contracting
Cable Pulling
People
Cable pulling at CenterPoint is performed by the Cable Splicers who work in the Cable Group of the Major Underground department.
Process
In most cases, CenterPoint is not performing any cable pulling calculations to determine pulling tensions, nor using a dynamometer to monitor the tension of a pull. Years ago they used to calculate pulls and use the dynamometer and found that their pull designs are well within the tolerances of the cable. They will only use a dynamometer to monitor tension on very large cable pulls.
CenterPoint typically uses a partitioned reel for a standard three phase installation. They will pull the cable off of a master reel onto the partitioned reel. For a new installation, they will typically pull three conductors through a six inch pipe.
A typical cable pull involves a five man crew. At one end, three men are stationed with the cable reel which is loaded onto a trailer. During the typical pull, one man is located outside the hole controlling the pay out of the cable, one man is in the hole directing the cable into the conduit, and the third man is applying a lubricant to the cable. At the other end, there is a two man crew with the cable pulling truck; one man controlling the winch line and monitoring the tension, and the other, the crew leader.

Figure 1:
Cable Pulling Truck

Figure 2:
Cable Pull

Figure 3:
Cable Reel Trailer Note Partitioned Reel

Figure 4:
Cable Reel Trailer Job site

Figure 5:
Bucket of cable lubricant, from American Polywater© Corporation
At the end of the pull, because of the length of the pulling apparatus attached to the grips, the cable may not be in position to be put on the cable racks. Therefore, just before the end of the pull, the Cable Splicer will lash a nylon flat strap, around the cable in order to pull the cables into final position.

Figure 6:
Cable Splicer applying nylon straps for final pull

Figure 7:
Final pull before racking cable

Figure 8:
Pulled in cables, racked (top)
7.3.3.4 - Con Edison - Consolidated Edison
Construction & Contracting
Cable Pulling
People
Construction Group
Con Edison’s service territory consists of four regions: Manhattan, Brooklyn/Queens, Staten Island, and Bronx/Westchester. The Manhattan Region is made up of three districts, including one headquartered at the W 28th St. Work Out Center. The term Work Out Center refers to a main office facility to which field construction and maintenance resources report.
The construction department consists of several groups, including the Cable Group, responsible for pulling and retiring cable.
Process
Conduit Size Restriction
One challenge that Con Edison faces is trying to expand capacity given the space limitations of and damage to existing duct bank systems. In some locations, spare ducts might be crushed or blocked. In others, the size of the spares is not adequate to pull through the necessary cable to meet loading. For example, in a design where 750 MCM cable is called for, Con Edison might have to consider running double 500s because the 750 cannot fit in the 10.16-cm (4-in.) spare conduit. The Brooklyn Operation Center noted that about 10% of their ducts are crushed. In Manhattan, the number of crushed ducts is significantly higher, at 45 – 50%.
In some cases, Con Edison bifurcates the feeders; that is, breaks the feeder into two sections outside the station in order to adjust to the limited space considerations and add reliability. In this design, Con Edison installs SF6 switches with fault indication outside the station, protecting each leg of the bifurcated feeder. In a feeder lockout, this enables them to isolate the faulted section and pick up the rest of the load. (See the pictures below for a photograph of a Con Edison 600-A, 27-kV Rated, SF6 gas-insulated submersible sectionalizing switch.)


Cable-Pulling Duct Preparation
One big challenge that Con Edison faces is obstructions in the ground. Crews often find that ducts have collapsed or are obstructed. These obstructions can be due to foreign utilities or vibrations from the subway that over the years cause ducts to collapse. In Manhattan, crews encounter obstructions in 45 – 50% of their projects.
Prior to installing cables in conduits, Con Edison has a defined set of operations that are performed on the conduit systems.
These operations include:
-
Rodding the ducts to establish that a clear passage exists through the conduit between structures and to provide a means of installing various lines to perform subsequent cleaning, mandreling, and cable-pulling operations.
-
Brush duct to remove any soil or debris that might have entered the duct since it was installed.
-
Clean duct if soil or debris prevents the rodding device from passing from one structure to another.
-
Perform mandrel operation to establish that a specific size passageway exists from one end of the duct to the other, and to establish that the duct is aligned so that horizontal and vertical bends meet the specified minimum radii requirements.
-
Install 1.27-cm (1/2-in.) steel rope, 1.42-cm (9/16-in.) steel rope, or 0.64-cm (1/4-in.) polypropylene rope (depending on the timing and type of pull).
Technology
Con Edison provides its employees with the specialized tools and equipment that they need to do their jobs, including trucks outfitted for the different types of work that they perform. Employees stated that they believed Con Edison provides them with good quality trucks, appointed with the equipment they need to perform their work. People demonstrated a sense of pride in their trucks and associated equipment.
An example of a specialized vehicle is a heavy-duty tandem axle flatbed underground cable-puller truck that is used by cable pullers to pull and remove cable.
See Attachment G for the Dejana Hub Drive Cable Puller Brochure.
7.3.3.5 - Duke Energy Florida
Construction
Cable Pulling
People
Organizationally, the Duke Energy Florida resources that construct and maintain the urban underground and network infrastructure fall within the Network Group which is part of the Construction and Maintenance Organization. More broadly, Duke Energy Florida’s construction and maintenance organization is divided into regions, with both Clearwater and St. Petersburg falling within their South Coastal Region. The Construction and Maintenance organization for the South Coastal Region is led by a General Manager. The region consists of various Operation Centers, organized either geographically or functionally throughout the Region.
The Network Group is organized functionally, and has responsibility for construction, maintain and operating all urban underground infrastructure (ducted manhole systems), both network and non-network, in both Clearwater and St. Petersburg. The Network Group is led by a supervisor who reports to the Region General Manager. The group consists of ten craft workers, five Electric Apprentices and five Network Specialists (the journey worker position), all part of the Network Specialist job family.
The Network Specialist is a jack-of-all trades, position, responsible for all facets of UG work, including pulling cable. Network Specialists also work with the installation and maintenance of automation associated with the equipment they manage.
The Network Group at Duke Energy Florida has close ties with peers within Duke Energy sister companies throughout the country, and regularly shares information, lessons learned, and network standards with them.
While Network Specialists do pull cable, for new installations and for large replacement programs, the network group at Duke Energy Florida primarily relies on contractor resources to pull cable. These contracted employees work under the guidance and oversight of a designated Network Specialist.
Process
Contracted employees pull cable under the guidance of a Network Specialist who has been designated as oversight for the contract crews during cable pulling projects. Network Specialists with oversight of the cable pulling projects will inspect cable installation, take pictures, maintain a safe work zone, and make certain the contractors observe construction standards.
For the cable replacement project underway at Duke Energy Florida, the contractors also perform the associated cable splicing.
Technology
The Network Group supervisor has focused on identifying processes and tools that can improve the safety of cable pulling. At the time of the immersion, the Duke Energy Florida network team was assessing new cable rigging and pulling tools, such as the cable guide depicted below in figure 1

Figure 1:
Cable Guide
7.3.3.6 - Duke Energy Ohio
Construction & Contracting
Cable Pulling
People
Cable pulling Duke Energy Ohio is normally performed by the Cable Splicers who work in the Dana Avenue department. Duke will also intermingle other resources on cable pulling crews, including overhead lineman, and network specialists. Contractor resources are often used in cable pulls.
Cable pulling design, including the calculation of pulling tensions, is performed by the Network Project Engineer, part of the Distribution Design organization.
Process
Duke Energy Ohio does design cable pulls, including performing cable pulling calculations on longer or more complicated pulls. Note that while the software Duke is using to perform cable pulling calculations can factor in the use of cable pulling lubricant, the Network Project Engineer typically calculates pulls without lubricants to more conservatively estimate pulling tensions.

Figure 1:
Crewman in hole applying lubricant

Figure 2:
Crewman at other end of pull with remote controller
Duke crews will monitor pulling tensions using the dynamometer on the truck during the pull, as some pulling tensions day encounter are rather high.
Duke Energy Ohio will use various combinations of trucks and trailers to perform the cable pull depending on the job. For example, they will use the rod truck as a cable puller in some instances. They will typically use reel trailers, with three conductors on the reel. Their trailers are equipped with an automated cable payout feature.

Figure 3:
Cable Reel Trailer

Figure 4:
Cable Reel, three conductor
Duke crews will pull the cable by conductor, attaching the pulling grips directly to the conductor itself to do the pull.
They use a non crimp, reusable cable pulling system by Condux [1] .

Figure 5:
Cables being pulled into hole. Note non-crimp reusable pulling eyes attached to cable

Figure 6:
Cables being pulled into hole. Note flat straps ('Cow tail') attached to cable to pull into final position
Crews noted that because of the age of their infrastructure, setting up the rigging to before cable pulls can sometimes be difficult. At the time of the immersion, Duke Energy Ohio noted that they were investigating the purchase of a new truck to facilitate the removal of retired cables in difficult or deteriorated installations (OK Champion Cable Scrapper).
At the end of the pull, because of the length of the pulling apparatus attached to the grips, the cable may not be in position to be put on the cable racks. Therefore, just before the end of the pull, the Cable Splicer will lash flat straps around the cable in order to pull the cables into final position.
Technology
Duke Energy Ohio is using a software product called Pull Planner 2000, to perform cable pulling calculations. See above figures.
[1] www.condux.com
7.3.3.7 - Energex
Construction & Contracting
Cable Pulling
People
The Journeyman position for working with cable systems at Energex, including cable splicing and cable pulling is the cable jointer position. Employees move through the jointer apprenticeship program in about three and one half years. The apprenticeship includes formal training, testing, on the job training, and time in grade. At the conclusion of the apprenticeship, persons in the program must still must complete a “basket of skills” required by the electrical office. These skills are over and above the skills that are taught as part of the apprenticeship, but necessary for the employee to be a fully qualified jointer. Employees complete this basket of skills in the first 18 months after apprenticeship. Consequently, it takes 5-6 years in total before an employee is a fully qualified to run a job.
All jointers within the underground group are trained for CBD cable joining, operating in confined spaces, safe work practices in pits, and both high-voltage and low-voltage cabling. Jointers are trained in both Australian Qualifications Framework (AQF) and network-specific tasks before working on CBD underground splicing.
( See the Training section in this report. )
Process
Jointers work with cable and cable accessory installation and maintenance, including cable pulling, splice preparation, and cable replacement.
Technology
Energex utilizes a shear bolt connection, rather than a compression type connection for splicing, when preparing an 11 kV cable joint. They implemented the use of shear bolt technology for improved reliability.
7.3.3.8 - ESB Networks
Construction & Contracting
Cable Installation
People
Cable installation at ESB Networks is performed by Network Technicians, the journey worker position. The Network Technician is a mutli-faceted position, performing both line work, such as building pole lines, and electrical work, such as making connections at a transformer. Network Technicians work on all voltages from LV through transmission voltages (110 kV). Note that ESB Networks created the Network Technician position in the 1990s by combining a former Line Worker position and Electrician position.
Work specialization for Network Technicians is by assignment. In Dublin, where the majority of the distribution infrastructure is underground, Network Technicians work mainly as cable jointers, installing underground cables and accessories. ESB Networks rotates Network Technician work assignments as business needs require.
Much of the cable installation and replacement in the ESB Networks underground network is performed by contractors. In the past, graduate student engineers were used on line work, but this has become far less frequent in recent years. Otherwise, cable replacement and installation is performed by Network Technicians, who work on all cable voltages.
ESB Networks has a four-year apprentice training program for attaining the journeyman Network Technician position. Network Technicians who worked as cable jointers work closely with both the Training group and the Asset Management groups at ESB Networks. Network Technicians readily bring information about problems with particular cable joints back to these groups.
The Training and Underground Networks group within the Assets & Procurement organization share the process of performing forensic analysis of failed joints and in preparing the failed component summary reports. Within both groups, ESB Networks has significant cable/cable accessory expertise. Both groups work closely with Network Technicians to ensure that they understand the science of cable joints and have an appreciation for the importance to long-term joint reliability of performing the proper steps associated with cable joint preparation.
Process
ESB Networks has installed significant amounts of MV (10-kV and 20-kV) cables over the past 10 years. Thirty-four percent of the total in-service MV cable has been installed in the past few years. Most of this installation has been outside of Dublin, in both rural and urban areas. Figure 1 shows the total amount of installed MV cable from 2000 to 2012.

Figure1:
Figure 1 - Installed MV cable
ESB Networks has also installed significant amounts of LV cables – used for their LV network mains. Thirty-seven percent of the total in-service LV network cables have been installed within the past seven years (statistic includes replacement of cables). Figure 2 shows the total amount of installed LV cable from 2000 to 2012.

Figure 2:
Figure 2 - Installed LV cables
Technology
ESB Networks has embarked on a five-year cable replacement program and is spending €11.4M on replacing oil filled cables and terminations due to higher than acceptable failure rates in recent years. The company is also replacing lead cable by retrofitting 38 kV PILC cables with XLPE, especially within the business district.
ESB Networks’ approach in developing its replacement plan includes determining ESB Networks’ overall risk profile, comparing age versus performance of cables older than 65 years. In all, ESB Networks will replace 18 km of cables that are the critical feeds for the city. ESB Networks estimates this replacement will reduce the risk of failures by approximately 50 percent. As part of its replacement program, ESB Networks is also targeting older (pre-1982) XLP insulated cables, as this cable had been experiencing an average of eight faults per 100 km.
7.3.3.9 - Georgia Power
Construction & Contracting
Cable Pulling
People
Cable Pulling, including electrical cable and fiber, is performed primarily by Cable Splicers, although Duct Line Mechanics may also pull cable. Georgia Power enjoys good cooperation among the Cable Splicers and Duct Line Mechanics. They cite the fact that both positions are filled from the WTO position and thus have a common background as a reason for this good cooperation (See Job Progression in this report).
Cable pulling for larger projects may be given to a contractor.
The Cable Splicing crews report directly to distribution supervisors within the Network Underground Construction group at Georgia Power. The Network Construction group, led by a manager, performs all network construction activity, and is comprised of Cable Splicers, Duct Line Mechanics and Test Technicians. The Network Construction group is part of the Network Underground group.
Process
For new projects, the work package that goes to the construction crews includes several drawing types that provide the design and construction details.
Duct Line Mechanic crews receive duct line drawings that include plan and profile views.
Cable Splicers will receive cable racking drawings that specify the use of racks mounted on the vault or manhole walls and include specific cable racking instructions (which cables go where). See Attachment D.
Cable Splicing crews are provided with a detailed cable pulling sketch, also developed by engineering, which provides specifications on cable type, length, pulling tensions, etc. (See Attachment E ). Georgia Power underground network facilities are fairly close to one another, so that cable pulls are usually very short – no more than 500 feet in most cases. For very short pulls, the design may exclude pulling tension information.
Additional construction drawings include a one line diagram showing transformer locations, fuse location, wire sizes, etc.; permit drawings; easement drawings; and a transmittal document, which is signed off by the engineer and formally transfers the project to construction.
One notable practice at Georgia Power is the use of what is called the Peachtree racking system for positioning cables in manholes and vaults. Primary feeders are racked on the bottom, secondary feeders are racked on the top, and the neutral is on the very top (See Figure 1.). Each cable and splice is assigned a specific vertical and horizontal position on each rack. The racking approach is designed with future expansion in mind, with specific locations for joints. Feeders are numbered, from 1-6, also to more easily accommodate expansion and maintenance (See Figure 2.).

Figure 1:
GA Power employee explaining benefits of Peachtree racking within a training manhole

Figure 2:
Desktop training aid showing Peachtree racking approach
Technology
The Georgia Power Network Underground engineering group performs cable pulling calculations using both an in house Microsoft Access based tool and the Pull Planner software from Polywater. Most pulls within the Atlanta network are very short, less than 500 feet, and so pulling tensions are often not calculated.
Manholes are designed with bay forms built into the corners to minimize the required bends in the cable. Therefore, the cables can maintain the appropriate bending radius and still be positioned close to the wall. Georgia Power utilizes a duct camera system (Pearpoint Flexiprobe) to inspect duct integrity before pulling cable (See Figure 3 and Figure 4.).

Figure 3:
Duct Rodder

Figure 4:
Duct camera system
7.3.3.10 - HECO - The Hawaiian Electric Company
Construction & Contracting
Cable Pulling
People
Cable pulling is performed by both the Cable Splicers who work in the Underground Group, and Lineman who work in the Overhead C&M groups. Underground and Overhead crews will often collaborate on larger cable pulls. EPRI researchers noted high levels of cooperation between these two working groups.
Process
In most cases, HECO designs pulls such that they are well within the safe pulling tension limits of the cable itself. HECO will only calculate pulling tensions and use a dynamometer to monitor tension during very large or complicated cable pulls.
Technology
When HECO does calculate pulling tensions, they use Pull Planner software.
HECO uses specialized cable pulling trucks to facilitate cable installation, including a Rod trucked equipped to pull cable (See figure below left).
See Attachment H.

Figure 1:
Rod Truck with Cable Pulling Feature

Figure 2:
cable reel
7.3.3.11 - National Grid
Construction & Contracting
Cable Pulling
People
Cable pulling at National Grid Albany is normally performed by the field resources responsible for the underground system in eastern New York, called Underground Lines East. This group is led by a Manager, and includes a group focused on civil aspects of the underground system and a group focused on the electrical aspects. The Underground lines group is responsible for both the network and non – network infrastructure in eastern NY, including the Albany network.
The group is comprised of Cable Splicers, Maintenance Mechanics and Mechanics, and is led by three supervisors. Cable Splicers work with cable and cable accessory installation and maintenance, including cable pulling and splice preparation. Maintenance Mechanics perform network switching, fault location, minor vault maintenance, and inspection and maintenance of network equipment such as transformers and network protectors. Mechanics perform minor civil work.
Both the Mechanic and Cable Splicer classifications participate in cable pulling projects.
The Cable Standards contain guidelines for calculating pulling tensions. Cable pulling design, including the calculation of pulling tensions if required, is performed by the designers who support the Albany network, part of the Distribution Design organization, and physically located at the NYE building in Albany.
Process
National Grid designers perform cable pull calculation if required either using hand calculations (most often) or cable pulling software. Most designs are such that the calculation of pulling tensions is not required.
Technology
National Grid uses Pull Planner software, and hand calculations to determine pulling tensions.
7.3.3.12 - PG&E
Construction & Contracting
Cable Pulling
People
Cable pulling at PG&E is normally performed by the General Construction group. The General Construction Group serves as an internal contractor, supporting the M&C Electric Network group with services such as cable pulling and cable splicing. The General Construction group is comprised of cable splicers.
Cable pulling design, including calculation of pulling tensions, is performed by project estimators (Estimator and Estimator Senior) that work within the Service Planning group. These estimators are involved with new service projects and develop cost estimates, perform field checks and prepare the job packets for construction. The project estimators that work on network design projects are located in the San Francisco division.
Process
PG&E project estimators perform cable pull calculations using in house cable pulling software. Planning engineers will sometimes perform cable pulling calculations as well.
Technology
PG&E uses in house software to perform cable pulling calculations.
7.3.3.13 - Portland General Electric
Construction & Contracting
Cable Pulling
People
Cable pulling is the responsibility of the Underground Group, also known as the CORE group.
Organizationally, this group is part of the Portland Service Center (PSC) and is responsible for the underground CORE, which includes both radial underground and network underground infrastructure in downtown Portland. An Underground Core Field Operations Supervisor leads the CORE group. This supervisor reports to the Response & Restoration Area Line Manager (ALM).
The typical underground crew consists of three people: two journeymen and a non-journeyman helper. The foreman, who is a qualified cable splicer, is one of the working journeymen on the crew. The two journeymen (also cable splicers) typically perform the work inside the manhole or vault, while the helper usually stays above ground, carrying material and watching the barricades and street for potential hazards.
The cable splicer position is a “jack-of-all-trades” position, whose responsibility includes cable pulling. A crew may include an equipment operator to operate the cable puller.
The group may use overhead crews for cable pulling when needed. They do not give additional training, and the CORE cable splicer oversees them.
Field Inspectors ensure that newly-built facilities have the required equipment for cable pulling.
Process
PGE is replacing all of its PILC network primary feeders with EPR insulated cables, and works primarily at night because the city has restricted street closings during the day. Although the company prefers to replace feeders in their entirety, pulling EPR all the way, PGE will use Raychem transition joints if this is not possible.
To support cable pulling, PGE standards for vaults and new cable from manufacturers include specifications for pulling hardware, such as pulling eyes. For example, newly built conduits are specified to include a non-conductive pull line, rated 500 lb (227 kg), with 6 ft (2 m) of line left extending from each end of the conduit. The vault specification includes requirements for pulling eyes.
For customer vaults, PGE Field Inspectors check that the vault meets the PGE specifications, including the correct hardware for cable pulling [1]. Pulling eyes should be installed on the wall opposite primary and secondary cable conduits, or in the ceiling if cable conduits emerge vertically from the floor. Pulling irons should be installed opposite of cable conduits for pulling, with a minimum working strength of at least 10,000 lb (4535.9 kg). Other pulling irons, ceiling anchors, and Burke clutches, if required, should be installed as specified by PGE for installing transformers.
New cable reels are specified to include factory-installed pulling eyes, which act as a common eye for all three phases of a triplexed cable set. New cable reels have a maximum working strength equal to the sum of the maximum allowable strengths for each of the center conductors of the triplexed cable set. The pulling eye also provides a waterproof seal for the cable end [2].
- Portland General Electric, LD51030m Portland Core & Waterfront Districts Underground Core Standards, internal document.
- Portland General Electric. From L20506 15-kV EPR Jacketed Concentric Neutral Cable, internal document.
7.3.3.14 - SCL - Seattle City Light
Construction & Contracting
Cable Pulling
People
At Seattle City Light, all network electrical workers are part of the Cable Splicer family; that is, the journeyworker Cable Splicer performs all of the tasks associated with building, maintaining, and operating a network system including cable pulling, splicing, construction, equipment inspection, and maintenance.
Technology
Diagnostic Camera
SCL has a camera device that they use for ascertaining the condition of conduit sections. The device is basically a camera head (maybe 5.08 cm [2 in.] in diameter) that fits on the end of a fish tape. The camera is connected to a display monitor that is usually viewed above the ground. A cable splicer pushes the fish tape with the camera on its head through a conduit, and the camera displays a 360-degree view of the inside of the conduit, revealing any cracks, debris, and so on.
SCL uses this tool primarily as a troubleshooting device. For example, they use this device when they have had a dig-in to ascertain the condition of the conduit. They also use the device in situations where they need to pull cable through a small duct. They run the camera through in advance to identify any deficiencies that could affect the pull.
Note: SCL is not presently using the tool as a preventive maintenance device.
7.3.3.15 - References
EPRI Underground Distribution Systems Reference Book (Bronze Book)
7.3.4 - Cable Quality Control
7.3.4.1 - AEP - Ohio
Construction & Contracting
Cable Quality Control
(Cable Inventory)
People
The specification for cable used in the AEP Ohio networks supplying metropolitan customers in Columbus and Canton is the responsibility of the Network Engineers in collaboration with the Network Engineering Supervisor. These personnel are geographically based in downtown Columbus at AEP Ohio’s Riverside offices. The Network Engineering group reports to the AEP Network Engineering Supervisor, and is part of the Distribution services group at AEP, reporting ultimately to the AEP Vice President of Customer Services, Marketing and Distribution Services. The AEP Distribution Services group, including the Network Engineering Supervisor supports all AEP network design issues throughout its operating companies, including Texas, Indiana, Michigan, Oklahoma, and other locations.
AEP also has a Network Standards Committee, which is headed by the lead Network Engineering Supervisor in its downtown Columbus offices, and is comprised of representatives from all AEP operating companies. This group works closely with the parent company’s Distribution Services organizations and holds regular teleconference sessions on network findings, “lessons learned” in the field, and potential network engineering solutions to common network design and implementation issues. Cable design and implementation issues throughout the AEP service areas are regularly studied and recommendations are made through this committee.
Process
Network Engineers require cable manufacturers to provide drawings of cable electrical and physical characteristics and provide certified test results. They will conduct periodic plant visits of the cable manufacturers.
AEP does perform some independent testing of cables using both internal laboratories (such as taking and examining cable wafer sections at their Dolan labs) and external labs.
Engineers noted that the quality of the cables they are receiving is very high.
7.3.4.2 - Ameren Missouri
Construction & Contracting
Cable Quality Control
People
Network standards, including standard designs for cable, are the responsibility of the Standards Group. This group develops both construction standards and material specifications for designs and equipment used in the network underground.
Organizationally, the Standards group is led by a Managing Supervisor, and is part of the Distribution Planning and Asset Performance Department, part of Energy Delivery Technical Services. Within this organization are experts who focus on developing and maintaining specific underground standards. For example, they have a cable engineer, who is an expert with cable and cable systems, and responsible for the development of cable standards for the company.
Ameren Missouri’s present standard calls for the use of EPR insulated cable for all cable systems. Because of limited duct size, Ameren Missouri has implemented the use of reduced-diameter 15 and 35kV cables for the replacement of paper – insulated lead-covered cables (PILC) cables. The reduced-diameter cable (145 mils vs. 175 mils for 15kV cable ; 300 mils vs. 345 mils for 35 kV cable) is being used for new and replacement applications in areas of St. Louis with small conduit sizes, and has resulted in significant cost savings.
Process
New reduced-diameter cables are accepted by Ameren Missouri without any supplemental diagnostic testing over what is performed by the cable manufacturer. Ameren Missouri believes that they are receiving higher quality cable in that the cable manufacturers have to run their cable manufacturing process more slowly to meet the tolerances required by Ameren Missouri. Ameren Missouri engineers noted that they have never had a true cable failure; that is, a cable failure due to a manufacturer flaw in the cable itself.
Ameren Missouri uses a vendor alliance with their network cable supplier.
7.3.4.3 - CenterPoint Energy
Construction & Contracting
Cable Quality Control
People
CenterPoint has formed a cable committee to address cable quality control issues. This committee meets monthly to discuss and resolve cable issues, including logistical and scheduling issues. The committee is comprised of an Engineering Projects lead, an Operations Manager, a Standards & Materials representative, representatives from Purchasing and Logistics, and a representative from CenterPoint’s cable vendor.
Note that CenterPoint has a sole supplier relationship with the cable vendor who supplies their EPR power cable.
Process
CenterPoint performs a “witness test” of every single reel that they purchase. For their EPR cables, a CenterPoint representative goes to the vendor laboratory, and witnesses the cable acceptance testing done by the vendor in accordance with ICC recommendations. The CenterPoint inspector has the right to reject an entire reel based on the outcome of this testing.
In addition, CenterPoint sends a 70ft sample from every reel to an independent laboratory for additional testing and analysis. This extra step has been useful to CenterPoint in identifying and addressing changing quality trends.
See Attachment - G , for a copy of the CenterPoint Cable Specification, which describes the qualification procedure in more detail.
Technology
CenterPoint uses EPR aluminum cables with a flat strapped neutral as a standard primary power cable for Major Underground (750 AA and 1000 AA at 15kV, 1250 AA at 35kV). CenterPoint uses XLPE insulated cables in URD applications.
7.3.4.4 - Con Edison - Consolidated Edison
Construction & Contracting
Cable Quality Control
People
Cable Supply
Con Edison has entered into an exclusive arrangement with its cable supplier. This single source has provided Con Edison preferred pricing and high levels of responsiveness from the cable manufacturer. Part of the arrangement with the cable manufacturer is that Con Edison doesn’t pay for the cable until it is installed in the ground. This provision has helped to reduce the lead time in obtaining cable from the manufacturer, and is an incentive for Con Edison to develop accurate forecasts of cable needs.
Incoming cable is not tested by Con Edison. The utility relies on the manufacturer’s report of testing performed by the manufacturer itself. These tests include partial discharge tests, ac voltage tests, and solderability tests on primary cables.
The arrangement with the cable vendor is not tied to the ongoing performance of the cable itself. When Con Edison has encountered problems, the utility has been able to track the problem back to a specific cable lot or reel. For example, in one case, they discovered some reels where the cable jacket was a bit thin. Con Edison has found the manufacturer to be highly responsive to problems that occur.
Cable Testing Laboratory
Con Edison has its own cable testing laboratory, which has been in operation since the 1970s. This laboratory has over 100,000 cable and accessory specimens. Sometimes the lab sends specimens to outside labs to obtain independent analysis and opinions.
Con Edison invests in keeping its laboratory staff current on the latest thinking in cable testing. They are active in industry groups. They invest in rotating new people into the cable department, including engineers from Con Ed’s Gold program (a mentoring program for high potential engineers and business professionals).
Process
Feeder Testing
Con Edison performs regular HIPOT testing of its network feeders (13.8 and 27 kV). HIPOT testing is the application of a specific voltage (high potential) on its network cables for a specific period of time to expose/bring to fruition incipient faults in the distribution system. Con Edison has a clear procedure that documents its approach to regular HIPOT testing.
HIPOT testing is performed at Con Edison for two main reasons:
1. A routine test to ensure that feeder insulation meets acceptable limits before the feeder is put into service. This applies to both new feeders about to be put into service, and to failed feeders that have been repaired and are about to be returned to service.
2. Scheduled tests performed annually (Annual Testing Program) on selected feeders for the purpose of revealing incipient faults that need to be restored to the proper insulation level.
See Cable Testing / Diagnostics for more information.
Technology
Cable Design
Con Edison is working with cable manufactures to remove potentially hazardous substances from their distribution cables. These substances include the fire-retardant bromides used in the Dual-Layer EAM cable insulation and the lead in the primary EPR cable insulation.
7.3.4.5 - Duke Energy Florida
Construction
Cable Quality Control
People
The specification of cable used in the urban underground networks in Duke Energy Florida is the responsibility of the Standards group, which oversees all standards for distribution equipment and materials. One Engineer within the group oversees all network equipment standards for Duke Energy Florida. This engineer is an Electrical Engineer, a requirement for the engineer who specializes in Network Standards. The engineer also has a PE license, a requirement to obtain certain levels within the engineer family.
Duke Energy has a Corporate Standards committee which focuses on developing common standards throughout the Duke Energy family of companies. Across the Duke Energy family of companies, there is a core Network Group of four or five members within the broader Standards groups that assist each other and collaborate on choosing all material and specification standards for the underground network throughout the company, including Florida. This core underground team draws on members from across the Duke Energy operating companies.
Process
The standard primary feeder cables supplying the Clearwater network are 4/0 cu XLPE insulated cables. Outside the network, Duke Energy Florida will use both 4/0 cu and 1000 MCM AL XLPE cable for feeder exits. Standard secondary cable sizes are 4/0 cu and 500 cu, also XLPE insulated. Duke Energy Florida has no remaining lead cables in their underground system.
Incoming cable and cable accessories are spot inspected to identify failures.
Duke Energy Florida currently uses a Facility Management Data Repository to report and document failed equipment. The report includes all relevant information, such as who discovered/reported the defect, where it happened, etc. These reports are issued as bulletins over the company’s internal network first to Standards, and then companywide via a Web portal. The emphasis at Duke Energy Florida is to catch defects before they lead to failures. The Network Group led the state in 2015 with these “good catches” that identified defects and corrected them before they caused network problems.
Failed cable samples are sent to a Duke Energy Florida Engineer for forensic analysis and/or sent to external laboratories for analysis. Overall, Duke Energy Florida has seen very few failures over the years.
Duke Energy Florida conducts routine cable diagnostic testing to determine the integrity of its primary cables, utilizing the services of a cable diagnostic testing contractor. Cable testing is age-based – with cables selected for testing that are 25 years or older, or that are suspect based on performance. Duke Energy Florida tests 80 segments per month over a nine-month period per year. The diagnostic testing performed by the contractor is not feasible in all situations, depending on factors such as manhole placement, circuit configuration, circuit condition, or feeder operation. Cable replacement decisions are driven by diagnostic test results. Depending on test results, the PQR&I group will determine whether a cable has integrity and remaining life or needs replacement. If replacements need to be made, the other Asset Managers who deal with circuit components are consulted to identify equipment replacement needs on the identified circuits.
Duke Energy also performs routine cable replacements that are based on cable age and performance history, rather than on diagnostic testing results. This is the case in St. Petersburg, where older cables are being replaced based on age and performance history, as these cables were not appropriate candidates for diagnostic testing (because of significant branching of cable sections.)
Asset Management is in the process of incorporating cable testing prior to energization of new cables into their program. The company believes this commissioning testing to be a good quality control check that can forestall outages.
Technology
Duke Energy Florida uses contractor cable testing that includes a checklist of over 170 cable conditions. The specific approach to diagnostics is proprietary.
Duke Energy Florida currently utilizes push on and crimped splices as a standard, but is considering standardization on cold shrink splices using shear bolt connections as a future standard. Overall, older push on and crimp solutions have experienced some failures due to workmanship issues, and Duke Energy Florida believes that the new standard will minimize workmanship problems.
7.3.4.6 - Duke Energy Ohio
Construction & Contracting
Cable Quality Control
People
Cable specifications are prepared by the Underground Standards group, located in Charlotte.
Current standard cables used for the Duke Energy Ohio Cincinnati network are 4/0 cu EPR and 750 cu EPR cables (750 with a flat strapped neutral).
Process
New cables are accepted by Duke Energy Ohio, after successfully passing a DC Hi pot acceptance test and an AC Tan Delta test. The AC tan delta is used to establish a baseline for future cable testing. The testing and establishment of this baseline is performed by one of the underground crews, compromised of individuals who have developed expertise in AC Tan Delta testing.
Duke Energy Ohio is not using a vendor alliance with their network cable supplier. They do have a vendor alliance in place with a cable company for much of their non-network cable.
7.3.4.7 - Energex
Construction & Contracting
Cable Quality Control
People
Cable quality control is the responsibility of the Standards group, part of System Engineering within Asset Management. The Standards group is comprised of engineers, mostly four-year degree qualified positions, though some are engineering associate positions.
Energex has comprehensive engineering standards, construction standards, and maintenance standards. Standards are made available to employees on the internet. Energex performs a complete review of all standards on a one to three-year cycle. As changes occur mid cycle, Energex distributes bulletins that provide the updated information to the employee base.
Process
Cable is commission tested by Energex before energization. The type of test depends on the cable type. Energex performs a DC hi pot test for commissioning PILC cable, and an AC VLF hi pot commissioning test for XLPE insulated cable. This commissioning testing is in addition to the manufacturer’s own cable testing, required by Energex specifications. If a cable is found to be faulty, the batch number is identified and the manufacturer is notified. This may result in cable recalls in some cases, with stock from that batch pulled from Energex supply and returned to the manufacturer.
Technology
A notable practice is the use of a specially coated XPLE cable jacket that is termite resistant. In some areas termites or white ants have eaten away at the outer sheath material in older XPLE cables. This new cable jacket material repels termites.
7.3.4.8 - ESB Networks
Construction & Contracting
Cable Quality Control
People
Cable quality standards at ESB Networks networks are developed jointly by the Underground Networks group and Strategic Procurement groups within Assets and Procurement, and the Network Investment groups within the Asset Investment organization.
Process
All incoming cable is subject to cable inspection procedures. Prior to taking delivery, the cable manufacturer is required to take samples and conduct tests of new cables that conform to ESB Networks requirements. ESB Networks must sign off on these test results before receiving a cable shipment. As an additional precaution, cable installers are required to inspect cable while on the job, as they are the last line of cable quality control for ESB Networks.
ESB Networks has also established a close working relationship with cable manufacturers. For example, a one company representative visits every two months and delivers training for ESB Networks. Vendors have also worked to develop accessories to suit ESB Networks’ unique cable requirements.
Material deficiencies with UG materials are handled informally; if a field crews has an issue with a piece of material, it is the crews’ responsibility to report the problem to its manager, who has the authority to stop an installation until appropriate replacement material is delivered to the site.
Technology
At LV, ESB Networks uses sector shaped solid aluminum cable
At MV, they use XLPE insulated round aluminum conductor with a durable jacket. ESB Networks reports excellent performance of the XLPE cables, noting that they have not experienced a cable failure unrelated to a dig in or a joint problem since 1982.
7.3.4.9 - Georgia Power
Construction & Contracting
Cable Quality Control
(Cable Inventory)
People
Network standards, including standard designs for cable, are the responsibility of the Standards Group within the Georgia Power Network Underground group. This group develops specifications and standards for cable and cable accessories used in the network underground.
Process
Much of Georgia Power’s existing cable is 300 MCM three-phase 20 kV PILC. Georgia Power is not aggressively retiring PILC, but is moving more toward solid-dielectric (mostly EPR) cable for new installations and replacement. When the PILC fails, it is replaced with either the same type or with 350 MCM 25 kV (reduced diameter) EPR.
The Georgia Power Network Underground group has not historically performed routine diagnostic testing of network cables other than fault location testing and proof testing after cable repair. Therefore, cable is replaced on an as-needed basis as determined by inspection, cable failure, or on recommendation of the supervising engineer.
Georgia Power makes certain that it is prepared for contingencies by performing regular stock checks. Engineering makes sure that cable inventory levels can support both normal and anticipated emergency requirements. GA Power keeps several thousand feet of primary cable which could be temporarily installed above ground in case of emergency such as major ductline damage. (See Figure 1).

Figure 1:
Cable Inventory
Technology
The company uses its “Maximo” software system for checking and maintaining up-to-date data on the amount of cable and types of cable available. Stock is routinely replenished before it is needed.
7.3.4.10 - National Grid
Construction & Contracting
Cable Quality Control
People
National Grid has a well-documented underground construction standard for cables that includes descriptions of standard cable types, cable storage and handling practices, cable ampacity tables, and cable installation practices. The standard also includes guidelines for items such as calculating pulling tensions, proper racking, use of end caps, use of arc proof tapes, proper tags and identification, etc.
The cable standard is maintained by Distribution Standards, part of Distribution Engineering Services. The group is also responsible for developing material specifications. Standards are updated on a five - year cycle. The materials specifications section is updated annually.
Current standard primary cables for the National Grid networks in NYE are 500MCM Cu for mains, and 4/0 Cu for taps and transformer leads at 13.2kV. For 34.5, standard sizes are 750 Cu for mains; and, 2/0 Cu for taps and transformer leads. In addition, compact flat strap 500MCM Cu is used in reduced duct sizes for both 13.2kV and 34.5kV. (Aluminum primary conductors are sued on non-network radial systems such as URD or UCD.)
For network secondary, conductor sizes range from #2 to 500 cu.
Current standard duct size is 5 inches. Much of the existing duct system is 4 inch.
Process
New cables are accepted by National Grid without any supplemental diagnostic testing over what is performed by the cable manufacturer.
Technology
Current standard primary cables for the National Grid networks in NYE are 500MCM Cu for mains, and 4/0 Cu for taps and transformer leads at 3.2kV. For 34.5kV, standard sizes are 750 Cu for mains; and, 2/0 Cu for taps and transformer leads. In addition, compact flat strap 500MCM Cu is used in reduced duct sizes for both 13.2kV and 34.5kV. (Aluminum primary conductors are used on non-network radial systems such as URD or UCD.)
EPR insulated cable is the current standard for network primary feeders. For secondary cables, National Grid uses EPR insulated cables with a cross linked heavy duty black chlorosulfonated polyethylenee (Hypalon) jacket.
7.3.4.11 - PG&E
Construction & Contracting
Cable Quality Control
People
Cable specifications are prepared by a cable engineer within the Electric Distribution Standards and Strategy group, located in San Francisco.
Current standard cables used for the PG&E network are 750 cu, 500 cu, 250 cu, and #2 cu PILC cables at 12 kV, and 1100 Al, 600 Al, and 1/0 Al XLPE or EPR cables at 35 kV.
For network secondary, they use 1000 cu (for transformer ties), and 250 or 500 Cu EPR cables (for the street mains.)
Process
New cables are accepted by PG&E without any supplemental diagnostic testing over what is performed by the cable manufacturer. They have implemented proactive VLF testing of installed network feeders.
PG&E uses a vendor alliance with their network cable supplier.
7.3.4.12 - SCL - Seattle City Light
Construction & Contracting
Cable Quality Control
People
SCL does an incoming inspection of network equipment. They have a person who is responsible
for incoming equipment quality control.
Process
Incoming Network Equipment Inspection
SCL does an incoming inspection of network equipment, including cable, elbows, T-bodies, and so on. Cable is sampled and tested at random. These tests can include X-raying to identify deficiencies.
Cable Testing
SCL uses dc HIPOT proof testing (putting a high-voltage dc signal on the cable) prior to
energizing cables. 15-kV cable is limited to 26 kV dc, and 26-kV cable is limited to 47 kV dc.
SCL performs this test before energizing a new cable or prior to re-energizing an existing cable.
7.3.4.13 - Survey Results
Survey Results
Construction
Cable Quality Control
Survey Questions pulled from 2012 survey results - construction
Question 5.9: Do you have a process for inspecting or testing incoming network materials?

Question 5.10: If yes, what material is inspected or tested?


Survey Questions pulled from 2009 survey results - construction
Question 5.9: Do you have a process for inspecting or testing incoming network materials?


Question 5.10: If yes, what material is inspected or tested?


7.3.5 - Civil Construction
7.3.5.1 - AEP - Ohio
Construction & Contracting
Civil Construction
People
Civil Construction for AEP Ohio, including construction of manholes, vaults, and duct lines, is performed by a local civil contractor. AEP has a close working relationship with a civil engineering firm, with the primary civil engineer at that firm having worked for AEP Ohio for many years and is thus experienced with the AEP Ohio underground networks.
Coordination with contractors is performed by both the Network Engineering group, who works closely with civil contractors on civil designs, and service center management, who provide contractor coordination and oversight.
Process
Network Engineers work with civil engineers (contractor) to plan and design civil construction projects using single-line drawings that are then converted to electronic blueprints. These blueprints, once approved by engineering, are turned over to the contractor firm for execution. If there is cause to deviate from the original design for the construction, the civil engineering contractor works with a network engineer to resolve any problems.
Required civil repairs, discovered by inspection of manholes or vaults by AEP Ohio personnel, are reported to Engineering and outsourced to the civil engineering firm. Defects are input into the AEP Network Electrical Equipment Database (NEED) database, detailing the nature and severity of the structural deficiencies. Network Engineers, in consult with the Network Engineering Supervisor, then prioritize the civil repairs and send work orders to the civil contractor.
Technology
Civil designs created by the AEP Network Engineers are based on the AEP Network Planning Criteria. Single-line drawings of proposed civil construction, such as manholes and vaults, are converted to electronic blueprints in MicroStation and AutoCAD. Upon completion of projects, final blueprints are updated and GIS updates are made by the GIS group in parallel.
AEP utilizes its Network Electrical Equipment Database System (NEED) database, which is a legacy system that houses information about network assets and is used to aid in prioritizing and scheduling network repairs.
7.3.5.2 - Ameren Missouri
Construction & Contracting
Civil Construction
People
Ameren Missouri’s Civil and Structural Design Group, part of Energy Delivery Technical Services, is responsible for designs and standards for civil construction and repair. As an example, this group develops design standards for precast manholes. The group is also involved in deciding the best approach for making repairs to civil infrastructure, such as manholes and vaults. Ameren Missouri uses civil design contractors to supplement their civil design efforts.
Ameren Missouri uses contractors to perform much major civil construction work, such as building vaults, manholes and duct bank systems. They also make civil repairs to existing infrastructure. Repairs can range from epoxy injection, crack filling, and replacing deteriorated vault roofs.


Figure 1 and 2:
Vault Roof Repair
Ameren Missouri has a Resource Management Group responsible for managing outside contractors. This group is organizationally part of Energy Delivery Technical Services. The group, led by manager, is comprised of construction supervisors who manage outside contractors.
Ameren Missouri has two or three contractors “of choice" for underground work. Ameren Missouri has a three or four year agreement in place with these contractors. The contractors are part of the union, hired from the local bench.
Process
An example of civil construction work being performed at Ameren Missouri is replacing deteriorated vault roofs. Deteriorated roofs are typically identified through vault inspections performed by Ameren Missouri employees. These deteriorated roofs are particularly problematic in manholes that contain roof mounted secondary ring buses. Ameren Missouri’s civil and structural design group has developed standards for new vault roofs, including a thicker ceiling to meet a traffic rating, and a larger grate opening. In addition they have standardized on a vented panel for both sides of the vault.
Ameren Missouri’s roof standard includes concrete specifications that require the contractor to take samples of each pour and perform testing, such as water content and slump tests, to assure that the concrete meets strength requirements.

Figure 3:
Concrete Testing

Figure 4:
Concrete Test Samples
Technology
Ameren Missouri has precast, poured in place, and brick and mortar manholes and vaults in service. Their present manhole and vault standards call for a precast design.
7.3.5.3 - CEI - The Illuminating Company
Construction & Contracting
Civil Construction
People
Civil construction, including the installation of vaults, manholes and duct back is performed by contractors at CEI.
CEI typically retains the services of five different contractors to perform civil work (construction and maintenance).
Process
The Underground Network Services group has one supervisor who runs the contractor crews.
7.3.5.4 - CenterPoint Energy
Construction & Contracting
Civil Construction
(Manholes)
People
All civil work in major Underground at CenterPoint is contracted, with the civil construction work being performed by one major contractor, with 14 different civil crews. This includes the construction of street vaults, manholes, and duct bank. CenterPoint also contracts out some of their civil design work, with the contractor performing surveying, obtaining easements and preparing manhole and conduit drawings for new projects.
Process
CenterPoint contractors “Pour in place” to build new manholes. Precast units are usually the choice of customers who are providing the manholes.
Technology
Manholes are capped with OSHA approved slotted cast lids.
7.3.5.5 - Con Edison - Consolidated Edison
Construction & Contracting
Civil Construction
People
Construction Group
Con Edison’s service territory consists of four regions: Manhattan, Brooklyn/Queens, Staten Island, and Bronx/Westchester. The Manhattan Region is made up of three districts, including one headquartered at the
W 28th St. Work Out Center. The term Work Out Center refers to a main office facility to which field construction and maintenance resources report. To provide a perspective on the size of a workout center, about 300 people work at the W 28th Street Work Out Center, and they can field about 125 crews.
The construction department consists of several groups, including the Subsurface construction (SSC) group. The SSC deals with vaults, conduit ducts, and other civil work. Much of this work is contracted.
Process
Con Edison has a specification that lists all standard and nonstandard types of transformer manholes and vaults and describes their application in forming various arrangements of single or multi-bank installations for 208V network systems.
Con Edison uses two standard-sized equipment installations within vaults: a 500-kVA transformer with protector (also referred to as a “network unit”), and 1000-kVA network unit. For 500-kVA network units, there are two standard reinforced concrete vaults: one that houses the network unit itself (the overall inside dimensions are: 11 ft, 0 in. L x 4 ft, 2 in. W x 7 ft, 0 in. H), and another that houses the crab connections of multiple transformer ties and services or street ties, or both (the overall inside dimensions are: 8 ft, 6 in. L x 5 ft, 5 in. W x 7 ft, 6 in.). These vaults are either pre-cast or field poured, depending on conditions.
For 1000 kVA network units, there are six standard and one nonstandard reinforced concrete vaults. Three of these are for the purpose of housing the transformers-protector units (each vault with different dimensions, and one vault design with a service takeoff). The remaining four are bus vaults, designed to accommodate the interconnections of 1000 kVA network unit secondaries, street ties and service take-offs (each with different dimensions and including a single bus, single bus with diving bell, double bus, and double bus with diving bell vault design). The standard vault structures are available as pre-cast or field poured, depending on conditions.
Con Edison has specifications for pre-cast vaults for use in sidewalk areas. These structures are designed to satisfy typical or “ideal” conditions. Cable entries and other openings are fixed for the most common applications of pre-cast structures, which makes for an inherent lack of flexibility in installation. Therefore, certain field conditions preclude the installation of pre-cast structures, and field-poured installations must be used.
Con Edison field-inspects a percentage (target – 50%) of the field-poured manholes and vaults installed each year. The focus of the inspection is to ensure the proper and adequate placement of rebar in the concrete.
Con Edison has a specification for the design and construction of 265/460 transformer vault and network compartments by a contractor. This specification describes the division of responsibility between the contractor and Con Edison, and provides the dimensional requirements as well as the design and construction requirements for these structures.
Con Edison’s manhole specification calls for pre-cast floors, walls, wedges, and roof slab, with a cast iron manhole frame and cover.
7.3.5.6 - Duke Energy Florida
Construction
Civil Construction
People
Duke Energy Florida relies on contractors to perform most civil construction work, including new construction and activities such as repairing duct bank, or replacing manhole and vault roofs and grating systems.
Good relationships have been formed between Duke Energy Florida and the preferred civil contractors who perform this work, many of which have been working for Duke Energy Florida for a number of years.
Process
Contractors, especially for larger projects, must go through an on-boarding process through the contract oversight group, including agreements to strictly adhere to Duke Energy Florida standards, safety practices, reporting procedures, and scheduling. Smaller civil project contractors, on an ad hoc basis, are hired based on expertise in specialties, such as manhole covers, construction repairs, and are not subject to an extensive on-boarding process.
7.3.5.7 - Duke Energy Ohio
Construction & Contracting
Civil Construction
(Manholes)
People
Most civil construction work at Duke, including manhole construction, is performed by contractors. Duke network resources will perform minor civil repairs.
Within the Dana Avenue construction and maintenance organization, Duke employs a T&D Construction Coordinator who interfaces with contractor crews, including civil contractors.
Duke Energy Ohio has installed manholes of many different dimensions. Their manhole system grew out of an old DC system that served Cincinnati in the early part of the 20th century. Since that time, they have seen significant build out in the 1950s, 1970s and the 1990s. Their current manhole standard dimensions will not match many of the existing manholes.
Process
Duke Energy Ohio uses civil contractors to both perform civil construction and assist Duke in assessing the condition of facilities from a civil perspective. For example, the civil contractor will be called in to assess the roof condition or other structural condition issues in determining what repairs should be made to a vault or manhole.
Duke uses both “Poured in place” and pre-cast manholes, depending upon the circumstances.
Technology
In urban installations, Duke Energy Ohio encases conductors in concrete duct bank installations. Duke Energy Ohio does not use pre-cast duct bank, as each installation is unique size wise. Their standard duct bank installation includes grounding, tracer wire, and colored dye. Note that in rural areas of their territory, Duke Energy Ohio does not encase conduits in concrete.
See Attachment E for sample standard conduit drawings used by Duke Energy Ohio.
Duke Energy Ohio uses both pre-cast and “poured in place” manholes, depending upon the circumstances.
Pictures below show the installation of a precast manhole being installed in existing cable route. Note that precast manhole is made up of two bottom section, and a top section.


Figure 1 and 2:
Precast manhole – bottom sections bolted together


Figure 3 and 4:
Precast manhole – top section being lowered
7.3.5.8 - Energex
Construction & Contracting
Civil Construction
People
Civil construction standards are the responsibility of the Standards group, The Standards group is a part of the Asset Management group, and is comprised of mostly four-year degree qualified engineers, though some are engineering associate positions.
Energex performs a complete review of all standards on a one to three-year cycle. As changes occur mid cycle, Energex distributes bulletins that provide the updated information to the employee base. The bulletin details the change in standard and refers to the page number in the manual where the change has been made. Standards are made available to employees on the company internet.
All civil designs are approved by a licensed civil engineer to assure quality and meet the requirements of the Professional Engineers Act in Queensland. The civil engineers are part of the Design Group in Energex.
Civil construction is performed by a combination of Energex and contractor employees.
Process
Some civil construction is handled by outside contractors, inspected and monitored by the Energex Standards group. Contractors receive all their plans, specifications, scheduling, and cost estimates through the Standards group and an assigned project manager. Contractors are often used for tasks such as “proving the ducts” and backfilling.
Technology
Civil construction standards are all kept in documents in an electronic business management system. There are no hard copies of the standards; all are on the company intranet. Contractors also have access to the civil construction standards documents online.
7.3.5.9 - ESB Networks
Construction & Contracting
Civil Construction
People
Civil construction is supervised by the Contract Management group within the Network Investment groups, part of Asset Investment, within the Asset Management organization at ESB Networks. In addition to Asset Investment, the Asset Management organization consists of Program Management, Infrastructure Stakeholder Management, Assets & Procurement, Finance & Regulation, and Operations Management. These groups work closely together to manage the asset infrastructure at ESB Networks.
More specifically, construction and contracting is performed within two Network Investment groups – one responsible for planning network investments in the northern part of Ireland, and the other for planning in the south.
Construction standards and criteria are developed jointly between the Asset Investment group and the Strategy Manager, which is part of the Finance and Regulation group within Asset Management.
Most civil construction is either performed by customers to ESB Networks specifications or is outsourced to trained and supervised contractors.
Process
ESB Networks works with a variety of contractors for civil construction through its Contract Management group. The group has developed thorough guidelines for contractor/construction. ESB Networks has developed an in-house training course for civil construction and contractor supervision, and every manager within the group must take and pass qualification exams to earn this position. The basic process for contract management is the following:
- Initiate
- Plan control
- Execute
- Closure
As a part of the entire process, contact managers inspect sites and gather any information that would inform and improve the processes involved and make recommendations for any changes.
ESB Networks has developed a contractor capability with six different international contractors coming into the country with over 20 different nationalities represented. This has posed a challenge in understanding the individual contractor’s culture and communicating clearly ESB Networks’ safety rules. As a result, safety rules are strictly managed by ESB Networks Contract Management personnel. As a part of this process, contractors are brought to ESB Networks in the early stages and evaluated on work quality and safety procedures, with ESB Networks managers making specific recommendations for improvements. Contractors receive a monthly performance review.
All accidents or near misses are scrupulously reported. Accidents must be reported to the CEO within 24 hours. In the event contractors do not comply with rules on inspection, the entire operation is shut down. The principal contract manager on any project that experiences problems is accountable at the highest level, and must give a thorough explanation of how/why an accident, near miss, or problem occurred.
Technology
ESB Networks has developed its construction and contractor management standards by utilizing the tools and techniques detailed in “The Project Management Body of Knowledge Guide”© (PMBOK) from the Project Management Institute (see Figure 1). All contractor guidelines, standards, specifications, and work processes are detailed in an online repository for contractor use. Safety and safe procedures are emphasized throughout any construction and contractor engagement.

Figure 1:
PMBOK Guide
7.3.5.10 - Georgia Power
Construction & Contracting
Civil Construction
People
Civil structure design is the responsibility of the Network Underground engineering staff and its Standards Group. This group develops design standards for manholes, vaults, substations, duct lines, etc. The group is also involved in deciding the best approach for making repairs to civil infrastructure, such as manholes and vaults.
On specific projects, the design engineer is responsible for both civil and electrical design for company-owned facilities. Also, for customer-owned vaults which will contain GPC equipment, the GPC design engineer is responsible for coordinating with the customer’s engineers and architects, and for communicating to them the functional requirements of the vault.
The engineer also works closely with preferred contractors and customer building contractors, providing them with approved civil construction plans and overseeing their projects from beginning to end. Many Georgia Power customers have on-premises spot networks, for example, and the GPC engineer works with the customer building contractors to ensure the vault will meet the Network Underground requirements. The group often out-sources large civil construction projects to its preferred contractors, but all work is performed by Network Underground-approved standards and is supervised by engineers.
Process
Two examples of civil construction work performed at Georgia Power is the replacement of deteriorating brick vault roofs and the upgrading of manholes from standard, solid manhole covers to SWIVELOC manhole designs in select, high-traffic areas of downtown Atlanta (See Figure 1 and Figure 2.). The group is also contemplating moving to traffic-bearing vault grates in downtown areas.

Figure 1:
SWIVELOC manhole collar

Figure 2:
Underside of SWIVELOC lid
Technology
Civil engineers have access to reference designs in the Georgia Power Network Underground Standards book for duct line banks, manholes, vault, and other civil engineering standards adopted by the Network Underground group.
7.3.5.11 - HECO - The Hawaiian Electric Company
Construction & Contracting
Civil Construction
People
Civil Construction at HECO is the responsibility of the Construction Management Department, located within the Technical Services Division of the System Operations Department.
Most civil construction, including the installation of vaults, manholes and duct bank, is performed primarily by contractors at HECO. The Construction Management group manages the work of these contractors.
In URD developments, the developer is responsible for purchasing and installing the ducted manhole system per HECO specifications. The C&M Planning group of the C&M Underground Division has Construction inspectors who monitor the work of the developers and contractors to assure it meets HECO standards.
The C&M Underground group also has one Utility Assistant who performs small civil and structural tasks such as cutting a hole into an existing manhole.
Technology
In most applications, primary cables are installed in schedule 40 PVC conduits encased in 3- -inch concrete per HECO’s guidelines. Single phase cables are installed with a 3-inch “concrete cover” while three phase primary is installed with a 3- inch “concrete envelope”
See Attachment G.
7.3.5.12 - National Grid
Construction & Contracting
Civil Construction
People
Civil designs are performed by the Distribution Design group, part of the Engineering organization. There are two designers who perform network designs for the National Grid Albany network. Both designers work very closely with the field engineer, part of Distribution Planning, assigned to the underground department to support the Albany network.
The National Grid network field resources (network crews) are part of the group responsible for the underground system in eastern New York, called Underground Lines East. This group is led by a Manager, and includes a group focused on civil aspects of the underground system and a group focused on the electrical aspects. The Underground lines group is responsible for both the network and non – network infrastructure in eastern NY, including the Albany network.
The Civil Group is comprised of Mechanics, Laborers, and Equipment Operators, and is led by a supervisor. This group includes a machine shop located in Albany. The group has 23 field resources. This group performs minor civil projects, street lighting, heavy equipment (track diggers, bulldozers, cranes, tractor trailers, etc.), machine shop and “Haz Mat” cleanup.
Much of the larger civil construction work at National Grid is performed by external contractors.
Technology
All duct lines in the network at National Grid are concrete encased, including primary and secondary.
National Grid standards calls for pre-cast manholes and vaults. Standard vault size is dictated by size of the network unit. , National Grid has detailed standards that describe their underground electric vault requirements.

Figure 1:
Vault Entrance

Figure 2:
Vault ventilation grate
7.3.5.13 - PG&E
Construction & Contracting
Civil Construction
People
Civil designs, such as vault design, are performed by the Civil Engineering group within the Substation Engineering department.
Most civil construction work at PG&E is performed by civil construction resources from the PG&E Gas Division or by external contractors. PG&E network resources will perform minor civil repairs.
Technology
All duct lines in the network at PG&E are concrete encased, including primary, secondary and fiber ducts. Note that PG&E’s network design guidelines allow for no more than two feeders from the same network group in any one duct line.
PG&E uses both pre-cast and “poured in place” vaults. In their congested downtown area, most are poured in place. The rest of the system uses primarily pre-cast units. PG&E has detailed standards that describe their underground electric vault requirements.
7.3.5.14 - SCL - Seattle City Light
Construction & Contracting
Civil Construction
People
Organization
SCL has an Energy Delivery Field Operations department that includes a network Electrical Services group (Area Field Operations – Network) group, and a network Civil Services group.
The Electrical Services group is made of 84 total people including the supervision and a five-person cable-locate crew. (Note: this cable-locate crew does underground locating for the whole company). This group performs all construction, maintenance, and operation of the network system.
The Civil Services group consists of approximately 36 employees. In addition, SCL contracts approximately 25% of their civil construction work associated with their network system as well.
Process
Bi-weekly Crew Coordination Meeting
SCL convenes a bi-weekly crew coordination meeting focused on the project status of each active network project. Meeting participants include the supervision and others from the network design group (engineers), civil crew representatives, electrical crew representatives (including crew leaders), and customer service representatives who deal with customers who are adding load.
This meeting is effectively used to manage network construction projects. Representatives review the project status of both civil and electrical projects and identify actions necessary for the projects to proceed. A report is used that shows critical project milestones such as the vault acceptance date and feeder in date. Note that a similar form is used to track the progress of civil construction projects.
The meeting is also used to establish action items to identify network conditions that must be addressed. One example would be the identification of vault locations where ventilation is inadequate for the summer heating season. The group will identify an action plan to make contact with building owners to address these deficiencies.
7.3.5.15 - Survey Results
Survey Results
Construction
Civil Construction
Survey Question taken from survey results 2015 Survey results - Summary Overview
Question 012: Within your company, what percentage of the work for each task is contracted?


Survey Questions taken from survey results 2012 Survey results - Construction
Question 5.4: Do you contract any network civil construction work?

Question 5.5: If using contractors, what % of your total network civil construction work is contracted?

Survey Questions taken from 2009 Survey results - Construction
Question 5.3: Do you contract any network civil construction work? (This question pertains to question 5.4 in the 2012 survey)

Question 5.4: If using contractors, what % of your total network electrical work is contracted? (This question pertains to question 5.5 in the 2012 survey)

Question 5.5: Total number of Network civil construction workers

7.3.6 - Contracting
7.3.6.1 - AEP - Ohio
Construction & Contracting
Contracting
People
Day-to-day electric work in the network is performed by AEP Network Mechanics, with contractors used only for special projects and for civil work. All civil design and construction work associated with network projects, including design and construction of manholes, vaults and duct lines, is outsourced to civil contractors.
At the time of the practices immersion, AEP Ohio was engaged in several large projects that involve contractor resources, including a large project to identify and replace selected secondary cables (mainly butyl rubber and PILC), and a project to update network communication and control infrastructure. Contractors are being utilized on both of these large projects to perform the field work. AEP employees provide oversight and project management of these activities.
AEP Ohio employs two engineering contractor technicians who serve as engineering assistants, working closely with engineers, preparing construction prints and work order documentation.
Rubber goods testing is performed by a contractor.
Coordination with contractors is performed by both the Network Engineering group, who works closely with civil contractors on civil designs, and service center management, who provide contractor coordination and oversight.
Process
Design, construction, and repair of civil assets at AEP Ohio are outsourced to a civil contractor that has many years of experience working with AEP Ohio. The contracting firm works closely with the AEP Network Engineers before, during, and on final completion and inspection of any new civil construction or repairs. AEP has a close working relationship with a civil engineering firm, with the primary civil engineer at that firm having worked for AEP Ohio for many years and is thus experienced with the AEP Ohio underground networks.
AEP Ohio conducts periodic status meetings to monitor progress and manage completion of its larger projects.
7.3.6.2 - Ameren Missouri
Construction & Contracting
Contracting
People
Ameren Missouri has a strong contractor presence in its underground operations. They utilize contractors for performing much major civil construction work, such as building vaults, manholes and duct bank systems, and for selected inspection programs, such as manholes. Contractors are also used to perform core business tasks, such as cable splicing.
Ameren Missouri has a Resource Management Group that is organizationally part of Energy Delivery Technical Services. The group, led by manager, is comprised of construction supervisors who manage outside contractors. Construction supervisor positions are filled by resources with field experience (such as former linemen) or experienced with project estimation and management (such as former estimators).
Ameren Missouri has two or three contractors “of choice" for underground work. Ameren Missouri has three or four-year agreements in place with them. The contractors are part of the union and, hired from the local bench.
Process
Ameren Missouri enters into three or four-year agreements with “contractors of choice” for underground work. These contracts are awarded through a major formal sourcing event that involves issuing requests for quotes for contractor services. Contractors provide information such as unit prices, safety performance, etc. Once contracts are established, the underground group can employ their services without having to go out for bid on each separate project. Note that the underground group is not required to use the “contractors of choice” exclusively - they may competitively bid work to other contractors if business requirements warrant.
The Resource Management Group monitors contractor performance. Contractors provide weekly reports on their progress and spending. Ameren Missouri establishes contractor scorecards, which include a set of key performance indicators (KPI’s) against which the contractor’s performance is evaluated. The Resource Management Group reviews KPI’s quarterly with contractors.
When Ameren Missouri decides to outsource a project to one of these contractors, they request a cost estimate. In some cases they ask the contractor for a fixed price - such as a unit price to install a new manhole or to prepare a splice. In other cases, they will request a time and material estimate based on agreed-to pricing rates in the contract.
Contractors utilized for manhole inspections will address civil problems identified as required by the Missouri Public Service Commission (PSC). In some cases, contractors must use ground penetrating radar to find the manhole location (for example, manholes, which have been paved over).
Contractors are also utilized for civil work. For example, Ameren Missouri uses contractors to replace deteriorated vault roofs. Ameren Missouri provides the contractor with concrete specifications, and requires that the contractor take samples of each concrete pour to assure that it meets Ameren Missouri’s strength specifications.
Contractors perform directional boring, mostly in conjunction with cable replacement.
Contractors also perform cable splicing. At the time of the practices immersion, about half of the splicing work was being performed by outside contractors.
7.3.6.3 - CEI - The Illuminating Company
Construction & Contracting
Contracting
People
Civil construction, including the installation of vaults, manholes and duct back is performed by contractors at CEI.
CEI typically retains the services of five different contractors to perform civil work (construction and maintenance).
Process
The Underground Network Services group has one supervisor who runs the contractor crews.
7.3.6.4 - CenterPoint Energy
Construction & Contracting
Contracting
People
CenterPoint’s underground organization is centralized, with the resources who work with the major underground infrastructure reporting organizationally to one group - Major Underground. The field resources, Cable Splicers and Network Testers, who construct, maintain and operate the system, are part of the Major Underground organization.
Major Underground does outsource some of its work to external contractors. They have a Construction Coordinator who coordinates with contractors to accomplish this work. This Coordinator also works closely with the Lead Engineering Specialist within the Feeder design group on new construction work.
All civil work in Major Underground at CenterPoint is contracted, with the civil construction work being performed by one major contractor, with 14 different civil crews. This includes the construction of street vaults, manholes, and duct bank. CenterPoint also contracts out some of their civil design work, with the contractor performing surveying, obtaining easements and preparing manhole and conduit drawings for new projects.
CenterPoint also uses a contractor to perform inspections of civil facilities that are built by customers. This inspection will occur within 24 hours of the customer completing his work. At CenterPoint the customer has the option of building his own civil infrastructure on his property to CenterPoint specifications. The inspector assures that the work does meet specs. Note that these inspections exclude inspections of customer vaults in buildings.
CenterPoint also contracts underground boring.
Process
90% of the construction contracts are bid on a unit basis, such as cost per foot or cost per cubic yard. The design contracts are typically built with T&M rates based on the job description and work type.
CenterPoint has entered into a longer term relationship with their civil contractor – a 2 year term, with an option to continue for a third year. They have created an alliance relationship, which invests both parties in the other’s success. The parties will meet periodically to review performance, profits, and to establish future benchmarks.
Note that this contractor also performs non civil work on CenterPoint’s behalf. The terms of the alliance apply to all of the contractor’s work.
Contractors are required to certify that they have performed certain training with their resources. This includes training on excavation safety and the shoring of trenches. Contractors must show documentation of training, adherence to safety requirements, and their safety record to be considered.
Most of the work contractors do is de-energized, so PPE such as FR clothing is not required. Contractors will not chip concrete around energized conductors. CenterPoint will either de-energize facilities or perform the civil work themselves. (For example, CenterPoint will build a manhole over a hot duct)
Technology
Civil Design Contractors will utilize Microstation and AutoCad to prepare drawings.
7.3.6.5 - Con Edison - Consolidated Edison
Construction & Contracting
Contracting
People
Much of the civil work associated with subsurface construction is performed by contractors. Con Edison has a Subsurface Construction (SSC) group who interfaces with deals with vaults, conduit ducts, and other civil work.
Con Edison has a specification for the design and construction of 265/460 transformer vault and network compartments by a contractor. This specification describes the division of responsibility between the contractor and Con Edison, and provides the dimensional requirements as well as the design and construction requirements for these structures.
7.3.6.6 - Duke Energy Florida
Construction
Contracting
People
Contractor work at Duke Energy Florida is awarded through the Resource Management group. A resource planner and scheduler within the within the Resource Management group will assist with the contract details.
When a contractor is hired to perform work for the network system, Network Specialists temporarily oversee and coordinate the contractor’s day-to-day work. Duke Energy Florida requires on-site oversight of contractors while they are on the job.
Duke Energy Florida does not maintain a civil construction crew for building and maintenance of network buildings, vaults, manholes, or other non-electrical construction. Instead, the network group uses a “turn-key” contractor with a long tenure of providing work for the company, especially on large civil projects. Duke Energy Florida uses other, smaller contractors to perform smaller work, such as civil repairs and upgrades.
Duke Energy Florida will utilize contractors for electrical work as well, with contractors performing tasks such as cable pulling and preparation of splices.
Preparation of switching orders and the performance of actual switching of the network are handled by Duke Energy Florida network employees.
Process
Contractors, especially for larger projects, must go through an on-boarding process through the contract oversight group, including agreements to strictly adhere to Duke Energy Florida standards, safety practices, reporting procedures, and scheduling. Smaller civil project contractors, on an ad hoc basis, are hired based on expertise in specialties, such as manhole covers, construction repairs, and are not subject to an extensive on-boarding process.
Contractors are also called in when a network project is so large that it would impact the daily operations and overwhelm the work capacity of the company network personnel. For example, Duke Energy Florida is using contractors now to replace feeder cable throughout the network system (as described in the Cable Replacement section).
In the future, Resource Management intends to become more involved in contractor and construction projects. Plans are in place to meet twice a month with the network system group to determine when and where they need more construction work, contractors, scheduling, etc.
7.3.6.7 - Duke Energy Ohio
Construction & Contracting
Contracting
People
Duke Energy utilizes contractors to perform electrical work in their network. Because they have a network rehabilitation effort underway, they have supplemented their regular workforce with contractors to accomplish this work.
Rather than assign the contractor crews to separate work, Duke intermingles the contractor employees with their native crews. A given work crew would have a Duke crew leader, and crew members who may be either Duke or contractor resources.
In part, they did this because some of the contractor resources, though journeymen lineman, had limited experience working with network systems. Duke assigned these resources to work as ground hands until they could gain experience with their network system. In other cases, Duke was able to find and secure contractors who were familiar with working in network systems.
These contractor employees work seamlessly with Duke employees on the crew. The contract was awarded to an IBEW contractor, the same union that represents Duke field employees.
About one third of the total network workforce of 68 is contractor employees.
Duke also hires contractors to perform civil construction work.
Process
Duke Energy believes that labor resource limitations should never be a reason not to do necessary work. With the need for additional resources to address network rehabilitation projects they have underway, they consequently have supplemented their work force with contractors.
The T&D Construction Coordinator within the Dana Avenue Construction and Maintenance department is responsible for managing external contracts.
As the contractors are incorporated into the crews, there day to day reporting relationship is through the crew leader and construction supervisors, the same as a Duke employee.
Note that contractor resources are not used to prepare terminations or splices.
7.3.6.8 - Georgia Power
Construction & Contracting
Contracting
People
Organizationally, Georgia Power field resources that construct, maintain, and operate the network infrastructure fall within the Network Underground group.
Underground construction crews, consisting of resources who install cable and cable systems including civil construction, cable pulling and cable splicing, fall within the Network Construction department that is organizationally part of the Network Underground group, responsible for the construction of all underground network infrastructure throughout the state of Georgia, including Atlanta, Athens, Macon, Savannah, and Valdosta. The Network Construction group is also responsible for all concrete-encased duct line construction throughout Georgia Power, both network and non-network distribution. Georgia Power has decided that the Network Underground construction standards for duct lines should be adopted throughout the system, regardless of whether the duct lines are for network or non-network distribution. The company believes that standardizing on duct line construction throughout Georgia Power gives the company greater system-wide uniformity and ease of maintenance.
The Network Construction group utilizes contractors for performing much of the major civil construction work. Georgia Power has a few contractors of choice for underground work, and has standing agreements with these companies, many of which have been working for Georgia Power for a number of years. Contractors of choice adhere to the contractor’s safety rules, and do have the authority to operate the Georgia Power system.
Management of contractors is the responsibility of a supervisor within the Network Construction group. This contract manager reports to the Network UG Construction manager.
Process
If there is a big construction job or extensive night work that needs to be done, Georgia Power may assign the work to its preferred contractor(s). The supervising manager hands the plans over to the contractor and coordinates the work from beginning to end. Relying on contractors is especially productive as major projects ebb and flow, and Georgia Power wants to retain its own duct line, cable, and construction crews for smaller jobs that need a fast response and/or for work that may be too complex for contractors to handle in a reasonable amount of time. In some cases, contractors and Georgia Power Network Underground crews may work together on a project.
7.3.6.9 - HECO - The Hawaiian Electric Company
Construction & Contracting
Contracting
People
Most civil construction, including the installation of vaults, manholes and duct back, is performed primarily by contractors at HECO. The Construction Management group manages the work of these contractors.
In URD developments, the Developer is responsible purchasing and installing the ducted manhole system per HECO specifications. The C&M Planning group of the C&M Underground Division has Construction Inspectors who monitor the work of the developers and contractors to assure it meets HECO standards.
Process
HECO requires all contractors to receive basic safety orientation and to be certified as having completed this training. The training is conducted by the HECO safety department. See Safety - Contractor Safety Orientation and Certification .
7.3.6.10 - National Grid
Construction & Contracting
Contracting
People
National Grid routinely uses contractors to perform major civil construction work. A Field Construction Coordinator within Construction Delivery manages the contractor crews.
Electrical work as well as design work is normally performed by National Grid resources, though some projects are out sourced.
Process
National Grid has identified prime vendors and backup vendors by area. Projects below $100,000 are assigned to the prime vendor (or backup) and are not individually competitively bid. However, projects over $100,000 each are competitively bid.
National Grid solicits lump sum bids for civil work. They are in the process of moving to a rate based bidding approach; that is, receiving and evaluating bids based on a daily rate for a civil crew. National Grid is also exploring unit pricing and is developing underground units.
Contractors are qualified through ISNET World[1] , a worldwide contractor database that houses safety statistics/contractor evaluations, etc. This qualification assures that contractors are certified to National Grid standards.
Civil contractors will enter energized vaults and manholes if they are qualified to work in confined spaces. Civil contractors will also break in and out of energized duct banks. If the project involves moving of electrical facilities, National Grid electrical crews would be used.
Technology
National Grid tracks the number of contractor resources in a data base (ISNET).
[1] ISNetworld is the global resource for connecting corporations with safe, reliable contractors in capital-intensive industries. isnetworld.com
7.3.6.11 - PG&E
Construction & Contracting
Contracting
People
PG&E normally does not supplement their native workforce with contractors to perform routine work (construction and maintenance) in the network. However they do utilize external contractors to perform certain targeted work types. For example, PG&E uses an external contractor to perform environmental cleanups of vaults and manholes.
External contractors are managed by the particular group, which engages the contractor.
Process
PG&E has well defined procedures for external contractors that list exactly where the contractor will work and what they are to do. As for internal employees, these work procedures are written in a table format, and are supplemented by checklists where applicable to simplify their use. Contractors will complete the checklists for the work they are performing.
One example of an activity normally contracted at PG&E is the cleaning of vaults or manholes than may have environmental concerns, such as biohazards.
Another place where contractors are used is the high-rise transformer replacement program. Within this program, any oil filled units within the footprint of the building will be replaced with dry-type transformers. For these change outs, PG&E has hired an external contractor to do all of the work “turnkey”, including all of the connection work.
Another example of the use of contractors is in the implementation of PG&E’s new SCADA monitoring project. This project includes the installation of new fiber optic cable. PG&E has hired a contractor to pull the new fiber through the existing duct system.
Also, as part of the SCADA monitoring project, PG&E has hired a contractor to install the required sensors on the network units. When implementing the SCADA project, PG&E did a pilot, which showed that existing PG&E crews didn’t have the required expertise to do the sensor installations, as these installations involve drilling and thermal welding – skills for which PG&E crews are not trained. Consequently, they elected to hire external contractors.
Contractors will also be brought in to tackle specialty problems. For example, PG&E hired a particular university to model their 34.5kV feeders in order to assess where to place field switches to resolve problems with breakers opening based on inrush current and harmonics.
Another example is the hiring of an external contractor to assist PG in developing an oil analysis program for network equipment, with triggers for action based on test results.
Another example is the use of an external testing laboratory to analyze oil samples. PG&E uses this laboratory to test the efficacy of its internal laboratory. For a period of time, they will double sample, with one sample being sent to the external lab.
Technology
PG&E is in the process of implementing tablet computers. Work procedures, such as those used by contractors, are being entered into the tablet computers. Instead of writing information onto manual checklists, employees and contractors can enter the information directly into tablet computers or use bar coding to inventory equipment.
7.3.6.12 - Portland General Electric
Construction & Contracting
Contracting
People
For CORE work, the use of contract services is applied to civil work, including things such as manhole lid replacement and construction and repair of duct banks. PGE does not typically utilize external contractors for electrical work in the core. The company may utilize “overhead” crews at times to perform certain work activities such as pulling cable.

Figure 1:
Cables from duct bank
The Contract Services and Inspection (CS&I) department performs contract management. There are five construction managers within the CS&I group who provide project oversight on any work by contractors regarding PGE-owned infrastructure. This oversight includes the performance of inspections of contractor work. For larger projects, PGE may outsource inspections to external experts, such as POWER Engineers, Inc.
Third-party contractors involve Service & Design Project Managers (SDPMs) as well. For customer-provided infrastructure, such as spot network vaults that will ultimately house PGE facilities, customers will utilize third-party vault contractors who have received certifications from PGE. Field Construction Coordinators (FCC) working within the SDPM department inspect spot network construction performed by third-party contractors.
PGE issues three levels of certifications depending on the size and complexity of the civil structure to be designed and built. Level 1 involves installing a conduit duct bank. Level 2 covers vaults up to 7 x 12 ft (2 x 3.7 m) in size. Level 3 is anything above that size. The certification function is transferring to a contract management group.
Process
The day-to-day construction management of contracted work, such as holding weekly project status meetings, is the responsibility of a construction manager working for CS&I. In addition, for some large projects, typically at the transmission level, external inspectors may be retained.
The construction managers and inspectors work with contractors to ensure that the work carries out according to PGE specifications and standards, and meets quality expectations.
7.3.6.13 - SCL - Seattle City Light
Construction & Contracting
Contracting
People
Organization
SCL has an Energy Delivery Field Operations department that includes a network Electrical Services group (Area Field Operations — Network) group, and a network Civil Services group.
The Electrical Services group is made of 84 total people including the supervision and a five person cable-locate crew. (Note: this cable-locate crew does underground locating for the whole company). This group performs all construction, maintenance, and operation of the network system.
The Civil Services group consists of approximately 36 employees. In addition, SCL contracts approximately 25% of their civil construction work associated with their network system.
7.3.6.14 - Survey Results
Survey Results
Construction & Contracting
Contracting
Survey Question taken from 2015 Survey results - Summary Overview
Question 012: Within your company, what percentage of the work for each task is contracted?


Survey Questions taken from Survey Questions 2012 Survey results - Construction
Question 5.5: If using contractors, what % of your total network civil construction work is contracted?

Survey Questions taken from Survey Questions 2009 Survey results - Construction
Question 5.4: If using contractors, what % of your total network electrical work is contracted? (this question is 5.5 in the 2012 survey)

7.3.7 - Crew Makeup - Job Progression
7.3.7.1 - AEP - Ohio
Construction & Contracting
Crew Makeup - Job Progression
People
Electrical work on the AEP Ohio network is performed by Network Mechanics who report to Network Crew Supervisors at a service center. Project work orders, repairs, and maintenance are scheduled and dispatched from this center. Civil construction crews are provided by AEP Ohio’s Civil Engineering contractor.
Process
Crew Makeup
AEP Ohio Network Mechanics perform all electrical maintenance and network installations. Network Mechanics are members of the union (IBEW), and are categorized a D, C, B, or A-level grades, with Network Mechanic “A” being the highest rank. Each position has certain work duties associated with it (for example, a person must be at the Network Mechanic “B” level before working with primary distribution).
Network Mechanics working in the field are led by a Network Crew Supervisor, which is a non-bargaining job position. Network Crew Supervisors are typically promoted from the AEP Network Mechanic ranks.
Network Mechanics move up the ranks through a combination of on-the-job training (OJT) and formal training classes. Although there are formal tests at the end of each class, job progression is not determined solely by test results. Note that the progression through the Network Mechanic job family is not an “up or out” program (i.e., AEP does not mandate that every employee achieve the Network Mechanic A position in a prescribed time period, though attainment of the journey worker position is encouraged.) Pay increases associated with the achievement of particular levels are a function of company-union contracts and vary across AEP operating companies.
Training
Trainees must take eight separate formal training courses. Each of these courses is about two weeks in length and spread over a four-year time period. Some classes are led by a formal training supervisor, while other specialized courses are taught by Network Engineers or other experts. Trainees begin with basic distribution training and advance to courses on network protectors, cable pulling and replacement, and network maintenance and operations. In addition to craft training, AEP employees also receive ongoing safety training and participate in periodic outage drills.
In addition to formal training, “on the job” training (OJT) is also an advancement requirement. Field employees are expected to develop a “jack-of-all-trades” skillset. To foster this job competency, roles and responsibilities are regularly rotated on the crews, giving employees the opportunity to experience and hone their skills in a variety of job situations and have ample hands-on experience with a number of tasks. OJT requirements are not prescriptive. Rather, Network Crew supervisors assign personalized OJT opportunities to meet specific employee needs. If a Network Crew Supervisor (or Network Mechanic) believes that an individual requires experience in a given area, the supervisor will ensure that the employee is given an opportunity to gain experience by adjusting the OJT assignment to meet those specific needs.
Field crews also receive training in coordinating with civil contractor resources for large-scale jobs, such as the on-going replacement of secondary cable in the AEP Ohio system.
A practice of note at AEP is their investment in cross-operating company training. The parent company regularly makes training available to all its operating companies, allowing personnel to travel to other sites and receive specialized training or have visiting trainers from other operating companies hold sessions at its various AEP training facilities.
Technology
AEP Ohio has a well-maintained and extensive training center in its Groveport training facility (see Figures 1, 2, and 3). The center includes an indoor training facility for overhead line work, and a specific training center focused on Network system training.

Figure 1:
AEP Ohio indoor training facility. The network training center is located within this facility

Figure 2:
Cable splicing area at AEP Ohio training facility

Figure 3:
Network protector cabinets at AEP Ohio training center
The training center enables hands on training with commonly used equipment. For example, every network protector model in use at AEP Ohio is represented at the center, and personnel are trained in the safe operation and maintenance of each. Transformers, switches, cable splicing materials, and SCADA devices are available for demonstration and hands-on training within the center as well.
AEP equips its network mechanic trucks with onboard computers, making all training materials, practice instruction, and troubleshooting guides available online for use in the field.
7.3.7.2 - Ameren Missouri
Construction & Contracting
Crew Makeup - Job Progression
People
Organizationally, Ameren Missouri field resources that construct, maintain, and operate the network infrastructure fall primarily within three groups, all part of Energy Delivery Distribution Services. One is the Underground Construction group, one is the Service Test group, and one is the Distribution Operating group.
The Underground Construction Department consists of Cable Splicers, Construction Mechanics, and System Utility Workers. Cable Splicers and Construction Mechanics are journeymen positions. Cable Splicers perform work with the electrical infrastructure such as making up joints and terminations, including preparing lead splices. Construction Mechanics perform the civil aspects of the work. System Utility Workers serve as helpers to the other two positions, and perform duties such as cable pulling and manhole cleaning. Note that at the time of the practices immersion, Ameren Missouri was implementing a new position, called the System Journeyman, which combines the duties of Cable Splicer and Construction Mechanic. System Journeyman are responsible for performing minor civil work such as installing cable, switching and tagging, and performing cable testing and cable splicing activities.
Maintenance and operations of network equipment such as network transformers and network protectors are performed within the Service Test Group and Distribution Operating Group. The Service Test Group is made up of Service Testers and Distribution Service Testers. Service Testers perform low-voltage work only. They focus on things such as voltage complaints, RF interference complaints, and testing and maintaining batteries. Distribution Service Testers perform network protector maintenance, transformer maintenance including oil testing, and fault location. The Distribution Service Tester position works routinely with network infrastructure. Distribution Service Test group positions are typically filled from the Service Testers, Traveling Operator positions, or Gardener positions (a practice related to a historic practice of filling department positions with resources who maintained substations.)
The Distribution Operating group is made up of Traveling Operators, who perform switching on the system, including placing tags and obtaining clearances. They act as first responders and troubleshooters.
See Organization
Process
Ameren Missouri has a 30 month mandatory progression for Cable Splicers, Construction Mechanics, and System Journeymen, whereby employees must move through a program of formal training, on the job training (OJT) and testing and achieve the journeyman level within this period. Employees must spend at least one year as a System Utility Worker before entering the program.
Ameren Missouri has recently designed a formal training program for underground construction worker progression. In the past, there was no formal journeyman program for underground, and all training associated with underground was performed in-house, within the department. More recently, Ameren Missouri has implemented a formal program, with the training, testing and proficiency demonstration conducted at the Dorsett training facility. This 30-month program includes things such as electrical principles and theory. A recent change is that System Journeymen, a new position, are sent to a six-week course on switching and grounding, and electrical excavation issues. This training, held at the Dorsett training facility, is important to System Journeyman, as they have switching and tagging responsibility.
At the time of the practice immersion, Ameren Missouri was investigating new programs to filter prospective underground workers to assure they identify the right workers for underground positions. These programs would be analogous to overhead line worker boot camps, where perspective linemen are given hooks and an opportunity to climb to assess their fit for line worker positions.
Distribution Service Testers have a similar mandatory progression program, with employees expected to reach the journeyman level in 22 weeks. Like the positions within the Underground Construction Group, the Distribution Service Tester program also consists of formal training, testing and on the job training. Distribution Service Test employees receive significant on-the-job training both as they advance to the journeyman level, and on an ongoing basis. The department manager rotates crews on four-month assignments to assure that employees get exposure to various assignments, including network maintenance, capacitor maintenance, and fault location.
Working with the union, the Distribution Service Test Group has developed a set of basic entrance requirements to screen applicants. These requirements are summarized in a set of Pre-evaluation Modules for the Distribution Service Test position that require applicants to demonstrating the ability to perform tasks such as:
- Properly lift and transport up to 60 pounds,
- Operate and perform work from a bucket truck,
- Set up and work from a ladder,
- Perform work in enclosed spaces,
- Utilize hand tools,
- Lift and use an Extendo stick,
- Walk and perform work on uneven ground and terrain,
- Climb to the top of a power transformer and work on a primary bushing.
As a specific example, Ameren Missouri asks applicants to demonstrate the ability to go up in a bucket and remove and replace a capacitor oil switch within 20 minutes. Applicants must be able to meet the entrance requirements to enter the job family.
Technology
Much of the formal training associated with the advancement to the journeyman level for Cable Splicers, Construction Mechanics, System Journeyman, and Distribution Service Testers is performed at Ameren Missouri’s Dorsett training facility.
Ameren Missouri employees also receive a number of safety related courses such as manhole entry and rescue.
7.3.7.3 - CEI - The Illuminating Company
Construction & Contracting
Crew Makeup - Job Progression
People
CEI has one Underground Network Services Center to support the Underground, including the networked secondary and non network ducted conduit system. The service center includes the Underground Electricians who construct, maintain and operate the underground system.
The Underground Electrician family of jobs is represented by collective bargaining – UWUA Local 270.
The Underground Electrician family is comprised of an Electrician A, B, C and Leader. The Electrician C is an entry level job, normally filled from internal candidates and selected based on seniority. Jobs in the underground department are “sought after” and are thus filled internally, often from meter reading.
People in this job family move from an Underground Electrician C, to a B, and finally to an A, which is the journeyman level. Advancement in the family involves “on the job” training, formal skills demonstration and testing. Advancement is not through an automatic mode of progression – management determines the number of positions at each classification.
Note that journeymen in this classification are “jacks of all trades”; that is, they will perform all required work in the ducted manhole system, including maintenance of network equipment, preparation of splices, pulling cable, etc.
See Organization.
Process
Advancement through the Underground Electrician job family involves a combination of training, job skills demonstration, and testing.
Employees are required to review training modules for selected tasks (example: Manhole / Vault Entry). The employee is responsible to review the module and discuss its contents with their supervisor. They will then take a written test to demonstrate their understanding of the material included in the module.
Employees are each given a “skills book” that lists the individual skills they are responsible to learn and demonstrate in order to advance. The employee will develop these skills through on the job training. When an employee feels he is proficient in a certain skill, he can demonstrate the skill, and have it signed off in the skills book. As employees within a classification demonstrate skill proficiency, they move up in pay within that classification.
In order to be eligible to advance from one classification to the next, employees must pass a progression test, administered by the training department. Advancement is not automatic – management determines the number of positions at each classification.
Technology
The skills book is filled out manually by the employee.
7.3.7.4 - CenterPoint Energy
Construction & Contracting
Crew Makeup - Job Progression
People
CenterPoint’s underground organization is centralized, with the resources who work with the major underground infrastructure reporting organizationally to one group - Major Underground. The field resources, mostly Cable Splicers and Network Tester, who construct, maintain and operate the system, are part of the Major Underground organization.
Both the Cable Splicer and Network Tester family of jobs are represented by collective bargaining – IBEW, local 66.
Crew Leaders at CenterPoint are non bargaining positions. A Crew Leader has around 15 resources working for him. These resources work in smaller groups sized depending upon the project. The senior position on the crew, a Head Cable Splicer or Head Network Tester, is the on-site leader of the crew.
The Cable Splicer family is comprised of a Helper, Apprentice Cable Splicer, Journeyman Cable Splicer and a Head Cable Splicer. The Helper is an entry level job, normally filled from the outside. Apprentice positions are normally filled from the Helper position. CenterPoint requires Helper candidates to have a high school diploma or GED.
Similarly, the Network Tester family is comprised of an Apprentice Network Tester, a Journeyman Network Tester and a Head Network Tester. The Apprentice is an entry level job, normally filled from external candidates. CenterPoint desires Apprentice network Tester candidates to have an Associates education in electronics or equivalent electrical experience.
CenterPoint also uses Heavy Equipment Operators (three positions).
Process
Advancement through the Network Tester and Cable Splicer job families involves a three year apprenticeship program that includes a combination of training, job skills demonstration, and testing.
Network Testers are hired as apprentices, and enter into a three year apprenticeship program. They initially attend a three week orientation program that includes pole climbing. New employees must successfully complete this three week orientation to remain in the apprenticeship program. After the first 90 days of being accepted into the program, Network Testers participate in a second three week program where they receive additional overhead line training and company orientation. (Major Underground employees support overhead departments in emergency restoration efforts).
The apprenticeship program is broken in to 6 six month classes that include classroom training, OJT, and testing to move from one class to the next. Movement from one class to the next is accompanied by salary increases. If an individual cannot pass the tests and other requirements, he will not advance. He will be given a second opportunity to pass and advance, If he cannot, he is rejected from the program. (He may be able to find other opportunity within CenterPoint).
At the completion of the three year program, the employee becomes a journeyman Network tester.
Similarly, Apprentice Cable Splicers, selected from Helpers who have completed one year with the company, enter the Cable Splicer apprenticeship program. They, too initially attend a three week orientation program that includes pole climbing. After being accepted into the Apprenticeship program, cables splicers participate in a second three month program where they receive additional overhead line training and company orientation. Cables Splicer overhead line training is more intense that that of network Testers because their job classification requires them to work with riser poles.
At the completion of the three year program, the employee becomes a journeyman Cable Splicer.
Head Cable Splicer and Head Network Tester positions are filled only when there is an opening. Candidates must interview for these positions, and the most qualified individual is selected - not necessarily the senior man.
Employees are required to review training modules for selected tasks (example: Splicing – See Attachment - F .) The employee is responsible to review the module and discuss its contents with their supervisor. They will then take a written test to demonstrate their understanding of the material included in the module.
7.3.7.5 - Con Edison - Consolidated Edison
Construction & Contracting
Crew Makeup - Job Progression
People
Construction Group
Con Edison’s service territory consists of four regions: Manhattan, Brooklyn/Queens, Staten Island, and Bronx/ Westchester. The Manhattan Region is made up of three districts, including one headquartered at the W 28th St. Workout Center. The term “Workout Center” refers to a main office facility to which field construction and maintenance resources report. To provide a perspective on the size of a workout center, about 300 people work at the W 28th Street Workout Center, and they can field about 125 crews.
The Construction department consists of several groups:
-
Underground Group - The underground group is made up of Splicers, who splice cable of all voltages.
-
Installation and Apparatus (I & A) Group (includes a services group) - The I&A group installs and maintains network equipment, including transformers and network protectors. Within I&A, in Manhattan, there is a services group dedicated to connecting customers to the distribution network. In other locations, the services group may sit in a different part of the organization. This group does the splicing on the secondary system and deals with customer connection issues.
-
Subsurface Construction (SSC) Group - The SSC deals with vaults, conduit ducts, and other civil work. Much of this work is contracted.
-
Cable Group - The Cable group pulls in new cable and retires cable.
Note: the West 28th Street “Workout” Center also contains the Emergency Group (also called #9), which responds to smoking manholes, burnouts, and other emergencies. This group reports organizationally to the Field Operations Department (FOD).
Manhattan’s districts have seen significant load growth (overall, 3-4 %, but in pockets, the load growth is much greater). For example, in upper Manhattan and Harlem, properties are being converted to apartment buildings or commercial high-rise buildings.
This trend has created significant work in connecting new services, adding spot networks, and adding network transformers to reinforce the street grids. Con Edison has also had to create new networks by breaking an existing network into two to accommodate this increased load. An example would be the creation of the Fashion Network to transfer load from the Herald Square network.
Con Edison believes it easier to maintain smaller networks; however, with less copper in the street, smaller networks can be considered less reliable. When Con Edison does encounter problems, particularly in the summer, the utility engages in “shunting,” which is the term they use to describe running cables above the street to bypass or “shunt” the problem and pick up the loads from an alternative source. The utility also runs generators if necessary to provide support to pocket areas during emergencies to meet customer load expectations.
Network Job Progression, OJT
Workers enter as a General Utility Worker (GU) and then progress either through the Splicer or the I&A Mechanic families with on-the-job training (OJT), training, and testing.
In the Underground group (Splicers), a person can progress to a Splicer in as little as two years. Con Edison does not have a mandatory automatic mode of progression; that is, employees are not mandated to progress to a journeyman position within a given period of time. Nor are employees prevented from advancing if they accomplish the prerequisite time, training, and testing.
After 18 months, GU’s are eligible for splicing school, a three-month program offered by Con Edison and conducted at their training center. When employees return to the field from Splicing School, they are assigned to a supervisor who is responsible for their training and development while on field assignment. Con Edison has specific OJT requirements that Splicer candidates must satisfy before being able to progress to a Splicer. (See Attachment C for a listing of the specific tasks in which a Splicer candidate must demonstrate proficiency.)
Splicer candidates can perform their OJT requirements over a minimum seven-month period. When candidates believe they are ready to perform an OJT, they inform their supervisor and the splicer with whom they are presently working. If all agree that the candidate is ready to “solo,” the OJT moves ahead. The candidate, supervisor, and training splicer review the OJT and hold a job briefing. The candidate then performs the OJT with as little input from the observer (supervisor or training splicer) as is possible. The supervisor evaluates and documents the OJT. (See Attachment D for a sample evaluation sheet used by Con Edison to evaluate and document the OJT accomplishment [ESP0061].)
After completing the OJT requirements, Splicer Candidates can then take a written and practical promotional exam and progress to a Distribution Splicer (journeyman position).
In the I&A group, individuals can progress to a journeyman Splicer as well. A GU can progress to a Mechanic B after six months, a Mechanic A after two years, and then become a splicer in the I&A organization. As described above, there is formal training and testing associated with this.
Con Edison directs General Utility workers (GUs) to either the Underground area (Splicers) or I&A area based on need.
Overtime
Workers expend 30 – 40 % of their time on overtime. Work is planned for 10-20% overtime, with emergencies and efforts to complete system reinforcement projects prior to the summer loading season adding to the levels of overtime worked. The company implements 12-hour shifts in these high work periods.
Supervisors get paid to work overtime at a straight time rate.
Planning and Survey Group
The Planning and Survey group is a subset of the Field Engineering group, and consists of Surveyors, who perform survey work associated with new construction, and Planning Inspectors, who go into the field, and assess the specific field conditions and determine what is necessary for the new installation to be built successfully. Planners and surveyors can work separately, or work together on projects. This group works closely with Energy Services, taking layouts developed from maps by Energy Services on Microstation, and field checking them to identify the specifics of the job and ensure that the layout reflects field conditions. This group prepares job sketches to obtain the necessary permitting to complete the job.
7.3.7.6 - Duke Energy Florida
Construction
Crew Makeup - Job Progression
People
Organizationally, Duke Energy Florida field resources that construct, maintain, and operate the urban underground and network infrastructure within Clearwater and St. Petersburg fall within a specific Network Group which is part of the Construction and Maintenance Organization. More broadly, Duke Energy Florida’s Construction and Maintenance organization is divided into regions, with both Clearwater and St. Petersburg falling within their South Coastal Region. The Construction and Maintenance organization for the South Coastal Region is led by a General Manager. The region consists of various Operation Centers, organized either geographically or functionally throughout the Region. For the urban underground infrastructure (manhole ducted underground systems, including networks) in the region, Duke Energy Florida has established a separate Operation Center, led by a supervisor, and comprised of craft workers who work with all of the network manhole and duct line systems in both St. Petersburg and Clearwater.
Duke Energy Florida has two craft worker classifications for working on network infrastructure – Network Specialists and Electrician Apprentices (EAs). Note – historically, there were three different Journeymen classifications: Cable Splicers, Automatic Equipment Specialists, and Electricians. The Automatic Equipment Specialists, Cable Splicers, and Electricians were combined into one classification called Network Specialists to prove more flexibility in work assignments. Currently, the Network Construction and Maintenance group consists of five Electrician Apprentices and five Network Specialists. Of the ten resources, five are typically assigned to Clearwater, and the remaining five to St. Petersburg, though resources are moved between both based on work needs.
Electrician Apprentices are the entry level position into the Network Construction and Maintenance department. Electrician Apprentices provide assistance to Network Specialists while receiving on the job training. In addition, Electrician Apprentices are able to splice URD cable and any cable in the network system excluding lead and submarine cable.
The Network Specialist position is considered a “jack-of-all trades” position. The Network Specialist can splice all cables (including lead and submarine cable), pull cable, and perform switching. Maintenance and operations of network equipment such as network transformers and network protectors are also performed by the Network Specialists.
The Network Construction and Maintenance group also utilizes contractors for performing much of the major civil construction work. Duke Energy Florida has a few contractors of choice for underground work, and has standing agreements with these companies, many of which have been working for Duke Energy Florida for a number of years. In addition to using contractors to performing civil construction work, Duke Energy Florida, may employ contractors to perform electrical work, including pulling cable and splicing. This work will be done under the safety and quality oversight of designated Network Specialists.
Duke Energy Florida maintains a central training facility in Clearwater that primarily focuses on Overhead training, although there are some underground network training facilities there. Most of the training for Electrician Apprentices and Network Specialists, however, is delivered either as on the job training, or delivered in sessions held within their Clearwater supply and maintenance facility, located within the same complex as the Clearwater network underground office. Most training, both formal and on the job, is delivered by senior Network Specialists and Engineers. Training associated with advancement within the Electrician Apprentice family is managed informally, and led by the Network Specialists.
Process
Electrician Apprentices are the entry level position in Duke Energy Florida’s Network Construction and Maintenance group and can progress into a Network Specialist position based on seniority, qualifications, and if an open Network Specialist position is available. All Electrician Apprentices and Network Specialists are represented by collective bargaining, IBEW. Currently, there is no test or examination to progress from an Electrician Apprentice to a Network Specialist. Network Specialist progression is based on both seniority and qualifications as an Electrician Apprentice; that is, vacant positions are filled by the senior qualified man.
Current Training/Progression Practices
There is no automatic progression at Duke Energy Florida from Electrician Apprentice to Network Specialist as Electrician Apprentices will need to bid out of their job classification after a Network Specialist position becomes open. Prior to being able to bid for a Network Specialist position, the Electrician Apprentice must complete between 48 and 54 months of on the job training to become qualified.
The Electrician Apprentices are trained on the job under the guidance of Network Specialists. The program is managed informally. After successful demonstration of knowledge and completion of work tasks, Network Specialists will sign off on a training sheet. As the task sign off sheets are completed, the Electrician Apprentice will progress up through four job steps. At the highest level, Electrician Apprentices are qualified to bid on available Network Specialist jobs. The senior qualified Electrician Apprentice will get preference for the available Network Specialist position.
There is currently no job forecasting at Duke Energy Florida. Electrician Apprentice and Network Specialist positions are posted on demand. Once a person either leaves the position or files his retirement paperwork, the job will be posted for qualified Electrician Apprentices to bid.
Training Practices of the Future
The training program at Duke Energy Florida is currently in transition for Electrician Apprentices. Duke Energy Florida will begin to use formalized training for step advancement through the Electrician Apprentice position. Included in the formalized training are prepared job aids detailing procedural step-by-step instructions how to perform tasks. Example job aids include how to enter manholes, identification of transformers, grounding, cable piercing, and electrical theory instruction.
In addition to job aids, work methods for the work tasks performed by Electrician Apprentices and Network Specialists are being prepared. The work methods explain the procedural “how-tos” for performing specific tasks such as Grounding and Piercing Underground Cable,
(see Attachment G ). Work methods used for tasks performed sometimes exceed the safety and work practices standards defined by the rest of the company outside of the Network Maintenance and Construction group because work on the network is specialized and has different requirements from overhead line work.
Job aids and work methods that are being developed, will be separated into four phases for formalized training. Each of the phases represents the training expectations for one year. Completion of each of the four phases will allow for progression through each of the four steps for Electrician Apprentices. Electrician Apprentices will be required to demonstrate competency of the job aids and work methods for his current job step before advancing to the next step.
Currently, the job aids and work methods are in development. Once completed, incoming Electrician Apprentices starting at step level one will be expected to show competency in the job aids and work methods before progressing up in steps. Electrician Apprentices at higher steps when the new training is implemented will not be required to complete job aids and work methods for their continued progression. Additional required formal classroom training is being discussed prior to implementation.
Technology
Training associated with advancement within the EA family is managed informally, and led by the Network Specialists.
Within their Clearwater facility, Duke Energy Florida has established training aids, including a simulated manhole where training can be performed on various activities in a simulated manhole environment. This simulated manhole, made of plywood, is mounted on wheels so that it can be moved within the training center see Figures 5-1 and 5-2). It contains cable racks, and can be used to simulate cable racking for both primary and secondary cables. For training. Network Specialists will typically outfit the manhole with commonly used materials and equipment, with cutaways (such as a cable limiter with insulation cut away, exposing the fusible link), so that EAs in the program are exposed to components.

Figure 1:
Manhole simulator - exterior

Figure 2:
Manhole simulator – interior
Network Specialists also maintain a “Training Board" which contains samples of all the primary and secondary components used on their system (see Figure 3).

Figure 3:
Training Board
Finally, Duke Energy Florida utilizes training aids such as figure 3 to provide insight into typical devices used on the system (components display, primary switched, Network Protectors).
All Duke Energy Florida employees receive a number of periodic safety-related courses and refreshers, such as manhole entry, manhole rescue, and CPR training. (See Safety and Drills sections in this report.)
7.3.7.7 - Duke Energy Ohio
Construction & Contracting
Crew Makeup - Job Progression
People
The Dana Avenue underground group is comprised of Cable Splicers and Network Service Persons. These are bargaining unit positions. Advancement in both job families is through an automatic mode of progression.
Process
Job advancement within the Splicer family is through an automatic mode of progression. That is, employees in this job family are expected to progress to the senior level (an “up or out" program.)
The process for hiring Splicers into the department is as follows:
First, Duke Energy Ohio will run an advertisement to solicit interest in the position. They screen resumes looking for a few key skill sets. Once they’ve developed a potential list of candidates, they invite those candidates in to take an aptitude test. (Their historical experience has been a high failure rate by applicants taking this test.)
Potential applicants also undergo hands-on testing at Duke’s DANA Ave training center, including things such as digging a hole and performing tests of their manual dexterity. Then, applicants undergo a rigorous “two on one” interview. From these various tests, applicants are scored. They can receive a high pass, pass, low Pass, or fail.
Employees are hired from this candidate pool.
New hires come into the department as a Cable Helper for the first six months. During this six-month time, they receive both classroom and on the job training, and are then brought in for a test, where they are asked to prepare a simple splice. If they pass this test, they advance to a C Splicer.
An individual will spend two years as a C Splicer, during this time period, they receive both formal and on-the-job training. After two years they are brought back in for a test where they prepare a more complex splice, and a transition joint. If successful, they will then advance to a B Splicer.
Individuals will spend a year and a half as a B Splicer. During this time, they undergo more rigorous classroom training, and more OJT. At this point, they take a test that includes the preparation of a five way splice. If successful, they will be promoted to an A Splicer. The A Splicer is the journeyman level in the job family.
Upon need, Duke will fill either Senior Splicer positions or Network Service Person positions from the A Splicer position. Duke’s current procedure is to select the most senior man to fill the Senior Splicer or Network Service Person positions. The Network Service Person does 100% network type of work including maintaining network equipment such as network protector. The Senior Splicer does all work from the top side of the switch up, such as making high side connections, and building terminal poles.
Dana Avenue supervision noted that one shortcoming of the existing system, is that it prevents them from hiring a “skill set”, such as a breaker expert.
Note that climbing is not a requirement for advancement in the Cable Splicer job family. At Duke Energy Ohio, the District offices are responsible for house drops. Any work performed by Dana Avenue can be performed out of the bucket or ladder.
Cable Splicers are required to have a CDL license.
7.3.7.8 - Energex
Construction & Contracting
Crew Makeup - Job Progression
People
The journeyman position for working with cable systems at Energex is the cable jointer position. Employees move through the jointer apprenticeship program in about three and one half years. The apprenticeship includes formal training, testing, on the job training, and time in grade. At the conclusion of the apprenticeship, persons in the program must still complete a “basket of skills” required by the electrical office. These skills are over and above the skills that are taught as part of the apprenticeship, but necessary for the employee to be a fully qualified jointer. Employees complete this basket of skills in the first 18 months after apprenticeship. Consequently, it takes 5-6 years in total before an employee is fully qualified to run a job. See attachment for a sample of the basket of skills required for cable jointers. ( Attachment A: Cable Jointer Skills )
Energex’s training requirements match the requirements of the Australia Qualifications Framework (AQF), and are thus, accredited. This qualification is recognized throughout Australia and is “fully transportable". So, an employee who receives a qualification as a Cable Jointer from Energex would be recognized as a cable jointer outside of Energex. Energex complements the training requirements outlined by the AQF with training requirements specific to the electric industry, such as a requirement to be able to terminate cables on switch gear. Training courses are developed by reviewing documented work practices, and with input from Energex people with strong knowledge of the work.
The following two agencies drive job progression/competency:
-
Electrical Safety Office requires that employees show competency and currency in the following:
-
Performs licensing, policing, and proof of the currency of employee competency and skills.
-
Defines the competencies in which employees must be proficient. Requires that employees are licensed and that we can show proof of competency and currency.
-
-
Workplace Health and Safety Office mandates the following:
-
Requires that employees have a safe system of work.
-
Decides which safety training employees should receive, such as training on proper PPE, for example.
-
Process
Training is based on work practices. Work practices are developed with input from SMEs, and with input from the Operating Advisory Council (OAC). Note that the OACs are made up of representatives from Standards, Design, and field personnel such as cable jointers. The work practices group documents how tasks are performed. The OAC decides whether the work requires an employee to demonstrate competency, and if that competency needs to be periodically reviewed. High-risk tasks may require frequent refreshers to renew competency. Lower risk tasks may only require a one-time training.
7.3.7.9 - ESB Networks
Construction & Contracting
Crew Makeup - Job Progression
People
Cable splicing at ESB Networks is performed by Network Technicians, the journey worker position. The Network Technician is a mutli-faceted position, performing both line work, such as building pole lines, and electrical work, such as making connections at a transformer. Network Technicians work on all voltages from LV through transmission voltages (400kV). Note that ESB Networks created the Network Technician position in the 1990s by combining a former Line Worker position and Electrician position.
Work specialization for Network Technicians is by assignment. ESB Networks has implemented a system of approvals that ultimately “allows” an NT to complete a particular work type. This effectively specializes the NT into three specific areas:
-
Area Staff – This is a customer facing position that services as the first point of contact for faults on the system, analogous to a “trouble man” position at many US utilities.
-
HV Stations - NTs in this area specialize in high voltage (HV) sub-stations. Within this section there may be approved cable jointers and commissioners.
-
Lines Staff – NT ’ s in this area specialize in line construction. Within this section there may be approved cable jointers.
In Dublin, where the majority of the distribution infrastructure is underground, Network Technicians work mainly as cable jointers, installing underground cables and accessories. ESB Networks rotates Network Technician work assignments as business needs require.
The Training and Asset Management groups work closely with Network Technicians working as cable jointers to ensure that they understand the science of cable joints and have an appreciation for the importance to long-term joint reliability of performing the proper steps associated with cable joint preparation.
ESB Networks has a four-year apprentice training program for attaining the journeyman Network Technician position. The content of this program conforms to a national standard (Ireland). The journeyman position is qualified as both a “linesman” and an “electrician.” (Historically, at ESB Networks, a “linesman” builds lines, and an “electrician” makes connections such as at a transformer.)
Process
The apprentice program consists of formal training (both ESB Networks-offered training and university training), testing, on-the-job training (OJT), and demonstration of proficiency. One of the points in the apprenticeship is a “One Stop” in the third year of the apprenticeship. The One Stop is a demonstration by the apprentice of the ability to perform construction of a MV line (10 kV), including the construction of multiple spans, installation of transformers, installation of secondary, installation of services to the meter, commissioning equipment (such as performing a Meggar test on the transformer), and energizing facilities.
Much of the formal training associated with the apprenticeship occurs at the ESB Networks training facility. This facility includes an indoor training facility with sample equipment from the station level down to LV network built to the specifications of its system (for example, 38-kV and 10-kV spacing on equipment). ESB Networks’ training approach is to expose apprentices to the practical application by having them work on real equipment in this test environment before exposing them to field conditions. This approach gives apprentices an opportunity to familiarize them with the equipment and its operation in a safe environment, before working that same equipment in the field.
Throughout the apprenticeship, the apprentice must complete a training and assessment record that tracks the progress of both the formal course work taken in a university setting, as well as on-the-job training (see Figure 1 and Figure 2). In addition, ESB Networks utilizes a very detailed and comprehensive “Apprentice Handbook”, which must be completed during the four year apprenticeship. At the conclusion of the apprenticeship, the apprentice is given a certificate and a card certifying that he is a qualified electrician.


Figure 1 and 2:
Apprenticeship training and assessment record
7.3.7.10 - Georgia Power
Construction & Contracting
Crew Makeup - Job Progression
People
Organizationally, Georgia Power field resources that construct, maintain, and operate the network infrastructure fall within the Network Underground group, a central organization that is responsible for all network infrastructures, led by a manager. The Network Underground group is responsible for network underground infrastructure throughout the state of Georgia, including Atlanta, Athens, Macon, Savannah, and Valdosta. The Network Underground group is responsible for all of the manhole and duct line systems at GA Power, both network and non-network.
The Network Underground group consists of Test Engineers, Cable Splicers, Duct Line Mechanics, Civil Construction Engineers (for design and supervision), Test Technicians, Winch Truck Operator (WTOs), and Light Equipment Operators.
Cable Splicers perform work with the electrical infrastructure such as making up joints and terminations, including preparing lead splices. Cables splicers also pull cable and operate network equipment.
Duct Line Mechanics perform the civil aspects of the work, including duct line, manhole and vault construction. Duct Line Mechanics may also pull cable. The Network UG Construction group also utilizes contractors for performing much of the major civil construction work. Georgia Power has a few contractors of choice for underground work, and has standing agreements with these companies, many of which have been working for Georgia Power for a number of years. Cleaning and civil maintenance is inspection-driven. If, during routine inspections, a field engineer, Test Technician, or journeyman finds and documents the need for civil maintenance or cleaning into the company’s DistView or GIS system, the appropriate construction crew or cleaning crew is dispatched for further analysis and action.
Maintenance and operations of network equipment such as network transformers and network protectors are performed by Test Technicians within the Test Group of the Network UG Operations and Reliability group.
The Winch Truck Operator position (WTO) is a helper type position and is not unique to the Network Underground department. WTOs send down material and supplies to Duct Line and Cable Splicing crews when working on network underground projects.
Process
Winch Truck Operators (WTOs) are the entry level position at Georgia Power’s Network Underground group and can matriculate into either a Cable Splicer or Duct Line Mechanic Apprenticeship based on seniority and the employee’s desire to work in either area. Senior WTOs bid on open Duct Line or Cable Splicer Apprentice openings. Some employees never enter the apprenticeship programs, however, and remain as WTOs. There is no test or examination to enter into these Apprenticeships.
A typical cable-splicing crew consists of three men, including a Senior Cable Splicer, a Cable Splicer (the Journeyman position), and a Winch Truck Operator. Cable Splicer is one distinct job family within Georgia Power’s Underground Network group with the following progression:
- Apprentice Cable Splicer
- Journeyman Cable Splicer
- Senior Cable Splicer
Georgia Power typically runs a six-man crew for duct line work, but it depends on the nature and scope of the work. Duct Line Mechanic is another distinct job family within Georgia Power’s Underground Network group. Duct Line Mechanics are responsible for duct line work in the manholes and vault construction (pouring duct lines, construction, etc.). The Duct Line Mechanic group consists of the following positions:
- Duct Line Apprentice
- Duct Line Mechanics (Journeyman)
- Senior Duct Line Mechanic
All Cable Splicers and Duct Line Mechanics are IBEW. All network field workers report out of the Network Underground group’s main office in Atlanta, but the group also has 11 people stationed at another office on the north side of the city to be physically closer to their area of responsibility. There are 28 Journeyman Cable Splicers/Senior Cable splicers in Atlanta and 9 more in Augusta and Savannah. There are 12 Duct Line Mechanics. All normally work day shift only, but can be temporarily rescheduled for night work as needed. In total, Georgia Power Network Underground employs 72 union personnel.
Training
Both the Cable Splicer and Duct Line job groups have a three-year job progression to achieve journeyman status. Both job families require a combination of time, on the job training, formal training and testing to advance. Training, broken into six-month modules, is delivered at at the Georgia Power Network Underground training center, and taught by senior personnel. Each module has three-weeks of classroom training and requires extensive on-the-job training (OJT) to reinforce the skills presented in the formal training.
As a part of formal training, Apprentices must pass a test at the end of each six-month module before proceeding to the next level. Apprentices have two opportunities to pass each test. Apprentices receive a salary increase as they pass each level.
If an employee advances to Senior Duct Line Mechanic and wants to switch to Cable Splicer, he must go back through the three-year cable program and pass the apprentice program for a cable splicer. Georgia Power employs many more Cable Splicers than Duct Line Mechanics. The more popular job progression within the company is to move from a WTO to the Cable Splicer apprenticeship (more popular than the Duct Line Mechanic Apprenticeship, even though these positions pay about the same.) Note that the cable splicer job family is more technical than is the duct line mechanic family, and therefore requires more technical training, both formal and OJT.
The Network Underground group exposes apprentices to as many OJT tasks as possible. For example, the group will assign an apprentice with a Senior Cable Splicer to perform a particular task such as the preparation of a straight lead splice. Each Apprentice has an OJT book that contains a checklist of the various tasks that are required. The apprentice’s supervisor must sign and date the OJT checklist when the Apprentice has worked on a particular task. There are some tasks that are not formally part of the training program, but that the network underground leadership expects the apprentices to accomplish during their OJT. One such task is the proper racking of a manhole. It is the apprentice’s responsibility to ensure his supervisor signs and dates completed tasks in the OJT booklet.
Advancement is based on formal training and testing, not on completion of the OJT booklet; the supervisor can make arrangements to ensure each Apprentice receives the appropriate OJT tasks, whenever possible. Formal training often includes hands-on tasks, such as cable splicing. For example, two supervisors can evaluate an Apprentice’s splice and determine whether the apprentice prepared the splice correctly, examine the measurements, and make sure the splice meets Network Underground group specifications. Eventually, throughout the three-year program, these OJT tasks are completed.
Job Forecasting
It is notable that the Georgia Power Network Underground group regularly forecasts both union and non-union job function staffing levels on a three-year basis, based on anticipated promotions, attrition, and retirements. The group often rotates a Senior Cable Splicer or Duct Line Mechanic into a three-month rotation as a crew/distribution supervisor to gain management experience. The company calls this process “blue-slipping.” (Name comes from a blue slip of paper that was used to document the change). Network Underground supervisors confer and vet the top candidates to rotate into these “blue slip” positions. The “blue slip” rotation does not guarantee the supervisory job once it is vacant, but the “blue slipped” employees receive first consideration and interviews for any non-union supervisor positions that open up. The rotation also gives senior splicers and mechanics a chance to see if the management roles are jobs they might prefer. During the time of the “blue slip” rotation, these employees receive a temporary salary increase. If an employee moves out of the union into a supervisor position, the employee has two years to decide whether he would like to stay on as a supervisor or move back to his union position.
Georgia Power also offers a distribution engineering course, a two-week week class in basic distribution design that every new Georgia Power engineer attends. In addition, every Georgia Power engineer attends a network orientation session to introduce them to the network side of the business, and to gain recruits for the Network Underground group.
Technology
Much of the formal training associated with the advancement to the Journeyman level for Cable Splicers and Duct Line Mechanics is performed at the Georgia Power Network Underground training facility in Atlanta (See Figure 1 through Figure 4).

Figure 1:
Training Center – Network Unit. Note cutaway of termination chamber

Figure 2:
Training Center – Joint assembly practice area

Figure 3:
Training Center – Full size manhole

Figure 4:
Training Center – Termination assemble practice area
All Apprentices, as well as other Georgia Power employees, receive a number of safety-related courses, such as manhole entry, rescue, CPR, and storm emergency drills. (See Safety and Drills sections in this report.)
7.3.7.11 - HECO - The Hawaiian Electric Company
Construction & Contracting
Crew Makeup - Job Progression
People
At HECO, underground work is performed by both Cable Splicers from the C&M Underground Division, and Lineman from the Overhead C&M groups.
The C&M Underground Division at HECO is part of the Construction and Maintenance organization. The group is comprised of two UG supervisors, fifteen Cable Splicers, 2 Utility Mechanics, and 2 Utility Assistants. The Cable Splicer is the journeyman position in the department. These individuals perform all activities associated with the construction, maintenance and operation of the Underground system, including working with lead (PILC) cable and transition splices.
Note that the Underground group does not install or maintain network equipment such as network transformers or network protectors. Network equipment construction and maintenance is the responsibility of the Substation group at HECO. The Substation group is part of the Technical Services Division of the System Operations Department.
The Overhead C&M groups also perform work with underground facilities (normally, URD facilities). The journeyman position in the Overhead groups is a lineman.
The Cable Splicer and Lineman family of jobs are represented by collective bargaining – IBEW local 1260
Process
HECO has an automatic mode of progression for the lineman classification. Employees who enter the department are expected to successfully complete all required training and achieve the journeyman lineman position in four years.
A lineman who enters as an apprentice into the Overhead group must complete 6000 hours of work as an apprentice, including formal and on the job training, in order to become a Lineman – First Year. Apprentices who have completed the training must pass a timed open book test that is administered by the State of Hawaii in order to achieve their certificate and advance. Once a worker achieves this level - Lineman – First Year - he must demonstrate that he can perform all of the skills associated with the job in order to advance to a full journeyman Lineman one year later. See Attachment F for a list of the skills and training requirements (formal “Modules”, “On the Job”, and “Related” training) that are part of the Overhead Lineman apprentice program at HECO.
Cable Splicer positions are filled in the C&M Underground department from the Journeyman Lineman position in the Overhead Group. The Cable Splicer would receive a combination of formal and on-the-job training in order to be certified as a Senior Cable Splicer after one year. The Underground department normally draws the most experienced Lineman as the positions in the C&M Underground group are sought after.
Note that journeymen in this classification are “jacks of all trades”; that is, they will perform all required work in the ducted manhole system, including maintenance of equipment, preparation of splices, pulling cable, etc. The only exception is working with network transformers and network protectors, which is the responsibility of the Substation group.
Technology
HECO has documented training modules for the Lineman and Cable splicer job families.
HECO has a training yard located at a power plant site.
7.3.7.12 - National Grid
Construction & Contracting
Crew Makeup - Job Progression
People
The National Grid network field resources (network crews) are part of the group responsible for the underground system in eastern New York, called Underground Lines East. This group is led by a Manager, and includes a group focused on civil aspects of the underground system and a group focused on the electrical aspects. The Underground lines group is responsible for both the network and non – network infrastructure in eastern NY, including the Albany network.
The Civil Group is comprised of Mechanics, Laborers, and Equipment Operators, and is led by a supervisor. This group includes a machine shop located in Albany. The group has 23 field resources.
The Electrical Group, comprised of Cable Splicers and Maintenance Mechanics, is led by three supervisors. Cable Splicers work with cable and cable accessory installation and maintenance, including cable pulling and splice preparation. Maintenance Mechanics perform network switching, fault location, minor vault maintenance, and inspection and maintenance of network equipment such as transformers and network protectors. The total UG Electric East group has 29 field resources.
The Electrical Group field classifications are represented by a collective bargaining agreement. (Union IBEW in New York, multiple unions in NE). Advancement in union positions in UG East is through an automatic progression to a journeyman.
Process
All positions (Cable Splicers and Maintenance Mechanics) start as a Helper for six months. After these six months, candidates take a review exam to see if they’re eligible to progress.
Upon progression, candidates become an “A” employee (Cable Splicer A or Maintenance Mechanic A) for 12 months, Then they move to “B” level for 24 months, and then finally advance to a “C”, which is the journeyman level. Progression through the levels involves a combination of formal training, and on-the-job training. Employees are expected to fully advance to the “C” level in 42 months.
For each step of the progression, the employee must pass the training school for that step, and pass a review by a panel of his/her supervisors. Those that do not pass the formal testing for advancement the first time do get a second chance. If they fail a school or supervisory review, employees are allowed time to upgrade their knowledge and offered a second chance at the school or review. The progression is automatic in terms of time, but they must pass the schools and reviews and advance to the C level in 42 months. If an employee does not pass on the second try, he is given a time period to bid out to another department.
Chief positions are posted as they become vacant. Candidates who bid on these vacancies are expected to have a minimum of three years at the “C” level.
At each level, employees receive formal classroom training. Each school (A,B, & C) are ten days long, and typically held in Syracuse, NY. In addition, formal training classes are provided periodically throughout the progression series, such as network protector diagnostics (three days), safety training, etc. All field employees also participate in four days of Annual Expert Training in Schenectady, NY, regardless of their progression status (Helper through Supervisor).
The formal training in the mode of progression includes internally offered training as well as external training. For example, National Grid will bring in Richards Manufacturing or Eaton to perform training on network protector maintenance for Maintenance Mechanics.
Some of the training includes common modules to both underground and overhead resources, such as First Aid, or Bucket Rescue.
The administration of on-the-job training is handled informally. National Grid does not use an OJT checklist. Rather they assure that resources are exposed to the various work types through job assignment.
National Grid has developed an annual expert training curriculum to provide incumbent employees with three to four days of refresher training.
Technology
The formal training for Cable Splicers includes courses such as:
-
Cable Splicer A Training
-
Safety
-
Work area protection
-
Enclosed space training
-
Tools
-
Test equipment
-
Troubleshooting streetlights
-
Cable, joints and terminations
-
Hoisting and rigging
-
Electrical symbols
-
-
Cable Splicer B training
-
Safety
-
Dig Safe
-
Transformer theory
-
Rotation testing
-
Network system presentation
-
Pin pointer
-
Cable joints and terminations
-
-
Cable Splicer C training
-
Safety
-
Test equipment
-
Transformers
-
MOV arrestor’s
-
Corrosion
-
Tags
-
One line diagrams
-
Forms
-
Failure paths and causes
-
Clearance and control
-
Cable joints and terminating
-
In addition to these courses, Cable Splicers receive a number of other safety and environmental related courses, including lead awareness and manhole entry and rescue.
National Grid has a two training centers that contain classrooms and field equipment used for underground training, One is in Syracuse, NY, and one in Milbury, MA. Most training for UG NYE is in Syracuse. In addition, Annual Expert Training and some miscellaneous training is conducted at the training center in Schenectady, NY.
7.3.7.13 - PG&E
Construction & Contracting
Crew Makeup / Job Progression
People
The PG&E network field resources (network crews) are part of the Maintenance and Construction- - Electric Network organization. The group is comprised of Cable Splicers, a bargaining unit position. Cable splicers perform both cable work, such as cable installation and splicing, and network equipment work, such as network protector and transformer maintenance. Advancement in the Cable Splicer job family is through an automatic mode of progression.
In San Francisco, PG&E typically runs 4 three man crews in the evening. A crew is normally made up of a Journeyman Cable Splicer, who does most of the network Protector work, and two helpers (usually Apprentice Cable splicers.
PG&E also has three Cable Crew foremen on the night shift. The Cable Crew Foreman is a working position, with one foreman typically taking clearances and installing grounds, and the others overseeing the crews.
PG&E also uses a position called a Cableman which is a troubleshooter for the underground system, part of PG&E’s Restoration group (not part of the M&C electric Network organization). There are six Cableman who work for the company. They work a a rotating shift , and have coverage 24/7. The cableman is a position that must be bid into.
Note that the network crews in San Fransicso work exclusively at night [1] . They have made this decisions for two main reasons.
- Restrictions on blocking traffic during the day as prescribed by the San Francisco Municipal Transportation Authority,
- Concerns by Network Planning around operating in an N-1 contingency during the higher loads experienced during the day.
Note that PG&E is currently working in identifying feeders and units that can be taken out during the day to try to spread some of the planned maintenance activities in the network to the daytime hours.
[1] Note that Cable splicers are assigned during the day to work on San Francisco’s radial underground system. These crews can be redirected to address network issues that may arise during the day. However, all planned work on the network is performed at night.
Process
Employees enter the Cable Splicer family from the T&D Assistant, an entry level position at PG&E.
To be a T&D Assistant, PG&E requires a high school diploma, and successful passing of various tests, such as math and memory test, in addition to standard hiring testing (such as drug testing).
When candidates enter the Cable Splicer job family, they enter as an Apprentice Cable splicer. There is a 30 month mandatory progression to the Journeyman Cable Splicer position.
There is specific training and testing that must be completed, and on the job training (OJT) that must be demonstrated and signed off upon. Employees are also sent into the “PGE Academy”, a formal training program for Apprentice Cable Splicers. This program is distinct from a similar PG&E apprentice program for lineman. The PG&E Academy has an Apprentice Coordinator who keeps track of the progression, and works with the apprentices in the program.
Formal training is supplemented by on the job training. Locally, the crew foremean or supervisor will do informal training, giving apprentices opportunities to experience different work types. Note that PG&E has worked with Cable Splicers to develop a training program for apprentices that includes significant hands on training opportunities.
PG&E has a position called a Cable Crew Foreman. This is a working position. The Cable Crew Foreman is a bid position, typically filled by the senior qualified interested Cable Splicer. PG&E will upgrade a Cable Splicer to a Cable Crew Foreman on certain jobs. There are three Cable Crew Foremen who work the night shift. One takes the clearances, one oversees the crews, and the other assistance where necessary.
PG&E also has a position called a Cable Man (6 total positions). The Cable Man serves as an underground troubleshooter. The Cable Man position is typically filled from the senior qualified Cable Splicer, The Cable Men, part of the restoration group, work a rotating shift and provide 24/7 coverage.
Technology
The formal training associated with the PG&E Academy for apprentice cable splicers includes courses such as:
-
Introduction To Cable Splicing. Focuses on PILC cables and and teaches the duties of the helper. It includes content such as manhole safety, setup, the use of construction manuals, work procedures, and tools. Safety and quality are emphasized and participants must demonstrate the ability to build a lead splice.
-
Beginning Lead Splicing. This course revisits the teachings from the introduction course, and includes participants building six major projects of increasing. This particular course is very hands on.
-
Intermediate Lead. This course focuses on safety, and includes content on basic electricity, and on building transformer banks.
-
Advanced Lead Training. At this point, participants will have from 2 to 2 ½ years of training and experience. This course includes content about the overall electrical system, various system configurations, fault indication, fault location, as well as requiring the completion of a complicated splice.
-
Underground Fundamentals. This course is provided to both Cable Splicers and Linemen. It focuses on non-lead cables and splices. It includes discussion of pre-molded splices, the function of stress cones, fault finding, and secondary. It is a “back to basics” course, even though it is offered later in the progression for Cable Splicers.
In addition to these courses, Cable Splicer apprentices receive a number of safety related courses, including lead exposure and manhole entry and rescue.
PG&E has a well equipped training center that contains classrooms, and field equipment used for training.

Figure 1:
Training Facility - Cable Racks

Figure 2:
Training Facility - UG Equipment
7.3.7.14 - Portland General Electric
People
The craft workers assigned to the CORE group, which is a part of the Portland Service Center (PSC), focus specifically on the underground CORE, including both radial underground and network underground infrastructure in downtown Portland. An Underground Core Field Operations Supervisor leads the CORE group.
Currently, the following 16 people work in CORE:
- Four non-journeymen,
- Eleven journeymen (e.g., assistant cable splicers, cable splicers, foremen)
- One Special Tester
Resource in the CORE include the following:
- Crew foreman: Crew foreman (a working, bargaining unit position), required to be a cable splicer
- Cable splicer: This is the journey worker position in the CORE.To become a cable splicer in CORE, an employee must spend one year in the CORE area as a cable splicer assistant.
- Cable splicer assistant: A person entering the CORE as a cable splicer assistant must be a journeyman lineman. All cable splicers start as assistant cable splicers for one year to learn the system and network.
The Cable Splicer position is a “jack-of-trades” position with work including the following:
- Cable pulling
- Splicing
- Cable and network equipment maintenance
- Cleaning
- Pulling oil samples from transformers
The typical underground crew consists of three people: two journeymen and a non-journeyman helper. The foreman, who is a qualified cable splicer, is one of the working journeymen on the crew. The two journeymen typically perform the work inside the manhole or vault, while the helper usually stays above ground, carrying material and watching the barricades and street for potential hazards.
In addition, a crew may include an equipment operator who will operate the cable puller, vacuum truck, or other equipment. Note that some work, such as backhoe work, is usually performed by external contractors.
Progression
The journeyman position within the CORE group is the cable splicer position. Journey linemen fill cable splicer positions by progressing through a formal advancement program.
In terms of the lineman progression, an employee should achieve journeyman status within 3.5 years after achieving the apprentice position. Someone inexperienced, such as a new employee hired off the street, must complete a two-year pre-apprenticeship before becoming an apprentice. Therefore prior to becoming journeymen, most inexperienced workers serve as both pre-apprentices and apprentices, taking a total of 5.5 years. Workers should achieve the journeyman level at the end of the apprenticeship.
Pre-Apprentice/Apprentice: A pre-apprentice studies for up to two years in order to be eligible for an apprenticeship. The pre-apprenticeship includes training, both formal and on the job, in addition to the achievement of certain milestones (demonstrated ability to perform certain work). The move from pre-apprentice to apprentice depends on whether an opening for an apprentice position appears. Although it is possible to spend a lot of time as a pre-apprentice waiting for an apprentice opening, PGE commits to finding an apprenticeship for new hires in about two years. The pre-apprentices are tested monthly on the achievement of their milestones.
Journeyman Lineman: An apprentice follows a seven-step, 3.5-years-long apprenticeship before becoming a journeyman. They must work for a certain number of hours in different disciplines, including secondary systems, underground primaries, and hot stick usage. The apprentice must pass a number of tests/on-the-job (OJT) requirements before becoming a journeyman lineman.
Note that an experienced line worker who has completed an apprenticeship and has relevant experience elsewhere may be hired directly as a journeyman.
Journeyman lineman perform work on both overhead and underground distribution systems, including the performance of cable splicing in underground residential distribution (URD) systems. In the CORE, however, where the infrastructure is both conventional (radial) and network underground in ducted manhole systems, the cable splicer position, which is filled from the journeyman lineman position, performs work.
Cable Splicer: A journeyman lineman enters the CORE group as a cable splicer assistant and spends 12 months of continuous experience learning the area and the work processes, as specified in the bargaining union contract. During this time, they gain experience in the type of work performed in the CORE, including activities such as network protector testing, vault cleaning, performing inspections, and preparing a trifurcating splice. After one year, they become a cable splicer. After only one year, a cable assistant may not be fully proficient on all aspects of the required task, but will have enough experience to run a crew as a temporary foreman. The training and on-the-job experiences provided to the cable splicer apprentice are managed informally.
Overall, PGE has some issues retaining and recruiting workers for the network underground work, because many prefer working on the overhead system.
Other Crews and Positions
Special Tester: PGE CORE has a Special Tester position, who is a journeyman lineman with additional training and technical skills. Outside the network, Special Testers work with reclosers and their settings, performing cable testing and cable fault location. Within the network, the Special Tester works closely with the network protectors, becoming the department expert with this equipment. PGE has embedded one Special Tester within the CORE group. This individual receives specialized training in network protectors from the manufacturer, Eaton.
The Special Tester usually partners with cable splicers, working as part of a crew. The “special testing” crew includes the Special Tester, a crew foreman or cable splicer, a lineman/cable splicer, and a topman. The topman stays outside the hole and watches the manhole/vault entrance to ensure zero accidents.
In addition to network protector (NP) testing and settings, the Special Tester focuses on power quality issues, including customer complaints about voltage.
Network Protector Crew: The CORE group has created a dedicated crew that deals with network protectors and performs other construction work. This crew is comprised of cable splicers who receive formal training and attend conferences to gain experience with network protectors. This crew includes a foreman, journeyman (who rotates every three months), and Special Tester.
PGE has approximately 230 network protectors on the system, with half included in the 480 V spot networks, and half in the 120/208 V area grid systems. Presently, they have three construction/maintenance crews, and will add the dedicated crew protector crew.
Journeyman Locator: The CORE has a cable splicer/journeyman in charge of “locate” requests, and this role is never outsourced. The network had 1600 locates last year. Ideally, the locator works with the Mapper to ensure accurate maps.
Infrared (IR) Thermography Tech: IR techs inspect primary systems and network protectors as part of the Quality and Reliability Program (QRP). PGE has three IR techs who mainly focus on the transmission system. They also work on high-priority secondary systems.
None of the IR techs are dedicated solely to the CORE.
Training
In addition to the training provided as part of the apprenticeship programs, PGE provides employees/contractors with other types of training. For example, the Change Management/Continuous Improvement Group oversees information technology (IT) training programs, and the Contract Management Group supervises training for external contractors to qualify them for designing building vaults to PGE specifications.
Process
For routine training, PGE often brings in a vendor such as Richards, Raychem, or Eaton, who provide hands-on training associated with their equipment (e.g., asking Raychem to train on preparing a Raychem transition joint). Training is periodical and often scheduled during slow periods, such as when the city mandates that PGE crews cannot work on the streets because they block traffic, usually in June. The CORE will also send folks to vendor-offered conferences and training courses.
On the network, many work practices pass down through practical experience rather than through formal training classes.
Safety Training
Compliance training includes vault rescue, pole top rescue, and all other federally mandated training. The vault rescue class is a company-wide training undertaken annually, and workers train in a shallow vault that does not always resemble the deeper network vaults. Accordingly, the CORE may augment this training with more specific vault rescue training geared to the network vaults, which would take place in a live vault since they do not have a deep test vault. PGE also provides annual computer-based training on “Confined Space” practices.
PSC will bring in an external vendor to give lead and asbestos training, as needed.
PGE has invested in the documentation of “Safe Work Practices” in the form of laminated sheets and notes for certain work/tasks. PGE plans to expand this concept to include work practices specific to the CORE.
Fire Department Training: PGE periodically coordinates with the Portland Fire Department for training, covering actions to take if there is a fire in a vault or manhole. In the past, PGE ran exercises on a yearly basis with the fire department, and intends to reestablish these. If a vault rescue is needed, the Portland Fire Department (PFD) utilizes their own rescue equipment. The PFD’s response time is good because they operate from locations across the downtown area.
Emergency Drills: PGE conducts system-wide outage restoration drills once a year, prior to the fall storm season. In the past, this included some scenarios that involved the CORE network system. For example, a recent drill was substation-centric, and the tested scenarios simulated the outage of one of the stations supplying the network.
PGE also conducts annual earthquake drills, which are tabletop exercises organized by the Business Continuity Group. These drills do not always involve the network, depending on the scenario chosen.
PSC has no written guidelines specifically related to unforeseen events occurring on the network.
During an emergency,PGE follows the principals of the incident command system (ICS) at the management level.
Overhead Training
The CORE journeymen, who work almost exclusively with urban underground systems day to day, are required to support restoration work on the overhead system when needed. In restoration, they generally work in two-man crews addressing wire-down situations. In order to reinforce these skills, the CORE group conducts annual training on overhead systems in a de-energized training yard, where it reviews various overhead line work scenarios.
IT Training
PGE offers training on new IT systems, such as Maximo. This training was initially offered on a monthly basis, but as employees have become accomplished, the company has shifted to quarterly sessions. The change management/continuous improvement group provides this training.
Training at the System Control Center (SCC): The bulk of the training for dispatchers associated with network is informal and “on-the-job.” The company does offer an optional computer-based training course, developed by SOS Computer Training Specialists and designed for the North American Electric Reliability Corporation (NERC) system operators, which includes a module related to network systems.
External Contractor Training
PGE issues a certification to external contractors who build vaults. PGE offers different levels of certification to contractors depending on the vault size and complexity. Level 1 involves installing a conduit duct bank pack in a subdivision. Level 2 covers vaults up to 7 x 12 ft (2 x 3.7 m) in size, and Level 3 covers anything above that size.
At the time of the immersion, customers could choose from two different contractors (as they had received a PGE certification) for large vault construction, with a Level 3 designation.
The certification function is transferring to the contract management group.
Civil Work
PGE contracts out all civil work, including manhole lid replacement and duct work construction and repair. PGE provides project management to civil crews but does not offer civil crews any particular training.
Note that PGE typically does not use external contractors to perform electrical work in the CORE. It uses overhead crews for assistance in activities such as pulling cable.
7.3.7.15 - SCL - Seattle City Light
Construction & Contracting
Crew Makeup - Job Progression
People
SCL has an Energy Delivery Field Operations department that includes a network Electrical Services group (Area Field Operations – Network) group, and a network Civil Services group.
The Electrical Services group is made of 84 total people including the supervision and a five-person cable-locate crew. (Note: this cable-locate crew does underground locating for the whole company). This group performs all construction, maintenance, and operation of the network system.
The Civil Services group consists of approximately 36 employees. In addition, SCL contracts approximately 25% of their civil construction work associated with their network system as well.
Cable Splicer Position
The Cable Splicer position at SCL is a generalist position. Cable Splicers perform all electrical aspects of network construction, operations, and maintenance. All electrical employees who work in the network are either Crew Chiefs, journeyman Cable Splicers, or apprentices in the mode of progression, working their way towards the journeyman level.
Mode of Progression
SCL uses a three-year automatic mode of progression. This mode includes 8000 hours of On the Job Training (OJT) and testing. They have experienced a very low dropout rate from the program. This is in part because they administer a highly selective front end test and interview process to accept apprentices into the program. Also, a Cable Splicer position at SCL is a highly sought-after position.
Training
In addition to the training associated with the mode of progression, SCL provides network crews with opportunities for training including mandatory safety training for processes such as manhole entry and manhole rescue. SCL also periodically sends personnel to conferences and specialized training sessions such as the Cutler Hammer School, etc.
Crew Makeup
A network crew is normally made up of one Crew Chief, one or two Cable Splicers, and one apprentice. The type of work to be done and SCL work rules will dictate the appropriate crew makeup. For example, performing switching in a vault requires at least two journeyman-level employees to be in the vault. These and other work rules and safety practices are spelled out in the Washington State Safety Standards for Electrical Workers, Chapter 296-45 WAC.
7.3.7.16 - Practices Comparison
Practices Comparison
Construction & Contracting
Job Progression

2015 Survey Results

Older Survey Results


7.3.7.17 - Survey Results
Survey Results
Construction & Contracting
Crew Makeup - Job Progression
Survey Questions taken from 2015 survey results - Summary Overview
Question 011: Within your company, how many Full Time Equivalent resources (FTEs) make up the following functions?


Survey Questions taken from 2012 Survey results - Construction
Question 5.1: Total number of Network field electrical workers (do not count “civil” workers)


Question 5.2: Do you contract any network electrical (not civil) construction work?

Question 5.6: Not counting training that is part of your apprentice programs, How many hours of training (on average, per person) does your field force receive in a year?

Survey Questions taken from 2009 Survey results - Construction
Question 5.1: Do you have a distinct field group focused on the construction, maintenance and operation of the network? Or are your field workers part of a group that also works with non network systems?

Question 5.2: Total number of Network field electrical workers (do not count “civil” workers) ( this question is 5.1 in the 2012 survey)

Question 5.3: Do you contract any network electrical (not civil) construction work?

Question 5.7: Not counting training that is part of your apprentice programs, How many hours of training (on average, per person) does your field force receive in a year? (This Question is 5.6 in the 2012 survey)

7.3.8 - Field IT Technology/Training
7.3.8.1 - Portland General Electric
Construction & Contracting
Field IT Technology/Training
Process
PGE is moving away from handheld radios and paper records, and has equipped field workers with mobile technology, including smartphones, tablets, and laptops. All company-issued phones are smartphones, and many field employees will be given tablets to help them access reports and take photos to attach to work orders.
To lay the groundwork for the new mobile technology, PGE set up an ongoing process to talk to crews about the need for the new technology. For workers unfamiliar with the technology, PGE offered a training program before implementation of the new systems. A week before the rollout, work groups spent the entire day with instructors giving lessons with laptops.
PGE also provides ongoing technical support for laptops, with each field device fitted with a sticker containing the 24-hour support phone number. A technical support employee can operate the worker’s laptop remotely and solve the problem.
First responders and repair crews have used laptops for over five years, and each truck is fitted with a station allowing crews to access information from their trucks.

Figure 1:
laptop in PGE work truck
Maximo is at the center of the new data collection system, and Field Manager allows crews to access daily work assignments remotely. Workers can also access the Computer-Generated Imagery (CGI) Asset and Resource Management Scheduler, which imports job assignments from Maximo.
With the new system, distribution crews, planners, schedulers, inspectors, and dispatchers all use the same platform, improving communication and coordination. To accommodate the different roles within the organization, employees access different dashboards with the information they need.
The new mobile system means that crews do not have to visit the yard every morning to receive work orders. They can also use gas cards to fuel trucks at any gas station instead of the yard, allowing them to spend more time in the field.
When crews begin a shift, they login, indicate that they are proceeding to a job, and check in when they arrive and leave the site. With this information, PGE can track time and work out costs.
Dispatchers can send the closest qualified crew to a particular job, reassigning workers if a job is more complex than anticipated and ensuring that crews are given balanced workloads.
If a crew notes that assets need repair, they can create an electronic work order in the field rather than filling in paper requests. Field Manager allows crews to receive, update, and close jobs, supporting flexible dispatching and work planning. The system allows crews to respond to outages more quickly [1].
- R. Lewis II. “Mobile Tools Maximize Productivity at PGE.” Transmission and Distribution World, January 27, 2015. http://www.tdworld.com/features/mobile-tools-maximize-productivity-pge(accessed November 28, 2017).
7.3.9 - Manholes
7.3.9.1 - Ameren Missouri
Construction & Contracting
Manholes
People
Ameren Missouri has a Civil and Structural Design group, part of Energy Delivery Technical Services. The group is responsible for developing civil designs and standards for civil construction and repair. As an example, this group develops design standards for precast manholes. The group is also involved in deciding the best approach for making repairs to civil infrastructure, such as manholes and vaults. Ameren Missouri will utilize civil design contractors to supplement their civil design efforts.
Ameren Missouri uses contractors for performing much of the major civil construction work, such as building vaults, manholes, and duct bank systems, and for making civil repairs to existing infrastructure. Repairs can range from epoxy injection to fill cracks, to replacing deteriorated vault roofs.
Ameren Missouri has a Resource Management group responsible for managing outside contractors. This group is organizationally part of Energy Delivery Technical Services. The group is led by manager, and is comprised of construction supervisors who manage outside contractors.
Ameren Missouri has a few contractors “of choice" for underground work. These are contractors with which Ameren Missouri has three or four year agreements. The contractors are part of the union, hired from the local bench.
Technology
Ameren Missouri’s manhole and vault standards call for a precast design for most applications. However, Ameren Missouri has precast, poured in place and brick and mortar manholes and vaults in service.
At the time of the EPRI practices immersion, Ameren Missouri was considering the selected use of new manhole covers that would allow gases from a manhole fire to be expelled, while retaining the cover. They were investigating the use of a system referred to by the trade name “SWIVELOC™”, consisting of a reinforced cover with a pivoting hinged assembly with two latches on the underside. One latch is fixed and the other is retractable for ease of installation of the cover. In the event of an explosion, these manhole covers are designed to pivot lift (or rise) upward on a hinge assembly and expel hot expanding gases associated with an arcing event or explosion. The retention of the cover by the latches and the scalloped rim on the underside of the cover also aid in expelling the gases at high speeds. This prevents an influx of air into the vault during the dynamic phase of the explosion, thereby reducing the size and duration of the event. The cover drops back into place once the hot gases are expelled and eliminates additional ingress of air into the vault after the event, which further reduces the risk of restrike. The construction of these covers also prevents the lid from being ejected from the frame, which places bystanders and adjacent property at risk.
7.3.9.2 - Duke Energy Florida
Construction
Manhole Cover Replacement Program
Process
Duke Energy Florida is undertaking a manhole cover replacement program starting in 2016 with 40 manholes being retrofitted with manhole lid restraint materials.
Technology
Duke Energy Florida is using East Jordan manhole lid restraint materials
7.3.9.3 - Georgia Power
Construction & Contracting
Manholes
People
Network standards, including standard designs for manholes, are the responsibility of the Standards Group within the Georgia Power Network Underground group. This group develops standards for manhole design and manhole covers used in the network underground. Georgia Power and its preferred contractors perform much of the major civil construction work, such as building vaults, manholes, and duct bank systems, and for making civil repairs to existing infrastructure.
Process
All project designs for manholes are done using AutoCAD, and the engineering group has “canned” examples or reference standard designs to facilitate design. Once designed, the manhole diagrams and drawings are assigned to a civil construction crew or a preferred contractor to complete the construction. Standard, precast manholes are used in the majority of the Georgia Power network underground systems throughout the state.
At the time of this EPRI immersion study, Georgia Power was in the process of replacing standard manhole covers with a SWIVELOC design at all manhole locations in Atlanta containing secondary grid cables (about 1300 locations), as part of a five-year program. The decision to replace the manhole covers with SWIVELOC manholes came after a manhole fire resulted in the ejection of several manhole lids in the downtown area (See Figure 1.).

Figure 1:
SWIVELOC materials
The replacement effort is prioritized, with high-traffic areas and high visibility locations, such as around government buildings and civic arenas, having the highest priority.
Technology
The SWIVELOC design enables the manhole cover to rise and relieve the pressure, but contains the lid. It consists of a reinforced cover with a pivoting hinged assembly with two latches on the underside. One latch is fixed, and the other latch is retractable for ease of installation of the cover. In the event of an explosion, these manhole covers are designed to rise upward on a hinge assembly and expel hot expanding gases associated with an arcing event or explosion, without allowing the cover to fly off.
One of the challenges Georgia Power faced was how to restrain the manhole frame; that is, anchor it to the manhole roof. Working with the manufacturer, they developed a restraining system that involves 2 chains attached to the frame and running down through the manhole “neck” or “chimney.” The chains are attached to brackets which pull up on the manhole roof slab. The chains are tightened to pull the brackets firmly against the roof at the sides of the opening See Figure 2 and Figure 3.).

Figure 2:
SWIVELOC manhole frame assembly

Figure 3:
Manhole frame assembly
Another challenge addressed by Georgia Power was the difficulty in removing the manhole lids. They are using a lid design that includes extractor rails (See Figure 4.), which allows lid to be slid away from the manhole opening (See Figure 5.).

Figure 4:
Underside of manhole lid – note extractor rails

Figure 5:
Dragging a lid with rails
7.3.9.4 - Portland General Electric
Construction
Manholes
People
All civil work on the CORE infrastructure, including manhole cover replacement, is contracted. At PGE, the Contract Services and Inspection (CS&I) department supervises external contractors. Five construction managers work in the CS&I group and provide contractor oversight, including inspection of any work on PGE-owned infrastructure.
Process
Within the network, PGE uses solid manhole covers 32 in. (9.6 cm) in diameter and with venting holes. Note that because the city of Portland discourages manhole lids in the sidewalks, most are located in the street.

Figure 1:
PGE manhole cover

Figure 2:
PGE worker replacing manhole cover
Because the network has had some issues with manhole lids being ejected into the air from manhole events, PGE is presently testing and piloting various manhole led retention systems, such as Swiveloc, for use in the network.
If PGE decides to deploy manhole lid retention, the work will be outsourced, with inspection of the contractor work to be performed by either the Field Construction Coordinators (FCC) or the CS&I group. This decision depends on the magnitude of the deployment.
PGE has been piloting and evaluating manhole lid retention systems as part of an initiative called the Performance Improvement Assessment (PIA). PIA utilizes detailed root-cause analyses performed by the Network Engineers to drive actions, such as reinforcing vault and manhole structures, in order to improve performance.
7.3.9.5 - Survey Results
Survey Results
Construction & Contracting
Manholes
Survey Questions taken from 2018 survey results - Manhole Event Preparedness and Response
Question 9 : Please indicate where you use vented vault and manhole covers to prevent accumulation of gases. (Not including vented gratings for transformer cooling)


Question 10 : If you apply vented covers selectively, what criteria do you use to select locations?


Question 11 : Are you using manhole cover restraints in parts of your system?


Question 12 : If yes, what criteria do you use to select locations at which to apply a cover restraint?


Survey Questions taken from 2015 survey results - Design
Question 061: Are you retrofitting older existing covers with vented covers?


Question 062: Are you using manhole cover restraints in parts of your system?


Question 063: Are you retrofitting older existing covers with cover restraint systems?

Question 064: Are you performing targeted cover restraint retrofits based on (check all that apply):


7.3.10 - Master Reel
7.3.10.1 - CenterPoint Energy
Construction & Contracting
Master Reel
People
CenterPoint has a sole supplier relationship with the cable vendor who supplies their EPR power cable for their Major Underground three phase application.
Process
CenterPoint takes delivery of cable reels on consignment from the cable vendor. That is, CenterPoint does not own the cable until it is moved onto a partitioned Master Reel.
For individual projects, crews will pull cable off of the Master Reel, and onto partitioned reels used to pull cable at the job site.

Figure 1:
Master Reel"

Figure 2:
Partitioned Reels"
7.3.11 - Material Failure Reporting System
7.3.11.1 - AEP - Ohio
Construction & Contracting
Material Failure Reporting System
(Unsatisfactory Performance Report)
People
Identification of unsatisfactory equipment performance at AEP Ohio is the responsibility of the Network Mechanics. As problems with equipment are identified during work activities, they are reported to an Operations Coordinator, who is located at the service center, and Network Engineering. Network Engineering at AEP Ohio is comprised of Network Engineers who report to a Network Engineering Supervisor. The reporting process is informal.
AEP Ohio utilizes a Standards Committee approach to establishment of network material specifications. This group uses a regional approach, with representation from each of the AEP operating companies. This group would respond to a report of unsatisfactory equipment performance and take action if necessary to reach consensus on a change in standard or material specification. AEP engineers noted that each of them has a certain areas of specialty (such as a focus on network transformers), and that a given engineer may respond to and resolve issues that surface from the field.
AEP will issue bulletins on an as-needed basis to inform the workforce of identified equipment problems.
Process
AEP Ohio Network Mechanics will identify and report failed equipment through the performance of regular inspections of equipment, including vaults, transformers, network protectors, secondary and primary cable, and network switchgear (see Maintenance and Operations). Also, any failure on remotely monitored equipment is communicated to the Operations Center through the SCADA system.
Problems with equipment that are not reported through inspection documentation or through SCADA are reported to Network Engineering through an informal process.
Technology
All network protectors are equipped with the Eaton Vaultgard monitoring and control system and connected by a double loop, fully redundant fiber-optic communications network (see Figures 1 and 2).

Figure 1:
Vault wall mounted control box for Eaton Vaultgard monitoring and control system

Figure 2:
Training center sample control box for Eaton
7.3.11.2 - Ameren Missouri
Construction & Contracting
Material Failure Reporting System
(Unsatisfactory Performance Report)
People
Ameren Missouri has a Standards Group, led by a Managing Supervisor, and reporting to the Manager – Distribution Planning and Asset Performance. The Standards Group is responsible for developing and maintaining distribution standards for the company, including network equipment. In addition, this group prepares material specifications for distribution equipment, and engineering practice guidelines.
Within this organization are experts who focus on developing and maintaining specific underground standards. For example, cable engineers, who are experts with cable and cable systems, are responsible for the development of cable standards for the company (See Cable Design). Another example of department expertise is a staff member who is a tools expert. ). Another example of department expertise is a staff member who is a tools expert.
Standards Group engineers / subject matter experts are available to respond to questions and issues raised by the field force. The group has implemented a formalized Unsatisfactory Performance Report (UPR) Process used by the field force to report problems with distribution materials.
Process
The Standards Group has implemented a formalized Unsatisfactory Performance Report (UPR) Process used by the field force to report problems with distribution materials. Standards engineers assigned to respond to the UPR must provide some feedback to the person who submitted the UPR within 20 calendar days of receipt of the UPR.
The UPR process includes:
- Claimant completes the UPR form and submits to the Supervisor of Standards with a sample of the defective equipment if possible;
- Supervisor enters the information into a UPR database and assigns the UPR to a Standards engineer;
- Engineer reviews report and sample and determines response based on knowledge of item or report from manufacturer after submittal to manufacturer for analysis;
- Engineer responds to claimant and forwards to secretary;
- Secretary distributes to distribution list and posts on Standards website
Technology
See Attachment B for a sample of the UPR form.
7.3.11.3 - CEI - The Illuminating Company
Construction & Contracting
Material Failure Reporting System
(Unsatisfactory Performance Report)
People
FirstEnergy’s Unsatisfactory Performance Reporting (UPR) process is administered by the corporate Design Standards group.
Process
The Unsatisfactory Performance Report is a form that is used by the field force to report and initiate an investigation of defective materials. (See Attachment - I)
A field crew would turn in a completed UPR form and the defective material to the standards department who would investigate the failure. This investigation could involve analysis at FirstEnergy’s laboratory ( BETA Lab ).
Note, the UPR process focuses on material issues, not workmanship issues. The Region decides whether or not to initiate the UPR process for a failed piece of equipment.
Technology
UPR Forms are filled out manually and mailed to the Standards Department. Copies of the blank UPR forms are available to employees on the First Energy Intranet.
7.3.11.4 - CenterPoint Energy
Construction & Contracting
Material Failure Reporting System
People
CenterPoint’s Material Failure Reporting System is administered by the Distribution Standards and Materials group within Electric Distribution Engineering (not part of the Major Underground group).
Process
The Material Failure Reporting System utilizes a green tag with a unique number on the tag. The number on the tag enables the failed unit to be tied in with a particular outage case number or with a particular construction project. When an employee discovers a problem with a certain piece of material, he will fill out the green tag and place it on the unit. This tag is a trigger for the Standards and Material group to perform an investigation into the cause of the material failure.
Note: Because much of the material types used by the Major Underground group are unique to major underground infrastructure (network protectors, for example), most material failures of major underground equipment are investigated by Major Underground department resources themselves, rather than the Standards and Materials group.
Technology
Information recorded on the tags is entered into a Material Failure Reporting System data base. CenterPoint is currently revising this program, tying the information from the Material Failure Reporting system with their SAP system.
7.3.11.5 - Con Edison - Consolidated Edison
Construction & Contracting
Material Failure Reporting System
People
Underground Network Equipment Standards Committee
Con Edison has an underground network standards committee that meets periodically (usually about six times a year) to address issues with underground standards and equipment. The committee includes representatives from the Distribution Equipment Engineering department, the transformer repair shop, and field construction representatives, both union and management.
At these meetings, the group reviews equipment failure causes and characteristics. The members of the team perform vendor visits and attend seminars to give presentations. Con Edison focuses the meeting content on current needs and issues, such as responding to a safety incident. Con Edison has found this committee to be highly valuable for identifying and resolving issues with equipment and standards.
Field Engineering Group
Con Edison has a field engineering group consisting of 40 individuals who perform a variety of quality-assurance-related tasks including cable and joint failure analysis specimen retrieval and tracking. Failed specimens are sent to the Cable Testing Laboratory
Cable Testing Laboratory
Con Edison has its own cable testing laboratory, which has been in operation since the 1970s. This laboratory has over 100,000 cable and accessory specimens. Sometimes the lab sends specimens to outside labs to obtain independent analysis and opinions.
Con Edison invests in keeping its laboratory staff current on the latest thinking in cable testing. They are active in industry groups. They invest in rotating new people into the cable department, including engineers from Con Ed’s Gold program (a mentoring program for high potential engineers and business professionals).
Cable Failure Analysis
Con Edison’s goal is to perform a failure analysis on every cable and splice failure that occurs. The utility is able to perform an actual analysis on 80 – 90% of the problems that occur; the remainder represent problems that are destroyed or inaccessible. See Maintenance - Failure Analysis for more information.
Transformer Failure Analysis
Con Edison performs a root cause analysis of all network transformer removals including units that failed in service, units that were removed because of failed dissolved-gas-in-oil-analysis (DGOA), units that were removed because of failed oil temperature, pressure, or level indications from the RMS system, and units that failed during testing. See Maintenance - Failure Analysis for more information.
7.3.11.6 - Duke Energy Florida
Construction
Material Failure Reporting System
(Equipment Failure Reporting)
People
Prior to the consolidation with Duke Energy, the former Progress Electric (responsible for the network systems in southern Florida) used a Facility Management Data Repository to report failed equipment. The report, developed by Progress Electric, includes all relevant information, such as who discovered/reported the defect, where it happened, etc. These reports were issued as bulletins over the company’s internal network first to Standards, and then companywide via a Web portal.
The former process included tagging failed material and sending it to Standards for evaluation. After the Duke Energy consolidation, materials are still sent to the Standards group, but the process for reporting equipment failures has become more informal. Once a component is sent to the Standards organization, there is a component engineer who may perform forensic analysis on failed equipment to understand failure causes. Performance of the forensic analysis within Duke Energy Florida is dependent on the complexity of the failure and the backlog of work for the component engineer. If Duke Energy is not able to perform the failure analysis, Standards will engage external laboratories to assist with failed component analyses.
Process
While the process for reporting and performing analysis of failed components is informal, Duke Energy Florida does have formal processes to communicate findings within the company. For material deficiencies, Duke Energy Florida will issue a Material Advisory to first line supervision to share with direct report field crews. The Material Advisory is a bulletin that describes the material deficiency and any appropriate action(s) for the component.
For events that are related to work methods, Duke Energy has a “Good Catch” reporting process, where work method issues are reported through an electronic mechanism, Plantview. After the “Good Catch” is captured in Plantview and an investigation is performed, findings are shared in the weekly safety communication, “Connection.” The Network Group provided the most “Good Catches” at Duke Energy Florida in 2015, which were identified as work methods issues that were corrected before any network problems resulted.
Technology
Duke Energy Florida has an extensive electronic system for reporting events, Near Misses, Good Catches and recording Events and event details through its PlantView system. PlantView is described in the Safety section of this report.
7.3.11.7 - Duke Energy Ohio
Construction & Contracting
Material Failure Reporting System
Process
Duke Energy Ohio does not have a formal process for reporting material failures. As issues with material are identified, they are forwarded to the Standards Department.
Technology
Issues with particular materials that are relative to all are often communicated through a PD[1] letter
The PD letter is a bulletin used to communicate a safety issue, safety changes or a work practices change.
[1] Power Delivery letter
7.3.11.8 - Energex
Construction & Contracting
Material Failure Reporting System
(Unsatisfactory Performance Report)
See Failure Analysis
7.3.11.9 - ESB Networks
Construction & Contracting
Material Failure Reporting System
(Unsatisfactory Performance Report)
Process
ESB Networks does not have a formal process for reporting the unsatisfactory performance of materials. Material deficiencies with UG materials are handled informally; if a field crew has an issue with a piece of material, it is the crew’s responsibility to report the problem to its manager, who has the authority to stop an installation until appropriate replacement material is delivered to the site. If ESB Networks’ analysis reveals a manufacturer issue, the manufacturer is informed and a more formalize process commences.
7.3.11.10 - Georgia Power
Construction & Contracting
Material Failure Reporting System
(Unsatisfactory Performance Report)
People
Network standards are the responsibility of the Standards Group within the Network Underground group. The standards group is comprised of two principal engineers who work in the Network Underground group. One of these engineers reports to the Network UG Engineering group, and the other, directly to the Network UG Manager. The Standards Group is responsible for developing and maintaining all network standards for the company, including network equipment. In addition, this group prepares material specifications for network equipment, and engineering practice guidelines.
Within this organization are experts who focus on developing and maintaining specific underground standards. For example, network engineers who are experts with cable and cable systems are responsible for the development of cable standards for the company (See Cable Design in this report.). The Standards Group engineers/subject matter experts are available to respond to questions and issues raised by the field force.
Process
The process for reporting failed equipment is informal. For example, if a splice fails, the foreman may package and send the failed splice into the Network UG Testing Center to be examined by the standards group. Some forensics analysis of failed joints and terminations is performed by Georgia Power engineers, and other analysis is performed by NEETRAC. If it is determined by testing and forensics that the equipment needs to be replaced with a different type of equipment, the Standards Group decides on the appropriate replacement (after testing) and the new equipment becomes a part of the Network Standard.
Technology
The Georgia Power Network Underground group is responsible for cable standards of all duct line and manhole systems in the Georgia Power infrastructure. The Network Standards book contains specifications on cables, splices, racking, and duct line and vaults. The document is kept up-to-date by the Standards group and is available online and in printed form. Note that radial distribution standards are developed and maintained by a separate group, not part of Network Underground.
7.3.11.11 - National Grid
Construction & Contracting
Material Failure Reporting System
(Material Problem Report (MPR))
People
National Grid does perform failure analysis of selected failed components. The person identifying the equipment defect initiates the failure analysis process by completing a Defective Equipment Report form and submitting it to the Standards Department. Information about failed equipment is also provided through the Work Methods representatives.
Engineers within the Standards Department decide which failures are to be analyzed and the method of analysis. This is an informal process administered by standards engineers.
Standards engineers maintain a file of selected received failure reports, and use them to make recommendations for working methods, material uses, project upgrades, standards, and other relevant areas. Engineers also conduct on-site examinations of failures, and collect materials to be sent to one of two National Grid testing laboratories, located in Syracuse NY, and Worcester, Mass. The laboratory analyzes failed equipment and materials, including items such as splices, fire damaged cables or equipment, and insulation (e.g. for water presence). External services are also used by National Grid as required for certain analyses. For example, National Grid may send a failed component to the manufacturer for analysis.
Process
Failures are inspected in the field by standards engineers or on site engineering crews. Field reports and material samples are provided to Standards for a complete analysis at either an internal or external laboratory.
Standards Engineering prepares a failure report describing all of the pertinent details of an incident, including the date, time, location, and equipment involved. The sequence of events is reconstructed, along with a damage report. The goal is to identify the root cause and make recommendations to mitigate the problem in the future. In particular, these reports identify issues with materials, workmanship and construction, standards compliance, and other relevant factors. These can include poor practices by field personnel or cases where company or regulatory standards were likely not followed.
Analysis reports include the following major sections: i) Event Description, ii) Description of Failed Equipment (and any reference material, if needed), iii) Failure Examination / Material Dissection, and iv) Analysis and Conclusions.
i) Event Description
A discussion of the specifics of the event, including the time since installation, is determined. The detailed breakdown of the sequence of events is presented, along with details of working personnel involved in both the event itself and any inspections conducted subsequently.
ii) Description of Failed Equipment
The equipment description includes the specific component(s) received for analysis (for example, a splice adapter with two segments of cut cable still attached), the equipment manufacturer and model number, the nature of the damage, age and catalogue numbers if appropriate, and references to instruction and operations manuals.
iii) Failure Analysis and Material Dissection
A Material Dissection or Failure Analysis goes into detail describing the conditions of the materials and projected reasons for the failure. For example, if instructions for a cable splice were not followed properly, or if other materials appear to have been used incorrectly, this will be discussed. Photographs are taken as needed to document and support the analysis. Indicators such as arc tracks, spots of electrical discharge, and etching can be identified along with a determination of how they were formed. Components in the vicinity of the assumed failure can be tested to see if and how they contributed to the failure. For example, a segment of cable connected to a failed dead break elbow can be tested for insulation failure or treeing.
iv) Analysis and Conclusions
The goal of the engineering analysis is to identify the reason for the failure, corrective measures that could or should be taken, and any other recommendations that would be useful. If the problem was caused by improper installation, the workmanship issues are identified and reported with a suggestion that they be corrected. If installation has been done properly but an equipment failure was the cause of the problem, a review of that equipment may be suggested. In some cases the engineering analysts recommend that the equipment no longer be used for a particular purpose.
See Attachment C for a sample Failure Analysis Report.
Mitigating or extenuating conditions are important and are discussed in these reports, along with suggestions to avoid future failures. For example, in a fire analysis report from 2009, it was found that the involved 4.16 kV cables were not fire wrapped in the vicinity of the failure. In this case, the failure occurred at the mouth of a duct, where the cables where not wrapped because of proximity to adjacent cable. National Grid initiated a dialogue with suppliers of fire-proofing materials to investigate the development of a new material such as a sealant that can be used as an alternative to fire wrap at duct mouth installations.
Technology
National Grid maintains equipment for performing failure analysis in its internal laboratories.
National Grid also utilizes the services of external laboratories as required.
7.3.11.12 - PG&E
Construction & Contracting
Material Failure Reporting System
(Material Problem Report (MPR))
People
PG&E has a standards department, entitled Electric Distribution Standards and Strategy located in San Francisco. The department, part of the Distribution Engineering and Mapping group, is responsible for developing and maintaining distribution standards for the company, including network equipment.
Within this organization are experts who focus on developing and maintaining specific underground standards. For example, they have a cable standards engineer, who is an expert with cable and cable systems, and responsible for the development of cable standards for the company.
Also within this organization, PG&E has a position called Senior Distribution Specialist, assigned to the underground system. This specialist is a subject matter expert, and acts as an interface between the Standards Department and field resources. (See Senior Distribution Specialist for more information). Specialists act as the “eyes and ears” of the Standards Department, and meet with standards engineers every two months to address issues.
The Electric Distribution Standards and Strategy group works closely with the Material Problem Report (MPR) process. This process is also supported by a separate group at PG&E that is responsible for the overall MPR process.
Process
The material problem report process is a formal method for field employees to communicate material problems to management. When an employee encounters a problem with a piece of equipment, they go to a computer and fill out an electronic MPR form. (A lineman, who might not have access to a computer during the day, would complete the MPR form and then input the information into the computer at the end of the day, or ask a clerk to enter the information on his behalf,)
For problems with underground equipment, the MPR forms will typically flow to the senior distribution specialist underground. The MPR form will ultimately be routed to the individual in the company who is responsible for resolving the problem. The process itself is formal, and includes a requirement to respond to the individual who submitted the form in a prescribed number of days.
For example if the MPR were turned in first place, this would find its way to the cable standards engineer who deals with splices.
PG&E noted that they don’t often see MPR forms on major network equipment. Typically when they do, these reports are related to equipment that applies to both network and not network underground such as transition joints.
Technology
PG&E has an MPR website where the results of the resulting investigation initiated by the MPR are communicated.
PG&E may elect to issue a utility bulletin for significant changes. Also depending on the situation, the resolution of the MPR may be communicated to cruise the detail board sessions.
7.3.11.13 - Portland General Electric
Equipment Failure Reporting
People
PGE has a documented process for reporting failed equipment called the Material Failure Reporting Procedure. The procedure defines roles for those involved in the process, including line crews, storeroom personnel, standards engineers, Distribution Engineers, and supply chain personnel.
Standards engineers coordinate failure analyses with a PGE Special Tester, a PGE lab technician, the manufacturer, a third-party tester, or a combination of these parties.
PGE CORE has a Special Tester position, who is a journeyman lineman with additional training and technical skills. The tester is an expert on network protectors within the organization and also works to resolve equipment problems. The Special Testers support the network department, and one individual is embedded with the network CORE group.
Although PGE has its own testing lab, it is no longer fully staffed, and most failed components are tested externally by external laboratories and manufacturers. One major example is cable failures, which are sent to a third-party testing facility.
The Standards Department has provided explanations and demonstrations to field line operations on the reporting process.
Process
Although PGE has a process for reporting equipment failures and prioritizing repairs, the utility has a policy for immediate repairs if a major issue is found. When a manhole/vault needs urgent attention, a repair and maintenance crew dispatches as soon as possible.
Component Failure: For forensic analysis of failed components, PGE follows a material failure reporting process, fully documented in the Material Failure Reporting Procedure. The document includes the specific actions that an employee must take when encountering a faulty piece of material/equipment, and also lays out the forensic analysis process. The Standards Department will periodically provide training to field line operations on the reporting process.
Where possible, PGE will seek a refund or replacement for materials and components under warranty.

Figure 1:
Secondary cable undergoing failure analysis
Material Failure Reporting Process
When they discover a failed component,line workers take photos of the equipment, note the location, and complete a failed material tag available from regional storerooms[50]. The photos are sent via email to the standards department. The storeroom receives the failed material and checks weekly with the Standards Department regarding which failed materials to retain and discard.
At the next stage of the process, a standards engineer uses the information on the failed material tag to contact the distribution engineer responsible for the feeder before compiling the report and forwarding the information to the distribution engineer. In turn, the distribution engineer adds any requested information to the report and returns it to the standards engineer.

Figure 2:
Front and back of material failure tag
Once the standards engineer has the report, the engineer contacts other utilities to determine if they have had similar experiences with the failed material before notifying the vendor. The distribution engineer and supply chain will remain informed of any progress. The vendor determines if other companies have had the same problem, assesses whether the failure is associated with a particular batch, and finds out if there have been any previous recalls for the part number.
The supplier reports the findings to PGE and either determines if the remaining inventory of the material is usable, or issues a recall form and contacts the supply chain. In turn, the supply chain decides what action to take with the remaining inventory and informs the store rooms of the decision.

Figure 3:
Flow chart of the material failure reporting procedure
Once the failure analysis is completed, the resolution is discussed with Distribution Engineers, line crews, and safety representatives. A TechNote article, a Material News Alert, or another method communicates the resolution, and a material failure database records the material failure.
Due to a number of failures, PGE has built a library of failure modes on T-Bodies. The utility has a long history of these failures, so the library makes it easier to analyze any problems. Most failures occur in the bushing because the lineman used the incorrect torque. PGE has scaled back the use of these T-Bodies.
For vehicle issues, crews need to fill out “pre-trip” and “post-trip” reports, and call the garage for a repair.
7.3.11.14 - Survey Results
Survey Results
Construction & Contracting
Material Failure Reporting System
Survey Questions taken from 2018 survey results - Asset Management
Question 20 : Do you track cable and equipment failures?


Question 21 : If you track equipment failures, which of the following do you track?


Question 25 : Please describe your failure investigation process. Include a description, if applicable, of what drives corrective actions.

Survey Questions taken from 2012 survey results - construction
Question 5.9: Do you have a process for inspecting or testing incoming network materials?

Question 5.10: If yes, what material is inspected or tested?


Survey Questions taken from 2009 survey results - construction
Question 5.10: Do you have a process for inspecting or testing incoming network materials? (this question is question 5.9 in the 2012 survey)

Question 5.10 B : If yes, who performs these inspections and tests?

7.3.12 - Organization
7.3.12.1 - AEP - Ohio
Construction & Contracting
Organization
People
Construction of network infrastructure at AEP Ohio is performed by Network Mechanics, a bargaining unit position responsible for performing all network construction and maintenance activity, including cable pulling, cable splicing, and network equipment construction and maintenance. Organizationally, network field resources are centralized, with the field resources who work with the Columbus networks reporting out of one service center, and resources who work with Canton networks reporting out of another. These service centers are led by a supervisor, and consist of Network Crew Supervisors, the front line leadership position, and the Network Mechanics. Organizationally, the service centers are part of Regional Operation reporting ultimately to the Vice President of Distribution Regional Operations.
The electrical work associated with network construction is performed by AEP Network Mechanics. All civil design and construction work on network projects, including design and construction of manholes, vaults and duct lines, is outsourced to civil contractors. AEP has a close working relationship with a civil engineering firm, with the primary civil engineer at that firm having worked for AEP Ohio for many years and is thus experienced with the AEP Ohio underground networks.
Coordination with contractors is performed by both the Network Engineering group, who works closely with civil contractors on civil designs, and service center management, who provide contractor coordination and oversight.
The Network Engineering group reports to the AEP Network Engineering Supervisor, and is organizationally part of the Distribution Services organization, reporting ultimately to the AEP Vice President of Customer Services, Marketing and Distribution Services. The AEP Network Engineering Supervisor and the distribution services organization reporting to the AEP Vice President of Customer Services, Marketing and Distribution Services support all AEP network designs throughout its operating companies, including Texas, Indiana, Michigan, Oklahoma, and other locations.
7.3.12.2 - Ameren Missouri
Construction & Contracting
Organization
People
Organizationally, Ameren Missouri field resources that construct, maintain, and operate the network infrastructure fall primarily within three groups, all part of Energy Delivery Distribution Services. One is the Underground Construction group, one is the Service Test group, and one is the Distribution Operating group.
Underground (UG) construction crews, consisting of resources who install cable and cable systems including civil construction, cable pulling and cable splicing, fall within a construction department that is organizationally part of the Underground Division, responsible for underground infrastructure within a defined geographic territory that includes downtown St. Louis, and thus, the St. Louis network infrastructure. The Underground Division is led by manager, and is comprised of both an Engineering group and an Underground Construction group. The UG Construction group is led by a Construction Superintendent. The Underground Construction Group is responsible for all of the conventional (manhole and conduit system) underground in the Division, and all work with larger cable (500 MCM and above).
Reporting to the Construction Superintendent are construction supervisors who lead the field force. The supervisors include an overall construction supervisor, two cable splicer supervisors (one for network and one for non network infrastructure), a supervisor for utility men, and a rotating supervisor.
The Underground Construction Department consists of Cable Splicers, Construction Mechanics, and System Utility Workers. Cable Splicers and Construction Mechanics are journeymen positions. Cable Splicers perform work with the electrical infrastructure such as making up joints and terminations, including preparing lead splices. Construction Mechanics perform the civil aspects of the work. System Utility Workers serve as helpers to the other two positions, and perform duties such as cable pulling and manhole cleaning. Note that at the time of the practices immersion, Ameren Missouri was implementing a new position, called the System Journeyman, which combines the duties of Cable Splicers and Construction Mechanics. System Journeyman are responsible for performing cable work, civil construction, and operating network equipment.
The Underground Construction Group also utilizes contractors for performing much of the major civil construction work, and for performing selected equipment inspections. Ameren Missouri has a few contractors “of choice" for underground work. Ameren Missouri has longer term (three and four year) agreements in place with these contractors.
Maintenance and operations of network equipment such as network transformers and network protectors are performed by resources within the Service Test Group and Distribution Operating Group. Organizationally, both these groups are part of Distribution Operations, led by a manager. Within Distribution Operations, there is a Reliability Support Services group led by superintendent. Reporting to the Superintendent Reliability Support Services are both the Service Test Group and the Distribution Operating Group, each also led by a supervisor.
The Service Test Group is made up of Service Testers and Distribution Service Testers. Service Testers perform low-voltage work only. They focus on things such as voltage complaints, RF interference complaints, and testing and maintaining batteries. Distribution Service Testers perform network protector maintenance, transformer maintenance including oil testing, as well as fault location. It is the Distribution Service Tester position that works routinely with network infrastructure. Distribution Service Test group positions are typically filled from the Service Testers, Traveling Operator positions, or Gardener positions (a practice related to a historic practice of filling department positions with resources who maintained substations.)
The Distribution Operating Group is made up of Traveling Operators, who perform system switching, including placing tags and obtaining clearances. They also act as first responders and troubleshooters.
Process
Ameren Missouri has a 30 month mandatory progression for Cable Splicers, Construction Mechanics, and System Journeymen, whereby employees must move through a program of formal training, on the job training (OJT) and testing and achieve the journeyman level within this period (See Crew Makeup / Job Progression). Employees must spend at least one year as a System Utility Worker before entering the program.
Distribution Service Testers have a similar mandatory progression program, with employees expected to reach the journeyman level in 22 weeks. The Distribution Service Tester program also consists of formal training, testing and on the job training. The program is comprised of four levels, with testing at each level and a final test given at the end of the program. Employees are required to pass each test to advance the next level.
7.3.12.3 - CEI - The Illuminating Company
Construction & Contracting
Organization
People
Organizationally, at most FirstEnergy companies, the responsibility for construction and maintenance of the underground ducted manhole system falls under the Substation group. In much of FirstEnergy’s service territory, ducted manhole systems comprise a relatively small percentage of the overall distribution. The organization at CEI is the exception to this rule, standing alone, and separate from the substation group because of the large size of the ducted manhole system serving Cleveland and its surrounding areas. The CEI ducted manhole system represents 80% of the total ducted manhole system infrastructure at all of FirstEnergy. The CEI Underground Network Services department (Underground department) is the only stand alone underground group in all of FirstEnergy.
The Underground Network Services department is led by a manager, responsible for all the distribution facilities in the ducted manhole system, whether they be radial distribution or network secondary distribution. His responsibility includes substation exit cables. The manager is a degreed engineer (Masters) with over twenty five years of experience in engineering, operations, and construction.
The Underground department is comprised of 57 employees, including the manager, five supervisors, 48 field electrical workers (called UG Electricians), and support personnel.
See “ Crew Makeup / Job Progression ” for a more detailed description of the workforce.
Process
The Underground department performs construction and maintenance of the ducted manhole system at CEI. The Underground department employees at CEI are the only CEI employees trained to enter a manhole.
The design of the underground system is the responsibility of the Underground / LCI group within Engineering Services. However, the Planner / Scheduler, a position within the UG department, does occasionally participate in redesigning or reconfiguring the system in response to a failure.
CEI has one Underground Network Services Center to support the Underground, including the networked secondary and non network ducted conduit systems. The service center includes Underground Electricians who construct, maintain and operate the underground system, as well as automobile mechanics and meter readers.
7.3.12.4 - CenterPoint Energy
Construction & Contracting
Organization
People
CenterPoint’s underground organization is centralized, with the resources who work with the major underground infrastructure reporting organizationally to one group - Major Underground. At CenterPoint, the term “major underground” is used to describe the three phase underground system that supplies the urban portions of the Houston metropolitan area using ducted manhole systems, and including the secondary network systems. It consists of three phase facilities supplying commercial and industrial customers (with the exception of the network, which serves residential load as well). URD installations and single phase underground line extensions are not considered part of Major Underground, and are managed by other CenterPoint service centers.
The Major Underground organization, comprised of 208 total resources, includes Key Accounts, Engineering and Design resources, support services, and the field force responsible for all construction, operations and maintenance activities. In addition, where other departments have resources focused on supporting Major Underground, many of these groups have physically stationed resources, 36 in total, within Major Underground, reporting in a matrixed[1] manner.
Most Major Underground resources physically report to the same location, the Service Center – Underground Operations, located in Houston. In addition, a training facility and equipment yard for Major Underground are stationed at the Service Center.
Field resources are split into two high level groups, “Cable” and “Relay”. The Cable group is comprised of people in the Cable Splicer classification who do all cable work, including installation, testing, locating, maintenance, splicing and removal. The Relay group is comprised of people in the Network Tester classification, work with testing and locating underground cable and equipment, including transformers, switches and network protectors. This group also does all system protection and relay panel work.
Field resources are further broken into groups of about 15, each reporting to a Crew Leader, a non-bargaining position at CenterPoint.
[1] The term “matrix” employee refers to an employ from another department having a dual reporting relationship, one a solid line to his supervisor, and the other a dotted line to the supervisor in the department to which he is assigned.
7.3.12.5 - Con Edison - Consolidated Edison
Construction & Contracting
Organization
People
Construction Group
Con Edison’s service territory consists of four regions: Manhattan, Brooklyn/Queens, Staten Island, and Bronx/ Westchester. The Manhattan Region is made up of three districts, including one headquartered at the W 28th St. Workout Center. The term “Workout Center” refers to a main office facility to which field construction and maintenance resources report. To provide a perspective on the size of a workout center, about 300 people work at the W 28th Street Workout Center, and they can field about 125 crews.
The Construction department consists of several groups:
-
Underground Group - The underground group is made up of Splicers, who splice cable of all voltages.
-
Installation and Apparatus (I & A) Group (includes a services group) - The I&A group installs and maintains network equipment, including transformers and network protectors. Within I&A, in Manhattan, there is a services group dedicated to connecting customers to the distribution network. In other locations, the services group may sit in a different part of the organization. This group does the splicing on the secondary system and deals with customer connection issues.
-
Subsurface Construction (SSC) Group - The SSC deals with vaults, conduit ducts, and other civil work. Much of this work is contracted.
-
Cable Group - The Cable group pulls in new cable and retires cable.
Note: the West 28th Street “Workout” Center also contains the Emergency Group (also called #9), which responds to smoking manholes, burnouts, and other emergencies. This group reports organizationally to the Field Operations Department (FOD).
Manhattan’s districts have seen significant load growth (overall, 3-4 %, but in pockets, the load growth is much greater). For example, in upper Manhattan and Harlem, properties are being converted to apartment buildings or commercial high-rise buildings.
This trend has created significant work in connecting new services, adding spot networks, and adding network transformers to reinforce the street grids. Con Edison has also had to create new networks by breaking an existing network into two to accommodate this increased load. An example would be the creation of the Fashion Network to transfer load from the Herald Square network.
Con Edison believes it easier to maintain smaller networks; however, with less copper in the street, smaller networks can be considered less reliable. When Con Edison does encounter problems, particularly in the summer, the utility engages in “shunting,” which is the term they use to describe running cables above the street to bypass or “shunt” the problem and pick up the loads from an alternative source. The utility also runs generators if necessary to provide support to pocket areas during emergencies to meet customer load expectations.
Network Job Progression, OJT
Workers enter as a General Utility Worker (GU) and then progress either through the Splicer or the I&A Mechanic families with on-the-job training (OJT), training, and testing.
In the Underground group (Splicers), a person can progress to a Splicer in as little as two years. Con Edison does not have a mandatory automatic mode of progression; that is, employees are not mandated to progress to a journeyman position within a given period of time. Nor are employees prevented from advancing if they accomplish the prerequisite time, training, and testing.
After 18 months, GU’s are eligible for splicing school, a three-month program offered by Con Edison and conducted at their training center. When employees return to the field from Splicing School, they are assigned to a supervisor who is responsible for their training and development while on field assignment. Con Edison has specific OJT requirements that Splicer candidates must satisfy before being able to progress to a Splicer. (See Attachment C for a listing of the specific tasks in which a Splicer candidate must demonstrate proficiency.)
Splicer candidates can perform their OJT requirements over a minimum seven-month period. When candidates believe they are ready to perform an OJT, they inform their supervisor and the splicer with whom they are presently working. If all agree that the candidate is ready to “solo,” the OJT moves ahead. The candidate, supervisor, and training splicer review the OJT and hold a job briefing. The candidate then performs the OJT with as little input from the observer (supervisor or training splicer) as is possible. The supervisor evaluates and documents the OJT. (See Attachment D for a sample evaluation sheet used by Con Edison to evaluate and document the OJT accomplishment [ESP0061].)
After completing the OJT requirements, Splicer Candidates can then take a written and practical promotional exam and progress to a Distribution Splicer (journeyman position).
In the I&A group, individuals can progress to a journeyman Splicer as well. A GU can progress to a Mechanic B after six months, a Mechanic A after two years, and then become a splicer in the I&A organization. As described above, there is formal training and testing associated with this.
Con Edison directs General Utility workers (GUs) to either the Underground area (Splicers) or I&A area based on need.
Overtime
Workers expend 30 – 40 % of their time on overtime. Work is planned for 10-20% overtime, with emergencies and efforts to complete system reinforcement projects prior to the summer loading season adding to the levels of overtime worked. The company implements 12-hour shifts in these high work periods.
Supervisors get paid to work overtime at a straight time rate.
Planning and Survey Group
The Planning and Survey group is a subset of the Field Engineering group, and consists of Surveyors, who perform survey work associated with new construction, and Planning Inspectors, who go into the field, and assess the specific field conditions and determine what is necessary for the new installation to be built successfully. Planners and surveyors can work separately, or work together on projects. This group works closely with Energy Services, taking layouts developed from maps by Energy Services on Microstation, and field checking them to identify the specifics of the job and ensure that the layout reflects field conditions. This group prepares job sketches to obtain the necessary permitting to complete the job.
Process
Splicing
Con Edison has a process in place to promote the ongoing quality of splices by assigning personal accountability for the performance of the splice to the individual Splicer who prepared it.
In the past, when working with lead splices, Splicers permanently stamped (imprinted) their initials directly into the lead of the splice as a way of tracking who prepared the splice. Newer splices are bar coded with information about the splice including the name of the Splicer. The bar code is produced from a splice ticket that contains information about the splice, including the name of the Splicer.
Splicers are responsible for the performance of their splice for five years after the installation. Con Edison selected five years, because the utility has found splice defects due to workmanship issues usually occur within the first five years after a splice installation.
If problems are encountered with a particular Splicer’s workmanship, depending on the circumstances, Con Edison may elect to send the Splicer back to splicer school, or administer formal discipline steps (warning, letter in the file, etc.).
UG Network Equipment Standards Committee
Con Edison has a UG Network standards committee that meets periodically (usually about six times a year) to address issues with UG standards and equipment. The committee includes representatives from the Distribution Equipment Engineering department, the Transformer repair shop, and field construction representatives, both union and management. At these meetings, the group reviews equipment failure causes and characteristics. The members of the team perform vendor visits and attend seminars to give presentations. Con Edison focuses the meeting content on current needs and issues, such as responding to a safety incident. Con Edison has found this committee to be highly valuable for identifying and resolving issues with equipment and standards.
Pre-cast Concrete Conduits
Con Edison uses 4-in., pre-cast concrete conduit sections for housing electric cables in open trench installations. These conduit sections are square in cross section, and are ordered for either strait runs or bends. Con Edison uses bell end conduits for entrance into manholes. These pre-cast conduit sections can be joined together as required, using male ends that connect with a plastic coupling. Con Edison requires that the conduits be able to pass specific tests, including a mandrel test to ensure the conduits are open, transverse loading tests, compression load tests, and a friction test. (See Attachment E, photographs of Con Edison Pre-cast Concrete Conduit.) , photographs of Con Edison Pre-cast Concrete Conduit.)
For secondary cable installations where space may be limited, or the soil is unstable, Con Edison may use alternative conduit materials such as steel, fiberglass, and high-density polyethylene (HDPE). For example, steel conduits may be used in an open trench where the soil is unstable, for a jacking or driving operation, or where space is limited due to a shallow trench. Fiberglass conduits may be used in damp soil locations where corrosion is a problem. Con Edison has well-written guidelines that define conduit types and appropriate usage.
When Con Edison must install new duct banks, particularly in Manhattan, they often find it difficult to bring in heavy machinery. In these situations, the utility assembles a large group of laborers to hand dig the trenches to install new duct banks. Con Edison often schedules this work at night, to avoid the some of the challenges of performing this work during the day, such as vehicular and pedestrian traffic and other work restrictions.
Cable-Pulling Duct Preparation
One big challenge that Con Edison faces is obstructions in the ground. Crews often find that ducts have collapsed or are obstructed. These obstructions can be due to foreign utilities or vibrations from the subway that over the years cause ducts to collapse, etc. In Manhattan, crews encounter obstructions in 45-50% of their projects.
Prior to installing cables in conduits, Con Edison has a defined set of operations that are performed on the conduit systems.
These operations include:
-
Rodding the ducts to establish that a clear passage exists through the conduit between structures and to provide a means of installing various lines to perform subsequent cleaning, mandreling, and cable-pulling operations.
-
Brush duct to remove any soil or debris that might have entered the duct since it was installed.
-
Clean duct if soil or debris prevents the rodding device from passing from one structure to another.
-
Perform mandrel operation to establish that a specific size passageway exists from one end of the duct to the other, and to establish that the alignment of the duct is such that horizontal and vertical bends meet the specified minimum radii requirements.
-
Install 1/2-in. steel rope, 9/16-in. steel rope, or 1/4-in. polypropylene rope (depending on the timing and type of pull).
Cable Supply
Con Edison has entered into an exclusive arrangement with its cable supplier. This single source has provided Con Edison preferred pricing and high levels of responsiveness from the cable manufacturer. Part of the arrangement with the cable manufacturer is that Con Edison doesn’t pay for the cable until it is installed in the ground. This provision has helped to reduce the lead time in obtaining cable from the manufacturer, and is an incentive for Con Edison to develop accurate forecasts of cable needs.
Incoming cable is not tested by Con Edison. The utility relies on the manufacturer’s report of testing performed by the manufacturer itself. These tests include partial discharge tests, AC voltage tests, and solderability tests on primary cables.
The arrangement with the cable vendor is not tied to the ongoing performance of the cable itself. When Con Edison has encountered problems, the utility has been able to track the problem back to a specific cable lot or reel. For example, in one case, they discovered some reels where the cable jacket was a bit thin. Con Edison has found the manufacturer to be highly responsive to problems that occur.
Technology
Trucks
Con Edison provides its employees with the specialized tools and equipment that they need to do their jobs, including trucks outfitted for the different types of work that they perform. Employees stated that they believed Con Edison provides them with good quality trucks, appointed with the equipment they need to perform their work. People demonstrated a sense of pride in their trucks and associated equipment.
Con Edison’s network resources use specially equipped box trucks. Each department truck is outfitted to meet the needs of that group, including multiple storage bins for housing the on-board equipment.
For example, I&A mechanics use a box truck equipped with the specialized equipment they need to perform their job duties, such as network protector test kit, outriggers, and a hydraulic boom with a winch for lifting equipment.
Emergency Workers utilize box trucks (similar to I&A mechanics), which are outfitted with the tools, test equipment, etc. they need to respond to and troubleshoot emergencies. These trucks are painted red for high visibility and recognition.
Fault Location Operators use a box truck equipped with a Capacitive DC test set and a Galvanometer.
Splicers utilize a specially outfitted van, rather than a box truck, because they have less equipment and fewer tools than I&A Mechanics.
Another example of a specialized vehicle is a heavy-duty tandem axle flatbed underground cable-puller truck that is used by Cable pullers to pull and remove cable.
Con Edison trucks are outfitted by a firm called Dejana.
(See Attachment F New-Style Box Truck w/ Boom.)
(See Attachment G for the Dejana Hub Drive Cable Puller Brochure.)
7.3.12.6 - Duke Energy Florida
Construction
Organization
People
Body Organizationally, Duke Energy Field resources that construct, maintain, and operate the urban underground and network infrastructure fall within a specific Network Group which is part of the Construction and Maintenance Organization. More broadly, Duke Energy Florida’s construction and maintenance organization is divided into regions, with both Clearwater and St. Petersburg falling within their South Coastal Region. The Construction and Maintenance organization for the South Coastal Region is led by a General Manager. The region consists of various Operation Centers, organized either geographically or functionally throughout the Region.
The Network Group is organized functionally, and has responsibility for construction, maintain and operating all urban underground infrastructure (ducted manhole systems), both network and non-network, in both Clearwater and St. Petersburg. The Network Group is led by a supervisor who reports to the Region General Manager. The group consists of ten craft workers, five Electric Apprentices and five Network Specialists (the journeyman worker position), all part of the Network Specialist job family.
The Network Specialist is a “jack-of-all-trades” position, responsible for all facets of underground work, including cable pulling, splicing, and maintaining and operating equipment such as cables, joints, network switches, transformers and network protectors. Network Specialists also work with the installation and maintenance of automation associated with the equipment they manage. For example, Duke Energy Florida recently completed a major project to add automation (remote monitoring and control) to field located primary distribution switches, such as automatic throw over switches (ATSs) that are commonly used to provide a primary and alternate feed to larger customers. It is the Network Specialist craft that installed the automation on the switches.
Duke Energy Florida relies on contractors to perform most civil work, such as repairing duct bank, or replacing manhole and vault roofs and grating systems. Good relationships have been formed between Duke Energy Florida and the preferred civil contractors who perform this work. The Network Group may add contractor resources to address peaks in their work load. For example, at the time of the practices immersion, six contractor resources were being utilized to pull in new cable and prepare cable splices associated with a reliability driven cable replacement program.
Process
The ten craft workers are responsible for all major underground (ducted manhole systems) infrastructure in both Clearwater and St. Petersburg. Three resources are assigned to Clearwater, and seven are assigned to St. Petersburg, but resources are moved freely to both areas based on work needs. Network Specialists may be upgraded to an oversight position, depending on work needs. For example, at the time of the practices immersion, a Network Specialist provided oversight for incremental contractor crews.
7.3.12.7 - Duke Energy Ohio
Construction & Contracting
Organization
People
Duke Energy Ohio’s organization for construction of their network infrastructure is centralized, with the resources reporting to the Dana Avenue Construction and Maintenance facility. This organization, referred to as “Network Services” or the “Dana Avenue”, does all work associated with the Cincinnati network, as well as certain functions, such as fault location, for the entire division.
The Dana Avenue Construction and Maintenance organization [1] , led by Manager, is comprised of 59 total resources, including a Field Work Coordinator, Project Manager, T & D Construction Coordinators, and three Construction and Maintenance Supervisors, two of which lead field employees (46) focused on the network.
Duke Energy Ohio has two primary job families for underground field resources – Cable Splicers and Network Service Persons. Cable Splicers do all cable work, including installation, testing, locating, maintenance, splicing and removal. Underground Service Persons work with non - cable underground equipment, including maintenance and inspection of transformers, switches and network protectors. This group also does programs network protector relays.
Process
Duke has a five year automatic mode of progression whereby employees must move through a program of formal training, on the job training (OJT) and testing and become a journeyman within the five year period (See Crew Makeup / Job Progression ) . Employees enter the department as Helpers, and then advance through various Cable Splicer positions (Cable Splicer C, Cable Splicer B, etc) until they achieve the Cable Splicer A, which is a journey worker position. At this point they can either advance to a Senior Cable Splicer, or they can advance to an Underground Service person.
[1] Official title of the organization is DD OH/KY – Joint Trench Operations, part of Field Operations. It is referred to as “Dana Avenue” or “Network Services”.
7.3.12.8 - Energex
Construction & Contracting
Organization
People
The journeyman position for working with cable systems at Energex is the cable jointer position. Employees move through the jointer apprenticeship program in about three and one half years. The apprenticeship includes formal training, testing, on the job training, and time in grade. At the conclusion of the apprenticeship, persons in the program must still complete a “basket of skills” required by the electrical office. These skills are over and above the skills that are taught as part of the apprenticeship, but necessary for the employee to be a fully qualified jointer. Employees complete this basket of skills in the first 18 months after apprenticeship. Consequently, it takes 5-6 years in total before an employee is fully qualified to run a job. See attachment for a sample of the basket of skills required for cable jointers. ( Attachment A: Cable Jointer Skills) )
Energex’s training requirements match the requirements of the Australia Qualifications Framework (AQF), and are thus, accredited. This qualification is recognized throughout Australia and is “fully transportable". So, an employee who receives a qualification as a Cable Jointer from Energex would be recognized as a cable jointer outside of Energex. Energex complements the training requirements outlined by the AQF with training requirements specific to the electric industry, such as a requirement to be able to terminate cables on switch gear. Training courses are developed by reviewing documented work practices, and with input from Energex people with strong knowledge of the work.
The following two agencies drive job progression/competency:
-
Electrical Safety Office requires that employees show competency and currency in the following:
-
Performs licensing, policing, and proof of the currency of employee competency and skills.
-
Defines the competencies in which employees must be proficient. Requires that employees are licensed and that we can show proof of competency and currency.
-
-
Workplace Health and Safety Office mandates the following:
-
Requires that employees have a safe system of work.
-
Decides which safety training employees should receive, such as training on proper PPE, for example.
-
Process
Training is based on work practices. Work practices are developed with input from SMEs, and with input from the Operating Advisory Council (OAC). Note that the OACs are made up of representatives from Standards, Design, and field personnel such as cable jointers. The work practices group documents how tasks are performed. The OAC decides whether the work requires an employee to demonstrate competency, and if that competency needs to be periodically reviewed. High-risk tasks may require frequent refreshers to renew competency. Lower risk tasks may only require a one-time training.
7.3.12.9 - ESB Networks
Construction & Contracting
Organization
People
Construction and contracting work is supervised by the Contract Management group within the Network Investment groups, part of Asset Investment, within the Asset Management organization at ESB Networks. In addition to Asset Investment, the Asset Management organization consists of Program Management, Infrastructure Stakeholder Management, Assets & Procurement, Finance & Regulation, and Operations Management. These groups work closely together to manage the asset infrastructure at ESB Networks.
More specifically, construction and contracting is performed within two Network Investment groups – one responsible for planning network investments in the northern part of Ireland, and the other for planning in the south.
Construction and civil engineering standards and criteria are developed jointly between the Asset Investment group and the Strategy Manager, which is part of the Finance and Regulation group within Asset Management.
Process
The Contact Management group works directly with contractors throughout the entire time-span of individual construction projects.
7.3.12.10 - Georgia Power
Construction & Contracting
Organization
People
Organizationally, Georgia Power field resources that construct, maintain, and operate the network infrastructure fall within the Network Underground group, led by the Network Underground Manager.
Underground construction crews, consisting of resources who install cable and cable systems including civil construction, cable pulling and cable splicing, fall within the Network Construction department that is organizationally part of the Underground Network group. This group, led by the Network Construction Manager, is responsible for network underground infrastructure construction throughout the state of Georgia, including networks in Atlanta, Athens, Macon, Savannah, and Valdosta.
In addition, all design, construction and supervision of concrete-encased duct lines installations throughout the state of Georgia, whether they are for network infrastructure or non – network infrastructure, is performed by the Network Construction Duct Line construction crews and network civil engineers and/or its contractors. Georgia Power has decided that the network underground construction standards for duct lines should be adopted throughout the system, regardless of the distribution type. The company believes that standardizing on duct line construction throughout Georgia Power gives the company greater system-wide uniformity and ease of maintenance. Also, the network crews are the only crews in distribution who are trained and equipped for enclosed space entry. (Direct-buried cables and duct which is not concrete-encased are designed and built by other organizations within Georgia Power.)
Civil construction work, if extensive, is often sent to preferred contractors and supervised by construction supervisors from the Network Underground group.
Projects of $2 million or less are brought before the Regional Distribution Council for approval. Any projects that require more funding are sent to upper management for review and funding approvals.
The Underground Construction group consists of Cable Splicers, Duct Line Mechanics, Test Technicians, Winch Truck Operator (WTOs), and Light Equipment Operators. Cable Splicers perform work with the electrical infrastructure such as making up joints and terminations, including preparing lead splices, and operating network equipment. Duct Line Mechanics perform the civil aspects of the work, such as duct line and manhole construction. Cable pulling is normally performed by Cable Splicers, but is sometimes performed by Duct Line Mechanics.
The Underground Construction group also utilizes contractors for performing much of the major civil construction work. Georgia Power has a few contractors of choice for underground work, and has standing agreements with these companies, many of which have been working for Georgia Power for a number of years. Cleaning and civil maintenance is inspection-driven. If, during routine inspections, a field engineer, Test Technician, or journeyman finds and documents the need for civil maintenance or cleaning into the company’s DistView or GIS system, the appropriate construction crew or cleaning crew is dispatched for further analysis and action.
Maintenance and operations of network equipment such as network transformers and network protectors are performed by Test Technicians within the Test Group of the Operations and Reliability group within Network Underground.
Process
A typical cable-splicing crew consists of three men, including a Senior Cable Splicer, a Cable Splicer (the Journeyman position), and a Winch Truck Operator. Cable Splicer is one distinct job family within the Georgia Power Network Underground group and has the following three levels of classification:
- Cable Splicer Apprentice
- Cable Splicer (Journeyman)
- Senior Cable Splicer
The Senior Cable Splicer is in charge of the crew, but also performs work in manholes and vaults. This crew is responsible for all network electrical work within manholes and vaults. The WTO is a helper-type position on these crews and is not unique to the Network Underground department; WTOs are used throughout the Georgia Power Company in both network underground and distribution (radial) networks.
Georgia Power typically runs a six-man crew for duct line work, but it depends on the nature and scope of the work. The Duct Line Mechanic is one distinct job family in the Georgia Power Network Underground group and is responsible for duct line work in the manholes and vaults construction (pouring duct lines, construction, etc.). The Duct Line Mechanic group consists of the following positions:
-
Duct Line Apprentice
-
Duct Line Mechanic (the Journeyman position)
-
Senior Duct Line Mechanic
The crews work co-operatively together, and may substitute some senior members in crews as needed. For example, a Senior Cable Splicer may assist a duct line crew when needed. Similarly, at times, Duct Line Mechanics may help pull cable. Duct Line Mechanics do not splice cable, however.
If there is a big construction job or extensive night work that needs to be done, Georgia Power can bring in its preferred contractor(s). The supervising manager hands the plans over to the contractor for completion. The manager coordinates with the contractor foreman, or he may assign a Georgia Power foreman to coordinate with the contractor. Relying on contractors is especially productive as major projects ebb and flow, and Georgia Power wants to retain its own duct line, cable, and construction crews for smaller jobs that need a fast response and/or for work that may be too complex for contractors to handle in a reasonable amount of time.
7.3.12.11 - HECO - The Hawaiian Electric Company
Construction & Contracting
Organization
People
The C&M Underground Division at HECO is part of the Construction and Maintenance organization. The group is comprised of two UG supervisors, fifteen Cable Splicers, 2 Utility Mechanics, and 2 Utility Assistants. The Cable Splicer is the journeyman position in the department. These individuals perform all activities associated with the construction, maintenance and operation of the Underground system, including working with lead (PILC) cable and transition splices. The Underground group does most of the work on underground distribution in urban areas.
HECO also has “Overhead” C&M groups that also perform work with both overhead and underground facilities. The journeyman position in the Overhead groups is a lineman. When the Overhead group works with underground facilities, they work primarily with 12kV URD facilities.
All the people in the underground and overhead groups (non-supervisors) are represented by a collective bargaining agreement (IBEW).
Process
The Underground Group performs all activities associated with the construction, maintenance and operation of the underground system, except working with network transformers and network protectors. The UG Group’s duties include cable pulling and installation, cable splicing, underground equipment inspection and maintenance and fault location. The UG group performs all primary fault location for the island of O’ahu. The Underground work exclusively works with lead cables / lead splices / transition splices for HECO.[1] The UG group will also install Substation exit cables.
The Underground group will perform cable installation and maintenance of network feeders. However, the UG group does not install or maintain network equipment such as network transformers or network protectors. Network equipment construction and maintenance is the responsibility of the Substation group at HECO. The Substation group is part of the Technical Services Division of the System Operations Department.
The Overhead group also performs construction, maintenance and operations of underground facilities, although most of their underground focus is with URD. The Overhead group will perform secondary fault location, and will prepare poly splices.
[1] HECO only performs lead wipes on their 46kV gas filled cable. (This is lead cable impregnated with pressured nitrogen to keep out moisture). This cable is scheduled to be replaced with EPR cable. All other splices are transition splices (lead – poly).
7.3.12.12 - National Grid
Construction & Contracting
Organization
People
The National Grid network field resources (network crews) are part of the group responsible for the underground system in eastern New York, called Underground Lines East. This group is led by a Manager, and includes a group focused on civil aspects of the underground system and a group focused on the electrical aspects. The Underground lines group is responsible for both the network and non – network infrastructure in eastern NY, including the Albany network.
The Civil Group is comprised of Mechanics, Laborers, and Equipment Operators, and is led by a supervisor. This group includes a machine shop located in Albany. The group has 23 field resources.
The Electrical Group, comprised of Cable Splicers and Maintenance Mechanics, is led by three supervisors. Cable Splicers work with cable and cable accessory installation and maintenance, including cable pulling and splice preparation. Maintenance Mechanics perform network switching, fault location, minor vault maintenance, and inspection and maintenance of network equipment such as transformers and network protectors. The total UG Electric East group has 29 field resources.
The Electrical Group field classifications are represented by a collective bargaining agreement. (Union IBEW in New York, multiple unions in NE). Advancement in union positions in UG East is through an automatic progression to a journeyman.
Construction management also includes resources such as Schedulers and Work Coordinators. These resources work closely with field supervisors to schedule and resource plan the work. Work coordination includes performing pre job field checks to identify the things that must be addressed before the job commences.
Process
National Grid has a 42 - month automatic mode of progression whereby employees must move through a program of formal training, on the job training (OJT) and testing and become a journeyman within the 36 month period. (See Crew Makeup / Job Progression). Apprentices must serve as a helper for six months before entering this program,
7.3.12.13 - PG&E
Construction & Contracting
Organization
People
The PG&E network field resources (network crews) are part of the Maintenance and Construction- Electric Network organization. The group is led by a Superintendent, VP, who is responsible for the secondary network infrastructure in the Bay Area Region, including San Francisco and Oakland. Note that this individual’s responsibility includes radial distribution in both San Francisco and Oakland.
Reporting to the superintendent, VP are three Distribution Supervisor positions who supervise the network field resources, two in San Francisco and one in Oakland. There is also a distribution supervisor who leads the Network Protector Maintenance / Repair Shop, and a Supervisor of the Compliance group, responsible for quality compliance,
The field groups are comprised of cable splicers, a bargaining unit position (IBEW). Cable splicers perform both cable work, such as cable installation and splicing, as well as network equipment work, such as network protector and transformer maintenance. Advancement in the Cable Splicer job family is through an automatic mode of progression.
In San Francisco, PG&E network crews work the night shift [1] . They typically run four 3- man crews in the evening to perform maintenance. A crew is normally made up of a Journeyman Cable Splicer, who does most of the network protector maintenance work, and two helpers (usually Apprentice Cable splicers).
PG&E also has three cable crew foremen on the night shift. The Cable Crew Foreman is a working position, with one foreman typically taking clearances and installing grounds, while the others overseeing the crews.
PG&E also uses a position called a Cableman who is a troubleshooter for the underground system, part of PG&E’s Restoration group (not part of the M&C electric network organization). There are six of these cablemen who work for the company. They work a rotating shift , and have 24/7 coverage.
PG&E has a General Construction group, also comprised of cable splicers, who work with both the radial and network cable infrastructure. Resources in this group are roving, and act as “internal contractors”, moving to where needed and supporting the Maintenance and Construction- Electric Network organization.
Process
PG&E has a 30 month automatic mode of progression whereby employees must move through a program of formal training, on the job training (OJT) and testing; they then become a journeyman within this period. (See Crew Makeup / Job Progression)
Employees enter the department as Apprentice Cable Splicers.
[1] Note that Cable Splicers are assigned during the day to work on San Francisco’s radial underground system. These crews can be redirected to address network issues that may arise during the day. However, all planned work on the network is performed at night.
7.3.12.14 - Portland General Electric
Construction & Contracting
Organization
People
Construction activities associated with the network infrastructure at PGE (part of the downtown CORE system) involve a number of departments. Because much of the construction on the network is not only for customer-owned facilities, such as building vaults, but also performed by external contractors, many construction practices involve working with third parties.
Service & Design at the Portland Service Center (PSC): Service & Design’s role is to work with new customers or existing customers with new projects, making it responsible for new connections, new buildings, and remodeling. The supervisor for Service & Design’s wider responsibility includes the downtown network. The supervisor reports to the Service & Design Manager, who is a peer of the Distribution Engineering and T&D Standards Manager. Both of these positions report to the General Manager of Engineering & Design and directly to the vice president.
The “Mapper/Designer” reports to the Supervisor of Service & Design at PSC and provides the computer-aided design (CAD), geographic information system (GIS), and design service.
A Field Inspector meets with contractors. Two inspectors work for the Service & Design organization, and one specializes in the network.
Service & Design Project Managers (SDPM): SDPMs, who also report to the supervisor for Service & Design, work almost exclusively on customer-driven projects, such as customer service requests. They also liaise with new customers in preparing designs. At present, two Service & Design Project Managers cover the network. SDPMs oversee projects from first contact with the customer to the final completion, and coordinate and manage construction designs and customer connections to ensure full compliance.
Ideally, a SDPM has an associate degree or a combination of electrical engineering experience and appropriate education. SDPMs should have proven project management skills and understand PGE and industry standards and practices. They should also have knowledge of the National Electrical Safety Code (NESC) and National Electrical Code (NEC), as well as the ability to use or learn the relevant information technology (IT) systems. PGE prefers to have a selection of SDPMs with a diverse range of experience and backgrounds, so the position does not necessarily require a four-year engineering degree. The managers can be degreed engineers, electricians, service coordinators, and/or designers [1].
SDPMs work on both CORE and non-CORE projects. This allocation of work ensures that expertise is distributed and maintained across departmental and regional boundaries [1].The Project Managers are separate from Distribution Engineering and T&D Standards.
Distribution/Network Engineers: Three Distribution Engineers cover the underground network and work with customers to design and operate customer-owned facilities. The Distribution Engineers are not based in the PSC or CORE group but work very closely with these groups through the entire project life cycle. The Eastern District Central Supervisor, who reports to the Manager of Distribution and T&D Standards, oversees them. The underground Distribution Engineers are qualified electrical engineers. When needed, PGE hires civil engineers to perform certain planning tasks.
Network engineering also develops and maintains the standards for the network, and supports planning activities by providing the loading information used to create CYME and PSSE models.
Standards Department: The Manager of Distribution Engineering and T&D Standards oversees the Standards Department. The Distribution Engineers who support the network prepare and maintain network standards, which are forwarded to the Standards Department for inclusion in the company standards. The group employs one technical writer and four standards engineers.
Contract Services and Inspection (CS&I): At PGE, the CS&I department supervises contract management. Five Construction Managers work in the CS&I group and inspect any work performed by contractors on PGE-owned infrastructure. Field Construction Coordinators (FCC) inspect facilities built by customers. For larger projects, PGE may outsource inspections to external experts, such as POWER Engineers, Inc.
When constructing facilities, such as vaults, which will house PGE equipment, customers can choose from two third-party vault contractors who have received approval certifications from PGE.
Civil Engineers/External Contractors: PGE will typically contract civil engineering and structural design tasks, seeking contractors who prepare designs that conform with Oregon Public Utility Commission (OPUC) requirements. Generally, if civil issues are found with structures, such as a crumbling vault wall, an external structural expert will be consulted.
Synergy with PacifiCorp: PGE shares the downtown area with PacifiCorp, and although there is a defined boundary, some vaults, manholes, and duct banks share infrastructure among the two companies. PGE and PacifiCorp work closely to coordinate on managing shared infrastructure.
CORE Underground Group
The resources that comprise the group that services the downtown underground “core” infrastructure are physically located in one location. It services an approximately 1.5 mi2 (3.9 km2) territory bounded by the Willamette River in the East and the 405 freeway in the West. The underground group services both the network and radial systems located in the core, with network comprising about half of the system. PGE operates a number of underground crews responsible for the radial system and network in the PSC area. The CORE group is led by an Underground Core Field Operations Supervisor, who reports to the Response & Restoration Area Line Manager (ALM).
Crews
The PSC craft workers are responsible for radial underground, overhead, and network systems based on the geography. The CORE group, which is a part of the PSC, focuses specifically on the underground CORE. It includes both radial underground and network underground infrastructure in downtown Portland.
Currently, the following 16 people work in CORE:
- Four non-journeymen
- Eleven journeymen (e.g., assistant cable splicers, cable splicers, foremen)
- One Special Tester
Resources in the CORE include the following:
- Crew foreman: Crew foreman (a working, bargaining unit position)
- Cable splicer: This is the journey worker position in the CORE.To become a cable splicer in CORE, an employee must spend one year in the CORE area as a cable splicer assistant
- Cable splicer assistant: A person entering the CORE as a cable splicer assistant must be a journeyman lineman. All cable splicers start as assistant cable splicers for one year to learn the system and network.
The cable splicer position is a “jack-of-all trades” position with work including the following:
- Cable pulling
- Splicing
- Cable and network equipment maintenance
- Cleaning
- Pulling oil samples from transformers
The typical underground crew consists of three people: two journeymen and a non-journeyman helper. The foreman, who is a qualified cable splicer, is one of the working journeymen on the crew. The two journeymen typically perform the work inside the manhole or vault, while the helper usually stays above ground carrying material and watches the barricades and street for potential hazards.
In addition, a crew may include an equipment operator who will operate the cable puller, vacuum truck, or other equipment. Note that some work, such as backhoe work, is usually performed by external contractors.
Technology
PGE uses a number of key IT products to support the management of their network infrastructure, including a GIS system (ArcGIS), a work management system (Maximo), and an Outage Management System (OMS), specifically Oracle NMS. A brief description of these technologies and their capabilities are presented here.
Geographic Information System (GIS) – ESRI ArcGIS/Schneider ArcFM
PGE uses ArcFM GIS software for designing network layouts and creating a work package with details for relevant personnel, including construction and contract crews. ArcFM builds upon ESRI’s Arc GIS. Schneider Electric’s ArcFM software is a map-focused GIS solution that allows users to model, design, maintain, and manage systems, displayed graphically alongside geographical information.
ArcFM uses open-source and component object model (COM) architecture to support scalability, user configurability, and a geographical database. The system includes a recording system for asset data and a model of the distribution system. ArcFM also includes a Microsoft Silverlight interface that supports data management, planning, design, and analysis through a desktop computer. The mobile functionality supports data validation and editing in the field, and the system is web-compatible for remote access.
ArcFM includes tools that allow network editing, GIS asset management, design integration, and work management.
Maximo for Utilities 7.5
IBM’s Maximo for Utilities 7.5 system supports asset and work management processes for transmission and distribution utilities, covering most asset classes and work types. The system allows users to create work estimates and manage field crews. Maximo can integrate with a number of systems, including fixed-asset accounting, mobile workforce management solutions, and graphical design systems. The Maximo Spatial system is compatible with map-based interfaces, such as ESRI ArcGIS, and follows J2EE standards [26].
Maximo for Utilities supports operations across a number of areas:
- Estimating compatible units (CUs)
- Managing field crews
- Tracking skills and certifications
- Integrated fixed-asset accounting
- Supporting field workforce management
- Graphic design functionality
- GIS integration
- Using Gantt views for analyzing work orders
- A compatible unit library helps planners and designers estimate CU when creating a project.
Maximo 7.5 can upgrade with a number of optional modules. These include the Asset Management Scheduler, which allows tasks to display in a Gantt view that shows the task dependencies and durations specified in the work order. The Spatial Asset Management module includes a map-based interface to track assets and locate work order and/or service request locations [2].
The PowerPlan Adapter is a corporate-level suite intended to facilitate accounting during operations. The system automates asset lifecycle management and supports compliance monitoring. The PowerPlan Adapter aggregates work orders and ensures that all aspects of a task are included, and users can add costs for labor, materials, and contractors when they arise [3].
Outage Management System (OMS)/Oracle NMS
PGE migrated to an Oracle NMS outage management system, which is based upon WebSphere technology [4]. Oracle NMS is a scalable distribution management system that manages data, predicts load, profiles outages, and supports automation and grid optimization. The system combines the Oracle Utilities Distribution Management and Oracle Utilities Outage Management systems in a single platform. The system supports outage response and the integration of distributed resources [5].
Oracle NMS blends SCADA function and GIS models to combine as-built and as-operated views of the system. The application includes a number of advanced distribution management functions, including network status updates in real time, monitoring and control of field devices, switch planning and management, and load profiling. Oracle NMS can integrate with other SCADA and GIS systems, and monitors network health using data from a number of systems [6]. The NMS includes a simulation mode for training and supports switch planning and control.
Oracle NMS maintains a network model that handles the whole grid, includes every device, and integrates with existing systems using standards-based protocols such as Inter-Control Center Communications Protocol (ICCP), Common Information Model (CIM), and MultiSpeak-based web services. The system can also integrate with a range of GIS and advanced metering infrastructure (AMI) systems.
PGE’s NMS/OMS integrates outage information and location, switching, and work management functionality into a single system. Operators can view and manage system status and operational data in real time, and the system uses a data model to predict the location of outages. The system can present data on a dashboard and through customized reports.
- Northwest Public Power Association. “Service & Design Project Manager Level II/III.” NPPA.com. https://www.nwppa.org/job/service-design-project-manager-level-iiiii/ (accessed November 28, 2017).
- IBM. “IBM Maximo for Utilities, Version 7.5.” IBM.com https://www.ibm.com/support/knowledgecenter/en/SSLLAM_7.5.0/com.ibm.utl.doc/c_prod_overview.html (accessed November 28, 2017).
- Maximo Adapter. PowerPlan, Atlanta, GA: 2017.https://powerplan.com/resources/minimize-risk-and-optimize-maximos-implementation-with-powerplan(accessed November 28, 2017).
- D. Handova, “PGE: Driving Customer Value With Network Management Systems.” EnergyCentral.com. http://www.energycentral.com/c/iu/pge-driving-customer-value-network-management-systems(accessed November 28, 2017).
- Modernize Distribution Performance All the Way to the Grid Edge. Oracle, Redwood Shores, CA: 2015. http://www.oracle.com/us/industries/utilities/network-management-system-br-2252635.pdf(accessed November 28, 2017).
- Modernize Grid Performance And Reliability With Oracle Utilities Network Management System. Oracle, Redwood Shores, CA: 2014.
7.3.12.15 - SCL - Seattle City Light
Construction & Contracting
Organization
People
SCL has an Energy Delivery Field Operations department that includes a network Electrical Services group (Area Field Operations – Network) group, and a network Civil Services group.
The Electrical Services group is made of 84 total people including the supervision and a five-person cable-locate crew. (Note: this cable-locate crew does underground locating for the whole company). This group performs all construction, maintenance, and operation of the network system.
The Civil Services group consists of approximately 36 employees. In addition, SCL contracts approximately 25% of their civil construction work associated with their network system as well.
Cable Splicer Position
The Cable Splicer position at SCL is a generalist position. Cable Splicers perform all electrical aspects of network construction, operations, and maintenance. All electrical employees who work in the network are either Crew Chiefs, journeyman Cable Splicers, or apprentices in the mode of progression, working their way towards the journeyman level.
Mode of Progression
SCL uses a three-year automatic mode of progression. This mode includes 8000 hours of On the Job Training (OJT) and testing. They have experienced a very low dropout rate from the program. This is in part because they administer a highly selective front end test and interview process to accept apprentices into the program. Also, a Cable Splicer position at SCL is a highly sought-after position.
Training
In addition to the training associated with the mode of progression, SCL provides network crews with opportunities for training including mandatory safety training for processes such as manhole entry and manhole rescue. SCL also periodically sends personnel to conferences and specialized training sessions such as the Cutler Hammer School, etc.
Crew Makeup
A network crew is normally made up of one Crew Chief, one or two Cable Splicers, and one apprentice. The type of work to be done and SCL work rules will dictate the appropriate crew makeup. For example, performing switching in a vault requires at least two journeyman-level employees to be in the vault. These and other work rules and safety practices are spelled out in the Washington State Safety Standards for Electrical Workers, Chapter 296-45 WAC.
Process
Bi-weekly Crew Coordination Meeting
SCL convenes a bi-weekly crew coordination meeting focused on the project status of each active network project. Meeting participants include the supervision and others from the network design group (engineers), civil crew representatives, electrical crew representatives (including crew leaders), and customer service representatives who deal with customers who are adding load.
This meeting is effectively used to manage network construction projects. Representatives review the project status of both civil and electrical projects and identify actions necessary for the projects to proceed. A report is used that shows critical project milestones such as the vault acceptance date and feeder in date. See Attachment E , for a sample network jobs project summary. Note that a similar form is used to track the progress of civil construction projects.
The meeting is also used to establish action items to identify network conditions that must be addressed. One example would be the identification of vault locations where ventilation is inadequate for the summer heating season. The group will identify an action plan to make contact with building owners to address these deficiencies.
Incoming Network Equipment Inspection
SCL does an incoming inspection of network equipment. They have a person who is responsible for incoming equipment quality control. Each incoming transformer and network protector is tested when received at the test facility before being made available for field service. The test facility prepares an inspection report documenting the results of the inspection.
See , for a copy of SCL Network Transformer Inspection Checklist that guides the inspector through the inspection. , for a copy of SCL Network Transformer Inspection Checklist that guides the inspector through the inspection.
Other network equipment, such as cable, elbows, T bodies, etc. are sampled and tested at random. These tests can include X-raying to identify deficiencies.
Technology
Network Tools
SCL crews believe their tools to be of top quality. An example would be the network protector test kits (Richards) that the crews use to perform network protector maintenance. See Attachment G , contains a brief sample listing of the types of smaller tools typically provided to the crews.
7.3.12.16 - Survey Results
Survey Results
Construction & Contracting
Organization
Survey Questions taken from 2015 survey results - Summary Overview
Question 011: Within your company, how many Full Time Equivalent resources (FTEs) make up the following functions?


Survey Questions taken from 2012 survey results - construction
Question 5.1: Total number of Network field electrical workers (do not count “civil” workers)


Question 5.2: Do you contract any network electrical (not civil) construction work?

Question 5.6: How many hours of training (on average, per person) does your field force receive in a year?

Question 5.7 : Do you routinely conduct post construction audits to ascertain / assure the quality of the construction?


Question 5.8 : If Yes, what are the major items that are assessed during a post construction audit?

Question 5.9 : Do you have a formal process for reporting construction standards or material specifications deficiencies?

Question 5.11 : Do you utilize Mobile Data Units in your network fleet?

Survey Questions taken from 2009 survey results - construction
Question 5.1: Do you have a distinct field group focused on the construction, maintenance and operation of the network? Or are your field workers part of a group that also works with non network systems?

Question 5.2: Total number of Network field electrical workers (do not count “civil” workers) (This question is 5.1 in the 2012 survey)

Question 5.3: Do you contract any network electrical (not civil) construction work? (This question is 5.2 in the 2012 survey)

Question 5.7: How many hours of training (on average, per person) does your field force receive in a year? (this question is 5.6 in the 2012 survey)

Question 5.8 : Do you routinely conduct post construction audits to ascertain / assure the quality of the construction? (this question is 5.7 in the 2012 survey)


Question 5.9 : Do you have a formal process for reporting construction standards or material specifications deficiencies?


Question 5.11 : Do you utilize Mobile Data Units in your network fleet?

Question 5.12 : If so, what system are you using?

7.3.13 - Pre-cast Concrete Conduits
7.3.13.1 - CEI - The Illuminating Company
Construction & Contracting
Pre-cast Concrete Conduits
People
Civil construction, including the installation of vaults, manholes and duct back is performed by contractors at CEI.
CEI typically retains the services of five different contractors to perform civil work (construction and maintenance).
Process
The Underground Network Services group has one supervisor who runs the contractor crews.
Technology
Cables in underground network areas are installed in PVC DB-120 conduit encased in concrete with conduit spacers as per FirstEnergy s Network Design Practices Guideline. The design will include four inch spare conduits for additional secondary cables, and, where it is feasible that primary could be installed, two six-inch conduit spares in the lowest row on the duct bank.
7.3.13.2 - Con Edison - Consolidated Edison
Construction & Contracting
Pre-cast Concrete Conduits
People
Pre-cast Concrete Conduits
Con Edison uses 4-in., pre-cast concrete conduit sections for housing electric cables in open trench installations. These conduit sections are square in cross section, and are ordered for either strait runs or bends. Con Edison uses bell end conduits for entrance into manholes. These pre-cast conduit sections can be joined together as required, using male ends that connect with a plastic coupling. Con Edison requires that the conduits be able to pass specific tests, including a mandrel test to ensure the conduits are open, transverse loading tests, compression load tests, and a friction test.
For secondary cable installations where space may be limited, or the soil is unstable, Con Edison may use alternative conduit materials such as steel, fiberglass, and high-density polyethylene (HDPE). For example, steel conduits may be used in an open trench where the soil is unstable, for a jacking or driving operation, or where space is limited due to a shallow trench. Fiberglass conduits may be used in damp soil locations where corrosion is a problem. Con Edison has well-written guidelines that define conduit types and appropriate usage.
When Con Edison must install new duct banks, particularly in Manhattan, they often find it difficult to bring in heavy machinery. In these situations, the utility assembles a large group of laborers to hand dig the trenches to install new duct banks. Con Edison often schedules this work at night, to avoid the some of the challenges of performing this work during the day, such as vehicular and pedestrian traffic and other work restrictions.

Figure 1:

Figure 2:

Figure 3:
7.3.13.3 - Duke Energy Ohio
Construction & Contracting
Pre-cast Concrete Conduits
People
Most civil construction work at Duke is performed by contractors. Duke network resources will perform minor civil repairs.
Within the Dana Avenue construction and maintenance organization, Duke employs a T&D Construction Coordinator who interfaces with contractor crews, including civil contractors.
Process
Duke Energy Ohio uses civil contractors to both perform civil construction and assist Duke in assessing the condition of facilities from a civil perspective. For example, the civil contractor will be called in to assess the roof condition or other structural condition issues in determining what repairs should be made to a vault or manhole.
Technology
In urban installations, Duke Energy Ohio encases conductors in concrete duct bank installations.
Duke Energy Ohio does not use pre-cast duct bank, as each installation is unique size wise. Their standard duct bank installation includes grounding, tracer wire, and colored dye.
Note that in rural areas of their territory, Duke Energy Ohio does not encase conduits in concrete.
See Attachment E for sample standard conduit drawings used by Duke Energy Ohio.
7.3.14 - Project Management
7.3.14.1 - AEP - Ohio
Construction & Contracting
Project Management
People
Project Management (PM) activities are performed at various levels at AEP. For large programs, such as the ongoing secondary cable replacement project or network remote monitoring upgrade project, AEP will assign a project manager who will lead and coordinate among the various internal and external stakeholders. For the largest projects, AEP may dedicate additional resources for activities such as cost management, scheduling and reporting. For large projects that may involve an extended contractor team, the AEP project manager will coordinate closely and regularly with the vendor project manager. AEP may select a project manager for a special project from any part of the organization.
PM for the larger projects is the responsibility of Customer Service Representatives (CSRs). The CSRs, which are part of the regional organization, work as key account reps and work closely with Network Engineers when new customer service is requested. Together, they determine the most cost-effective design and scope of the project.
AEP Network Engineers have project management responsibility for all network projects and programs from capacity planning to inspection and maintenance to construction, from project inception through completion. Project management over civil construction, performed by a contractor at AEP Ohio, is also the responsibility of this group, based in the downtown Columbus, Ohio offices. The group leader, which is the Network Engineering Supervisor, reports indirectly to the parent company Vice President of Distribution Services.
Process
AEP Ohio Customer Service Representatives are assigned to an area of expertise, such as public works, manufacturing, office complexes, etc., rather than to a geographic area as is done at many companies. This specialization and experience is leveraged when working with Network Engineers for specifying the requirements and estimating the costs for new customer service and reinforcement projects.
AEP Network Engineers are responsible for all project management, from network capacity analyses through final inspection. Network Engineers manage the following:
-
Project analyses for capacity, load flow, and costs
-
Final design and detailed plan hand-off to its civil engineering contractor
-
Support of construction
-
Civil work permits and material acquisition
-
Final inspection
For any large-scale projects, the Network Engineers must work with the parent company, AEP. Many large-scale, company-wide projects, such as the secondary cable replacement program, have assigned leadership who coordinates across companies and may leverage existing groups with multi AEP Operating Company representation, such as the Network Standards Committee. Even with the largest cross company projects, local management is the responsibility of the AEP Ohio Network Engineers and the Network Engineering Supervisor.
Technology
Network Engineers and Customer Service Representatives maintain management spreadsheets to track the progress of any new customer service projects (see Figure 1). AEP Ohio maintains its own work spreadsheets and analyses to track large-scale network projects and programs. AEP will utilize Gantt charts and graphics, were practical, to facilitate communication of project status.

Figure 1:
Excerpt from AEP asset program report
7.3.14.2 - Ameren Missouri
Construction & Contracting
Project Management
People
Most projects involving the design and construction of urban underground infrastructure within St. Louis are primarily the responsibility of the engineers within the Division Engineering Group in the Underground Operations Center. Only projects in excess of $25-million are assigned a specific corporate project manager (not part of the engineering group).
Organizationally, the Underground Operations Center is part of Energy Delivery Distribution Services, reporting to a VP. This center, led by a manager, consists of both engineering and construction resources responsible for the downtown infrastructure. The engineering group is led by supervising engineer, and is comprised of Engineers and Energy Services Consultants (commonly referred to as Estimators) who deal with planning, design, service issues, and project management.
All of the engineering positions are four-year degreed positions. Some engineers within this group have their PE licenses, although this is not a job requirement. Engineers are not represented by a collective bargaining agreement. The Energy Services Consultants (Estimators) have a combination of years of experience and formal education, including two and four-year degrees, and are part of the union, IBEW.
Construction managers are also involved in project management, such as work prioritization, resourcing, and scheduling. They worked closely with the engineering group to manage construction projects with the network.
Recently, Ameren Missouri has formed the “Underground Revitalization Department,” a team of engineers (all 4-yr degreed) focused on researching, evaluating, and developing plans for performing capital improvements to and revitalizing downtown St. Louis, including the network. Part of this group’s role includes addressing issues such as the development and update of planning criteria for the network, and the design of enhancements to the downtown area, such as developing potential designs to build a new substation to supply network load in St. Louis including project plans for execution.
Process
Engineers within the Division Engineering Group informally manage most projects. These project managers (engineers) prepare a monthly forecast and budget for their projects and are responsible for staying within the authorized limits. The engineers participate in weekly meetings with construction management to focus on work resourcing and scheduling.
On larger projects, engineers look at actual man-hours versus estimated on a monthly basis in order to manage progress, and critique the quality of their estimates so as to better estimate projects in the future. This monthly analysis is also used to improve the standards to assure that the resources and dollars associated with compatible units for construction standards are appropriate and realistic.
Work scheduling is a joint effort involving engineers, estimators, and construction supervisors. Ameren Missouri has formed a work prioritization and scheduling group, which is comprised of engineering and construction people within each district who focus on prioritization and scheduling. This group meets weekly review project at resourcing and scheduling.
New job requests flow through engineering, where they are assigned to an estimator. The estimator develops a cost and resource estimate and loads it into Ameren Missouri’s work prioritization and scheduling (WPS) system, a scheduling system based on their DOJM system. When the project has been approved, it is entered into the work schedule. (Note that projects over 80K require specific approval at Ameren Missouri.)
Work dates are entered manually into the work schedule. The system looks at resource availability based on crew assignments already entered and provides an indication of when the project can be resourced and thus scheduled. For larger, more time-consuming projects, it is difficult to project the required date until the design is complete. In these cases, an educated guess of the required date and resource expectation is entered to provide some long-term planning information to construction.
Project managers (engineers, estimators, and construction supervisors) meet weekly and review reports produced by WPS. The reports provide a listing of what work must be done next week, and a forecast of what’s upcoming. The review is used to make decisions about resourcing and work schedule. Within the system, work types are broken into categories, so that managers can compare customer work, for example to maintenance work and adjust resources as required. This review, for example, may reveal a manpower deficiency that leads to the necessity of contractors.
Technology
Estimators use the Distribution Operational Job Management (DOJM) to prepare job estimates. This system enables an estimator to build a job using compatible units that represent certain construction standards, which are accompanied by estimates of required labor hours, materials and their associated costs. The DOJM system is based on a Severn Trent product.
Ameren Missouri uses a work prioritization and scheduling system, based on the DOJM system.
7.3.14.3 - CEI - The Illuminating Company
Construction & Contracting
Project Management
People
Project Management – assuring that the scope, schedule and budget of underground projects are being met - is the responsibility of the supervisors with in the UG Network Services Department.
The supervisors work in tandem with project management personnel within the regional Engineering Services organization (Project and Portfolio Management subgroup), who focus primarily on progress and expense reporting, and project overage / underage justification.
Process
The UG Network Services supervisors meet weekly to assess the needs of the coming week and to develop a schedule. An advanced distribution specialist within the department prepares the schedule, and fine tunes it to meet daily requirements. The final crew assignments are updated by the supervisors CEI’s CREWS scheduling system.
UG Supervisors travel to field sites daily to assure that the people, equipment, and materials are brought to bear on the execution of projects. They interface with customers, address all resource issues, and monitor work progress at the jobsite. They are sometimes accompanied by asset management personnel – usually to provide training for these individuals.
CEI job designs include estimated resource requirements. UG department supervisors monitor actual resource expenditure and compare to these estimates. Crew leaders complete daily timesheets recording the hours expended against each project.
CEI has assigned one supervisor the responsibility for managing contractor crews performing work on the underground system.
Technology
CEI uses an in house scheduling system called CREWS, to schedule work, and track progress and accomplishment.
7.3.14.4 - CenterPoint Energy
Construction & Contracting
Project Management
People
CenterPoint’s underground organization is centralized, with the resources who work with the major underground infrastructure reporting organizationally to one group - Major Underground. At CenterPoint, the term “major underground” is used to describe the three phase underground system that supplies the urban portions of the Houston metropolitan area using ducted manhole systems, and including the secondary network systems. It consists of three phase facilities supplying commercial and industrial customers (with the exception of the network, which serves residential load as well). URD installations and single phase underground line extensions are not considered part of Major Underground, and are managed by other CenterPoint service centers.
The Major Underground organization, comprised of 208 total resources, includes Key Accounts, Engineering and Design resources, support services, and the field force responsible for all construction, operations and maintenance activities.
Management of the construction of projects is the responsibility of the Crew Leaders within Major Underground. The Crew Leader is a non-bargaining position at CenterPoint, responsible for leading both the Cable and Relay construction organizations. Crew Leaders work closely with Engineering Department in managing projects. See Design - Organization for more information.
For larger projects, the Key Accounts organization provides overall project management and coordination activities. See Design - Key Accounts for more information about this group.
Process
The Key Accounts group provides project coordination for new projects, and stays current with the happenings / growth at key commercial customers such as medical centers, municipalities, and universities. They also provide a single point of contact for large national retail chains. They are involved in power quality and reliability issue resolution, relocations, and long term O&M rehab projects. They also interface with governmental agencies.
7.3.14.5 - Con Edison - Consolidated Edison
Construction & Contracting
Project Management
People
Project Management
Energy Services has two project manager positions — the CSR Project Manager, who manages smaller projects less than 1000 kW, and the CPM Project Manager, who manages larger projects, 1000 kW and greater.
The CSR and CPM Project Managers receive the layout and issue work orders to construction management (for contracted work) and electric operations to execute the project. They ensure that the customer gets service on time. They coordinate dates, check the customer’s work to make sure it makes sense, ensure that the termination points are adequate, obtain city approvals, etc.
New Service Design
The Energy Service Organization at Con Edison has various subsections that are involved in the process of responding to customer requests for service: the Service Assessment team, Engineering, Layout, and Project Management.
Planning and Survey Group
The Planning and Survey group is a subset of the Field Engineering group, and consists of Surveyors, who perform survey work associated with new construction, and Planning Inspectors, who go into the field, and assess the specific field conditions and determine what is necessary for the new installation to be built successfully. Planners and surveyors can work separately, or work together on projects. This group works closely with Energy Services, taking layouts developed from maps by Energy Services on Microstation, and field checking them to identify the specifics of the job and ensure that the layout reflects field conditions. This group prepares job sketches to obtain the necessary permitting to complete the job.
7.3.14.6 - Duke Energy Florida
Construction
Project Management / Scheduling
People
The Resource Management group provides project management support services to the Duke Energy Florida Construction and Maintenance organization. Duke Energy Florida recently assigned one Project Manager, from the Resource Management group, to support network systems. Previously, there was no designated project manager in this role. Part of the rationale for the assignment of the project manager is a network revitalization effort underway at Duke Energy Florida. (See Network Revitalization – Florida Primary and Secondary Network Improvement Plan).
The Project Manager provides project management support services to the Network Group, and works closely with engineering and network supervisors to make sure the needs, requirements, and challenges of the network systems are understood and addressed.
Project Managers are required to go through a formal Project Manager Training designed for Duke Energy. Training is administered through the Duke Energy Project Management Center of Excellence (PMCE). The Project Manager assigned to the network group has experience with design, engineering, and GIS, including working with networks.
Scheduling
Historically, scheduling of work on the network system was handled within the St. Petersburg Operation Center by the supervisor of the network group. The Operation Center was responsible for prioritizing and scheduling the work for network crews.
Within the past few years, Duke Energy Florida has been in a transition phase with centralized scheduling. A scheduler at Duke Energy Florida coordinates work orders and new service for customers in the Clearwater and a second scheduler will focus on St. Petersburg. The schedulers all work for the Resource Management group.
In the new scheduling approach, the schedulers assigned to coordinate work orders for network crews also support the work order needs of the Engineering group. Both schedulers will also work with contractor crews to track work orders and keep work progressing. The current schedulers have previous experience with GIS and active working knowledge of the electrical distribution system to provide adequate support to supervisors and field crews. By design, the schedulers have a background in engineering with a solid foundational knowledge of workflow processes.
Process
Project Managers are responsible for making sure project milestones are met including schedules, budget, resources, building plans, documentation, and meeting customer needs. Project Managers are brought in to help when certain minimum monetary thresholds are met or on public works projects with regulatory requirements. Project Managers will also be involved in work affecting large commercial customers (or high profile, major accounts) with complaints or concerns.
Once assigned to a project, Project Managers will closely monitor the progress of the project to make sure timelines are on schedule and money spent (and projected spend) is within the budget. If projects are falling behind, the Project Manager will document the reasons and potential impacts to the overall project. To help ensure the project is progressing as planned, Project Managers will have weekly meetings with stakeholders to confirm resources, materials, manpower, and updated schedules.
Project Management has worked closely with upper management and the network group in developing improvement plans for the network. For example, when the network improvement initiative began, the project manager worked closely with network leadership to identify and document the gaps and determine the resources required for accomplishment. The project manager was subsequently responsible for formulating plans to address the defined needs.
Going forward, the Network Project Management group will also be responsible for planning network maintenance programs and inspections.
Scheduling
Working with the network supervisor, the schedulers are aware of the priority of work on the network system along with the resource requirements to complete the work at hand. Supervisors will inform the Scheduler of upcoming projects with priority to be entered into the ARM Scheduler software. Schedulers reach out to the network crews about the status of jobs, but most network crews will complete work orders on their mobile data terminals without assistance from the schedulers.
Technology
Duke Energy Florida uses a Work Management Information System (WMIS), by Logica (now part of CGI). WMIS will be used to track costs and time worked on larger network system projects overseen by the network project manager. The company anticipates using Microsoft’s SharePoint to help coordinate and share documents and information among various stakeholders in the organization. SharePoint will serve as a repository to share and organize Duke Energy Florida’s documents across the entire enterprise.
ARM Scheduler is part of the ARM Software Suite made by Logica. Only schedulers have direct access to update ARM Scheduler [1]. As a result, ARM Scheduler will export the queue of work orders to the network crews’ mobile data terminals or laptops (using WMIS) for field assignment and completion. Duke Energy Florida is considering a transition to Maximo’s scheduler and work management software.
7.3.14.7 - Duke Energy Ohio
Construction & Contracting
Project Management
People
At Duke, project management of network projects is a shared responsibility among multiple resources in both the Design and Construction organizations
The Engineering and Design Group has two Customer Project Coordinators (CPCs) who are responsible for much of the project management, as well as design, for network projects that interface with customers. Note that the CPC’s assigned to perform network design, also perform non-network designs.
At Duke, the CPC position is a non bargaining position with an educational requirement of an Associates degree. CPC’s perform the design for new business work and service upgrades. They will follow the project throughout its life, including communications with customers on items such as project status, obtaining loading information, and scheduling outages.
CPC’s that are selected to work in the network area are usually more experienced employees who have worked at other locations, and are experienced with Duke’s information technology. For very large projects, the department supervisor, the Distribution Design Supervisor, supports these individuals by providing overall department project management, and in preparing progress reports for upper management.
In addition, the network engineer gets involved in supporting these projects as required, and is actively involved with all network projects. The network engineer works closely with Planning and Construction and acts as an “operational asset” for the Dana Ave group. The Network Engineer also provides project management support, dealing with things such as change out issues, material orders, project planning issues, scheduling outages, etc. The network engineer also acts as a “point man” for problem resolution of issues coming out of Dana Avenue. Any questions that arise, whether they are electrical issues, cable issues, structural issues, etc, are funneled through the network engineer for answers. For those that the Network Engineer cannot answer, he will forward to the appropriate resources and act as a coordinator for obtaining a response.
When the project gets to construction, the crew Supervisors provide day to day project management, such as scheduling the work, assigning resources, assuring the material is available, etc.
Technology
Duke is not using a specific project management technology. They are using other technologies, such as design tools, accounting tools, and outage management tools to aid them.
In some cases they are using manual triggers, such as releasing a job folder to construction after receiving customer easements, payments, and signed documents.
Duke utilizes a GIS system, GE Energy Smallworld, as a design tool for much of their system. However, the network system is not modeled in Smallworld. Network design is done using drawing tools such as Microstation (Bentley) or AutoCad.
Duke is also using a material order system called JET (Job Estimating Tool) for network projects. This system is scheduled to be replaced by a system called Expert Designer (Bentley), which will use Microstation to build a cost estimate, and to order a bill or materials.
Duke has an accounting system that tracks all costs associated with a project. Any project with a cost over $50000 is tracked individually.
Duke’s outage system is used to schedule and manage any tagging or switching associated with a particular project.
7.3.14.8 - Energex
Construction & Contracting
Project Management
People
Energex has a strong project management focus. They have a group that serves as a program office that is comprised of project managers. Energex has 35 project managers within the program office, who manage the largest projects. The resources that comprise this group come from a variety of backgrounds.
-
Some are professional project managers. These tend to be the senior employees who are assigned the largest and most complex projects.
-
Some are personnel with strong field experience, and complement that with project management expertise.
-
Others serve as project coordinators. These personnel manage smaller jobs, where coordination is often the prime role of the PM. Personnel who serve as project coordinators come from a variety of backgrounds.
The group also has two program managers and schedulers who are adept with the company’s IT systems.
Process
CBD projects tend to be on the smaller side of projects managed by this group. Project managers are typically assigned to projects that require coordination among different departments. Because connections in the CBD typically involve relay controlled switchgear, they require the involvement of various departments, such as people to address the protective schemes, coordination with the control room, etc., as well as coordination between customers and the city. Because of the need to coordinate the activities of these various groups, a project manager is assigned and is responsible for identifying the various resource requirements, “bundling” the work, and completing the project.
Projects to connect new customers within the CBD involve connection to Energex’s multiple feeder meshed 11 kV network. As these projects tend to be more complex, they involve the assignment of a project manager. A project manager is assigned to the project just after the approach is developed by the planning department, and as it is handed off to the design area Project managers are measured on adhering to project cost estimates and clearly defined project schedules.
( See the New Service Design section in this report. )
Project managers use Gantt charts to track and report on project progress. Gantts are built from the bottom up, using anticipated resource requirements for each project task. Project managers manipulate the assignment of resources to meet project targets.
The program office works closely with the construction areas to schedule the work. The construction group includes a scheduling function, which takes the completed construction plan, and using the company’s Ellipse system, schedules the work down to the work group leader level. There is strong collaboration between the scheduling group and the program office.
Technology
Energex uses Primavera as their resource planning tool. Project resource estimates, which are entered into Ellipse, are rolled up into an overall resource plan within Primavera. Primavera produces an overall program estimate. (For example, Primavera produces a high level estimate for a program such as an 11 kV feeder re-conductor program, which provides a high level resource estimate and schedule.) As the program is implemented, Energex creates, schedules, and completes individual projects as part of that program. These individual projects are managed using Ellipse.
7.3.14.9 - ESB Networks
Construction & Contracting
Project Management
People
ESB Networks has established a Program Management organization, responsible for providing project portfolio management of the distribution investment plan.
Process
All construction and contracting is organized into distinct categories, so that managers can compare customer work, for example, to maintenance work and adjust resources as required. This review, for example, may reveal a manpower deficiency that leads to the necessity of contractors.
7.3.14.10 - Georgia Power
Construction & Contracting
Project Management
People
All projects involving the design and construction of urban underground infrastructure within Georgia Power are the responsibility of the engineers within the Network Underground group. The Network Underground group, led by the Network Underground Manager, consists of both engineering and construction resources responsible for the network underground infrastructure at Georgia Power. Project management is a shared responsibility among engineers within the Network UG Engineering group, marketing resources who work within Georgia Power’s marketing group, and construction resources.
The engineering group is led by a manager, and is comprised of design engineers, engineering representatives, and GIS Technicians. The engineers do both electrical and civil design. For smaller projects, the primary responsibility for project management lies with the engineers within the Network UG Engineering group.
For projects to serve new customers or significant load increases, the engineers partner with representatives from the Marketing group, including Key Account representatives for the largest customers.
The Marketing group members have a combination of years of experience and/or formal education, including two and four-year degrees, and work closely with the Underground Network design engineers on projects. They gather load forecast and revenue information and assist with financial analysis of proposed projects. They also involved with communicating with customers.
The Construction manager and distribution supervisors (Foremen) are also involved in project management, such as work prioritization, resourcing, and scheduling. They work closely with the engineering group and marketing to manage customer construction projects within the network.
There are primarily two types of construction projects that involve personnel in the Network Underground group: 1) the addition of new networks or network substations, including duct line work throughout the Georgia Power system and 2) projects that require construction at customer sites, including spot networks.
Network capacity upgrades and new networks are initiated by Area Planners. Area Planners are responsible for different areas of the state, such as Atlanta, Savannah, Macon, Augusta, Athens, and Columbus and are responsible for the substations in those areas to make sure the transformers have the capacity to handle projected future loads. These Area Planners are geographically based both in Atlanta and the southern part of Georgia. Those outside of Atlanta work in offices closest to the areas they are responsible for, while three Area Planners are based out of the company’s downtown Atlanta offices and are responsible for the Atlanta Metro area and a few networks in Macon and Augusta.
Projects of $2 million or less are brought before the Regional Distribution Council for approval. Any projects that require more funding are sent to the vice president of the Network Underground group and upper management for review and funding approvals.
Process
For network capacity upgrades and new networks, Area Planners meet monthly with the Network Underground supervising engineers to update the network expansion or upgrade plans. Area Planners look at least four years out for any anticipated new network projects.
Engineering and Marketing work together on new service projects, regardless of which group makes initial contact with the customer. The Marketing department has a project manager designated to work on network projects, but other Key Account Managers may also be involved, particularly if their assigned customers are involved
Many projects that come into the Underground Network group are large, and span many months (or even years).
Marketing gathers load and revenue information, assists with financial analysis, and helps communicate with customers. Marketing usually prepares initial cost and revenue options on new projects for customers with the following three options:
-
All upfront costs to the customer, with standard rates afterwards.
-
Least upfront cost for customer, with project costs added to the subsequent service cost.
-
A combination of both.
It is the job of the marketing department to provide the loading requirements to engineering. Some, but not all, Marketing project managers are engineers, so they are usually very accurate and conservative in their load assessments.
The marketing group has identified an individual who serves as a key contact to the Network UG group. This person has forged a strong relationship with engineers within Network UG, and the Network UG manager reports that this strong relationship has been beneficial to the partnership between the two groups.
The Georgia Power Network Underground group uses a team approach to streamline project management by coupling a design engineer with a project manager or a key account. The design engineer focuses on the technical aspects and communicates them to the project managers. Key account managers interface with the customer and the project manager.
Once a project package is assembled, it is presented to the Regional Distribution Council (RDC), a Georgia Power decision making body comprised of leaders from across the company. The primary purpose of the RDC is to ensure company-wide consistency in the allocation of budget resources. It reviews and approves all major distribution construction projects. The Marketing project manager and design engineer present the final package. Typically the design engineer presents and answers questions about the technical aspects of the project, while the project manager can present and then answer any financial, management, or scheduling questions.
Every job has a Microsoft Excel tracking spreadsheet associated with it. All phases of the project are tracked and entered into the spreadsheet by the project manager. The company does not use Gantt charts as projects too often come in spurts; for example, there may be a tremendous portion of the budget spent up front, followed by no activity for many months, and then another burst of activity. Georgia Power has found that typical Network Underground projects do not lend themselves to predictable, even schedules of financial outlays.
The group is held accountable for results, however. This is the primary reason the Marketing group, working with design engineers, performs detailed profitability analyses before presenting the final package to the RDC. Because of this careful upfront analysis, Georgia Power Network Underground projects rarely go over budget.
The group feels there is a good relationship and clear communications between Marketing and Engineering. This is essential as customers expect a high level of expertise and competency from Georgia Power because of the size and scope of the projects - mostly multi-million dollar projects that span over a long period of time and that are highly complex in execution and design.
For these reasons, design engineers may work directly with customer project managers to ensure the project is going as planned. Engineers may make pre-project site visits. It is not uncommon for customers to call or meet with the design engineer directly on key aspects of the project throughout its implementation. Customers also communicate directly with the Marketing project manager and/or Key Account associates as well.
All internal network underground projects are scheduled and managed by supervisors within their area of responsibility, such as civil projects (the replacement of brick roof vaults, SWIVELOC manholes, for example) and network upgrade projects (the replacement of network protectors, new networks). These supervisors also meet on a regular basis to update each other on progress and receive any on-going information that would affect the completion and prioritization of projects. These supervisors work directly with engineering to make certain they have the resources (both human and material) and are meeting the standards set by the Georgia Power Network Underground Standards Group.
All projects, whether internally or customer driven, have a formal transmittal document for transferring the project drawings to the work crews, signed by the engineer, with the job name, job numbers, job location, and complete description of the project. The job transmittal packet also includes the formal work order, which includes all the financial aspects of the project, such as costs and their associated account numbers. Another piece of the package is a safety review which lists all hazards on the jobsite and any safety-related procedures which will be needed.
Technology
For the estimation of project costs, Georgia Power has a custom software program, written by Georgia Power staff (legacy system), called the Job Estimation and Tracking System, or JETS. The system is used to develop project estimates, both preliminary estimates and approved work order estimates. The system has all the necessary pieces that go into calculating the job cost, overhead, material, etc.
All project designs are done using AutoCAD, and the engineering group has canned examples or reference standard designs, such as standard manhole, vault, and duct line modules, as well as cable racking diagrams, that can be “dragged” into the CAD of the project and modified as needed. The group uses the online Standards book for applying Network Underground design standards. The work crew receives any duct line drawings, plan and profile construction drawings, cable-pulling sketches, etc. in the transmittal packet that the cable and construction crews need for the project (See Figure 1 through Figure 3.).

Figure 1:
Excerpt from job sketch

Figure 2:
Sample Drawing showing duct bank position

Figure 3:
Excerpt from vault drawing – electrical details
7.3.14.11 - HECO - The Hawaiian Electric Company
Construction & Contracting
Project Management
People
In general, project management – assuring that the scope, schedule and budget of underground projects are being met - is the responsibility of the supervisors with in the C&M organizations (Overhead and Underground) at HECO. For large, complex projects, HECO assigns specific managers from their Project Management Division.
C&M Planning
HECO has a C&M Planning group within their Construction and Maintenance Division that focuses on project planning and scheduling. This group consists of seven resources that perform all of the planning and scheduling resources for HECO C&M. Of the seven, one resource is focused on providing the planning and scheduling for the Underground group.
The C&M planning group works closely with C&M supervisors to plan and schedule the work of the department. Prior to the formation of this group, HECO field supervisors were spending large amounts of time performing project planning and scheduling activities, preventing them from being in the field supervising the crews. HECO formed this distinct group to focus on project planning and scheduling activities, and to free up field supervisors to be in the field.
Project Management Division
For large, complex projects, HECO assigns specific managers from their Project Management Division. The Project Management Division is a separate division of the Engineering department. It is led by a Director, and is comprised of 4 project managers, 1 administrator and 1 project analyst. The Project Management group is assigned large projects, in excess of 2.5 million dollars. These projects often have community implications and PUC permitting requirements that are the responsibility of the project managers.
Note: this group’s responsibility is not limited to underground projects. They will manage all larger projects on behalf of HECO.
Process
C&M Planning
The C&M Planning group works closely with C&M supervisors to plan and schedule work. Responsibilities include (partial list):
-
Receiving and logging job packages from Engineering (System Reinforcement work, for example), CID (new service work), or System Operations (a Repair Order, for example),
-
Preparing a “Field Check” package for the supervisors to assist them in field checking a job and estimating resource requirements,
-
Setting up the work packages[1] for the crews,
-
Creating work packages for planned maintenance activity,
-
Ordering outside services such as traffic control, excavations services, etc,
-
Submitting " holdoffs", which is part of HECO’s feeder clearance process,
-
Assigning resources to projects, considering training, vacation, and other issues that affect resource availability,
-
Prioritizing and scheduling projects.
C&M Planners work in the office, and rarely go into the field. They work collaboratively with Field supervisors, who do spend most of their time in the field.
The C&M Planning group’s roles and responsibilities are more developed for overhead work support. Their roles and responsibilities with respect to Underground are still under development. For example, the C&M Planning group does not schedule programmatic maintenance of underground facilities.
Project Management Division
The Project Management Division is comprised of Project Managers who work collaboratively with C&M, Asset Management, and Engineering to develop a project scope, schedule and budget, as well as manage larger projects. They will form project teams, prepare all required PUC permitting, track project progress, and prepare and conduct presentations of project status to senior management.
The Project Management group also serves as a project management knowledge center for HECO, staying current with Project management techniques (from the PM Institute, for example) and offering internal project management training.
HECO has done a good job of defining this group’s role, and integrating it with the rest of the organization in a manner that is clear, with well defined roles and responsibilities.
Technology
HECO is currently using a HECO developed system to plan and schedule their work.
HECO is currently evaluating eMESA, a work management and scheduling tool by DTS, Inc. They ultimately plan to use this software as a front end to their Ellipse Maintenance Management software.
HECO project managers are using Microsoft Project and Chart Pro, both industry standard software products for establishing work breakdown structures and managing and reporting progress of projects.
[1] HECO Work packages include all of the required forms associated with a project including engineering drawings, bills of material, work orders, other forms, such as a “node form” used to capture and enter transformer information in a data base, etc.
7.3.14.12 - National Grid
Construction & Contracting
Project Management
People
Complex projects can involve interaction between many organizational groups. National Grid has implemented formalized project management procedures that define how these groups shall interact to ensure successful completion of projects. Procedures and roles are outlined in the Project Management Playbook - a document designed to standardize operations and roles of various personnel in complex collaborative projects.
The people involved, and procedures to be followed, differ depending on the scope of the project. For large and medium complexity projects (generally over $1 million cost and/or of high complexity), National Grid assigns a project manager. The project manager is responsible for the overall process, with individual responsibilities laid out in the Project Management Playbook. There are 13 project managers company-wide focused on distribution and sub-transmission projects. Network projects represent a very small percentage of the overall work managed by these project managers.
Smaller projects, under $1 million, are managed by front line supervisors and a specific project manager is not generally assigned. Additionally, the procedures to be followed can be much simpler than for complex projects. To address these smaller projects, National Grid has a customer order fulfillment group. This group shepherds smaller projects through the process, addressing things such as cost estimating, obtaining easements, and assuring proper work package close out.
The Portfolio Management Office (PMO) is responsible for managing the aggregate work plan, or portfolio of all projects/programs competing for common resources and dollars. This group provides both quantitative analysis and governance oversight for projects and programs in the portfolio. The PMO provides scheduling, finance, and resource availability through periodic measurement, monitoring, and controls. The PMO sets individual project fiscal year spending limits and progress targets, established within fiscal year budget constraints. The PMO supports project and portfolio management tools, including a scheduling tool, a “lessons learned” database, and other project management information systems to standardize processes leading to greater efficiency. The PMO governs substation capital projects, sub-transmission projects, programs such as feeder hardening, Department of Transportation (DOT) projects, distribution line capital projects, reliability enhancement programs, equipment, facilities, and operations & maintenance programs.
A project is initiated by a person or organization denoted as the Project Sponsor. The Project Sponsor brings a proposal to the Portfolio Management Office which helps develop an initial assessment of resource requirements, and a project team is appointed. At this stage a project’s complexity level is determined, which then determines how other personnel are brought onto the Project Team and how resources are allocated. The Project Sponsor is responsible for documenting the initial project plan, statement of work, schedule (or needed date), objectives, and a conceptual estimate.
A Project Manager and Project Team are assigned in the initiation phase by the Project Sponsor and the PMO. The Project Manager is the person ultimately accountable for all stages of the process and sees the project from conceptualization through to completion. Project managers are assigned only for large and medium complexity projects (e.g., over $1 million); for smaller projects, front line supervisors can be assigned the role and the process simplified considerably.
The Project Team consists of all personnel required for the project, and may include engineering and design, construction, operations, asset management, purchasing, permitting, various other team members, and functional managers. They are identified during the planning and initiation stages of the project.
Process
Project Management Playbook
To help deliver capital projects on time, on budget, and within scope and quality requirements, National Grid has implemented a Project Management Playbook (PMP) which ensures collaborative project management processes, procedures and measurements are embedded and embraced universally by the organization. The PMP describes the overall structure of procedures in the project management process. The lifecycle of a project has several distinct phases (described below), and major functions are performed in each phase. Procedures describe detailed step-by-step actions and associated roles and responsibilities for accomplishing these functions. These procedures provide guidelines related to defining, authorizing, accomplishing, and controlling project objectives, monitoring and controlling risks, and obtaining customer satisfaction. They help with planning and controlling work scope, cost, schedule, and quality. In conjunction with procedures for Engineering, Construction, Operations, Permitting and Licensing, Corporate Finance, Plant Accounting, Purchasing, and others, they provide the framework for end to end Project Management.
National Grid uses a portfolio management process to measure, monitor, and control the entire portfolio of projects/programs through all steps of the project’s life cycle. This is accomplished by weighing individual projects against all other projects and given priorities for resources, material, and budget allocation, while considering general constraints including “Ready for Load” dates, available resources, fiscal year budget spending limits and regulatory commitments. While the Portfolio Management Office (PMO) is responsible for monitoring and governing the Project Management Process, individual Project Managers retain full ownership and accountability for their individual projects.
At each stage of a project, individuals are assigned tasks according to procedures in the Project Management Playbook using special “RACI” charts, which define their responsibilities and deliverables, at each project stage. RACI is a labeling system that defines individual and organizational roles according to the following scheme:
-
R: Responsible individual(s) actually perform the activities or are responsible for action/implementation; and responsibility can be shared.
-
A: Accountable individuals are ultimately in charge, are responsible for assigning the degrees of responsibility to “R” individuals, and have yes / no authority and veto power. Only a single “A” can be assigned to a single function.
-
C: Consulted individual(s) are those who must be consulted prior to any final decision or action. Their feedback may be factored into the process, so “C” communication is considered two-way.
-
I: Informed individual(s) need to be informed after a decision or action is taken. They provide no feedback; communication with these individuals is, procedurally speaking, one-way.
National Grid has defined specific project phases for high and mid-complexity projects. In order to streamline day to day operations, simpler projects go through the same phases but with fewer procedural requirements, also described in the PMP. To aid the overall flow of these processes, RACI charts in the project management playbook are used to define the hierarchy and relationships between various project team members, codifying standard practices to ensure optimal collaboration between team members using clearly defined standards. The project phases include:
Phase 0: Project Identification.
An individual, or organization, proposes a project, and an investment estimate with an initial resource plan developed with the Portfolio Management Office (PMO). A project team is appointed to evaluate various options and to complete a conceptual engineering report for the preferred option. A project scope, schedule, and budget are developed. A Preliminary Works Sanction (PWS) paper or Strategy Paper is written by the Project Sponsor. The paper documents the initial project plan, statement of work, schedule (or need date), objectives and conceptual estimate. The PWS/Strategy is then approved by management - this approval authorizes more detailed engineering. The project then gets put into the five (5) year business plan, which is approved by Investment Management.
Phase 1: Project Initiation.
Project Team members are assigned, a Project File is created, and the project is kicked off.
Phase 2: Project Planning.
Key project parameters of cost, scope, schedule, and quantity are further developed. In the Preliminary Engineering step, project Cost, Schedule, Scope, and Quality (CSSQ) is base lined to establish performance metrics. In Final Engineering and Design, detailed engineering occurs, final design drawings are issued, and materials are ordered.
Phase 3: Project Execution.
The Project is constructed in field, tested, commissioned and turned over to Operations when it is ready to be put into service. Project Execution procedure is done in compliance with the National Grid Investment/Construction Playbook which discusses common control principles for delivering capital investments.
Phase 4: Project Monitoring and Control
The project is evaluated against project baseline for variances. Monitor and control functions must occur throughout entire life cycle of project for successful management. In this step, project risks are monitored, CSSQ requirements are controlled, and project execution is managed. During this step, project spending is compared to the original baseline cost plan and Delegation of Authority (DOA) requirements and updated for the monthly Resource Allocation Committee (RAC) meetings.
Phase 5: Project closeout
The project team assesses outcome of project and performance of project team. Best practices and lessons learned are captured for future projects. The project is accepted by the Project Sponsor and project is administratively and contractually closed out.
Technology
Project management procedures are outlined in the Project Management Playbook, which describes procedures for projects of varying complexity levels (each one given a numerical level designator). Other information systems and tools are maintained by the Portfolio Management Office (PMO).
The Project Management Playbook (PMP) describes people, processes, and responsibilities. For each step, the PMP includes a chapter describing the sequence and description of activities to be executed to complete each phase of project delivery. Activities along the main process flow path are indicated with Directorys. Each task is numbered and a brief description of the task is displayed, and task descriptions are expanded within each step of the procedure. Tasks are color coded to correspond with the principal owner, indicated by the RACI charts.
Primavera ( http://www.oracle.com/us/corporate/Acquisitions/primavera/index.html ) is a project portfolio management tool to help “optimize resources and the supply chain, reduce costs, manage changes, meet delivery dates, and ultimately make better decisions, all by using real-time data” It is used for project scheduling and department resource loading.
Severn Trent Operational Resource Management System (STORMS) is National Grid’s work management system developed by Worksuite. The work management system includes tools to initiate, design, estimate, assign, schedule, report time/vehicle use, and close mainly distribution line work.
Success Enterprise is an estimating and cost management suite, allowing multi-user collaboration and real-time evaluation of cost estimates based on actual costs and statistical analysis.
PeopleSoft from Oracle is a large enterprise information management suite. National Grid uses it for tasks including project status reporting, initiating purchase orders and requests for materials from stores.
A database of lessons learned and actual project costs is maintained to assist with future planning and project management needs. This is maintained by the Portfolio Management Office.
7.3.14.13 - PG&E
Construction & Contracting
Project Management
People
At PG&E, project management of network projects is the responsibility of the supervisors within the M&C Electric Network group. In addition, PG&E has a Project Coordinator who works closely with the supervisors and provides administrative support.
In addition, the planning engineer gets involved in supporting network projects as required, and is actively involved with all network projects.
7.3.14.14 - Portland General Electric
Construction & Contracting
Project Management
People
In the CORE, many projects are customer-driven new construction projects that draw together experts from many areas of the company. Project management is an important process coordinating the various activities required from initial planning to project completion.
Project Management Office (PMO) Group: The larger, more complex projects are managed by the PMO. This group, which is a part of the Transmission and Distribution (T&D) organization, is involved in the early stages of coordinating with System Planningand takes responsibility for projects once the Planning Engineers have developed a shortlist of solutions. Because of an increasing number of more complex projects, PGE is expanding its PMO Group.
Every large project requires expertise from various parts of the company, and the PMO coordinates the activities of these various subject matter experts (SMEs). The project team will have a defined Project Manager and a Materials Coordinator. The Corporate Capital Review Group and Corporate Risk Assessment will review most projects.
For network/CORE projects, the T&D Project Manager working in the PMO Group serves as the Project Manager. The manager has responsibility for all projects in the CORE, including large complex projects, such as the Marquam Substation project. The present manager has a Project Management Professional (PMP) certification and project management experience with another utility. The PMP designation is not necessarily a requirement for T&D Project Managers.
PGE is bringing a number of additional organizational functions into the PMO, making it easier to manage the overall expenses and cash flow for transmission and distribution. An external consultant is guiding the expansion of the PMO. Previously, PGE’s portfolio management group consisted of four individuals with responsibility for managing projects, but the new structure will improve the division of labor and enhance accountability. The expanded PMO will improve processes for communicating the budgetary forecasts needed for corporate planning. A new office location will provide a space for project meetings and ensure that discussions provide clearer details of ongoing project and risk status. As the PMO Group takes on more projects, it will receive additional human resources.
PGE also intends to employ a portfolio manager, who will collate and assess all ongoing projects. The portfolio manager will evaluate the inherent risks and determine whether a project should be accelerated or slowed down.
Service & Design at the Portland Service Center (PSC): Service & Design has a project management role associated with customer-generated new projects or remodeling projects, including work in the downtown network. The supervisor for Service & Design reports to the Service & Design Manager, who is a peer of the Distribution Engineering and T&D Standards manager. Both of these positions report to the General Manager of Engineering & Design and directly to the vice president. A “Mapper/Designer” reports to the Supervisor of Service & Design and provides the computer-aided design (CAD), geographic information system (GIS), and design service.Two Field Inspectors work for the Service & Design organization, and one specializes in the network.
Service & Design Project Managers (SDPMs): SDPMs, who also report to the supervisor for Service & Design, work almost exclusively on customer-driven projects, such as customer service requests, and liaise with new customers in preparing designs. SDPMs oversee projects from first contact with the customer to the final completion, and coordinate and manage construction designs and customer connections to ensure full compliance. At present, two SDPMs cover the network.
Ideally, a SDPM has an associate degree or a combination of electrical engineering experience and appropriate education. SDPMs should have proven project management skills and understand PGE and industry standards and practices. They should also have knowledge of the National Electrical Safety Code (NESC) and National Electrical Code (NEC), as well as the ability to use or learn the relevant information technology (IT) systems. PGE prefers to have a selection of SDPMs with a diverse range of experience and backgrounds, so the position does not necessarily require a four-year engineering degree. The managers can be degreed engineers, electricians, service coordinators, and/or designers.
SDPMs work on both CORE and non-CORE projects. This allocation of work ensures that expertise is distributed and maintained across departmental and regional boundaries.
Distribution/Network Engineers: For non-customer generated work, the Distribution Engineers may also have formal project management responsibility. The Distribution Engineers are not based in the PSC or CORE group but work very closely with these groups through the entire project life cycle. The Eastern District Central Supervisor, who reports to the Manager of Distribution and T&D Standards, oversees these engineers. The underground Distribution Engineers are qualified electrical engineers. When needed, PGE hires civil engineers to perform certain planning tasks.
The new network substation project (the Marquam project) is an example in which the Network Engineers have elevated project management responsibility, as they have the expertise with network systems to effectively provide leadership for this effort. As a non-customer-generated project, this falls outside the responsibility of SDPMs. As a large complex project, this project also has PMO oversight.
Contract Services and Inspection (CS&I): At PGE, management of contractors is the responsibility of the CS&I department. Five Construction Managers work in the CS&I group provide project management support to contracted projects, and inspect any contractor work on PGE-owned infrastructure. For larger projects, PGE may outsource inspections to external experts.
Key Customer Manager (KCM): PGE has nine KCMs reporting to Manager of the Business Group. Generally, they are geographically distributed, with three on the west side, one downtown, one in Salem, three on the east side, and one acting as a rover. KCMs liaise with large customers and communicate their needs.
Process
The project management process is in transition at PGE.
The T&D planning group, in close cooperation with the Network Engineers for network work, identifies the need for a project and undertakes studies to identify multiple potential solutions before choosing the lowest cost, least risk solution and proceeding. Historically, the project schedule and estimate were developed, and approval for the funding was obtained before the project was forwarded to the PMO Group.
In future, to streamline the process, engineering will involve the PMO earlier in the process during the development of the cost estimate and schedule, before sending the project to the Corporate Capital Review Group for funding approval. With the new process, under PMO leadership, more engineering analysis will be undertaken before seeking funding approval. This will resolve one of the challenges with the historic approach, in which costs were estimated and approved using very little engineering analysis, and actual costs often escalated after approval.
The PMO will assemble a project team that includes representatives with a range of expertise, depending upon the type and scope of the project. The assembled team will visit the project site(s) and determine the scope before submitting a project for approval.
One concern with the new process is that engineers will invest time in performing preliminary studies. In addition, if the project is not approved, the upfront time commitment to prepare the estimate could waste resources. Therefore, it is important to promote better synergy between engineering and the PMO to streamline the project management process leading up to approval. Once a project is approved, the PMO will escalate the process and work with the team created during the estimating and scheduling phase of the project to plan, engineer, permit, and construct the project.
For internally-driven projects, the PMO oversees the project development, while for externally-driven projects, SDPMs usually oversee the project. For external projects, the PMO is only involved for large projects with complex coordination requirements. Depending upon the makeup of the project team, the engineering group may control the entire project and only involve the PMO if concerns arise, such as a risk of missing deadlines. For other projects, the PMO may be more intimately involved.
Within the CORE, the PMO is only involved with large projects that interface with the transmission system, such as the new network substation project. The PMO does not deal directly with equipment and material vendors, which is the responsibility of the materials coordinator. However, the PMO is heavily involved with scheduling and will offer an opinion about the resources required.
In general, no official processes that determine whether a project or task should use internal or external resources exist because this depends upon the available internal resources, and the preferences of senior engineers and Project Managers. For example, most substation work is now contracted out due to limited resources. On the distribution system, many of the tasks require local knowledge, workmanship, and expertise, so PGE is more comfortable with internal crews undertaking the work.
Project Scheduling SharePoint: On a monthly basis, all the Project Managers maintain a schedule for their individual projects and post it to a SharePoint site. This site also has the following:
- Forecast cost information
- Actual cost information
- Brief report of monthly activities
- Link to the schedule
- Other commonly searched for documents are attached as well
This information is not commonly shared with other groups. Project Managers issue weekly reports to the PMO manager, which takes the form of a bulleted list of task updates. Shorter term studies are performed by T&D Planning Engineers, who share the results with stakeholders via SharePoint. These results are used to justify potential capital projects.
Customer-Generated Projects
For customer-requested projects, project management is the responsibility of the SDPMs. PGE follows a specific process/flow, which does not significantly differ for spot or grid networks. The process begins when a customer contacts the service coordination desk and receives a work order number, which allows system to track the process. The customer is assigned to one of the SDPMs, who will discuss the project with the customer and determine what information has been provided, what is still needed, and a timeline for any scheduled visits.
The SDPM coordinates with the distribution engineering team to determine exactly what is needed. Every new load is analyzed using PSSE, under the direct supervision of Distribution Engineers. The Distribution Engineers determine the electrical design needed to service the new load.
The distribution design is sent from distribution engineering to the SDPM, who determines the route that the conduit(s) must follow and where to install them. For example, if a distribution engineer specifies that they need to run two 500 MCM copper cables from a particular manhole to the building panel, the SDPM determines exactly how to accomplish that. Once the SDPM completes the design layout, Distribution Engineers confirm the electrical layout. The SDPM also works with the building architect(s) on the design/construction of any new vaults to assure that the designs meet PGE specifications.
PGE has created a one-note “database” containing all of the new or proposed construction in the downtown area. This information is tracked, with many of the items proposing and anticipating what could be needed. The information is shared with the manager of the SDPMs on an informal basis to track progress and check that the anticipated projects will actually occur. The database acts as a way to record and monitor information on different projects due to the large volume of projects across the downtown district.
Technology
PGE uses a number of key IT products to support project management. A brief description of these technologies and their capabilities are presented here.
Geographic Information System (GIS) – ESRI ArcGIS/Schneider ArcFM
PGE uses ArcFM GIS software for designing network layouts and creating a package with work details for relevant personnel. For construction, the system creates a list of materials that can be shared with the relevant people.
ArcFM uses open-source and component object model (COM) architecture to support scalability, user configurability, and a geographical database. ArcFM includes tools that allow network editing, GIS asset management, design integration, and work management.
Maximo for Utilities 7.5
IBM’s Maximo for Utilities 7.5 is a work management system that allows users to create work estimates and manage field crews. Maximo can integrate with a number of systems, including fixed-asset accounting, mobile workforce management solutions, and graphical design systems. The Maximo Spatial system is compatible with map-based interfaces, such as ESRI ArcGIS, and follows J2EE standards [1].
Maximo for Utilities supports operations across a number of areas:
- Estimating compatible units (CUs)
- Managing field crews
- Tracking skills and certifications
- Integrated fixed-asset accounting
- Supporting field workforce management
- Graphic design functionality
- GIS integration
- Using Gantt views for analyzing work orders
A CU library helps planners and designers estimate CUs when creating a project [2].
Asset and Resource Management (ARM) Field Manager: ARM Field Manager is a mobile platform that allows crews to access and report data for all work, including customer service information, emergency situation reports, procedure-based maintenance work, and CU-based construction work.
- T. Saunders, J. Souto Maior, and V. Garmatz. “IBM Maximo for Utilities.” IBM, 2012. ftp://ftp.software.ibm.com/software/tivoli_support/misc/STE/2012_09_11_STE_Maximo_for_Utilities_Upgrade_Series_v4.pdf(accessed November 28, 2017).
- Maximo Adapter. PowerPlan, Atlanta, GA: 2017.https://powerplan.com/resources/minimize-risk-and-optimize-maximos-implementation-with-powerplan(accessed November 28, 2017).
7.3.14.15 - SCL - Seattle City Light
Construction & Contracting
Project Management
People
Bi-weekly Crew Coordination Meeting
SCL convenes a bi-weekly crew coordination meeting focused on the project status of each active network project. Meeting participants include the supervision and others from the network design group (engineers), civil crew representatives, electrical crew representatives (including crew leaders), and customer service representatives who interface with customers (for example, load additions).
Process
The Crew Coordination meeting is effectively used to manage network construction projects. Representatives review the project status of both civil and electrical projects and identify actions necessary for the projects to proceed. A report is used that shows critical project milestones such as the vault acceptance date and feeder in date. See Attachment E , for a sample network jobs project summary. Note that a similar form is used to track the progress of civil construction projects.
The meeting is also used to establish action items to identify network conditions that must be addressed. One example would be the identification of vault locations where ventilation is inadequate for the summer heating season. The group will identify an action plan to make contact with building owners to address these deficiencies.
This forum has been a highly effective project management tool for SCL in updating project status, resolving problems, and meeting project goals.
7.3.14.16 - Survey Results
Survey Results
Construction & Contracting
Project Management
Survey Questions taken from 2015 survey results - Summary Overview
Question 12: Within your company, what percentage of the work for each task is contracted?


Survey Questions taken from 2012 survey results - construction
Question 5.3 : If using contractors, what % of your total network electrical work is contracted?

Question 5.9 : Do you have a process for inspecting or testing incoming network materials?

Question 5.10 : If yes, what material is inspected or tested?

Survey Questions taken from 2009 survey results - construction
Question 5.4 : If using contractors, what % of your total network electrical work is contracted? (this question is 5.3 in the 2012 survey)

Question 5.10 : Do you have a process for inspecting or testing incoming network materials? ( This question is 5.9 in the 2012 survey)

Question 5.13 : Do you utilize work management software to assist in assigning resources, scheduling, and managing the execution of network projects?

Question 5.14 : What work management system are you using?

7.3.15 - Separable Connector Installation
7.3.15.1 - Duke Energy Florida
Construction
Separable Connector Installation
Technology
Duke Energy Florida’s cable design calls for the use of T-bodies (600A separable connectors) for both straight splices and Y and H splices, so that cables can be easily separated for fault locating, maintenance and for future system enhancements. Note that the center plugs that were historically used in the T-bodies were designed with an exposed metal ring which was prone to deterioration / corrosion with age and with prolonged submersion in water. See Cable Replacement for more information on Duke Energy Florida’s formal primary cable replacement program, which includes replacement of older style T-bodies.
Network transformers are suppled using ESNA style (separable) connections.
7.3.15.2 - HECO - The Hawaiian Electric Company
Construction & Contracting
Separable Connector Installation
People
HECO Cable Splicers install separable connector installations, including 600 A “T” bodies and 200 A Elbows.
Process
HECO Cable Splicers demonstrated proper installation procedures of separable connectors systems, including careful, correct preparation and installation.
See Attachment I for a diagram that shows the proper cable jacket and insulation cut back dimensions as well as racking position for 1000A and 500A 15kV cables.
The photographs below depict HECO Cable Splicers preparing cable for and installing a 600 A T Body.

Figure 1:
Measuring and Cutting the Cable Insulation

Figure 2:
Cable Cutter

Figure 3:
Shaping the edge

Figure 4:
Shaping cutter

Figure 5:
Preparation – Installing a T Body

Figure 6:
Preparation – Installing a T Body

Figure 7:
Preparation – Installing a T Body

Figure 8:
Preparation – Installing a T Body

Figure 9:
Preparation – Installing a T Body

Figure 10:
Press

Figure 11:
Preparation – Installing a T Body

Figure 12:
Preparation – Installing a T Body

Figure 13:
Preparation – Installing a T Body

Figure 14:
Preparation – Installing a T Body

Figure 15:
Preparation – Installing a T Body

Figure 16:
Preparation – Installing a T Body

Figure 17:
Preparation – Installing a T Body

Figure 18:
Preparation – Installing a T Body

Figure 19:
Preparation – Installing a T Body

Figure 20:
Preparation – Installing a T Body

Figure 21:
Preparation – Installing a T Body - Using Spanner Wrench

Figure 22:
Preparation – Installing a T Body

Figure 23:
Preparation – Installing a T Body

Figure 24:
Preparation – Installing a T Body
Technology
Some of the tools used to install a “T” body are depicted in the photographs above.
7.3.15.3 - Survey Results
Survey Results
Construction & Contracting
Separable Connector Installation
Survey Questions taken from 2009 survey results - Operations
Question 7.17 : Do you use separable connectors (such as “T” Bodies and elbows) in your network system?


Question 7.18 : Have you experienced failures with these connectors / connector systems (such as 600A T - bodies)?

Question 7.19 : If Yes, please rank the primary causes of the failures you’ve experienced.

7.3.16 - Splicing
7.3.16.1 - AEP - Ohio
Construction & Contracting
Splicing
People
Electrical work on the AEP Ohio network, including cable splicing, is performed by unionized Network Mechanics who report to Network Crew Supervisors and work out of a Service Center. Project work orders, repairs, and maintenance are scheduled and dispatched from this center.
The AEP Ohio Network Mechanic is a “jack of all trades” position, performing all electrical construction and maintenance in the network including cable splicing. Network Mechanics are members of the union, and are categorized as D, C, B, or A-level grades, with Network Mechanic “A” being the highest rank.
Process
AEP Ohio has had generally good performance with the performance of its splices. The company presently uses both cold shrink and heat shrink splice kits, but are moving to the use of cold shrink kits. They have found that hand-taped splices that were made from the 1960s and 1970s are beginning to fail, and that when they do, the failures are sometimes catastrophic.
AEP Ohio uses lead cables, but is transitioning to EPR insulated cable in the network (see Figures 1 and 2). Thus, Network Mechanics rarely prepare lead-lead joints. Most work with lead is in preparing transition joints, from lead to EPR.

Figure 1:
Lead cable joints

Figure 2:
Cable Joints - EPR, using 600-A ESNA T-bodies. Note the inserts for spiking cable
Technology
Smallworld is used to record information about cable installations. The location of cable joints is not recorded.
AEP Ohio does infrared (IR) inspection of cable joints. When the company initiated the program, personnel identified problem areas (hot spots) and addressed the critical locations. This inspection identified areas where splices were prepared improperly. AEP experts report that it took about four years for them to identify and remedy the problems, and that now they rarely identify failing joint locations (detect arcing) using IR.
7.3.16.2 - Ameren Missouri
Construction & Contracting
Splicing
People
Organizationally, Ameren Missouri Cable Splicers who work in the St. Louis network reside within the Underground Construction department. The Underground Construction department, led by a Construction Superintendent, is part of the Underground Division. The Underground Construction Group is responsible for all of the conventional (manhole and conduit system) underground in the Division, and all work with larger cable (500 Kcmil and above).
The Underground Construction department consists of Cable Splicers, Construction Mechanics, and System Utility Workers. Cable Splicers and Construction Mechanics are journeymen positions. Cable Splicers perform work with the electrical infrastructure such as making up joints and terminations, including preparing lead splices. Construction Mechanics perform the civil aspects of the work. System Utility Workers serve as helpers to the other two positions, and perform duties such as cable pulling and manhole cleaning.
Note that at the time of the practices immersion, Ameren Missouri was implementing a new position, called the System Journeyman, which combines the duties of Cable Splicers and Construction Mechanics.
Cable Splicer and System Journeyman apprentices receive formal training in preparing joints at the Dorsett Training center as part of the apprentice program. This is supplemented by on-the-job exposure to working with both lead and solid dielectric cables and joints.
This formal training program associated with underground construction worker progression is relatively recent. In the past, there was no formal journeyman program for underground, with all training associated with underground performed in-house, within the department. More recently, Ameren Missouri has implemented a formal program for Cable Splicers and for System Journeymen (a new position at Ameren Missouri than combines the duties of the Cable Splicer and Construction Mechanic, and thus has splicing responsibility), with the training, testing and proficiency demonstration conducted at the Dorsett training facility. The program is a 30 month program, and includes things such as electrical principles and theory, as well as instruction on splice preparation.
Process
Ameren Missouri Cable Splicers prepare lead joints, solid dielectric (EPR - EPR) joints, and transition joints.
Ameren Missouri management actively works with Cable Splicers to reinforce splicing skills. Construction Supervisors will provide work assignments that provide the required on – the - job training to keep skills sharp. They will periodically reinforce proper techniques by showing training videos for proper splice preparation on inclement weather days.
Standards engineers also contribute to the skills reinforcement. One example of this was a decision to require a small stainless steel wire brush to be included in the splice kit provided by the manufacturer. This assures that the brush is available to the Cable Splicer to wire brush an aluminum connection to assure the splice is sound.
Technology
Ameren Missouri uses heat shrink joints. At the time of the practices immersion, they were considering the use of cold shrink joints in certain applications, such as a trifurcating splice. They are considering the cold shrink technology because of experience with failed heat shrink splices due to improper heating and shrinking of the sleeve.

Figure 1:
Preparing a Heat Shrink Joint

Figure 2:
Preparing a Heat Shrink Joint
Ameren Missouri is also considering moving from compression to shear bolted connections. This potential change is being driven by experience with failed splices because of installation issues associated with compression connections such as using the wrong dies, wrong materials, or inadvertent cutting of cable strands. The bolted connector has a range connection, and thus addresses some of these issues. The cable splicer can rotate the shear bolt connection so the bolts are facing the worker, solving one of the challenges of the compression connection - getting the large crimping tool oriented correctly. The connectors will have solid stops, and can thus be used in a transition joint.
7.3.16.3 - CEI - The Illuminating Company
Construction & Contracting
Splicing
People
CEI Underground Electricians perform work on lead cables, and prepare transition splices.
Process
CEI has made a decision not to expand the lead cable system. Normally, they no longer will prepare a lead splice (wipe a splice). If they need to make a repair to a failed section of lead cable, they will cut out the damaged section and put in two transition splices with a section of extrudable cable (EPR) to replace the damage section.
Very rarely, in situations where they don’t have room to make the transition, they will prepare a lead splice.
Technology
CEI tracks the location of transition splices on their feeder prints. They are not tracking who prepared the splice.
7.3.16.4 - CenterPoint Energy
Construction & Contracting
Splicing
People
Cable splicing at CenterPoint is performed by the Cable Splicers who work in the Cable Groups of the Major Underground department. Major Underground has two Cable groups: the “Cable A” group, focused in downtown Houston, and the “Cable B” group, focused in South Houston, Spring Branch and Greenspoint.
Process
CenterPoint uses hand taped splices. This is true of both splices between two sections of like cable, and transition splices between cable sections of different types. They have experimented with modular splicing designs such as the splicing systems offered by Raychem and 3M, but have found that that the installation workmanship had to be almost perfect for these types of splices to be reliable. Further, CenterPoint has done laboratory testing that shows that their hand taped approach to splicing is more reliable.
(See Failure Analysis (Splice) )
CenterPoint’s experience with hand taped splices is that they are very reliable. CenterPoint management reports that they have experienced very few splice failures. When they experience a splice failure, they perform an analysis on each failed splice. If they experience a splice failure in the first two years of its life, the cause is usually due to a workmanship issue.
One of their challenges is that it is becoming difficult to find vendors who can supply the molten metal used to make the splices.
See the video below
for videos of the CenterPoint Hand Taped Splice procedure.
Below are various photographs of the splicing procedure.

Figure 1:
Preparing the splice

Figure 2:
Preparing the splice

Figure 3:
Preparing the splice

Figure 4:
Preparing the splice

Figure 5:
Melting the lead

Figure 6:
Melting the lead

Figure 7:
Lowering the molten lead"

Figure 8:
Pouring the lead

Figure 9:
Preparing the splice

Figure 10:
Preparing the splice

Figure 11:
Preparing the splice

Figure 12:
Preparing the splice

Figure 13:
Heating the Epoxy filler

Figure 14:
Loading the Epoxy filler

Figure 15:
Lowering the Epoxy filler

Figure 16:
Injecting the epoxy filler
CenterPoint does not test PILC cable for moisture content before splicing,
Technology
CenterPoint is entering facilities information into a GIS system (ARC Map); however, this system is not yet being used to produce underground maps because of the congestion on GIS produced maps.
CenterPoint has the ability to track the location of splices in their GIS system.
7.3.16.5 - Con Edison - Consolidated Edison
Construction & Contracting
Splicing
People
Con Edison distinguishes between Cable Splicers who perform splicing, and Installation and Apparatus (I & A) Mechanics who install and maintain network equipment, perform secondary splicing, and make customer connections. Con Edison further delineates tasks through its organization, with separate groups performing splicing tasks, I&A tasks, cable pulling, fault locating, and field inspections.
The Underground Group is comprised of Cable Splicers, who splice cable of all voltages.
The Installation and Apparatus (I & A) Group installs and maintains network equipment, including transformers and network protectors. Within I&A, in Manhattan, there is a services group dedicated to connecting customers to the distribution network. In other locations, the services group may sit in a different part of the organization. This group does the splicing on the secondary system and deals with customer connection issues.
Process
Con Edison has a process in place to promote the ongoing quality of splices by assigning personal accountability for the performance of the splice to the individual Splicer who prepared it.
In the past, when working with lead splices, Splicers permanently stamped (imprinted) their initials directly into the lead of the splice as a way of tracking who prepared the splice. Newer splices are bar coded with information about the splice including the name of the Splicer. The bar code is produced from a splice ticket that contains information about the splice, including the name of the Splicer.
Splicers are responsible for the performance of their splice for five years after the installation. Con Edison selected five years, because the utility has found splice defects due to workmanship issues usually occur within the first five years after a splice installation.
If problems are encountered with a particular Splicer’s workmanship, depending on the circumstances, Con Edison may elect to send the Splicer back to splicer school, or administer formal discipline steps (warning, letter in the file, etc.).
Technology
Con Edison provides its employees with the specialized tools and equipment that they need to do their jobs, including trucks outfitted for the different types of work that they perform. Employees stated that they believed Con Edison provides them with good quality trucks, appointed with the equipment they need to perform their work. People demonstrated a sense of pride in their trucks and associated equipment.
Splicers use a specially outfitted van, rather than the box truck used by , because they have less equipment and fewer tools than I&A Mechanics.
7.3.16.6 - Duke Energy Florida
Construction
Splicing
People
Organizationally, the Duke Energy Florida resources that construct and maintain the urban underground and network infrastructure fall within the Network Group which is part of the Construction and Maintenance Organization. More broadly, Duke Energy Florida’s construction and maintenance organization is divided into regions, with both Clearwater and St. Petersburg falling within their South Coastal Region. The Construction and Maintenance organization for the South Coastal Region is led by a General Manager. The region consists of various Operation Centers, organized either geographically or functionally throughout the Region.
The Network Group is organized functionally, and has responsibility for construction, maintain and operating all urban underground infrastructure (ducted manhole systems), both network and non-network, in both Clearwater and St. Petersburg. The Network Group is led by a supervisor who reports to the Region General Manager. The group consists of ten craft workers, five Electric Apprentices and five Network Specialists (the journey worker position), all part of the Network Specialist job family.
The Network Specialist is a jack-of-all-trades, position, responsible for all facets of UG work, including preparation of splices. Both Network Specialists and Electrician Apprentices can prepare splices, though Electrician Apprentices are limited to preparing only cold shrink joints.
Process
Duke Energy Florida has historically used push on and crimp splices, but are looking to transition to a different splice technology due to the frequency of workmanship issues that have arisen with this type of splice connection. They have been evaluating cold shrink splice kits and shear bolt connections (see Figures 1 and 2). Cold shrink splice kits provide better alignment of conductors between joined cables when compared with push on splices. Shear bolt connections have the advantage of removing workmanship problems as the bolts will snap off at the correct tension, so there is never too little or too much compression on the cable in the splice. Heat shrink joints are also used within Duke Energy Florida, but only for submarine cables.

Figure 1:
Shear Bolt Connector

Figure 2:
Heat shrink joint with shear bolt connection (submersible application)
7.3.16.7 - Duke Energy Ohio
Construction & Contracting
Splicing
People
Cable splicing at Duke Energy Ohio is performed by Cable Splicers within the Dana Avenue underground group.
Duke has had good performance from their splices. They attribute this to the training and continuing education they provide to Cable Splicers. Each of their Cable Splicers was certified through Tyco (Raychem), their primary splice provider. Each Cable Splicer receives periodic retraining.
Process
Duke Energy Ohio uses mostly heat shrink splices. They have opted for heat shrink versus cold shrink splices because of the smaller size of the heat shrink splice, and the limited shelf life of cold shrink splices. About 60-70% of the connectors they use in their splices are shear bolt connectors.
According to Duke, the heat shrink splices have performed very well for them. Also, transition splices have performed well.
Duke Energy Ohio will perform a forensic analysis on selected joint failures. This analysis is normally performed by an independent laboratory.
Technology
Duke Energy Ohio uses heat shrink splices, mostly Tyco products.

Figure 1:
15kv Splice
7.3.16.8 - Energex
Construction & Contracting
Splicing
People
The Journeyman position for working with cable systems at Energex, including cable splicing and cable pulling is the cable jointer position. Employees move through the jointer apprenticeship program in about three and one half years. The apprenticeship includes formal training, testing, on the job training, and time in grade. At the conclusion of the apprenticeship, persons in the program must still must complete a “basket of skills” required by the electrical office. These skills are over and above the skills that are taught as part of the apprenticeship, but necessary for the employee to be a fully qualified jointer. Employees complete this basket of skills in the first 18 months after apprenticeship. Consequently, it takes 5-6 years in total before an employee is a fully qualified to run a job.
All jointers within the underground group are trained for CBD cable joining, operating in confined spaces, safe work practices in pits, and both high-voltage and low-voltage cabling. Jointers are trained in both Australian Qualifications Framework (AQF) and network-specific tasks before working on CBD underground splicing.
( See the Training section in this report. )
Process
Jointers work with cable and cable accessory installation and maintenance, including cable pulling, splice preparation, and cable replacement.
Technology
Energex utilizes a shear bolt connection, rather than a compression type connection for splicing, when preparing an 11 kV cable joint. They implemented the use of shear bolt technology for improved reliability.
7.3.16.9 - ESB Networks
Construction & Contracting
Splicing
People
Cable splicing at ESB Networks is performed by Network Technicians, the journey worker position. The Network Technician is a multi-faceted position, performing both line work, such as building pole lines, and electrical work, such as making connections at a transformer. Network Technicians work on all voltages from LV through transmission voltages (110kV). Note that ESB Networks created the Network Technician position in the 1990s by combining a former Line Worker position and Electrician position.
Work specialization for Network Technicians is by assignment. In Dublin, where the majority of the distribution infrastructure is underground, Network Technicians work mainly as cable jointers, installing underground cables and accessories. ESB Networks rotates Network Technician work assignments as business needs require.
ESB Networks has a four-year apprentice training program for attaining the journeyman Network Technician position.
Network Technicians who worked as cable jointers work closely with both the Training group and the Asset Management groups at ESB Networks. Network Technicians readily bring information about problems with particular cable joints back to these groups.
The Training and Asset Management groups share the process of performing forensic analysis of failed joints and in preparing the failed component summary reports. Within both groups, ESB Networks has significant cable/cable accessory expertise. Both groups work closely with Network Technicians to ensure that they understand the science of cable joints and have an appreciation for the importance to long-term joint reliability of performing the proper steps associated with cable joint preparation.
Process
ESB Networks’ Network Technicians prepare lead joints, pre-molded solid dielectric (XLPE) joints, and transition joints. For most applications, they have standardized on cold shrink joint technology.
ESB Networks has performed significant testing of splices/joints, including variability tests and partial discharge tests. ESB Networks uses this information to reinforce the splicing training provided to Network Technicians.
ESB Networks has established a strong working relationship with cable joint manufacturers, and noted that the company has worked with cable manufacturers to include ESB Networks specific instructions as part of the cable splice kits they provide.
Technology
ESB Networks uses XLPE insulated round aluminum conductor cable with a durable jacket as a standard at MVs (10 kV in Dublin, 20 kV in outlying areas). For LV cable, ESB Networks utilizes sector-shaped solid aluminum cable. ESB Networks has standardized on cold shrink splice technology (both Raychem and 3M). ESB Networks had historically used heat shrink technology, but had experienced some performance issues in coastal areas, where salt contamination could affect improperly heat-shrinked terminations. The company had good experience with the integrity of cold shrink terminations in these coastal areas, and decided to standardize on cold shrink technology throughout their service territory (see Figure 1 and Figure 2).

Figure 1:
Cold shrink joint (tube and connector)

Figure 2:
Shear bolt connector
ESB Networks has worked closely with cable joint manufacturers to develop a splicing approach that minimizes opportunities for human error. Working with manufacturers, ESB Networks has developed a short splice design that does not require the use of mastic. The company has developed a custom splice kits with preparation instructions, including a custom “cut back” template included with each kit (see Figure 3). ESB Networks representatives indicated that it takes about 40 minutes to prepare a cold shrink joint (see Figure 4).

Figure 3:
ESB Networks cutback template

Figure 4:
Preparing a cable joint
7.3.16.10 - Georgia Power
Construction & Contracting
Splicing
People
Cable splicing is performed by the Cable Splicer craft at Georgia Power. The Cable Splicing crews report directly to Distribution Supervisors within the Network Construction group, part of Network Underground. The Network Construction group, led by a manager, performs network construction activity, and is comprised of Cable Splicers, Duct Line Mechanics and Test Technicians. There is also a crew in Savannah which reports to the Operation & Reliability Manager. That crew coordinates with the Construction group.
Cable Splicers receive formal training in preparing joints at the Georgia Power Atlanta training center as part of their progression to the journeyman position. Training consists of formal classroom training, including hands-on cable splicing, led by Senior Cable Splicers. “Practice” splices are examined and critiqued by two supervisors (See Figure 1 through Figure 4.). Formal classroom training consists of three weeks of training for every six-month training step. (See Job Progression in this report.) In performing on-the-job training (OJT), field work is supervised by Senior Cable Splicers and project supervisors (See Figure 5 through Figure 12.).

Figure 1:
Training facility - Lead Splice preparation area

Figure 2:
Training Facility – sample joints

Figure 3:
Training facility – cable termination practice area

Figure 4:
Training facility – tool bench

Figure 5:
Lead joint preparation – jobsite

Figure 6:
Lead joint preparation – jobsite

Figure 7:
Lead joint preparation – jobsite

Figure 8:
Lead joint preparation – jobsite

Figure 9:
Lead joint preparation – jobsite

Figure 10:
Lead joint preparation – jobsite

Figure 11:
Lead joint preparation – job site, note splicing truck

Figure 12:
Typical “bread truck” used by cable splicing crew
Process
The Georgia Power Network Underground Cable Splicers prepare lead joints, solid dielectric (EPR - EPR) joints, and transition joints. Cable Splicers routinely work with lead cables and accessories, and thus maintain their expertise.
Georgia Power is maintaining its lead cable infrastructure wherever possible. The engineers find it reliable, cost-effective and easier to work with in confined manholes and vaults where there is limited space for the larger accessories, such as Y-splices, required for EPR cables (See Figure 13.). For example, an EPR Y-splice at 20kV takes up virtually all the wall space in most manhole locations, limiting future expansion flexibility. Lead splices are currently more compact than EPR and fit more easily into the existing underground infrastructure’s manholes and conduits.
The Network Underground group is concerned that there is only one source for its lead cable, and it may become more aggressive in the future in replacing lead, particularly as smaller form-factor EPR becomes available.
GPC joint preparation
GPC joint preparation
GPC Join Preparation
Technology
In places where EPR or XLPE cable is used, Georgia Power has used heat-shrink splices and terminations for several years, but now prefers to use cold-shrink joints (the current standard). In the past the group has had some performance problems with heat shrink joints, finding failed joints due to improper heating and shrinking of the sleeve. Georgia Power is using both compression and shear bolt connections in preparing splices (See Figure 13 and Figure 14.).

Figure 13:
Mechanical connection for a Y splice – shear bolts connector

Figure 14:
Shear bolt connector – bolts designed to “shear” when desired torque is achieved
7.3.16.11 - HECO - The Hawaiian Electric Company
Construction & Contracting
Splicing
People
HECO Cable Splicers perform work on lead cables, and prepare transition splices.
Process
HECO has made a decision not to expand the lead cable system. If they need to make a repair to a failed section of lead cable, they will cut out the damaged section and put in two transition splices with a section of extrudable cable (XLPE) to replace the damage section.
Very rarely, in situations where they don’t have room to make the transition, they will prepare a lead splice.
Technology
HECO is using a hot shrink transition splice.
HECO does not track the location of transition splices on their maps. They are not tracking who prepared the splice.
7.3.16.12 - National Grid
Construction & Contracting
Splicing
People
Cable splicing in the Albany network at National Grid is performed by Cable Splicers within Underground Lines East. This group is led by a Manager, and includes a group focused on civil aspects of the underground system and a group focused on the electrical aspects. Cable Splicers are part of the Electrical Group. The Underground lines group is responsible for both the network and non – network infrastructure in eastern NY, including the Albany network.
Cable Splicers work with cable and cable accessory installation and maintenance, including cable pulling and splice preparation. They are trained to work with both lead and poly splices.
Cable Splicer apprentices (Cable Splicer A) receive formal training and on the job training in preparing joints and terminations as part of the formal job progression.
Process
National Grid no longer installs new lead cable, but has lead cables in service, both primary and secondary. Consequently, Cable Splicers must work with lead, and with transition joints.

Figure 1:
Lead joint

Figure 2:
Lead joint
Standard splices for EPR to EPR primary cables are cold shrink. Standard transition splices of EPR to PILC are heat shrink. In certain applications, hand applied splices may be used.
Blood tests for employees to ascertain lead levels are not mandatory, but available to Cable Splicers.
7.3.16.13 - PG&E
Construction & Contracting
Splicing
People
Cable splicing at PG&E is performed by Cable Splicers within both the M&C Electric Network group, and the General Construction group.
Much of the work within the M&C Electric Network group involves working with network equipment, such as performing network protector maintenance and transformer oil testing. In San Francisco, much of the cable work, including preparation of splices is shared between the cable splicers within M&C Electric Networks, and the General Construction group. In Oakland, there are particular Cable Splicers who focus on cable work, and others who are normally assigned to working with network equipment.
PG&E Cable Splicers prepare lead joints within the 12 kV network part of their system (PILC cable). Note that outside of the cities, most Cable Splicers have limited experience with preparation of lead splices other than building transition joints. Consequently Cable Splicers from San Francisco and Oakland are periodically sent to other areas to prepare lead splices.
The cable engineer within the Electric Distribution Standards and Strategy group is responsible for establishing standards for splicing.
Cable Splicer apprentices receive formal training at the PG&E Training center in preparing lead joints as part of the apprentice program. This is supplemented by on-the-job exposure to working with lead cables and joints. One distribution supervisor noted that he supplements the formal training with additional lead training within the office. One week before his apprentices go to the formal training, he brings them into the office and gives them practice and training that will facilitate their learning in the weeklong formal session.
Process
PG&E Cable Splicers use lead splices within the 12 kV network system (PILC cable). PG&E resources noted that lead joints have been very reliable.
PG&E historically used heat shrink transition joints to transition from lead to non - lead cable. They have recently (within the past year) moved to using cold shrink transition joints as a standard.

Figure 1:
Lead joint

Figure 2:
Preparing a lead joint
7.3.16.14 - Portland General Electric
Construction & Contracting
Splicing
People
Cable splicing is the responsibility of the Underground Group, also known as the CORE group.
Organizationally, this group is part of the Portland Service Center (PSC) and is responsible for the underground CORE, which includes both radial underground and network underground infrastructure in downtown Portland. An Underground Core Field Operations Supervisor leads the CORE group. This supervisor reports to the Response & Restoration Area Line Manager (ALM).
The journeyman position in the CORE group is the cable splicer. A typical underground crew consists of three people: two journeymen and a non-journeyman helper. The foreman, who is a qualified cable splicer, is one of the working journeymen on the crew. The two journeymen typically perform the work inside the manhole or vault, while the helper usually stays above ground, carrying material and watching the barricades and street for potential hazards.
The cable splicer position is a “jack-of-all-trades” position, whose responsibility includes cable pulling, splicing, equipment maintenance, and inspection.
To become a cable splicer in CORE, an employee must spend one year in the CORE area as an assistant cable splicer, in which the employee’s job assignments familiarize the employee with the CORE underground system. For example, this year cable splicer assistants will be expected to prepare a straight splice and trifurcated splice. Often provided by a vendor, more formal training also supplements on-the-job training. For example, Raychem has conducted hands-on training in preparing a transition joint.
Network engineering develops and maintains the standards for the network, including standards for splicing, which are forwarded to the Standards Department for inclusion in company standards manuals.
Process
PGE has transitioned from heat shrink to cold shrink splices. Crews occasionally will use heat shrink technology on the secondary system, but primary systems all use cold shrink. This change was made to assure more consistency in the splice preparation, as PGE had experienced some historic failures with the heat shrink splices. For trifurcating splices, crews still use a heat-shrink component.

Figure 1:
Secondary moles
The cable splicers are meticulous in splicing, with one person preparing the cable joint while another reads out loud the directions provided with the splice kit.

Figure 2:
Cable Joints
PGE no longer prepares lead splices, other than a lead-EPR transition joint.
PGE has experienced some historic failures in T-body connections. The company attributes these failures to incorrect torqueing of the splice inserts. PGE has built a library of failure modes for T-Bodies and uses this for analysis.
PGE uses compression connections for its splices, as these have been effective. It is trialing the use of bolted connections at one major customer and is monitoring the effectiveness of this type of connection. For this particular customer, PGE is also capturing photographs of all of the splices at the customer’s request.
Technology
Burndy Mole Connectors: PGE uses Burndy MOLEs, which are engineered connectors that provide for multiple connections at a single junction point. These connectors offer a safer and easier installation than traditional soldered or taped connectors, taking up less room in crowded manholes. The Burndy Mole is an engineered connector that is essentially a bus bar with several cable outlets with mechanical installation. The connectors include cable limiters.
Transformer Connectors: The connections of the feeders to the transformers are straight connections rather than elbows, because PGE prefers not to place an extra bend in the cable.
7.3.16.15 - SCL - Seattle City Light
Construction & Contracting
Splicing
People
At Seattle City Light, all network electrical workers are part of the Cable Splicer family; that is, the journeyworker Cable Splicer performs all of the tasks associated with building, maintaining, and operating a network system including cable pulling, splicing, construction, equipment inspection, and maintenance.
Organization
SCL has an Energy Delivery Field Operations department that includes a network Electrical Services group (Area Field Operations – Network) group, and a network Civil Services group.
The Electrical Services group is made of 84 total people including the supervision and a five-person cable-locate crew. (Note: this cable-locate crew does underground locating for the whole company). This group performs all construction, maintenance, and operation of the network system.
The Civil Services group consists of approximately 36 employees. In addition, SCL contracts approximately 25% of their civil construction work associated with their network system as well.
Cable Splicer Position
The Cable Splicer position at SCL is a generalist position. Cable Splicers perform all electrical aspects of network construction, operations, and maintenance. All electrical employees who work in the network are either Crew Chiefs, journeyman Cable Splicers, or apprentices in the mode of progression, working their way towards the journeyman level.
Mode of Progression
SCL uses a three-year automatic mode of progression. This mode includes 8000 hours of On the Job Training (OJT) and testing. They have experienced a very low dropout rate from the program. This is in part because they administer a highly selective front end test and interview process to accept apprentices into the program. Also, a Cable Splicer position at SCL is a highly sought-after position.
Training
In addition to the training associated with the mode of progression, SCL provides network crews with opportunities for training including mandatory safety training for processes such as manhole entry and manhole rescue. SCL also periodically sends personnel to conferences and specialized training sessions such as the Cutler Hammer School, etc.
Crew Makeup
A network crew is normally made up of one Crew Chief, one or two Cable Splicers, and one apprentice. The type of work to be done and SCL work rules will dictate the appropriate crew makeup. For example, performing switching in a vault requires at least two journeyman-level employees to be in the vault. These and other work rules and safety practices are spelled out in the Washington State Safety Standards for Electrical Workers, Chapter 296-45 WAC.
Technology
SCL uses various types of splices including lead splices, heat-shrink splices, and cold-shrink splices. The majority of splices they use (80%) are heat-shrink, hand-taped splices. Less than 8% of their splices are lead.
SCL prefers the heat-shrink splice to the cold-shrink splice, because they have had a low failure rate with heat-shrink splices. However, most of the splice failures they do experience are with poly splices. They have had very little failure of their lead splices.
SCL is currently developing a process for following up on poly splice failures with a laboratory analysis.
7.3.16.16 - References
EPRI Underground Distribution Systems Reference Book (Bronze Book)
7.3.16.17 - Survey Results
Survey Results
Construction
Splicing
Survey Questions taken from 2012 survey results - Construction
Question 5.6 : How many hours of training (on average, per person) does your field force receive in a year?

Question 5.13 : When you prepare a splice, do you track and record who prepared the splice?


Survey Questions taken from 2009 survey results - Construction
Question 5.7 : How many hours of training (on average, per person) does your field force receive in a year?

7.3.17 - Three Phase Pad Mounted Transformer Installation
7.3.17.1 - CenterPoint Energy
Construction & Contracting
Three Phase Pad Mounted Transformer Installation
People
Three phase padmounted equipment is installed by the Major Underground field force, typically Cable Splicers or Heavy Equipment Operators. CenterPoint has historically assigned this work to particular individuals who have become expert users of the equipment used to set transformers.
Process
CenterPoint demonstrated the ability to safely and efficiently install new padmounted transformers with one qualified resource using a material handling truck with a remote control console worn by the operator.

Figure 1:
CenterPoint Operator with Remote Control Console worn around his neck

Figure 2:
Material Handling Truck
The Operator was able to attach the lifting sling to the transformer without having to climb onto the truck bed by using a hand fashioned hook stick made from a copper ground rod.

Figure 3:
CenterPoint Operator with hand fashioned hook stick

Figure 4:
Material Handling Truck lifting transformer
The Operator was deft in positioning the transformer over the pad and placing it in the right position.

Figure 5:
CenterPoint Operator moving unit to pad

Figure 5:
CenterPoint Operator positioning unit on pad
Technology
CenterPoint utilizes a heavy duty underground material handling truck with a remotely operated lifting device, as shown in the pictures above.
7.3.18 - Training Facility
7.3.18.1 - Portland General Electric
Construction & Contracting
Training Facility
People
PGE’s general training philosophy for workers in the CORE is to be at least two deep in terms of expertise at all positions.
Process
PGE holds training within an area located in the store room. The company may develop training on its own or oftentimes bring in a manufacturer to deliver training on a particular product or tool. Personnel often split into groups and allocate to various “stations” for training. The Portland Service Center (PSC) hasa network protector training area with both a CMD and a CM52, which are both dead-front units. All installed protectors on the network are one of these two styles. This location also receives new devices for a quality assurance (QA) check and testing.

Figure 1:
Network protector cabinets used for training

Figure 2:
Store room area used for training and NP testing

Figure 3:
Store room area used for cable joint training
Compliance training includes vault rescue, pole top rescue, and all other federally mandated training. The vault rescue class is a company-wide training undertaken annually, and workers train in a shallow vault that does not always resemble the deeper network vaults. Accordingly, PSC may augment this training with more specific vault rescue training geared to the network vaults, which would take place in a live vault since the company does not have a test vault. PGE also provides annual computer-based training on “Confined Space” practices.
The CORE journeymen, who work almost exclusively with urban underground systems day to day, are required to support restoration work on the overhead system when needed. In restoration, they generally work in two-man crews addressing wire-down situations. In order to reinforce these skills, the CORE group conducts annual training on overhead systems in a de-energized training yard, where they review various overhead line-work scenarios.
7.3.19 - Resource Management
7.3.19.1 - Portland General Electric
People
Obtaining resources for construction on the CORE system involves a number of departments.
Planning and designing internal and external projects involve Service & Design Project Managers (SDPMs) and the Project Management Office (PMO). However, they do not deal directly with equipment and material vendors, which is the responsibility of the Materials Coordinator.
Scheduling crews and matching them to the available work is the responsibility of the Planning and Scheduling Department.
Process
Inventory and Logistics: PGE has a system to ensure that crews receive inventory/assets on time and according to the right specifications and standards, as determined by network engineering and network planning. They take into account the long lead times for the equipment that many of the jobs require. For example, a 1500 kVA transformer may take nine months from order to delivery.
Scheduling: About three years ago, PGE moved from an all-paper system to a work management system using Maximo. All the work provided to the crews is scheduled in Maximo and sent to the field through electronic field devices. Early in the adoption of this system, PGE experienced a learning curve. Some work orders became lost, and workers struggling to utilize the new system. An intensive information technology (IT) training program targeted to field workers rectified these challenges.
Until about two years ago, the CORE area was “siloed” in that the CORE group management made scheduling decisions without involving other organizations. CORE work now passes through the Planning and Scheduling Department, which looks at resourcing and scheduling across the company.
Developing Work Packages
PGE uses ArcFM as its current design product to create a materials list and a “package,” which is forwarded to various project stakeholders, including the field crews, customer, inspector, and contractor. The package contains multiple documents including the following:
- Generic information
- Electrical layout information for crews
- Conduit plan for the contractor and city
- Vault details for crews, including the vault “butterfly” view
Most of the materials used for network construction already have estimated man-hours details included in the design system, so that when a designer selects an asset, the system will calculate the man hours/labor needed for installation. However, those numbers may not always reflect actual field requirements and are adjusted accordingly. The information is available in Maximo and allows a comparison of estimated and actual labor costs.
Technology
Geographic Information System (GIS) – ESRI ArcGIS/Schneider ArcFM
PGE uses ArcFM GIS software for designing network layouts and creating a package with work details for relevant personnel. For construction, the system creates a list of materials that can be shared with the relevant people.
ArcFM uses open-source and COM architecture to support scalability, user configurability, and a geographical database. ArcFM includes tools that allow network editing, GIS asset management, design integration, and work management.
Maximo for Utilities 7.5
For work scheduling, PGE uses the Maximo for Utilities 7.5 system, which covers most asset classes and work types. The system allows users to create work estimates and manage field crews. Maximo can integrate with a number of systems, including fixed-asset accounting, mobile workforce management solutions, and graphical design systems. The Maximo Spatial system is compatible with map-based interfaces, such as ESRI ArcGIS, and follows J2EE standards [1].
- T. Saunders, J. Souto Maior, and V. Garmatz. “IBM Maximo for Utilities.” IBM, 2012. ftp://ftp.software.ibm.com/software/tivoli_support/misc/STE/2012_09_11_STE_Maximo_for_Utilities_Upgrade_Series_v4.pdf(accessed November 28, 2017).
7.3.20 - Vault Grounding
7.3.20.1 - AEP - Ohio
Construction & Contracting
Vault Grounding
People
During the design phase, AEP Network Engineers lay-out the design of network vaults and manholes using one-line drawings that indicate the position and dimensions of all internal components, such as duct lines, cable position and racking, transformers and network protectors, secondary bus, and grounding. These drawings are then converted to electronic architectural drawings by a Technician using MicroStation and AutoCAD. AEP works closely with its Civil Engineering contractor to prepare associated civil designs.
Process
New manholes and vaults are designed with two ground rods at opposite corners and a ground ring, typically 4/0 cu. AEP is not tying the grounding with the manhole or vault rebar.
Technology
Wherever possible, AEP Ohio uses pre-cast manholes and vault designs. These designs include ground rod sleeves, as each new manhole and vault is designed to be grounded with two driven ground rods at opposite corners the vault, with a ground ring (usually 4/0 cu) around the vault/manhole. The grounding is not tied to the vault / manhole rebar. Note that this design differs from an historic design which had the ground bus mounted to the vault ceiling. AEP moved away from this design as deteriorating vault ceilings in older vaults could compromise the grounding system integrity. In spot network vaults on customer premises, the vault grounding is usually tied to the customer’s steel building frames (see Figures 1 and 2).

Figure 1:
Manhole grounding (older design) with ceiling-mounted grounding, Note ground pad

Figure 2:
Manhole grounding (newer design) with floor-mounted ring bus
7.3.20.2 - Ameren Missouri
Construction & Contracting
Vault Grounding
( Indoor Substation Grounding)
People
Design of network vaults and non network “indoor rooms” is the responsibility of the Engineering group within the Underground Division, organizationally part of Energy Delivery Distribution Services, reporting to a VP. The Underground Division is led by a manager, and consists of both engineering and construction resources responsible for the downtown infrastructure. The engineering group is led by a supervising engineer, and is comprised of Engineers and Energy Services Consultants (commonly referred to as Estimators) who deal with planning, design, and service issues.
Engineers design the system, including grid network vault designs and indoor room designs, including grounding. All of the engineering positions are four year degreed positions. Some engineers within this group have their PE licenses, although this is not a job requirement. Engineers are not represented by a collective bargaining agreement.
Process
For indoor substations, the customer is responsible for providing the vault, including space in the room for the required equipment. These specifications, provided by Ameren Missouri, include 3-hr fire-rated doors and space for ventilation, lighting, pulling eyes, an oil retention tank, and a ground grid.
An engineer from the Engineering group performs a soil analysis to understand the resistivity of the soil before using a modeling program to design the ground grid. Once this is built, relay testers will ensure that the system provides sufficient grounding in the same way that they test standard substations. Once this is installed and approved through testing, the customer can complete the room.
Although Ameren Missouri does not stipulate that customers must tie their building ground into Ameren Missouri’s ground system, most do, because they will benefit from Ameren Missouri’s superior ground grid.
Technology
Ameren Missouri uses modeling software for grounding call WinIGS (Integrated Grounding System analysis and design), developed by Dr. A. P. Sakis Meliopoulos, Georgia Tech.
7.3.20.3 - CEI - The Illuminating Company
Construction & Contracting
Vault Grounding
Process
At CEI, in a vault in a customer’s building, the transformer ground is tied in with a ground around the vault and is tied in with the building ground.
7.3.20.4 - CenterPoint Energy
Construction & Contracting
Vault Grounding
Process
For spot network vaults, CenterPoint separates its vault ground from the building ground. They require that customers drive two ground rods for each vault.
Technology
CenterPoint is using a molten (lead wipe) connection for grounding equipment to the ground ring in a vault. They are currently investigating other methods of making these connections.

Figure 1:
Molten Ground Connection

Figure 2:
Molten Ground Connection
7.3.20.5 - Duke Energy Florida
Construction
Vault Grounding
Process
Every Duke Energy Florida manhole and vault has a driven ground.
Each manhole has a ground ring around the roofline which is tied to the driven ground.
In vaults, all network equipment is tied to ground. At spot network locations within building vaults, the network system ground is separate from the building ground.
7.3.20.6 - Duke Energy Ohio
Construction & Contracting
Vault Grounding
Process
For spot network vaults, Duke Energy Ohio interconnects its vault ground with the building grounding[1] .
Technology
Duke Energy Ohio is using flat stock for the ground ring in their vaults, with bolted connections.

Figure 1:
Vault ground ring – Copper flat stock

Figure 2:
Transformer ground – bolted connection to ground ring
[1] Duke cited an instance where their fire control system “saw" a bad three-phase elevator motor in a building, and opened all the breakers.
7.3.20.7 - National Grid
Construction & Contracting
Vault Grounding
Process
National Grid ties all of its vault equipment to ground, including the switch handle on the transformer primary ground switch and network protector operating handle.. National Grid standards call for the vault ground to be kept separate from the building ground. For customer services, National Grid runs full sized insulated neutrals into the customer building connecting to the neutral bus. It is the customer’s responsibility to ground the neutral bus on their end.
Spot network vaults are equipped with a ground fault protection system designed to trip (open) all of the network protectors in the vault in the event of a ground fault. The customer is required to buy, install, and wire the National Grid approved ground fault protection system. Ground fault protection system equipment is installed in the customer’s electric room. A current transformer required to monitor neutral currents is installed in National Grid’s transformer vault.
Technology
National Grid is using a copper ground ring in their vaults.

Figure 1:
Primary switch handle grounded

Figure 2:
Connection to ground ring

Figure 3:
Transformer grounding

Figure 4:
Vault grounding
7.3.20.8 - PG&E
Construction & Contracting
Vault Grounding
Process
For spot network vaults, PG&E separates its vault ground from the building grounding,
Technology
PG&E uses a copper ground ring in their vaults.


7.3.20.9 - Portland General Electric
Construction & Contracting
Vault Grounding
7.3.20.10 - SCL - Seattle City Light
Construction & Contracting
Vault Grounding
Process
SCL’s grounding practice in building vaults is to tie the system ground in with the building steel / grounding system.
SCL runs a separate low-voltage secondary neutral (in addition to the tape shield) through each vault tied in with the substation ground. This neutral is necessary for two reasons: to maintain ground connectivity to maintain the same potential from one vault to another, and to carry the neutral currents experienced with system imbalances.
7.3.20.11 - Survey Results
Survey Results
Construction & Contracting
Vault Grounding
Survey Questions taken from 2015 survey results - Design
Question 52 : In designing your network vault, what ground resistance do you requirefrom the ground system inside the vault?


Survey Questions taken from 2012 survey results - Design
Question 4.10 : In designing your network vault, what ground resistance do you require from the ground system inside the vault?

Question 4.11 : In a building vault, do you tie your neutral in with the building steel / ground system?

Survey Questions taken from 2009 survey results - Design
Question 4.10 In a building vault, do you tie your neutral in with the building steel / ground system? (this question is 4.11 in the 2012 survey)

7.4 - Design
7.4.1 - Cable Design
7.4.1.1 - AEP - Ohio
Design
Cable Design
People
The specification for cable used in the AEP Ohio networks supplying metropolitan customers in Columbus and Canton is the responsibility of the Network Engineers in collaboration with the Network Engineering Supervisor. These personnel are geographically based in downtown Columbus at AEP Ohio’s Riverside offices. The Network Engineering group reports to the AEP Network Engineering Supervisor, and is part of the Distribution services group at AEP, reporting ultimately to the AEP Vice President of Customer Services, Marketing and Distribution Services. The AEP Distribution Services group, including the Network Engineering Supervisor supports all AEP network design issues throughout its operating companies, including Texas, Indiana, Michigan, Oklahoma, and other locations.
AEP also has a Network Standards Committee, headed by the lead Network Engineering Supervisor in its downtown Columbus offices, and comprised of representatives from all AEP operating companies. This group works closely with the parent company’s Distribution Services organizations, and holds regular teleconference sessions on network findings, “lessons learned” in the field, and discusses potential network engineering solutions to common network design and implementation issues. Cable design and implementation issues throughout the AEP service areas are regularly studied and recommendations are made through this committee.
Process
Cables and associated materials for a particular project are selected during the design phase or during maintenance and repair by network engineers. These engineers use tools such as CMYECAP (to determine cable ratings) and CYME SNA (to perform load flow analysis) to determine the correct cable for any network design, including primary and secondary.
AEP Ohio uses the following cable types in its new network designs for medium-voltage cable:
-
1/0 TR-XPLE (primarily used in URD applications)
-
4/0 TR-XPLE
-
500 cu flat strap EPR with a thin jacket (to fit into 3” and 3 1/2” ducts)
-
750 copper and aluminum EPR cable, used in distribution and for feeder exits. 750 cu with a flat strap neutral is also used for station exits and distribution in smaller ducts.
AEP Ohio uses the following cable types in its new network designs for low-voltage cable:
- 750 cu EAM (ethylene-alkene copolymer) cable for network secondary.
For primary cable, these design preferences have been in place for some time.
AEP has lead cable installed for both primary and secondary. For primary cables, AEP is replacing lead cable (PILC) with EPR insulated cable as repairs or changes are being made. For secondary cables, AEP is replacing existing styrene-butyl and lead cable with EAM cable in an extensive cable replacement project ($300 million) throughout AEP operating companies, including AEP Ohio (see Network Revitalization).
AEP’s secondary cable design preferences were developed by the an engineer within the Network Engineering group, and are based on cable rating models and AEP Ohio’s specific characteristics based on thermal resistance, duct line configuration, and manhole requirements. Working with the Network Standards Committee, the engineer arrived at secondary cable design preferences based on the models.
AEP Ohio’s philosophy is the make the maximum use of the existing duct space, as expanding duct space can be very expensive. Thus, for its targeted secondary cable replacement program, AEP Ohio has standardized on 750 Cu EAM insulated cables as this is the largest sized cable that will fit in its standard 3 ½ inch duct. Note that the ultimate decision on both cables to replace and the size and type of cable to use for replacement was left up to individual AEP operating companies as part of their replacement program
AEP Ohio’s secondary cable replacement program includes replacement of butyl rubber cable and lead secondary cables. AEP engineers noted that while lead cables are not as high a priority as replacing butyl rubber cables, lead cable failures can result in a hot fire which can spread to adjacent cables and other facilities.
AEP designs its duct and manhole system in a way that physically separates the electrical facilities to assure contingency operation (see Figure 4-13 and Figure 4-14). For example, in systems with an N-2 design criterion, AEP will run no more than two network feeders that supply a given network within the same duct bank, manhole, or vault. For an N-1 design, the design will arrange feeders so that the loss of a single duct bank, manhole, or vault will not result in a customer outage.

Figure 1:
Cabling in manhole. Note primary racked on the top of the manhole; secondary racked on the bottom
}

Figure 2:
PILC cables, lead joints
AEP uses arc proof tapes on all network primary cables within manholes or vaults. Secondary and service cables are not arc proofed, but are physically separated from primary cables in the vault to the degree possible.
Technology
AEP Ohio uses CYMECAP and CYME SNA for cable design modeling and selection. The Network Engineers perform load flow analysis and cable rating studies for primary and secondary cable for new designs and system upgrades or repairs.
AEP utilizes crabs for its secondary network buss work (see Figures 3 and 4).

Figure 3:
Secondary crabs

Figure 4:
Secondary crabs
7.4.1.2 - Ameren Missouri
Design
Cable Design
People
Network standards, including standard designs for cable, are the responsibility of the Standards Group. This group develops both construction standards and material specifications for designs and equipment used in the network underground. These standards and specifications are used by engineers and estimators in developing network designs.
Organizationally, the Standards Group is led by a Managing Supervisor, and is part of the Distribution Planning and Asset Performance Department, part of Energy Delivery Technical Services. Within this organization are experts who focus on developing and maintaining specific underground standards. For example, they have a cable engineer, who is an expert with cable and cable systems, and responsible for the development of cable standards for the company.
Standards are available in both an online and printed book format. Updated versions of the book format version are issued every 2-3 years.
See Standards
Recently, Ameren Missouri has formed the “Underground Revitalization Department,” a team of engineers (all 4-yr degreed) focused on researching, evaluating, and developing plans for performing capital improvements to and revitalizing downtown St. Louis, including the network. Part of this group’s role includes addressing issues such as the development of conduit system standards and cable replacement strategies for the company.
See Unsatisfactory Performance Report
Process
Ameren Missouri’s present standard calls for the use of EPR insulated cable for all cable systems. Because of limited duct size, Ameren Missouri has implemented the use of reduced-diameter 15 and 35kV cables for the replacement of paper – insulated lead-covered cables (PILC) cables. This reduced-diameter cable (145 mils vs. 175 mils for 15kV, and 300 mils vs. 345 mils for 35 kV) is being used where conduit sizes are small, such as downtown St. Louis for both new and replacement applications, and has resulted in significant cost savings.
The reduced-diameter cables are tested and installed just like their full-diameter counterparts using qualified cold-shrinkable, heat-shrinkable, or special molded accessories with push-on cable adaptors with the reduced-diameter cables. Ameren Missouri believes that they receive higher quality cable in that the cable manufacturers have to run their cable manufacturing process more slowly to meet the tolerances required by Ameren Missouri. To date, there have been no reduced-diameter cable or accessory failures unrelated to workmanship.
The cables must be stripped carefully so that the underlying insulation is not damaged as there is less margin for error with the reduced insulation. Ameren Missouri routinely reminds construction personnel that they are working with a special cable and need to handle it appropriately. The cable engineer from the Standards Group will occasionally assist the training department in training splicers for making up cable accessories. Ameren Missouri will also conduct training classes using experienced retirees as instructors.
The purchase price of reduced-diameter cables is comparable to the price of full-diameter cables. However, some accessories used with reduced-diameter cables may have a higher total installed cost than a similar push-on device. Further, reduced-diameter cables have a minimum bending radius that is slightly less than a similar full-diameter cable, but this has not been an issue. Finally, reduced-diameter cables have dielectric losses that are somewhat higher than similar full-diameter cables. In addition, Ameren Missouri is using the reduced-diameter cables to transition between PILC cables and has experienced no problems using the reduced-diameter cables in trifurcating transition splices.
Ameren Missouri’s revitalization efforts may result in the installation of new duct systems with adequate conduits size. In this case, Ameren Missouri would use standard wall cable.
Technology
Current standard cables used for the Ameren Missouri network are 4/0 Al, 350 cu, 750 cu at 13.8kV. For network secondaries, they use 500 Cu EPR cables for the street mains and transformer ties.

Figure 1:
Primary Cables

Figure 2:
Primary Cables – Transformer termination
7.4.1.3 - CEI - The Illuminating Company
Design
Cable Design
(Cable and Splice Design)
People
The Supervisor, Underground / LCI Section at CEI has significant experience with cable and cable system design. It is the Engineering Services group that maintains and establishes cable standards for the region, and designs and prepares construction drawings for the conduit system.
FirstEnergy has chosen to keep this responsibility in the region [1] , because the expertise is housed at CEI, as 70% of the ducted conduit system in the company is located at the Illuminating Company.
Process
CEI has a significant amount of Paper Insulated Lead Cable (PILC) cable installed (80% of their ducted manhole system), as this was their standard in the past (three conductor paper lead cable). When they decided to move to a non-lead cable type, they formed a committee and worked closely with a manufacturer to develop a new cable specification. They elected to go with a flat strapped cable because of the reduced diameter, and with EPR insulation, chosen because of its flexibility. In selecting standard EPR cable sizes, the committee inventoried the PILC cable sizes being used to understand the current carrying needs of these feeders, as EPR cables would ultimately be used to replace failed cable sections. They selected two standards sizes to meet their needs - 3/0 and 500 kcmil Cu EPR 15 kV class cables.
When CEI began using EPR Cable construction, they needed to develop a transition splice (stop joint) to transition from lead cable to EPR cable as lead cable sections were replaced or added on to. Originally, CEI developed an in house transition joint that involved performing lead wipes (similar to traditional lead splices). Ultimately, they worked closely with manufacturers (Raychem and 3M, for example) to develop a transition splice from lead to the flat strapped EPR, that could withstand the changing oil pressures (from daily load swings., temp, elevations, etc.)
CEI will typically “pilot” or laboratory test a new piece of equipment, such as a splice, prior to installing it on their system (See Beta Lab - Testing Laboratory ). The transition splices were fully tested prior to selection.
Technology
CEI has approximately 16000 ft of primary cable installed. They have a significant amount of Paper Insulated Lead Cable (PILC) cable installed, as this was their standard in the past. For network primary cables, CEI’s current standard is Ethylene Propylene Rubber (EPR) insulated cable. Cross Linked Polyethylene (XPL) insulated cable is used for primary feeder substation getaways (750 AA). For secondary network cables, CEI uses XLP insulated cable (500 Cu).
CEI uses various types of splices including lead splices (occasionally), heat-shrink splices, and cold-shrink splices. CEI’s preferred splice is a Raychem Heat shrink transition splice, though they acknowledge that training and proper workmanship are essential to making up these splices properly. They also are using a 3M cold shrink splice
Note: CEI uses the following technology at steam crossings to eliminate cable failures:
CEI elected to use high temperature withstand silicone rubber jacketed cables (rated to 200 degrees C) in cable runs in close proximity to steam lines. (See Attachment - H)
When CEI sold the steam system, they also required the new owner to respond to and repair steam leaks in a timely fashion in order to minimize the exposure of the electrical system to the high temperatures associated with these leaks.
The application of the high temperature withstand silicone rubber jacketed secondary cable effectively eliminated the cable failures at steam crossings.
[1] In anticipation of the retirement of a key CEI individual with cable and splice design expertise, FirstEnergy has assigned a senior engineer from their corporate Design Standards group to work closely with this individual to gain experience and document knowledge. It is anticipated that this Senior Engineer will provide cable and splice design expertise to CEI in the future.
7.4.1.4 - CenterPoint Energy
Design
Cable Design
People
Network design at CenterPoint is performed by the Engineering Department contained within the Major Underground Group. The Engineering department is led by a Manager and is comprised of four main sub groups.
One sub group is a technical group that includes the engineers who design the protection schema and remote monitoring systems in the underground.
Another sub group deals with the design of three phase pad mounted transformer installations, including looped commercial developments. This group, the Padmounts group, is comprised of Engineers, Engineering Specialists, and is supplemented with contractor resources. This group is not typically involved in network design.
Another sub group focuses on vault designs, interfacing very closely with the Key Accounts Consultants (also part of Major Underground) who interface with large customers. This group, called the Vaults group, is comprised of Engineers, Engineering Specialists, and is supplemented with contractor resources. Note this group designs submersible network vaults as well as building vaults.
The final subgroup is one focused on distribution feeder design. This group, the Feeders group, focuses on both network and non network feeders. This group is comprised of Engineering Specialists, Engineering Technicians, and is supplemented with contractor resources.
Process
CenterPoint uses EPR aluminum cables with a flat strapped neutral as a standard primary power cable for Major Underground (750 AA and 1000 AA at 15kV, 1250 AA at 35kV). CenterPoint uses TR - XLPE insulated cables in URD applications.
CenterPoint does have Paper Insulated Lead Covered [PILC] cable as well as butyl (rubber) cables installed.
7.4.1.5 - Con Edison - Consolidated Edison
Design
Cable Design
People
Organization
Central Engineering - Responsibilities include Civil / Mechanical Engineering, Control Systems Engineering, Design Engineering, Electrical Engineering, Equipment and Field Engineering, and Environmental Engineering & Program Support.
Employee Development
Con Edison invests in developing its design employees through three distinct programs focused on employee development. One program is focused on the development of newer engineering employees, another at incumbent employees, and the third at bargaining unit employees who are entering the management ranks. The programs are described more fully on page 3-53 of this report. Note that these programs are not limited to design employees, but are available to all employees who qualify.
Process
Cable Design
For network primary cables, Con Edison uses Ethylene Propylene Rubber (EPR) insulated cables as its standard. EPR cable was chosen due to its flexibility. (Note: Con Edison has Crosslinked Polyethylene [XLP] and Paper Insulated Lead Covered [PILC] cable installed. PILC cable makes up about 20% of the utility’s installed plant.)
For secondary network cables, Con Edison uses cables insulated with “Integral” Filled Ethylene Alkene Rubber (EAM). This particular cable is flexible, and is jacketed with a durable low-smoke, zero-halogen material that is extruded over the insulation.
Con Edison has a cable engineer who works closely with cable manufacturer, and is instrumental in the ultimate design of the cable, development of cable specifications, and constructions.
7.4.1.6 - Duke Energy Florida
Design
Cable Design
People
The specification of cable used in the urban underground networks in Duke Energy Florida is the responsibility of the Standards group, which oversees all standards for distribution equipment and materials. One Engineer within the group oversees all network equipment standards for Duke Energy Florida. This engineer is an Electrical Engineer, a requirement for the engineer who specializes in Network Standards. The engineer also has a PE license, a requirement to obtain certain levels within the engineer family.
Duke Energy has a Corporate Standards committee which focuses on developing common standards throughout the Duke Energy family of companies. Across the Duke Energy family of companies, there is a core Network Group of four or five members within the broader Standards groups that assist each other and collaborate on choosing all material and specification standards for the underground network throughout the company, including Florida. This core underground team draws on members from across the Duke Energy operating companies.
Process
The standard primary feeder cables supplying the Clearwater network are 4/0 cu XLPE insulated cables. Outside the network, Duke Energy Florida will use both 4/0 cu and 1000 MCM AL XLPE cable for feeder exits. Standard secondary cable sizes are 4/0 cu and 500 cu, also XLPE insulated. Duke Energy Florida has no remaining lead cables in their underground system.
Stud moles are mounted on top of the protector, and use nut and cone connections to the cable (see Figure 1).

Figure 1:
Secondary cable emanating from network protector showing stud moles
Cables are racked on a galvanized steel cable rack, using steps and porcelain insulators. Primary feeders are usually mounted on cable racks in the lower part of the manhole, while secondary cabling is mounted above, higher in the manhole (see Figure 2).

Figure 2:
Secondary cable racks. Note cable limiters attached to the moles
All network feeders in downtown Clearwater (supplying a true 125/216V network) have their own network cable manholes/duct lines (not shared with non-network circuits).
Duke Energy Florida uses cable limiters, with full section limiters on all street mains and half section limiters on all service connections.
Duke Energy Florida utilizes cable tags in the field, and maintains accurate maps showing feeder numbering.
7.4.1.7 - Duke Energy Ohio
Design
Cable Design
People
Duke Energy Ohio’s network system is comprised of both older paper insulated lead (PILC) cables (400 and 600 MCM) and newer EPR insulated cables. They have a fair amount of lead cable still in the ground, including both primary feeders and their network secondary cables.
New cable is EPR insulated. Because they have a lot of older 3 ½ inch square duct and 4 inch circular duct installed in the network, and because they typically pull three conductors in a pipe, their 15kV cable specification calls for 750 Cu EPR cables with a flat strapped neutral, to accommodate the small duct size.
Cable specifications are prepared by the Underground Standards group, located in Charlotte.
Process
Duke Energy Ohio has a vendor alliance in place with a particular cable company for much of their non-network cable. They do not have such an alliance in place with their network cable supplier.
New cables are accepted by Duke Energy Ohio, after successfully passing a DC Hi pot acceptance test and an AC Tan Delta test. The AC tan delta is used to establish a baseline for future cable testing. The testing and establishment of this baseline is performed by one of the underground crews, compromised of individuals who have developed expertise in AC Tan Delta testing.
Network Feeder “get away cables” (substation feeder exit cables) were historically designed as nitrogen gas filled cables, with the nitrogen used to resist water penetration. The substation group maintains this system of gas filled cables. When the there is a leak, the Dana Avenue group will trouble shoot it. They will fix, or sometimes, they may cap the feeder, changing the point to which the nitrogen is pumped. In other cases, they have eliminated the nitrogen, although they have found that this sometimes leads to additional failures due to moisture ingress. When they replace network “get away cables”, they will do so with EPR insulated cable. They do not have a proactive program to replace these older gas filled cables - replacement is usually driven by development / load growth.

Figure 1:
Nitrogen supply to feeder exit cables
Technology
Current standard cables used for the Duke Energy Ohio Cincinnati network are 4/0 cu EPR and 750 cu EPR cables (750 with a flat strapped neutral).
Duke adopted these standards as a replacement for the 400 and 600 MCM PILC cables they were the former standard. They chose the EPR cable insulation type because, though a bit lossier than XLP cables, they found it to be more flexible. Also, the cables come strapped together (each leg) so that they can make one cable pull.
At the time of the immersion, Duke resources noted that they were exploring other cable type opportunities for use in their network, looking at things such as loss characteristics, cable flexibility, coatings of the jacket, etc.

Figure 1:
Primary cable

Figure 2:
Primary cable

Figure 3:
Primary cable
7.4.1.8 - Energex
Design
Cable Design
People
Engineers within System Engineering, part of Asset Management, establish cable design standards for the Energex network underground CBD. Project engineers within the Design group, part of Service Delivery, apply the appropriate, approved Cable Design standards according to duct and conduit constraints, location, and earth ambient temperatures (see Table 1). Project engineers are geographically situated at 15 different “hub” locations throughout its territory. They are distributed geographically to be close to the field, but the assignment of work is not strictly geographic, with work often assigned based on work peaks and troughs.
[See the Standards section of this report]
Process
Energex uses both PILC cable, and XLPE insulated cable at 11 kV to supply the CBD. The company is not actively seeking to reduce the amount of PILC, but their current standard for new installations is to use XLPE insulated cable. PILC is only used in new applications where they are restricted because of the size of the existing duct system.
Technology
The standard XLPE cable used in the CBD is a triplex cable, using stranded aluminum conductors (400 mm2 ). (See Figure 1) In areas of restricted conduit diameter, Energex may use XLPE insulated copper conductors (240 mm2 ).

Figure 1:
Cross-section of typical 11 kV triplex aluminum cable with XLPE insulation

Table 1:
Table 1. Energex current rating for CBD and zone substation feeders.
Energex uses an extensive low-voltage (secondary) system. Their typical secondary cable is a bundled sector shaped stranded aluminum conductor (see Figures 2 and 3).

Figure 2:
Low-voltage cable

Figure 3:
Low-voltage cables emanating (bottom) from the secondary switchboard (from the transformer secondary)
7.4.1.9 - ESB Networks
Design
Cable Design
People
The selection and criteria for network cable design is performed by engineers within the Underground Networks group, part of Assets and Procurement. This group works closely with the Asset Investment group, including the Network Investment groups and Specification groups to specify cable on behalf of ESB Networks.
ESB Networks has developed thorough guidelines for cabling. This guideline includes specific direction for optimizing designs.
Note that in addition to the Assets and Procurement and Asset Investment groups, the Asset Management organization consists of Program Management, Infrastructure Stakeholder Management, Operations, and Finance & Regulation. These groups work closely together to manage the asset infrastructure at ESB Networks.
Technology
While the focus of the practices immersion was on distribution, some information about HV cables is presented here.
Transmission/Sub-transmission
ESB Networks operates transmission cables at three primary voltage levels – 220 kV, 110 kV, and 38 kV, which are used primarily as sub-transmission (see Figure 1).

Figure 1:
HV cable used by ESB Networks
For HV cables (110 kV and 220 kV), much of the in-service plant (42 percent) has been installed over the past seven years, including cable replacement.
At 110 kV, 77 percent of the in-service cable is XLPE insulated cable, 14 percent is fluid filled cable, and 9 percent is gas filled cable.
At 220 KV, 53 percent of the in-service cable is XLPE insulated, with the remaining 47 percent fluid filled.
At 38 kV, 86 percent of the in-service cables are XLPE insulated cables, with 11 percent fluid filled, and 3 percent paper insulated (PILC). Note that the 38-kV sub-transmission system that supplies the MV feeders serving Dublin is a meshed system. This meshed approach was chosen for added reliability – if ESB Networks loses a substation, it can close a bus tie and feed the rest of the bus from the remaining unit. Note that if the company takes out a 38-kV cable for service, ESB Networks must also take out one of the substation banks because of the short circuit duty.
To prevent circulation among the transformers, the transformers are interconnected with communications to form a transformer “team,” with one transformer considered the “master.” As its voltage varies, the other transformers (slave units) follow suit by changing taps to match the master. Operators have the ability to reconfigure the master-slave configuration to develop new transformer teams as necessary to deal with abnormal situations.
Distribution
For MV (distribution) cables, about 34 percent of the in-service plant has been installed over the past seven years, including cable replacement.
At 10 kV, about 78 percent is XLPE insulated (the current standard) round aluminum conductor with a durable jacket, 20 percent is paper insulated (PILC), and the remainder, 2 percent, is unknown.
At 20 kV, all in service cable is XLPE insulated. Note that the in-service PILC cables and older (pre-1981) XLPE cables are not convertible to 20 kV (water treeing).
ESB Networks reports extremely good performance from their XLPE insulated cables, noting that they haven’t experienced a cable failure unrelated to a dig in or joint failure since 1982.
7.4.1.10 - Georgia Power
Design
Cable Design
People
The specification of cable used in the urban underground networks supplying metropolitan area customers in Georgia is the responsibility of the Principal Engineers within the Network Underground group. The Network Underground group, led by the Network Underground Manager, consists of engineering, construction, maintenance and operations resources responsible for the network underground infrastructure at Georgia Power. It is a centralized organization, responsible for all Georgia Power network infrastructure.
The Network Engineering group, led by the Network Underground Engineering Manager, is comprised of Engineers (Electrical and Civil) and Technicians concerned with the planning, design, and any service issues associated with the network, including cable design.
Georgia Power has a Standards Group that has developed cable specification standards for spot, primary, secondary, and substation designs used in the network underground. Standards were first documented and codified in the 1970s, and they include what was already documented on the network from the 1940s and any new standards developed since then. It is a living document, and the responsibility of the Standards Group comprised of principal engineers in the Network Underground group. Standards are available in both an online and printed book format.
The Georgia Power Underground group is responsible for cable standards for all duct line and manhole systems at Georgia Power. (non-ducted manhole system standards are managed by a separate group, not part of the Network Underground group) The Network Standards book contains specifications on cables, splices, racking, and duct line and vaults. The document is kept up-to-date by the Standards group and is available online and in printed form.
Process
Cabling and associated materials can be selected during the design phase or during maintenance and repair using the Network Underground Specifications book, many with reference or model drawings to help insure that standards are met.
The standard primary feeder cables for new construction are 1000 MCM, EPR insulated cable for use in 6-inch ducts and 350 MCM reduced diameter EPR cable in 4 inch ducts. In downtown Atlanta the network system is constrained by an existing 4-inch conduit system. This limits the selection of cables that can be used. Wherever possible, the group is using 350 MCM, EPR cable with a compact flat strap neutral design.

Figure 1:
EPR Cable
Georgia Power utilizes lead cable in their network. They are not aggressively trying to reduce the amount of lead cable, but are replacing lead with EPR insulated cables when opportunities arise. Some PILC is still being installed, in order to match existing cable and in order to maintain crew skills in splicing PILC.

Figure 2:
PILC Cables
Georgia Power has had good success with their lead cable system - they find it reliable, compact, and it suits the legacy duct and conduits in its system. Georgia Power uses 3-conductor compact sector (300 mcm, 200 mils) PILC cable in these instances.
Another constraint (beyond the limitations of the existing duct system) to moving from lead to EPR is the space needed for Y-splices on the walls of manholes. Some manholes do not have enough room for racking they EPR Y-splices for 20 kV,, so lead is still the most reliable and space-saving option in those cases. Where EPR is used, the group is moving to a cold-shrink instead heat-shrink joint, as it is difficult to control uniform temperatures for the application of heat-shrink.
Technology
Georgia Power has recently installed a new online material system (“Maximo”) that tracks cable and materials available in the warehouse by a commodity number. Cable stock is regularly rotated in the warehouse. The software can also track and house maintenance records from inspections and trouble tickets, and generate work packages based on predefined triggers.
Georgia Power utilizes cable tags in the field, including tagging all primary cables and services going to customers. They do not tag the street mains.
7.4.1.11 - HECO - The Hawaiian Electric Company
Design
Cable Design
(Cable and Splice Design - 600 Amp connector systems)
People
The Technical Services Division within the Engineering Department at HECO has significant experience with cable and cable system design. It is the Technical Services Division that maintains and establishes cable standards for the region, and performs root cause analysis on splice, connector and cable failures.
HECO has a distinct C&M Underground Group that focuses on urban UG facilities on O’ahu. This group, made up of Cable Splicers, does all of the lead work on the island, including all transition splices.
HECO also has construction and maintenance (C&M) groups that are comprised of lineman that work with both overhead underground facilities. These groups will work on non - lead cables (poly cables), including making up poly (pre molded) splices. These groups do most of the work in URD areas and on HECO’s 12 kV distribution system.
Process
HECO’s current standard for cable is XLPE, with 1000 Kcmil Al, 1 conductor typically used for main runs. HECO does have a significant amount of Paper Insulated Lead Cable (PILC) cable installed, as this was their standard in the past. They also have some HMWPE (High Molecular Weight Poly Ethylene) cable installed.
HECO is no longer wiping lead splices with the exception of their 46kV gas filled lead cable system. In all other splices involving lead cables, HECO is using a hot shrink transition splice from lead to XLP.
For non-lead splicing applications, HECO is using a poly splice (Pre-molded splice).
Technology
HECO’s underground system is designed using separable connectors, with “T” bodies being used for inline junctions and “Elbows” being used for taps. In vaults where space is limited, HECO will utilize a “Vault Stretcher” which still enables the ability to tap off the connector, but takes us less space than a traditional T connection.


Figure 1 & 2:
Separable Connectors

Figure 3:
Separable Connectors – Vault Stretcher
HECO is using a hot shrink transition splice when transitioning from lead to XLP.
For non-lead splicing applications, HECO is using a poly splice (pre-molded splice).
7.4.1.12 - National Grid
Design
Cable Design
People
National Grid has an up-to-date underground construction standard for cables. This standard was developed and maintained by the Distribution Standards department, part of Distribution Engineering Services. Distribution Engineering Services is part of the Engineering organization, which is part of the Asset Management organization at National Grid. Within the Standards group, National Grid has two engineers that focus on underground standards.
Process
National Grid does not perform any initial acceptance test before installing new cables (beyond the acceptance testing performed by the cable manufacturer as part of the purchasing contract.) They have experienced good cable performance.
National Grid places primary cable tags at each access point, such as a manhole or vault, and at every termination.
Technology
National Grid’s network system is comprised of both paper insulated lead (PILC) primary cables and EPR insulated primary cables serving their 13.2 KV grid network and 34.5 KV spot network system in Albany. EPR insulation is their current standard for medium voltage cables.

Figure 1:
Primary PILC cables and joints
For network underground secondary cable, National Grid uses lead and EPR insulated (current standard) conductor with a cross-linked heavy-duty black chlorosulfonated polyethylene (Hypalon) jacket.

Figure 2:
Secondary cables
Current primary standard cables used for the Albany network are 1000 cu, 750 cu, 500 cu, and 350cu.
For network secondary, they use 500 Kcmil Cu mains, and 500 Kcmil, 4/0 and #2 Cu for services.
National Grid Albany uses arc proof tape in its network system, applying it to all cables and splices in network manholes.
7.4.1.13 - PG&E
Design
Cable Design
People
PG&E’s network system is comprised of paper insulated lead (PILC) primary cables serving their 12kV networks, XLPE insulated primary cables serving their 34.5kV networks, and newer EPR insulated cables spliced to lead cables where they must make dead front terminations. Newer 35 kV network cables are insulated with EPR.
All Cable Splicers are trained to prepare lead splices. However, much of the experience in doing so resides in the San Francisco and Oakland Underground departments, where splicers have an opportunity to practice lead splice preparation with some regulatory. Outside of the cities, most splicer work with lead involves the preparation of transition joints (outside the network, PG&E is transitioning away from lead cables). When the need arises to prepare lead splices outside the city arises, PG&E may send more experienced resources from the San Francisco or Oakland UG centers to perform the work.
Cable specifications are prepared by the Cable Standards engineer within the Standards Department.
PG&E does maintain a record of their cable assets. However, their asset data is incomplete. They record cable sizes and location of transition joints. They do not have a record of the splice manufacturer or the date the splice was installed.
Process
PG&E continues to use lead as their standard primary cable standard for their 12kV network primary, as it is highly reliable. In the network, when PG&E replaces a piece of cable, they may replace lead cable with lead cable or they may replace lead with EPR cable. The decision depends on a number of factors including the size of the manhole (there may not be room, for example, to properly install a cold shrink transition joint), the need to terminate on dead front equipment, and duct size. Note that 750 cu EPR with a flat strapped neutral is sometimes used as replacement for PILC cable where duct size is limited.

Figure 1:
Primary Cables being prepared for transition to EPR cable

Figure 2:
Primary Cables
Note that PG&E’s actively pursuing lead replacement in their radial systems.
PG&E has a vendor alliance in place with a particular cable company for much of their network cable.
PG&E does not perform any initial acceptance test before installing new cables (beyond the acceptance testing performed by the cable manufacturer as part of the contract.) They have experienced good cable performance.
Technology
Current standard cables used for the PG&E network are 750 cu, 500 cu, 250 cu, and #2 cu PILC cables at 12 kV, and 1100 Al, 600 Al , and 1/0 Al XLPE or EPR (more recent standard) cables at 35 kV.
For network secondaries, they use 1000 cu for transformer ties, and 250 or 500 Cu EPR cables for the street mains.
7.4.1.14 - Portland General Electric
People
Three Distribution Engineers cover and design the underground network, including cable design. The Distribution Engineers are not based in the Portland Service Center (PSC) or CORE group but have direct responsibility for the network and work closely with the CORE. The Eastern District Central Supervisor, who reports to the Manager of Distribution and T&D Standards, oversees these engineers.
The Distribution Engineers develop and maintain the standards for the network, which are forwarded to the Standards Department for inclusion in company standards documents. For example, Network Engineers developed the cabling rating standards for the network. Distribution Engineers assume responsibility for network standards as they have the expertise specific to network equipment.
Process
PGE generally uses flat strap EPR 500 MCM copper medium-voltage cables in its network, as three triplexed conductors fit into its 3.5 in. (8.9 cm) diameter clay conduits. In certain applications, the company uses a reduced insulation 750 MCM copper cable that fits into 4 in. (10 cm) conduits. For taps into a network vault, PGE typically uses 1/0 copper cables. PGE has lead cable installed in both its network primary and secondary. The company has a proactive effort underway to replace primary lead cables with EPR insulated cables in its network primary as opportunities arise.

Figure 1:
Cables feeding into vault from duct bank
PGE uses transition, cold shrink, and heat shrink joints for transitioning from PILC to EPR. Splices are “pressed,” as field crews have more confidence in compression connections than in shear bolt technology. Note that with the EPR cable systems, PGE is trialing the use of bolted Energy Services Network Association (ESNA) style connections, such as Y and H connections.
Engineers use modeling tools to keep track of cable ratings and CYMCAP to determine cable ratings. The Transmission and Distribution Planning and Standards Department has developed peak cable rating guidance that specify the allowable normal and emergency loading for all cables on the network. PGE is improving its processes for documenting and standardizing equipment and procedures on the network, including cable ratings.
Engineers use modeling tools to keep track of cable ratings and CYMCAP to determine cable ratings. The Transmission and Distribution Planning and Standards Department has developed peak cable rating guidance that specify the allowable normal and emergency loading for all cables on the network. PGE is improving its processes for documenting and standardizing equipment and procedures on the network, including cable ratings.
To isolate areas of the distribution system where cables may overload, Planning Engineers use CYMEDIST for the radial system and PSSE for the network. Using base case models and seasonal loading data, under different contingencies, engineers can ensure that lines do not exceed 67% of their normal seasonal thermal rating on the radial system, which translates to two-thirds of the normal capacity for a standard feeder. On the network, base loadings specify that no line should load at over 88% on the network. Any areas of concern are prioritized for equipment upgrades [1].
Distribution Temperature Sensing (DTS): In PGE’s DTS pilot, the company installed real-time line sensors on six network feeders to provide temperature readings for underground cables at two-second intervals. Because temperature influences capacity, the sensors may show where system upgrades may be required. In addition, the system could allow PGE to locate hotspots that indicate a potential cable failure. PGE has included the DTS in the new substation intended to begin operation in 2018-2019 [2].
Technology
Cable Standards
PGE has had few cable-related issues on the network, and part of that is related to a comprehensive specification for its standard 15-kV EPR jacketed concentric neutral cable with a flat strap neutral. This cable specification covers various sizes, including 0.39-, 0.59-, and 0.79-in2 (500-, 750-, and 1000-kcmil) copper-jacketed—all used on PGE’s network. The specification defines quality expectations, including that the cable design conforms to industry standards and specifications. For example, the center conductor is copper wire processed under ASTM B3, ASTM B496, and ICEA S-94- 649-2013, Part 2. The moisture barrier, outside diameter of the central conductor, and the conductor shield conforms to ICEA S-94-649-2013.
The concentric neutral conductor is flat-strap copper and able to handle a neutral fault current capacity of 18,000 A for 12 cycles at a maximum 221°F (105°C) normal operating temperature. The cable jacket is non-conducting black, polypropylene, or thermoplastic rubber.
PGE’s cable specification also includes requirements for cable delivery to assure reliability, such as the use of steel cable reels, cable end caps, and factory-installed pulling eyes, which act as a common eye for all three phases of the triplexed cable set and have a maximum working strength equal to the sum of the maximum allowable strengths for each of the center conductors of the triplexed cable set [3].
- Derek Harris. 2014. PGE Stephens Network System Split Report, internal document.Derek Harris. 2014. PGE Stephens Network System Split Report, internal document.
- Smart Grid Report. Portland General Electric, Portland, OR: 2017. http://edocs.puc.state.or.us/efdocs/HAQ/um1657haq16327.pdf (accessed November 28, 2017). Portland General Electric. From L20506 15-kV EPR Jacketed Concentric Neutral Cable, internal document.
7.4.1.15 - SCL - Seattle City Light
Design
Cable Design
People
Organization
Network Design, including specification of cable types, at SCL is performed by the Network Design Department, which is part of Energy Delivery Engineering. See Attachment A. The Network Design Department performs all planning and design of SCL’s networks.
The Network Design Department is made up of eight “System” engineers, who do all of the design for the network, and eight “Services” engineers, who interface with the customers, gather load information, coordinate construction activity, etc. The individuals in this group are four-year degreed engineers. Some have their PE licenses.
The engineers at SCL are represented by a collective bargaining agreement (IBEW, Local 17).
Process
The majority of installed cables at SCL are Crosslinked Polyethylene [XLP] insulated cables. Ethylene Propylene Rubber (EPR) cable is used for all new construction at 13kV. SCL does have Paper Insulated Lead Covered [PILC] cable installed as well, comprising 8% of their installed plant.
Cable Rating
SCL rates cables at 90 ˚ C; that is, they develop a cable ampacity rating that limits the conductor heating to 90 ˚ C. SCL does not develop an emergency or 24-hour rating for feeders. They plan their system to the 90 ˚ C limit.
SCL develops feeder specific ratings based on field conditions. Using software, they develop ampacity ratings for circuits that consider factors such as cable type, duct bank configuration, soil resistivity, proximity of foreign utilities, design temperature (90 ˚ C), load factor (80%), etc. SCL performs both a summer and winter analysis. The summer ratings, which are the most conservative, are typically used for planning purposes.
SCL re-rates cables any time conditions in the field change that could affect cable rating, including the addition of another parallel circuit, the addition of a foreign utility such as a steam line, a new cable in the duct bank, etc.
The specific cable ratings are entered into the load flow software for planning analysis.
7.4.1.16 - References
EPRI Unde rground Distribution Systems Reference Book (Bronze Book)
7.4.1.17 - Survey Results
Survey Results
Design
Cable Design
Survey Questions taken from 2018 survey results - Asset Management
Question 6 : Please indicate the percentage of each cable type that comprise your network primary (MV) cable system


Question 7 : Please indicate the percentage of each cable type that comprise your network secondary (LV) cable system


Survey Questions taken from 2015 survey results - Summary Physical/General
Question 26 : Please indicate the percentage of each cable type that comprise your network primary cable system (total should equal 100%)

Question 27 : If you entered other for the previous question, please specify other conductors and percentages.

Question 28 : For primary cable, which of the following do you utilize (current standards)? (check all that apply)

Survey Questions taken from 2012 survey results - Summary Physical/General
Question 2.9 : Please indicate the percentage of each cable type that comprise your network primary cable system

Question 2.10 : For primary cable, which of the following do you utilize (current standards)?

Question 2.11 : Do you use low smoke zero halogen cable in your secondary?

Survey Questions taken from 2009 survey results - Summary Physical/General
Question 2.5 : Please indicate the percentage of each cable type that comprise your network primary cable system (this question is 2.9 in the 2012 survey)

7.4.2 - Cable Limiter Application
7.4.2.1 - AEP - Ohio
Design
Cable Limiter Application
People
The specification for using Cable Limiters in the AEP Ohio networks supplying metropolitan customers in Columbus and Canton is the responsibility of the Network Engineering group. This group, led by the Network Engineering Supervisor, has direct responsibility for all aspects of network design for AEP Ohio, and provides a consultative support role to the other AE operating companies. Organizationally, the Network Engineering group is part of the corporate Distribution services organization, geographically based in downtown Columbus at AEP Ohio’s Riverside offices, and ultimately reporting to the AEP Vice President of Customer Services, Marketing and Distribution Services. Distribution Services supports all AEP network designs throughout its operating companies, including Texas, Indiana, Michigan, Oklahoma, and other locations.
AEP also has a Network Standards Committee, headed by the lead Network Engineering Supervisor in its downtown Columbus offices, and comprised of representatives from all AEP operating companies. This group works closely with the parent company’s Distribution Services organizations, and holds regular teleconference sessions on network findings, “lessons learned” in the field, and discusses potential network engineering solutions to common network design and implementation issues such as cable limiter application.
Process
AEP Ohio’s cable limiter placement approach conforms with guidance detailed in the “Westinghouse Book.” AEP Ohio uses cable limiters on all its 480 secondary networks, at both ends of the mains. The company also uses limiters in 216-V networks on cables sizes 250 MCM and above (though faults at 216 V will self-clear). AEP uses the “Bussman” type cable limiters (see Figure 1).

Figure 1:
Cable limiter used by AEP Ohio
7.4.2.2 - Ameren Missouri
Design
Cable Limiter Application
People
Design of the urban underground infrastructure supplying St. Louis, both network and non- network, is the responsibility of the engineering group within the Underground Division, organizationally part of Energy Delivery Distribution Services, reporting to a VP. The Underground Division is led by manager, and consists of both engineering and construction resources responsible for the downtown infrastructure. The engineering group, led by a supervising engineer, is comprised of Engineers and Energy Services Consultants (commonly referred to as Estimators) who deal with planning, design, and service issues.
Engineers design the system, including the application of cable limiters. All of the engineering positions are four-year degreed positions. Some engineers within this group have their PE licenses, although this is not a job requirement. Engineers are not represented by a collective bargaining agreement.
Recently, Ameren Missouri has formed the “Underground Revitalization Department,” a team of engineers (all 4-yr degreed) focused on researching, evaluating, and developing plans for performing capital improvements to and revitalizing downtown St. Louis, including the network. Part of this group’s role includes addressing issues such as the development and update of planning criteria for the network, and the design of enhancements to the downtown area, including the replacement of deteriorated ceiling mounted secondary bus bar designs, with alternate designs, such as ring buses, and crab connections.
Ameren Missouri has a documented cable limiter application standard (See Attachment A ).
Process
Ameren Missouri uses standard link type limiters on each end of their 500 copper secondary mains from ring bus to ring bus, and between transformers and the ring bus.
Ameren Missouri uses high-capacity silver sand (bussman type) limiters on both ends between the ring bus and customer services.
For 480V spot network locations, Ameren Missouri uses silver sand fuses between the network protectors and the secondary collector bus.
In the network secondary, Ameren Missouri currently has historically used secondary ring bus designs in manholes and ceiling mounted secondary bus bar designs located within secondary service compartments, which are 8x8 vaults. The ceiling mounted structures are difficult to maintain, as it is difficult to insulate the overhead bus work. The bus work makes it difficult or impossible to repair deteriorated ceilings. Ameren Missouri is presently piloting the use of crab connections moving forward as a replacement to the service compartments, as these connections enable the bus work to be moved off of the ceilings. All structures are inspected once every 4 years. Any that are identified with bad ceilings are considered with replacement with crab connections if there is room.

Figure 1:
Network Crab in manhole
For new designs, engineers within the underground department decide whether to use a secondary ring bus or crab connector. At the time of the immersion, the Ameren Missouri network revitalization team was considering using the crab connection approach with smart limiters going forward.
Technology
Ameren Missouri is piloting the use of a network crab that is made by TYCO. This particular crab connection comes with smart limiters. These limiters are used to connect cables onto the crab connection (using a shear bolt connections) and have plastic tubing so that the status of the limiter can be ascertained visually.
7.4.2.3 - CEI - The Illuminating Company
Design
Cable Limiter Application
People
The design of the network ducted manhole system, including the application of cable limiters, is performed by the CEI Underground / LCI group (Design Group), part of the CEI Regional Engineering group, located in NRHQ (Northern Region Headquarters).
The group’s responsibilities include network system and non – network system designs and the development of standards for the ducted manhole system including vault and manhole design standards and customer design standards.
Process
CEI utilizes cable limiters in their network secondary system in Cleveland. Much of the system was installed many years ago, and was designed using “mole limiters” on each end of the secondary mains that run from the network transformers to the first secondary mole, and at most junction points. Historically service taps were not protected by limiters; however, FirstEnergy’s current policy does call for cable limiters on all service taps. Any new installations follow the current FirstEnergy application policy.
The “mole limiter” is a unit installed in the cable that includes a fusible element, a high temperature filter shell, and an insulated sleeve. Cable limiters are designed to interrupt the circuit before the cables carrying a fault current are visually damaged, and to isolate the damage to the section of cable where the fault occurred.
CEI replaces limiters in kind if they encounter them in performing secondary network work. They acknowledge that they may have blown limiters in their secondary network system of which they have no knowledge.
First Energy has a documented practices guide for the installation of cable limiters, See Attachment - C . This policy applies whenever secondary cables are being added or replaced to a network secondary system.
The policy indicates that:
For Secondary Mains & Branches:
-
cable limiters shall be placed on both ends of all paralleled cables in looped secondary circuits
-
cable limiters shall be placed on the source end of all radial secondary circuits with one or two cables per phase.
-
cable limiters shall be placed on the both ends of all radial secondary circuits with three or more cables per phase.
-
cable limiters shall be placed on both ends of all transformer tap cables
For Service:
-
cable limiters shall be placed on the source end of all services with one or two cables per phase.
-
cable limiters shall be placed on the both ends of all services with three or more cables per phase.
Limiters are not required on cable lengths of less than eight feet if both ends of the cable are within the same enclosure.
Technology
See Attachment - D , for a copy of the FirstEnergy Material specification for cable limiters.
FirstEnergy is presently considering using a “see through” limiter to provide a visual indication of whether it is blown.
7.4.2.4 - CenterPoint Energy
Design
Cable Limiter Application
People
The design of the network ducted manhole system, including the application of cable limiters, is performed by the Engineering Department of the Major Underground Group.
The Vaults subgroup normally designs new services and secondary taps from spot network secondaries supplying the grid.
CenterPoint does not have a written cable limiter application policy.
Process
All points feeding the secondary network grid are protected by cable limiters. CenterPoint uses cable limiters any time they attach cables to the secondary bus. For example, in situations where they will supply the network secondary grid from a secondary collector bus in a vault, cable limiters would be used. Limiters are sized according to cable size.
CenterPoint also requires the use of cable limiters for cable services to customers. In these cases the customer provides both the cable and appropriately sized limiters. (Note that in most cases, customer services at CenterPoint are comprised of bolted attachments of customer bus bar to the CenterPoint secondary collector bus, rather than cables. Limiters, of course, are not used in these bus bar attachments.)
During Vault inspections, Network Testers will perform secondary cable continuity checks (Tong the secondary cables) to assure that the cable limiters are in tact. CenterPoint replaces limiters in kind if they encounter them in performing secondary network work.
Technology
CenterPoint uses the sand type cable limiters (Bussmann) as shown in the photographs below.

Figure 1:
Cable limiters applied to secondary bus

Figure 2:
Cable limiters applied to secondary bus, supplying street grid
7.4.2.5 - Con Edison - Consolidated Edison
Design
Cable Limiter Application
Process
Con Edison utilizes cable limiters in their network secondary system in New York. Cable limiters are designed to interrupt the circuit before the cables carrying a fault current are visually damaged, to isolate the damage to the section of cable where the fault occurred.
Con Edison does not have a good method of ascertaining whether or not cable limiters have blown. Utility crews take a current reading and use a device that puts a signal on the secondary, but these methods are not trusted by all the work groups at Con Edison.
Con Edison has asked three different manufacturers to develop a new limiter design that provides fault indication and can be quickly replaced. For example, one manufacturer has developed a cable limiter with a clear covering so that the user can see that the device is open. Con Edison is currently evaluating this product.
Technology
Con Edison is using cable limiters in both 216/125V and 480/277 V applications.
7.4.2.6 - Duke Energy Florida
Design
Cable Limiter Application
People
Standards for network design, including the application of cable limiters to the system, are the responsibility of the Duke Energy Florida Standards group, which oversees all standards for distribution equipment and materials. One Engineer within the group oversees all network equipment standards for Duke Energy Florida. This engineer is an Electrical Engineer, a requirement for the engineer who specializes in Network Standards. The engineer also has a PE license, a requirement to obtain certain levels within the engineer family.
Duke Energy has a Corporate Standards committee which focuses on developing common standards throughout the Duke Energy family of companies. Across the Duke Energy family of companies, there is a core Network Group of four or five members within the broader Standards groups that assist each other and collaborate on choosing all material and specification standards for the underground network throughout the company, including Florida. This core underground team draws on members from across the Duke Energy operating companies. The Design Engineers are engaged in a Duke Energy corporate-wide process to consolidate design standards for network systems among the various Duke operating companies, due to be finalized in 2017.
The Duke Energy Florida standards department has developed a Distribution Engineering Manual section on Secondary Networks, which provides information on cable limiter placement and coordination. See Attachment C.
Process
Duke Energy Florida does use cable limiters in its network secondary (see Figures 1 and 2). Cable limiters are installed at each secondary junction on the secondary mains on the outgoing secondary cable. In addition, cable limiters are installed at all service connections. Duke Energy Florida uses full section limiters on the street main secondary grid. Half section limiters are used on service connection junction points and are sized to match the conductor size. This is to ensure a service conductor fault will be isolated before damaging the secondary main and associated limiters. Limiters are sized such that when a primary fault occurs, the primary protection should clear before any limiters blow. For a secondary fault, the limiters should clear the fault before the network protector fuse opens. Based on past experience, the limiters behave as anticipated.

Figure 1:
Cutaway of a link style cable limiter

Figure 2:
Cutaway of link style cable limiters. Full section limiter in the foreground and half section limiter in the background
Technology
Duke Energy does not record the location of limiters in its GIS system, but does show the location of cable limiters in its manhole drawings and supporting detail sheet (see Figure 3). See Attachment E for a sample manhole drawing and supporting detail sheets, showing the location of cable limiters.

Figure 3:
Excerpt from manhole drawing – note limiters

Figure 4:
Secondary cables mounted on cable racks. Note cable limiters attached to the moles on the racks
7.4.2.7 - Duke Energy Ohio
Design
Cable Limiter Application
Technology
Duke Energy Ohio currently does not employ cable limiters in their network secondary. Their network is relatively compact, with a sizable fault duty. They have historically relied on this high fault duty to burn the cables clear in a fault. This worked effectively for their lead secondary system, as lead tends to separate and not smolder.
Note that going forward, their new standard is to use EPR insulated secondary cables. Duke is systematically replacing old mainline sections of the network with EPR insulated cable. They continue to rely on the high fault duties to burn the cables clear in a fault, but are interested in exploring new cable limiter technology.
7.4.2.8 - Georgia Power
Design
Cable Limiter Application
People
Network standards, including standards for cable limiter application, are the responsibility of the Standards Group and the Network Underground design engineers. These engineers are part of the Network Engineering Group, or principal engineers that report directly to the Network Underground Manager.
Organizationally, the Network Underground group is a separate entity, led by the Network Underground Manager, and consisting of engineering, construction, maintenance and operations resources responsible for the network underground infrastructure, including the development of standards for network equipment.
Network design is performed by the Network Underground Engineering group, led by a manager, and comprised of Engineers (Electrical and Civil) and Technicians concerned with the planning, design, and any service issues associated with the network. The Engineers are four-year degreed positions, while Technicians have a combination of years of experience and formal education, including two-year and four-year degrees.
Process
Georgia Power does not routinely use cable limiters on its secondary grid system in Atlanta. This system has a fault duty of less than 10000A, and is being slowly phased out in place of spot networks. Georgia power does utilize cable limiters in its Savannah network.
During routine maintenance in Savannah, inspectors will tong the secondary to assure cable limiter continuity. Also, in Savannah, Georgia power has installed monitoring of the secondary in selected manholes. They utilize CT’s to monitor load shift that may occur on the secondary due to an open limiter. This monitoring is tied into operations through SCADA.
Georgia power will use current limiting fuses at the junction point between their system and the customer service down to a 600-A fuse. The fuses are installed to protect the Georgia Power bus from customer faults. Georgia power does not advertise the use of this fusing to the customer, as they provide the actual system duty to the customer, and expect the customer to install adequate protection, and not depend on the CLF.
Technology
Georgia Power is not recording the location of limiters in its GIS system, but does show the location of cable limiters in its vault drawings.
7.4.2.9 - HECO - The Hawaiian Electric Company
Design
Cable Limiter Application
Process
HECO utilizes cable limiters in their network secondary system in Honolulu. Cable limiters are designed to interrupt the circuit before the cables carrying a fault current are visually damaged, and to isolate the damage to the section of cable where the fault occurred.
HECO uses cable limiters on service taps from the street grid. Cable limiters are only used on the customer end of the service if the service terminates in a bus room; otherwise, the service would feed into the customer breaker.
Technology
HECO is using Molimiter type cable limiters in 208/120 V network applications. For 480/277 V spots, they are using sand type limiters (Amp trap limiters). See Attachment - B .
7.4.2.10 - National Grid
Design
Cable Limiter Application
People
National Grid has a documented cable limiter application procedure as part of their underground standards.
Process
Historically, National Grid Albany used cable limiters on network protector leads and on services. More recently. National Grid has been applying cable limiters to street mains in selected locations to assure that the secondary cable system can adequately clear solid faults.
National Grid’s network standards call for all new conductor installations to have limiters installed at each end of cable runs and at junction points. The cable limiters used are standard, non-replaceable type. Sand type current limiters are not used in the street grids.
For services with one or two conductors per phase, National Grid will install limiters on each phase conductor at the origination point. For services with more than two conductors per phase, limiters are installed on both ends of each phase conductor. In this application, National Grid uses link type cable limiters,
For services from spot networks, limiters are installed on both ends of each phase cable. In this application, National Grid uses current limiting (sand type) limiters.
National Grid has performed an analysis of their Albany network to determine the expected performance of network secondary cable circuits during solid type faults in order to identify areas of needed reinforcement in order to improve the fault clearing capability of the secondary system. This analysis resulted in recommendations to install cable sets and cable limiters at selected locations within the network.
Technology
National Grid uses link type cable limiters in their secondary network grid. They do not use current limiting (high capacity) limiters in their street grid or in network protector leads feeding the street grid.
In spot network applications, they will utilize current limiting (Sand Type) cable limiter.
7.4.2.11 - PG&E
Design
Cable Limiter Application
People
PG&E has a documented cable limiter application procedure as part of their underground standards.
Process
PG&E employs cable limiters in their network secondary grid, except for service entrances into buildings and in a few junctions where space is very limited. Where they feed into the street grid from a spot network vault, cable limiters are placed at both ends.
PG&E does not use cable limiters in spot network applications.
PG&E performs cable limiter continuity checks under two conditions:
- In the event of a secondary fault on the secondary grid
- In the event of load imbalances being detected during SCADA system reviews, which would indicate possible blown limiters.
Technology
PG&E uses mostly link type cable limiters, but will use sand type limiters in some 480 V applications.
PG&E has begun using clear limiters (Tyco) for all new and replacement installations. This type of limiter will enable inspectors to identify blown limiters through visual inspection and improves the quality of secondary terminations.

Figure 1:
Clear Limiters (Tyco)
7.4.2.12 - Portland General Electric
Design
Cable Limiter Application
People
Standards, such as those governing the application of cable limiters, are the responsibility of distribution/network engineering, which develops and maintains the standards for the network. Distribution Engineers assume responsibility for network standards (rather than standards engineers), as the Distribution Engineers have expertise with network equipment. Distribution Engineers also provide the loading information used to create CYME and PSSE models. Network standards are forwarded to the Standards Department for inclusion of company standards references.
The Manager of Distribution Engineering and T&D Standards oversees the Standards Department, and its emphasis is the overhead system rather than the network system. The group recently underwent reorganization. It now employs one technical writer and four standards engineers.
Process
PGE uses mole limiters at all junction points in area networks. During vault inspections, crews check cable limiter continuity by tonging the secondary.
Cable limiters are not shown on network maps, such as butterfly drawings, which show vault/manhole details.
Technology Refer to Figure 1.

Figure 1:
Mole limiters
7.4.2.13 - SCL - Seattle City Light
Design
Cable Limiter Application
Process
SCL utilizes cable limiters in their network secondary system in Seattle. Cable limiters are designed to interrupt the circuit before the cables carrying a fault current are visually damaged, to isolate the damage to the section of cable where the fault occurred. SCL does not perform cable limiter continuity checks as part of their manhole maintenance ( manhole drill ) unless there is a specific problem, outage, or other issue that they are following up on. These checks are usually performed as part of the troubleshooting of a problem.
Technology
SCL is using cable limiters in both 208/120 V and 480/277 V applications. Their Network Design criteria call for cable limiters to be installed at both ends of all secondary mains. SCL uses both “sand” type and “link” type cable limiters.
7.4.2.14 - Practices Comparison
Practices Comparison
Design
Cable Limiter Application

7.4.2.15 - References
EPRI Underground Distribution Systems Reference Book (Bronze Book)
Excerpts from Chapter 4, Network Underground
Chapter Section 4.2.10 - Cable Limiters In 208V Area Networks
Chapter Section 4.9.9 - Cable Limiters and Cable Damage Curves
EPRI Low-Voltage Training Material
Fuse and Cable Limiter Coordination
7.4.2.16 - Survey Results
Design
Cable Limiter Application
Cable Limiter
Survey Questions taken from 2015 survey results - Design
Question 65 : Do you use cable limiters in your network secondary system(s)?

Question 66 : If you use cable limiters please indicate where you install them (check all that apply)


Question 67 : If you use cable limiters, do you perform a protection coordination study between the network protector fuse, cable limiters, and the station’s feeder relay?

Survey Questions taken from 2012 survey results - Planning (Question 3.21) and Design
Question 3.21 : Do you calculate minimum available fault current at the fringes of the street secondary network cables (208Y/120 V) to assure self-clearing of street network cable failures?

Question 4.18 : Do you use cable limiters in your network secondary system(s)?

Question 4.19 : If you use cable limiters, do you perform a protection coordination study between the NP fuse, cable limiters and the station’s feeder relay?

Question 4.20 : If you use cable limiters please indicate where you install them

Survey Questions taken from 2009 survey results - Planning
Question 3.13 : Do you calculate minimum available fault current at the fringes of the street secondary network cables (208Y/120 V) to assure self-clearing of street network cable failures? (this question is 3.21 in the 2012 survey)

7.4.3 - Civil Design
7.4.3.1 - Duke Energy Florida
Design
Civil Design
People
Network design is performed by the Distribution Design Engineering group for Duke Energy Florida, which works out of offices in both downtown St. Petersburg and downtown Clearwater. The Distribution Design Engineering groups in Clearwater and St. Petersburg are led by a Manager, Distribution Design Engineering, and are organizationally part of a Distribution Design Engineering Group responsible for Duke Energy Florida’s Coastal region, led by a Director.
Network civil design is guided and supported by the Duke Energy Florida Standards group, which reviews, approves, and publishes civil design standards for underground structures, such as manholes, duct lines, and vaults. Duke Energy Florida has existing, older specifications for pre-cast manholes, but is in the process of merging them with Duke corporate standards. Most new vault or duct line designs are custom built, however. The Standards group maintains documentation of “as builts” and any custom civil designs on the network. Vault and manhole design standards are contained in the “Duke Energy Florida Section 29; Networks, Vaults, and Transclosures.” (See Attachment D ). This document contains manhole standards for various manhole configurations, as well as information about manhole lids and cable racking materials and guidelines.
Process
Manhole civil designs vary depending on the manhole configuration. For example, a three-way manhole has a different shape than does a two way manhole. Most in service manholes were built many years and were poured in place. All network feeders in downtown Clearwater (supplying a true 125/216V network) have their own network cable manholes/duct lines (not shared with Non- network circuits).
The duct bank configuration can vary depending on infrastructure, but a typical configuration is a 3 x 3 duct bank. Duke Energy Florida is consistent in the assignment of duct positions. For example, primary cables (12470 / 7200V) are always pulled through the bottom duct positions. The neutral (Duke Florida does pull a separate neutral) is always pulled through a duct in the same position (duct number five). Secondary cables are run in the upper ducts.
A standard manhole configuration for Duke Energy Florida includes insulated metal cable racks that support cables, with primary feeders located on the lower racks and secondary feeders on the upper racks see Figures 1 and 2). Duke Energy Florida specifies the position of facilities on the cable racks, with positions closest to the wall being the cable ties across the vault, middle positions being the street mains, and outside (away from the wall) being for services. Each manhole has a ground ring around the roofline tied to a driven ground. Every Duke Energy Florida manhole and vault has a driven ground.

Figure 1:
Cables feeding into manhole from duct bank

Figure 2:
Cable racks supporting secondary
Many existing manholes contain three primary feeders in one manhole. The designers realize that placing multiple feeders in one manhole increases the exposure and consequences of an event occurring in that manhole. Thus, for newer designs, designers strive to minimize the number of feeders in any one manhole hole. In underground radial designs, cables are routed to avoid a single-point-of-failure by using looped cables from pull boxes.
Duke Energy uses “mole” connectors for secondary cables and applies cable limiters.
Technology
Duke Energy Florida is investigating the application of self-ventilating manhole systems, though hadn’t installed any at the time of the practices immersion. They noted that their manhole tops are not designed with “lips,” making the installation of a Stabilock style system much more problematic. To add the lip to the existing opening would result in an opening which is too small (29 ½ inches). Consequently, to install self-venting manhole systems that require the lip for retention requires a change out of the manhole roofs, which is a costly effort.
7.4.3.2 - Energex
Design
Civil Design
People
Civil Design is the responsibility of the Network Capital Strategy and Planning Group, part of the Asset Management organization. The Network Capital Strategy and Planning Group is led by a group manager.
Process
The ducted manhole system at Energex is referred to as the “pit and duct” system. Cables installed within the CBD are run in conduits, typically through a multiple position 5X3 nested duct bank. (Outside of the CBD, Energex uses a combination of direct buried cables and cables installed in conduit.)
The duct bank is comprised of orange, light duty PVC conduits, and is not concrete encased, but backfilled using a sand bedding material.
Note that the location of cable installations within Brisbane is in the assigned electricity supply corridor, which is about one meter from the customer property line, within the “footpath.” Figure 1 shows a typical cross-section.

Figure 1:
Example of Energex 11 kV preferred design.
Technology
Cables feeds run in and out of manholes, referred to as “pits.” Pits are normally precast enclosures, with a permanently mounted ladder, but may be poured in place in certain situations. Pit covers are re-enforced steel. Pits are traditionally used by Energex at transition points in the system, such as ingress/egress from buildings, or where conduit runs must go around a corner, cross streets, etc. (see Figures 2, 3, 4, and 5).

Figure 2:
Typical pit cover, located in the footpath

Figure 3:
Pit covers

Figure 4:
Pit, with cover removed (Note permanently mounted ladder on left wall)

Figure 5:
Pit, with cover remove
7.4.3.4 - Georgia Power
Design
Civil Design
People
Decisions about investment in maintenance or repairs of structures such as manholes, vaults, or duct banks are the responsibility of engineers responsible for civil and structural design within the Network Underground Engineering group. This group is responsible for determining inspection approaches for structures, and for developing strategies for responding to inspection findings. In addition, this group develops standards for structure design and repair.
Process and Technology
See Network Design
7.4.3.5 - References
EPRI Underground Distribution Systems Reference Book (Bronze Book)
7.4.4 - Key Accounts
7.4.4.1 - AEP - Ohio
Design
Key Accounts
People
AEP Ohio has Customer Service Representatives that handle all key accounts, including the City of Columbus and the City of Canton governments and public works. Representatives cover key accounts by industry. For example, separate Customer Service Representatives are assigned to public works, manufacturing, major downtown office buildings, etc. They work directly with AEP Ohio’s Network Engineering group. These personnel are geographically based in downtown Columbus at AEP Ohio’s Riverside offices. The Network Engineering group reports to the AEP Network Engineering Supervisor, which is part of Distribution Services, and reports ultimately to the AEP Vice President of Customer Services, Marketing and Distribution Services.
AEP also has a Network Standards Committee, headed by the lead Network Engineering Supervisor in its downtown Columbus offices, and comprised of representatives from all AEP operating companies. This group works closely with the parent company’s Distribution Services organizations, and holds regular teleconference sessions on network findings, “lessons learned” in the field, and discusses potential network engineering solutions to common network design and implementation issues. Key accounts and their specific needs may also come before this committee for discussion and recommendations.
Process
Customer Service Representatives are assigned as key AEP contacts for large projects, such as major new load additions to the network, existing large customers who are adding load, or department of transportation projects which may significantly impact network facilities. On projects that impact he network, Customer Service Representatives work directly with the AEP Ohio Network Engineers that serve the networks in Columbus and Canton. Representatives know exactly which Engineer to contact for their Key Accounts based on the physical location of the account, as the Engineers are assigned a geographic area of responsibility that corresponds to the footprint of their particular networks of responsibility.
The Customer Service Representatives will gather load information and other requirements and supply those to the Network Engineering group, who will be responsible for the ultimate design
7.4.4.2 - Ameren Missouri
Design
Key Accounts
People
Ameren Missouri has a Key Accounts Group that works as a point of contact for major customers. For these customers, all communications flow through these key account representatives.
Ameren Missouri also has a Business and Community Relations group that interfaces with municipal entities.
7.4.4.3 - CenterPoint Energy
Design
Key Accounts
People
CenterPoint has a Key Accounts group focused on managing the largest and most critical of their commercial and industrial customer accounts. While commercial and industrial customers represent a small percentage of the total number of customers served by CenterPoint, they represent a larger percentage of the load.
The Key Accounts group is led by a manager and is comprised of eight Key Account Consultants. Organizationally, the Key Accounts group is part of the Major Underground organization, reporting to the Director. CenterPoint made the decision to place this group within Major Underground because a large portion of their key accounts are fed by the dedicated[1] major underground system. However, the Key Accounts group also interfaces with major customers who are served from overhead distribution and with the CenterPoint overhead Service Centers who serve them. Note that CenterPoint has a separate group that interfaces with key transmission accounts.
The Key Account Consultant is a senior level position at CenterPoint. Candidates for this position are typically seasoned people who have utility experience and know the CenterPoint organization well. The manager believes that candidates from different company backgrounds – engineering, operations, and customer services, can make good Key Account consultants.
CenterPoint also has a position called a Service Area consultant. These individuals work with smaller customers and are situated out in the overhead service centers, not part of Major Underground. Many projects to serve customers through three phase padmount transformer installations work through the smaller Service Area consultants rather than the Key Accounts group.
The Key Accounts group reports that they have a strong relationship with Engineering, and that the organizational alignment with Major Underground is working well. EPRI researchers noted a strong working relationship as well.
The Key Accounts group received a high customer services rating in a 2007 JD Power Customer Satisfaction Survey.
[1] The term “dedicated” underground at CenterPoint refers to three phase infrastructure is located entirely underground in their ducted manhole system. A dedicated network feeder does not mean that the feeder serves only a network. Rather, it refers to a feeder that is entirely underground. In fact, at CenterPoint, feeders that supply the underground network also supply radial load along the way. CenterPoint has 129 dedicated underground feeders of 1329 total feeders.
Process
The positioning of the Key Accounts group within Major Underground works well at CenterPoint. The Key Accounts consultants can easily interface with the Major Underground field groups, and support construction and maintenance projects by interfacing with the customers, scheduling major construction activities, arranging for scheduled outages, and communicating with customers during unscheduled outages.
The Key Accounts group provides project coordination for new projects, and stays current with the happenings / growth at key commercial customers such as medical centers, municipalities, and universities. They also provide a single point of contact for large national retail chains. They are involved in power quality and reliability issue resolution, relocations, and long term O&M rehab projects. They also interface with governmental agencies. For example, they are working on a process to interface more effectively with FEMA. As one CenterPoint Key Accounts Consultant phrased it, “We represent the interests of the customer within the company. The file never closes.”
CenterPoint has established and published unique telephone numbers to facilitate customers contacting CenterPoint representatives. Each major customer is provided with a card with the contact information printed on it. The larger Key Accounts have the personal contact information of their Key Accounts Representative, including cell and pager number.
Smaller commercial customers have access to a phone number during the day (8-5) that will direct them to an experienced call center representative. Between 5 and 8 pm, these calls will be forwarded to one of the Key Accounts Consultants who “cover” this three hour window using a duty rotation. At night, major customers have a dedicated 800 number to contact the company. If a customer needs help, one of the Key Accounts consultants will call them back.
Each Key Accounts Consultant has a data base of contacts that they send the number to. In advance of the summer storm season, the Key Accounts Consultants will contact their accounts and remind the customer of who the account rep is and the appropriate numbers to call.
For new or upgraded service projects, the Key Accounts Consultants will meet with the customer to understand what their needs are, and to understand their bounds. They will interface between Engineering and the customer to assure that the needs of both are met.
Technology
Key Accounts Consultants need to know about the technologies being employed by their customers in order to keep up with their practices and policies.
Key Accounts Consultants are also familiar with CenterPoint’s MV90 meter reading system for recording 15 minute demand information.
The Key Accounts group is presently working on a state mandated flagging system that will prevent an inappropriate disconnect of a certain critical loads ranging from major hospitals to traffic signals.
[1]The term “dedicated” underground at CenterPoint refers to three phase infrastructure is located entirely underground in their ducted manhole system. A dedicated network feeder does not mean that the feeder serves only a network. Rather, it refers to a feeder that is entirely underground. In fact, at CenterPoint, feeders that supply the underground network also supply radial load along the way. CenterPoint has 129 dedicated underground feeders of 1329 total feeders.
7.4.4.4 - Con Edison - Consolidated Edison
Design
Key Accounts
People
The Energy Service Organization at Con Edison has various subsections that interface with customers, including the Service Assessment team, Engineering, Layout, and Project Management.
Service Assessment Team
The Service Assessment Team interfaces with the customer or contractor and prepares the load letter, which details the customer work request and scope of the work. They ensure that the load letter includes critical data such as type of use, commercial or residential, information on the number of units, etc. They create a project within a computer system (Commercial Operations Reporting System — CORS) used to track each project. The request then flows to Engineering.
Project Management
Energy Services has two project manager positions — the CSR Project Manager, who manages smaller projects less than 1000 kW, and the CPM Project Manager, who manages larger projects, 1000 kW and greater.
For larger projects, the CPM Project Managers receive the layout and issue work orders to construction management (for contracted work) and electric operations to execute the project. They ensure that the customer gets service on time. They coordinate dates, check the customer’s work to make sure it makes sense, ensure that the termination points are adequate, obtain city approvals, etc.
7.4.4.5 - Duke Energy Florida
Design
Key Accounts
People
Duke Energy Florida assigns Large Account Managers to its larger commercial and industrial customers. The Large Account Management group is part of the Customer Service organization, reporting to a Senior Vice President. The supervisor of the Network Group maintains close communications with large account managers.
Technology
Duke Energy Florida has installed DSCADA at about 70 ATS locations (Automated Transfer Switches). At these locations, if there is an operation, an alarm would be sent to the DCC, and a text message alarm would be sent to a preselected distribution list, including the Large Account Managers. These Managers will let their customers know that there was an operation, and that they are now being serviced by the reserve feeder.
7.4.4.6 - Duke Energy Ohio
Design
Key Accounts
People
Duke has Key Account representatives assigned to its largest customers. These individuals back as the interface between Duke and the customer. Many of the operational issues surrounding network customers are ultimately addressed by and resolved by the two Customer Project Coordinators (CPCs)_and Project Engineer focused on the network within the Distribution Design organization.
In addition, the two CPCs act as “key contacts” for customers other than major customers. These individuals respond to customer issues, and per for scratch that and perform all distribution design work for Duke’s Cincinnati network.
The Designers are two-year degreed engineers.
7.4.4.9 - Georgia Power
Design
Key Accounts
People
Georgia Power has key account managers within its Marketing group that work as a single point of contact for major customers. For these customers, all communications flow through the key account manager. It is not uncommon during the design, construction, and implementation phases for senior engineers within the Network Underground group to work directly with these key accounts, including site visits before and during construction.
Georgia Power also has Community Relations resources who interface with municipal entities.
Process
Georgia Power has developed a guideline that details the steps to be considered for any new large business project. Steps include activities early in the project life cycle such as determining the project scope, gathering load information and performing preliminary engineering; activities to design and construct the new service including completion of design drawings, securing of permits, work order approval and construction support; and activities post construction, such as documentation of as built conditions, and quality assurance. See Attachment B for an outline of project requirements to be considered.
7.4.4.10 - HECO - The Hawaiian Electric Company
Design
Key Accounts
People
HECO employs Account Managers within the Energy Solutions Department of the Marketing Service Division. These Account Managers routinely interface with customers. For example, they will notify customers of planned interruptions.
7.4.4.11 - National Grid
Design
Key Accounts
People
National Grid has a Customer Order Fulfillment group that works with customers to manage the progress of projects through their life cycle. The consumer representatives within this group are assigned geographically, and work with network new service and upgrades.
For larger “managed” accounts, including municipal accounts, National Grid has a Support Services Division (Energy Solutions) that consists of Account Executives (6) who work with these major customers.
7.4.4.12 - PG&E
Design
Key Accounts
People
PG&E has a position called a Service Planning Representative, whose job it is to focus on the customer interface. When a new customer, such as a high-rise building, desires connection to the PG&E network, they apply for service with the Service Planning Department. This department is responsible for gathering loading information/ They also determine whether or not the new customer load will be served by the network or by the radial system.
For the very largest customers, PG&E assigns a major account representative, responsible for all interfaces between PG&E in these major customers.
7.4.4.13 - Portland General Electric
Design
Key Accounts
People
The design and management of key accounts for PGE, including the network, is the responsibility of Service & Design Project Managers (SDPMs) and Key Customer Managers (KCMs). SDPMs liaise with customers, architects, and contractors to design customer facilities, while KCMs act as facilitators and work with large customers on an ongoing basis. Distribution Engineers work with SDPMs and KCMs on the technical aspects of designs. For key accounts, the Special Tester or an Infrared (IR) Thermography Technician test primary feeders and network protectors, and may provide services on secondary systems where resources permit.
Service & Design: Service & Design’s role is to work with new customers or existing customers with new projects, making it responsible for new connections, new buildings, and remodeling. The supervisor for Service & Design’s wider responsibility includes the downtown network. The supervisor reports to the Service & Design Manager, who is a peer of the Distribution Engineering and T&D Standards manager. Both positions report to the General Manager of Engineering & Design.
The Supervisor of Service & Design at the Portland Service Center (PSC) and its team undertakes capital work initiated by the customer. The “Mapper/Designer” reports to the Supervisor of Service & Design at PSC and provides the computer-aided design (CAD), geographic information system (GIS), and design service.A Field Inspectormeets with contractors. Two inspectors work for the Service & Design organization, and one specializes in the network.
Service & Design Project Managers (SDPM): Network planning associated with customer- driven projects requires regular coordination with the customer throughout the project life. PGE has a position called a Service & Design Project Manager (SDPM), who works almost exclusively with externally-driven projects, such as customer service requests. At present, two Service & Design Project Managers cover the network and oversee customer-related projects from the first contact with the customer to the completion of the project. They coordinate with customers to assure that customer-designed facilities comply with PGE specifications.
The SDPMs can be degreed engineers, electricians, service coordinators, and/or designers. Ideally, a SDPM has an associate degree or a combination of electrical engineering experience and appropriate education. In addition, SDPMs should have proven project management skills and understand PGE and industry standards and practices. They should also have knowledge of the National Electrical Safety Code (NESC) and National Electrical Code (NEC) and the ability to use or learn the relevant information technology (IT) systems. PGE prefers a selection of SDPMs with a diverse range of experience and backgrounds.
SDPMs work on both CORE and non-CORE projects. This ensures that expertise is distributed and maintained across departmental and regional boundaries.
Key Customer Manager (KCM): PGE has nine KCMs reporting to Manager of the Business Group. Generally, they are geographically distributed, with three on the west side, one downtown, one in Salem, three on the east side, and one acting as a rover. The KCM responsible for downtown Portland primarily focuses on network customers. KCMs liaise with large customers and communicate their needs.
Process
QRP Customers: In 2004, PGE offered the Quality and Reliability Program (QRP) to high-value customers requiring high reliability. This program entails a high-level focus on quality and reliability, and targets 24 high-profile distribution and transmission customers [1].
QRP customers receive reliability reviews from PGE, including:
- An annual walk through inspection of underground facilities, including infrared (IR) and visual inspections of equipment such as splices, connectors, transformers, and pad-mounted switches
- Suggested targeted reliability improvement projects, including liaising with some major customers concerning distribution automation pilots
- Power quality metering with I-Grid or PML
- Tracking SEMI F47 power quality events, including momentary interruptions
- Root cause analysis for any events affecting service
- Meetings with account representatives, engineers, and field staff
As part of QRP, IR thermography inspections are performed on network infrastructure on a four-year cycle. This inspection includes all the primary infrastructure beginning at the substation and including the network unit. The Special Tester or an IR tech perform inspections. Where resources permit, they may also IR test secondary systems.
PGE performs other activities as appropriate to bolster the reliability of the infrastructure to key customers. One example is the use of standby generators at one major customer to improve reliability and increase capacity. At another major customer, PGE is piloting the use of bolted connections for splices instead of compressions connections, which have been traditionally used. For the purpose of this pilot and to meet customer expectations, PGE photographs each of the splices and the Standards Group tracks the performance of the bolted connections.
Customer Requests – Additional Load
Customer requests to add load can initiate through a contact with a KCM (for larger customers) or SDPM. PGE utilizes a one-note “database” to track the new or proposed construction in the downtown area. The database acts as a way to record and monitor information on different projects due to the large volume of projects across the downtown district. The database also includes some projects in the River District not serviced by the CORE network despite being downtown. Much of the proposed work is tentative; consequently, this information is tracked but not used for load forecasting. The manager of the SDPMs reviews this information to track progress and determine when anticipated projects will occur.
Once a project starts, the customer submits a “Service Coordination Request,” and the project is assigned a Maximo project number. The network KCM continues to track the proposals and follows up when the proposal becomes an almost-complete building after construction. The KCMs seek to understand the customer’s needs from a service perspective, such as what load will be anticipated. The KCM coordinates with the SDPM and the building developer, with the SDPM directly involved in the technical and electrical design alongside the building owner. The KCM hands the project to the SDPM, and continues to be involved with the building owner, developer, and manager to ensure that they are getting the service from PGE that they need. Overall, the KCM acts as a facilitator.
Maintaining Customer Details: The engineering team and KCM create and maintain a list of the major properties on the network, including vault numbers, network and feeder circuit identification, the names of the property managers, and contact information. They also note any particular issues with the vaults, such as vaults that are prone to flooding because they are below grade, or vaults that are located near dry cleaners and receive a lot of lint and therefore require periodic cleaning.
Solar Panel Installation Requests: If a network customer seeks to install solar panels, the KCM puts them in touch with PGE’s interconnection group, who will perform an analysis to determine interconnection requirements.
Explaining Customer Outages: If network customers experience an outage or reliability issue, the KCM will follow up with the customers to explain the network’s design, issue, and resolution. The KCM may engage other PGE technical experts to deliver information to customers.
In preparing these presentations, KCMs modify a set presentation designed for new customers explaining the network system. After an outage occurs, they modify the presentation with specifics about the outage. The experts explain the following:
- Maintenance of the vault that is necessary by PGE
- N-1 and N-2 scenarios
- Possible curtailment of load scenarios and why PGE would ask for it
- Particulars related to the outage or other issue
If the customer is subject to a planned outage for maintenance, the KCM is not necessarily made aware of this but will always become involved for unplanned outages. The KCM will be aware of any long-term maintenance work that PGE undertakes in a particular area so that they can respond to customer inquiries.
Civil Structure Issues: If the crews encounter a civil issue with a customer-owned vault that houses PGE network infrastructure (typical for spot network vaults), then the KCM communicates with the customer to maintain and repair the structure. For example, if crews find that the ventilation system in a vault is not working, the KCM reports this to the customer. KCMs work with building managers to coordinate annual testing of vault smoke detectors by the city fire department, as these inspections require the presence of a PGE crew. The KCM will arrange for the crews to be present when the inspections are performed.
The KCM coordinates with the building management to make sure that crews can access the vaults. On some occasions, building security considerations must be addressed in order for crews to bring tools and equipment into certain vault locations.
Substation Outreach: The KCM is involved in outreach to the customers regarding the construction of a new network substation. The KCMs deliver presentations on the project to both business owners/managers and an organization known as the Business Alliance in Portland. The KCM works with engineering to notify customers of when PGE accesses the vaults as part of the project and how the work associated with the project impacts the customer’s service.
Reliability Centers: In its Portland service territory, PGE has three reliability centers intended to serve businesses with high reliability requirements. One of these centers supplies the networks system, which is highly reliable, supplied by two substations, and designed to N-1. Notably, PGE has two additional reliability centers to supply key customers with radial designs that utilize redundancy and high-speed switching technologies to assure reliability [2].
- J. Johnston. Portland General Electric’s T&D System Reliability Programs – Striving for Operational Excellence. Portland General Electric, Portland, OR: 2009. http://www.energycollection.us/Energy-Reliability/Jim-J-PGN-Reliability-Seminar.pdf (accessed November 28, 2017).
- Reliability Centers. Portland General Electric, Portland, OR: 2017.https://www.portlandgeneral.com/-/media/public/business/grow-my-business/documents/reliability-centers.pdf?la=en (accessed November 28, 2017).
7.4.4.14 - SCL - Seattle City Light
Design
Key Accounts
People
SCL employs Customer Service Representatives who interface with customers.
Process
SCL convenes a biweekly crew coordination meeting focused on the project status of each active network project. Meeting participants include supervision and others from the network design group (engineers), civil crew representatives, electrical crew representatives (including crew leaders), and customer service representatives who interface with customers. This forum has been a highly effective project management tool for SCL in updating project status, resolving problems, and meeting project goals.
7.4.5 - Mapping - Recording “As-Builts”
7.4.5.1 - AEP - Ohio
Design
Mapping/Recording “As-Builts”
People
Mapping and documentation of the network are the responsibility of the Network Engineering group and the Network Engineering Supervisor at AEP. A Technician who reports directly to the Network Engineers maintains network maps, including recording and mapping “as-built” changes to the network into the permanent records.
Process
Maps associated with the network are maintained by a technician within the Network Engineering group in close consult with the network engineers. Existing maps are used as a basis for preparing job drawings for particular projects. Engineers prepare drawings using MicroStation and AutoCAD. Upon the completion of any construction project that alters the configuration of the network infrastructure, including vaults, substations, manholes, duct lines, etc., the crew leader will mark all as built changes on the duct and manhole one line and return to Engineering. The Network Engineers compile the as-built drawings that are returned from construction, and assign the updates to the Technician within the Engineering group to update the changes onto the electronic drawings (using MicroStation and AutoCAD), as well as update the CYME models, where appropriate. In parallel, the GIS system (Smallworld) is updated for company-wide access.
In the course of any vault, substation, or manhole inspection, personnel check the “on-the-ground” layouts and construction to make certain it matches existing records (see Vault Inspection). If any discrepancies are noted, the personnel make a note of them and forward them to the Network Engineering group for verification. If changes are required to the “as-built” records, they are forwarded to the Technician for electronic updates and exported to Smallworld.
AEP does not have a separate inspection program that audits as built conditions with designs. It is the responsibility of the crew supervisors to inspect projects to assure that construction meets design expectations, and that any as built changes to the design are properly recorded.
Technology
The network engineering group prepares and maintains various maps of the network infrastructure including:
Circuit One-Lines – These maps provide a plan view of the location of the circuit, and include the manholes and vaults on each circuit. The maps includes cable information and distance information. Circuit one-lines are used as a starting point for building circuit models within CYME.
Switch Chart Drawing – These are one-line drawings for the primary that show the electrical schematics of the spot network vaults. For grids, these maps indicate which primary circuits supply each grid. Switch chart drawings are maintained by the Engineering group and are placed on an internal website for use by the dispatchers and field crews.
Duct and Manhole One-Lines – These are drawings that indicate the duct bank configuration, and what cables are located in the ducts. These drawings are updated based on inspection. They also show the position of secondary cables on crabs. These drawings are used by field crews in performing construction or system reinforcement work in ducts and manholes (see Figure 1).

Figure 1:
Sample project drawing using duct and manhole one-line as a base
Secondary Maps – AEP Ohio has recently conducted an inspection of the entire network and has created a new set of updated secondary maps that display cable and cable distance information. These maps will be maintained with information identified during periodic inspections.
7.4.5.2 - Ameren Missouri
Design
Mapping/Recording “As-Builts”
People
Maps and records for the Ameren Missouri network infrastructure in St. Louis are maintained by the Engineering Records Group, part of Missouri Operations within Energy Delivery Distribution Services. The Engineering Records Group is lead by a supervisor and is comprised of drafting technicians.
Process
When an estimator prepares a job, he conducts a manhole visit to verify the distribution plan within the hole, as existing maps may not accurately reflect the in service manhole configuration. Estimators visit the manholes in two person teams and photograph the manhole configuration. The estimator may then use the existing maps as a starting point for a new construction drawing by converting the existing mapping information to AutoCad drawings.
When the project is released to construction, a preliminary drawing showing the design is sent from the estimator to Engineering Records. A job drawing also accompanies the project that flows to construction.
When the job drawing goes to construction, the construction foreman indicates any changes in the “as-built” construction from the design depicted on the drawing by marking the as – built changes to a plat map and stamping the drawing as an Official Record Copy (ORC). This ORC then goes to the drafting department within Engineering Records who updates the official maps and records to reflect the as-built conditions.
For changes that affect operations – such as changes to operating one lines that impact circuit configuration or sectionalizing points - the dispatcher prepares a Map Correction / Change Request form (informally called a dispatcher note) that indicates the changes in system configuration to be modified on the maps. This form triggers the Engineering Records group to call up the preliminary drawing provided by the estimator and make any changes that affect electrical connectivity or switching to the operating (Byers) map. Engineering Records will make operating map changes within one to two days of receiving the dispatcher note.
Technology
Ameren Missouri has a good set of maps depicting their network infrastructure. Maps include:
-
Operating Map (Also called Byers map) – This is a map showing electrical connectivity, used for switching. Usually updated within one to two days of receiving the Dispatcher Note. This map is available to Troublemen on a laptop computer in the trucks,
-
Plat Maps - Detailed maps of the network area, showing all geographic facilities on a block-by-block basis. These maps are geographically correct, and show duct bank cross-sections. Usually updated within one month of receipt of the ORC from construction.
-
Cable Route Maps – These maps are basically feeder one lines, depicting the route of the feeder from the substation to termination. They also show all of the manhole locations. These maps contain more detail than the operating maps. Cable Route maps are updated within one to two days of receiving the Dispatcher Note.
-
Switching Maps - These maps are similar to the cable route maps, but also show switching devices. These maps are updated within one to two days of receiving the Dispatcher Note.
Network infrastructure is represented in a GIS – BYERS system.
Ameren Missouri is in the process of converting to a new mapping system, Gtech. At the time of the practices immersion, Ameren Missouri had not yet decided how the new mapping system would be used with network facilities.
7.4.5.3 - CEI - The Illuminating Company
Design
Mapping/Recording “As-Builts”
People
The CEI Maps and Records department is part of their Engineering Services Group. This department is responsible for all maps and records in the Region. The department is comprised of 11 people total, with 1-2 people focused on the underground. ¾ of an FTE resource is focused on updating records. The department employs both exempt and non exempt non bargaining employees.
In addition, the CEI UG Network Services department has an Advanced Distribution Specialist who works closely with Maps and Records, and maintains certain records information within the Underground department.
Process
The Maps and Records Department maintains maps, continuing property records and information systems, such as GIS. These systems may not contain information to the level of detail required by the Underground department. For example, some underground information, such as manhole details, is kept on manhole prints rather than company information systems. The Maps and Records department also produces a Circuit Identification book that defines labeling practices for the Illuminating Company.
When a job package arrives in the Underground department from Engineering, it may be accompanied by a CAD drawing, or may simply have a marked up map or print. Larger, engineered jobs are accompanied by a “Work Request”, which establishes the project in CEI’s computer system. Work requests for other smaller projects, such as repairing a burned out cable, will be generated by the Advanced Distribution Specialist within the UG department, and do not flow through Engineering.
On a large job, CEI will order the material prior to performing the work. On other jobs (most jobs), the material is assigned to the project after the work is complete. When the completed work package is turned in to the office, the Advanced Distribution Specialist within the UG department will review the material that was used, and then record the use of that material in the system – this will charge the material to the job and replenish the stock.
If field makes modifications to the design, the field crew will mark up the changes in red on the job print. For example, engineering will specify which duct a new cable should be pulled through. When the field crew rods the duct, they may find it blocked and choose another duct. The construction supervisor will note the change on the print and sign and date the print, acknowledging the change to the design. The changes are forwarded to the Maps and Records Department.
On average, it takes about 2 months for changes to be reflected in the mapping and records systems – one month work back log, and a month to make changes and produce an updated microfiche. For feeder prints, the Maps and Records group works closely with the Regional Dispatching Office to assure that these maps are up to date within about three days.
Technology
CEI does a thorough job in records keeping and relies heavily on manual maps and prints for their underground system records, and in performing their work. For example, manhole prints are relied on heavily to identify cables in a manhole, as CEI does not tag or label cables in the hole. If they discover a discrepancy between the records and the field, they will stop a job until they can verify.
Example prints used by CEI include:
- Manhole prints, which are drawn and maintained manually or in CAD (SHL Vision – Autodesk 3D map), are used for identifying cables, as they show the position of cables in duct bank. (See Attachment - E. )
In fact, the only tag placed in the manhole is an aluminum tag placed under the lid with the manhole number. Other that this, there is no labeling in the manhole. The mapping system is a critical tool at CEI in cable identification, along with other techniques, such as using a sound coil to identify cable.
-
Conduit Sheets, which are also drawn and maintained manually or in CAD, are used to show the duct routing between manholes and vaults. (See Attachment F )
-
Feeder Maps, also drawn and maintained manually or in CAD, show the routing of an individual feeder, including vault locations. Note: CEI will also record the locations of transition joints on the feeder maps.
-
Customer Connection Diagrams (internally referred to a 3CD diagram), also drawn and maintained manually or in CAD, are similar to the manhole prints, and show the feeds into the transformers within the vaults.
(See Attachment - G)
CEI will scan their maps and issue a CD to the field every six months. The CD information is loaded onto lap top computers. These laptops and a small printer are used by troubleshooter crews.
Historically, records of cable installations and the work orders under which they were installed were kept manually in “cable mortality books”. The present practice is to track the cable installed date and work order number in their GIS system. Note – GIS does not include the history from the cable mortality books.
GIS also contains information about underground distribution transformers, including purchase date, installation date, company number, impedance, size, manufacturer, taps, gallons of oil, etc. Transformer test results are kept manually in a file in the underground department. Ultimately, CEI may elect to house this information in a new Cascade system they are implementing.
Oil Switch records are maintained in the Underground department in an Access data base. Oil switches are not serialized. These records include location, manufacturer, type, rating, and whether the device is remote controlled.
Network Protector information is kept in a manual file in the Underground Department. CEI has 61 network protectors.
7.4.5.4 - CenterPoint Energy
Design
Mapping/Recording “As-Builts”
People
CenterPoint has a GIS Mapping group that is responsible for maintaining company mapping systems. Two GIS Mapping resources (GIS Technicians) focus specifically on supporting the mapping and records needs of the Major Underground group, and are assigned to work in Major Underground, as matrix employees. Note that these technicians are contractor employees, as CenterPoint has outsourced its maps and records maintenance. The GIS Mapping resources maintain both electronic maps and hand drawn maps.
The CenterPoint employees interviewed by EPRI researchers in general feel that their maps are accurate, and kept up to date in a timely fashion. They have not experienced operating errors driven by map inaccuracies.
Process
CenterPoint’s GIS mapping resources are integrated into the work order process. When the Construction department supervisor receives the work order from Engineering, the GIS technician receives a copy also. This provides the Technician with a preliminary indication of the work to be done. This preliminary information will include project drawings prepared by the Engineering department in Microstation. For example, a vault design will include a detailed vault schematic prepared by the Vaults group within engineering.
As the construction is completed, crew leaders will request a switching order from Dispatch indicating that system configuration is changing. Copies of the completed switching orders are sent to the GIS Technician, so that he is up-to-date on the most current system configuration. He will match up the switching order with the appropriate work order in the GIS Tech files in advance of the project completion – this enables him to get started on the mapping even in advance of the job’s final completion, minimizing the mapping turnaround time at the completion of the project.
When work in the field is complete, “as built” drawings are returned to clerks in the Major Underground construction office. These clerks forward copies of the work to CenterPoint Records where copies are stored in Filenet. After being recorded, the Work Order package flows back through the GIS Technician. This work order package includes a copy of the engineering sketch, which serves as a basis for a work center drawing, which documents the construction in a new facility.
For new projects, within one week of the completion of the work, the GIS Technician will go into the field to verify what is in the field against the maps and project drawings. This verification can include wheeling measurements to confirm distances described in the design. CenterPoint’s experience is that the information on the work order is usually correct, but that sometimes in the field, conditions will change. (Crews will usually mark these changes on the work order as an “as built”).
From the “as built” work order package, the GIS Technician will prepare map drawings using Microstation. For pad mounted transformer locations, he will prepare a “Work Center” drawing See Attachment B , which shows the installation as well as some geographical information associated with the site. Work Center Drawings can include a plan view and a schematic if necessary. For dedicated[1] underground installations, the GIS Technician will prepare a “Dedicated Map”, which shows the electrical layout, duct bank information, and some geographic information See Attachment C. Both the Work Center Drawings and Dedicated Maps are provided to field crews and kept in map books on the trucks, or are viewable through mobile work stations. . Both the Work Center Drawings and Dedicated Maps are provided to field crews and kept in map books on the trucks, or are viewable through mobile work stations.
In addition, for dedicated underground circuits, the GIS Technician creates and maintains Dedicated Underground One Line maps See Attachment - D , that shows the entire circuit from the sub out. It also indicates the work centers (such as vault locations) along the circuit path. These one line drawings are accompanied by blank switching order documents which can be used by dispatchers to create switching orders for working on the line.
The GIS Technician creates the work order Substation One Line drawings showing the underground facilities within the substation.
The GIS Technician maintains a file of manhole prints See Attachment - E , which shows the duct bank detail within manholes. These prints are created by the field crews who perform the cable installation, and show the position of feeders in the ducts on a hand drawn print. The GIS Technician is in the process of re-drawing these manhole prints in Microstation.
Finally, the GIS technician enters information into CenterPoint’s GIS system, Arc Map. This includes the location of splices, and fiber cable routes within the ducted manhole system that support the remote monitoring system. Note that CenterPoint is populating the GIS with new information, while at the same time converting existing records into GIS. The GIS system will ultimately produce maps that will replace the Dedicated Underground One Line drawings. The GIS information does serve as the foundation for the graphical switching software being used in CenterPoint’s Dispatch Center.
Center Point’s backlog for updating their mapping changes based on completed “as built” drawings is two weeks.
Technology
CenterPoint is using a GIS database by ESRI (Arc Map). They are using Microstation drawing software to generate most of the maps used by Major Underground.
Example maps / prints used by CenterPoint include:
- Work Center Drawings (showing pad mount locations)
- Dedicated Maps (Showing Major Underground service locations )
- Dedicated Underground Onelines
- Manhole Prints (Showing duct bank detail)
- Vault schematics (Developed by the Vaults group, within engineering)
- Substation Online Drawings
[1] The term “dedicated” underground at CenterPoint refers to three phase infrastructure is located entirely underground in their ducted manhole system. A “dedicated” network feeder does not mean that the feeder serves only a network; rather, it refers to a feeder that is entirely underground.
7.4.5.5 - Con Edison - Consolidated Edison
Design
Mapping/Recording “As-Builts”
People
Organization
Central Engineering - Responsibilities include Civil / Mechanical Engineering, Control Systems Engineering, Design Engineering, Electrical Engineering, Equipment and Field Engineering, and Environmental Engineering & Program Support.
Engineering and Planning - Responsibilities include Energy Services, Distribution Engineering, Operations Services, Marketing and Sales, Planning and Analysis, and D.C. Elimination.
Employee Development
Con Edison invests in developing its design employees through three distinct programs focused on employee development. One program is focused on the development of newer engineering employees, another at incumbent employees, and the third at bargaining unit employees who are entering the management ranks. Note that these programs are not limited to design employees, but are available to all employees who qualify.
Process
Mapping “As-Built” System Configuration
Con Edison creates a “before” and “after” sketch of its projects. These sketches facilitate understanding of the changes in field conditions to be made by a project. When a project job is completed in the field, the “as-built” field conditions are reflected on the electronic maps within 72 hours of energizing. On larger jobs, new transformer locations are pre – mapped to expedite the mapping process, so that maps expeditiously reflect field conditions.
Con Edison’s focus on ensuring that maps are current stands out as an important practice, as up-to-date maps are an important tool in the safe operation of the system.
Technology
Mapping Systems
Con Edison’s distribution system is mapped on three different mapping systems. Manhattan, Queens, and Westchester use one system; Brooklyn uses another; and Staten Island uses a third.
The mapping system developed as three different systems, because of the long time required to digitize the facilities. Con Edison’s long-term vision is to combine the three mapping systems into a common system.
Historically, Con Edison has developed and modified technologies with its own people, and often assigns people internally to manage these technologies, as opposed to buying technology off the shelf. Con Edison attributes this approach to the utility’s unique requirements as an all underground network, N-2 utility. “We are belt and suspenders and have to be sure we can maintain the N-2.”
7.4.5.6 - Duke Energy Florida
Design
Mapping - Recording “As-Builts”
People
Duke Energy Florida has a mapping group called the Geographic Mapping and Analytic Design group (GMAD). This group consists of two groups: an “analytics” group that deals with geospatial operations, including GIS, and a “design” group that deals with designing subdivisions and the associated land base. This group organizationally is part of the Engineering Construction and Planning organization.
The GMAD group is responsible for maintaining system maps and GIS. For new subdivisions, the design section of the GMAD group would perform the design associated with serving subdivisions. The GMAD group receives the subdivision land base information from the subdivision, and uses automated design software (Automated Plat Design – APD) to lay out the design. Note that this work does not apply to network design.
Within the GMAD group, the analytics side deals with creation and maintenance, including field corrections, of the maps and records. The GMAD group has a position called a GIS Technician, responsible for performing the GIS map and records updates. The GIS Technician is a job family, with the GIS Technician II typically having extensive experience with not only the GIS system but also with all Standards practices and processes in Florida, including manholes and vaults.
The staffing in the GMAD group consists of 25 resources plus about 10 contractors.
Duke Energy Florida has its entire distribution system represented in GIS, including primary, secondary, and services. The location of manholes, vaults, and primary cables associated with the network are also included in the GIS. The exception would be the position of the secondary network cables in the Clearwater network grid, and detailed information about manhole and vault configuration, which are recorded on separate, manually maintained drawings within the Network Group. In the GIS system, Duke Energy has assigned customers to transformers to support their outage management systems. For the network customers, they have attempted to assign specific customer loads to transformers though network customers are serviced by the grid.
Duke Energy Florida maintains accurate as-built manhole and vault drawings for its network facilities in both Clearwater and St. Petersburg. The manual drawings do reflect the detailed information of the underground. The field forces at both locations have high confidence in the manual drawings. PDF copies are available through links in the GIS.
At the time of the practices immersion, Duke Energy Florida had assigned a Subdivision Design Supervisor the task of updating the company’s GIS system to accurately reflect network infrastructure. This project includes incorporating network system drawings into the current GIS mapping system. Assisting in the GIS update for the Duke Energy Florida network is a full-time contractor responsible for entering the approved network maps and any corrections into the system under the guidance of the GIS Technician. This contractor is physically located with the Network Group, in Clearwater.
Process
Duke Energy Florida has seen little new construction in the network. Thus, the bulk of the mapping work has been update of the existing GIS. For new construction, the process for updating the maps begins on the back end of the project, when the as built drawing is complete.
The GMAD contractor resource who has been assigned to the Network Group, is responsible for all map updates. The as-built drawings are provided to the contractor resource, who will update both the GIS system, and separate network maps which are maintained electronically in Microstation. These documents are then converted to PDFs and placed on a shared server so that they can be accessed by employees through the GIS (see Figure 1). GIS contains links to all of the manually maintained network maps, including vault and manhole drawings, as well as Excel files of information sheets which include vault and manhole component details, such as cable sizes, cable age, etc.

Figure 1:
Example of Manhole Drawing, PDF map available in GIS
If there are changes to be made to the GIS system as a result of work in the network, these updates are also handled by the contractor resource in the Network Group
If there is a field change to the design, field corrections are noted by a Network Specialist on an as built drawing. Changes in field design are normally not reviewed with the designer unless they are significant. In some cases, such as a significant change in the quantity of requested materials, the designer may be notified based on exception reporting from the work management system, designed to call out cases where the quantity of material used may exceed a pre-determined accepted variance.
While most map changes are made after the completion of construction, some field corrections flow to the GIS team ahead of construction. An example would be an addition or update of a switchable device. This type of change is pre-posted to GIS as it affects system operations and must be readily available to the DCC.
Duke Energy Florida has a backlog of as built drawings to be updated. The contractor assigned to the underground department is working to remove the backlog. The current backlog time before as-built drawings are updated on the maps is several months.
Quality Auditing
GIS Technicians perform periodic random audits, where they select random Microstation manhole drawings and make sure that the information matches the information in the GIS. This includes material lists, circuit numbering, schematic accuracy, etc. When updating maps, if the mapping group has questions, they will send it back to the Network Group for clarification.
On occasion, Network Specialists will enter manholes and redraw the manhole interior to assure its accuracy.
Equipment information, such as the location of splices, work order information, cable sizes, voltage class, duct position, and equipment serial numbers, is kept in the as-built manhole and vault drawings. These are contained in the Excel spreadsheet links on the GIS maps (see Attachment E for a sample of a manhole records sheet). Whenever a drawing is updated, the Excel spreadsheet is also updated. More detailed part information is tied by serial number into the online work management system.
Network Mapping Update Initiative
In late 2015, the company began a new initiative to update network drawings. A full-time contractor (KCI) based in the Network Group was hired to assist in the project. The first step was to match the GIS network maps with the manhole drawings maintained by the Network Group (see Figure 2). Note that the field crews maintain and use manually updated maps, which they feel very confident about. The challenge is to assure that the updated GIS accurately reflects conditions in the manholes, and to assure that any changes in the field are posted in a timely manner in the GIS.

Figure 2:
Excerpt from network primary feeder map, maintained by the Network Group
Within the updated GIS there are three layers: the paper-to-electronically converted map, standardized symbols on the GIS maps that represent components and electrical connections, and a third layer of links embedded within these symbols that bring up PDF/Excel information. One problem in the past has been standardizing the symbols and making certain that GIS operators use the appropriate symbol for linking to the correct underlying PDF/Excel files.
To assist in any ongoing changes (beyond reconciling hard-copy maps with GIS), the company is moving to GE’s Smallworld system (replacing Intergraph) and is considering software called Fusion, a version documentation program that will assist in assuring that the map update process is tracked. Using this combination, the company will have version-control over map revisions; any change, who made the changes, and when changes were made then will be in the system. In turn, these can also be exported to PDF and Excel files for inclusion into the GIS system. For this system to operate efficiently, any changes made in the field must be sent immediately to the GMAD group to be fed back into the system.
The company is also looking at a Web-based compliment to Smallworld called Myworld. The application overlays all major systems within Smallworld (cable runs, manholes, easements) onto a satellite-based map.
Technology
The GMAD group uses G/Technology, an Intergraph system, as its GIS system. At the time of the practices immersion, Duke Energy Florida had embarked upon a transition to a new GIS system, GE Smallworld.
Detailed maps, finalized design plans, and material and component lists are generated on Microstation and then fed into the GIS system in the form of PDF files (maps) and Excel spreadsheets (material and component lists).
Dispatchers use the GIS PDF files, but for detailed electrical schematics they use a static, web-based system called Map Board, which they find easier to uses than the OMS.
All field crews are connected via mobile devices, typically laptops. Most trucks are also outfitted with printers to get hardcopies of the PDF maps on the job site.
Duke Energy Florida does not keep photographs of manhole and vault interiors as part of its permanent record.
7.4.5.7 - Duke Energy Ohio
Design
Mapping/Recording “As-Builts”
People
Duke Energy Ohio has a maps and records group located in downtown Cincinnati.
The Maps and Records department is comprised of technicians who maintain the maps and records for Duke Energy Ohio. All completed construction drawings, and most map changes flow through this department.
For example, changes to the Cable and Conduit (C & C) drawings for the downtown network, usually come from the design organization. These drawings, showing details of manhole locations and the duct positions of cable within network manholes, are manually marked up showing changes in configuration by the Customer Project Coordinators (CPCs) within the Design organization. These changes typically flow through the Network Planning engineer, and then to Maps and Records for permanent update.
Process
Designers (CPCs) will create construction drawings. Often times, existing CAD drawings will be used as a starting point, with the changes marked on top of the existing drawing. This is typically done in either Microstation, or in Expert Designer.[1]
For emergency work such as rerouting a feeder in an emergency, field crews will work with the planning engineer, network engineer, or construction supervisor to prepare a hand drawn sketch of the new route. This drawing is then used to drive changes to the permanent mapping systems.
When a project is completed, the crew foreman or supervisor submits via fax or e-mail the completed construction drawings to the maps and records group, who are responsible for updating the permanent maps and records.
When a construction crew deviates from the design drawings, they will note their changes by redlining the construction drawings. These red line drawings are then sent to maps and records at the job conclusion for permanent map update.
Duke Energy Ohio has several processes in place to assure the integrity of the maps.
Periodically, they will send mapping personnel into the field to perform an audit of what they find in the field against the mapping system.
Also, a check of the maps is included in the manhole inspections. Inspectors will “red line" to cable and conduit (C&C) drawings, indicating changes to be made to the maps so that they accurately represent field conditions. The changes are then made to the permanent C&C drawing by the Maps and Records department.
Duke personnel noted that there is no formal audit process comparing as built construction to design drawings on a job or job basis. They rely on a constant strong relationship between engineering, construction, and the maps and records group. Duke Energy Ohio crews will have a copy of the manhole drawing with them when they enter a manhole.
For mainline feeder work, maps of the completed construction are created in advance, so that when the system configurations are made in the field, the maps are prepared for a quick update.
Duke personnel noted that the turnaround of map changes is improved over years past. This is in part driven by the fact that certain records, such as Duke’s GIS records, drive the outage management system. Duke personnel reported their mapping systems are fairly accurate.
Technology
For Network Systems, Duke Energy Ohio is utilizing various types of maps.
-
A conduit and cable (C & C) map, detailed map showing physical manhole locations, manhole conduct positions, etc. See Attachment A for sample C&C Map
-
Network Feeder maps, which show the circuit route and the location of Transformers. See Attachment B for sample Network Feeder Map
-
Secondary main sheets, showing the secondary system for an entire network. See Attachment C for sample Secondary Main sheet
Duke Energy Ohio is using the Small World GIS system to represent the radial portions of their distribution system. Note that the network system is not modeled in Small World.
[1] Expert Designer was being implemented at Duke Energy Ohio at the time of this practices immersion.
7.4.5.8 - Energex
Design
Mapping/Recording “As-Builts”
People
Mapping is the responsibility of Data Services and Demand Management group, part of Asset Management, led by a Group Manager. The Data Services area is broken up into two teams.
One is the operational and transactional data team, which is responsible for entering information from the field into the company data systems, including maps. The other is the strategic data team, which is responsible for leveraging the information in the systems for the betterment of the company.
One of the systems maintained by this group is the enterprise asset management system, which is a 30 year old in-house developed Oracle database that services as an asset register. Energex also uses an ESRI GIS system, which is linked to their asset register.
Process
Energex has recorded the CBD infrastructure in their Asset Management and GIS systems and produces various map products out of these systems, including UG duct maps, primary feeder maps, and low-voltage system maps. Maps show the location of joints. Maps are available to employees via on line systems, but are not available to the field force through their mobile data application.
At the time of the immersion, this group was looking at developing a transition plan to replace the system with a commercially available product, as the existing system has many interfaces with other systems and is thus, unwieldy to update. Along with this, Energex wants to replace its GIS system.
In the hub locations, Energex maintains hard copies of the UG maps. Noncritical changes in field conditions are updated in the hub locations on these manual maps, which are updated on the permanent maps by the mapping group once a fortnight. For higher priority updates, Energex responds according to requirements. For example, their Distribution Management System (DMS), Power On, is updated to reflect switch position changes, real time (done by control room operators).
The company has established metrics for map updates. Field crews have a target of 10 days after work is complete to sign off on the as built drawings and return them to the mapping group. The mapping department has a target of 10 days to complete the map update upon receipt of the “as built.” Performance against these metrics is included in the company performance management system, which affects bonus payments.
Historically at Energex, about 15 percent of the “as built” jobs were completed differently than designed.
Energex has implemented a monthly audit process within the mapping group to assess the following:
-
Quality of the data entry by the entry team.
-
Quality of the data in the system
-
Field checks on the work.
Energex samples about 10 percent of the work for the purposes of performing these audits. The company has two resources that focus on comparing what is built in the field with what has been reported on “as built.” If these resources uncover systemic problems, Energex feeds it back to the appropriate groups, such as Procurement or Standards.
Technology
Energex uses an Enterprise Asset management system based on an Oracle database, developed in-house, that serves as an asset register. Energex also uses an ESRI GIS system, which is linked to their asset register.
7.4.5.9 - ESB Networks
Design
Mapping/Recording “As-Builts”
People
ESB Networks has a centralized mapping organization (Central Site) for maintaining maps and records of their MV and LV systems in Dublin. The Central Site is responsible for maintaining the facilities management system, DFIS. This organization is led by an Engineering Officer.
The LV maps for the city of Dublin are very detailed and meticulously maintained, as field crews depend on these maps to find junction points within the secondary system to perform sectionalizing. Many of the junction points and “T’d” services are buried, with no aboveground indication of their presence. (The city of Dublin prevents ESB Networks from using aboveground mini pillars.)
Process
ESB Networks Network designers (Engineering officers) use a system called GeoDart – an Intergraph drawing tool – to prepare design drawings, such as a design for connection to a new customer. This system is integrated with the DFIS system, so that a copy of the design drawing is maintained in DFIS. When construction is completed, the construction group sends an “as built” drawing back to the central mapping group. The central mapping group updates the design drawing to reflect the as built conditions, and the GeoDart drawing updates the permanent record in DFIS.
All staff are encouraged to ‘mail in’ corrections if they identify map errors. Corrections are mailed to Central Site, who are responsible for the map integrity, and will accept a correction drawing in any format, including freehand sketches.
ESB Networks performs periodic quality audits, in which a supervisor performs a field assessment of a completed job, examining the quality of construction against both the design and against ESB Networks’ construction standards. Supervisors in each area are required to perform a number of these audits each year.
ESB Networks also performs periodic design audits, in which the design is compared to standard design practices. These audits are implemented by the central design organization.
Technology
ESB Networks uses a geographic facilities information system called DFIS – an Intergraph product. This system is used to record all distribution facilities information, including the LV, MV and 38-kV sub-transmission systems. DFIS serves as the real-time asset register.
ESB Networks also uses a system called GeoDart – an Intergraph drawing tool that is integrated with the DFIS.
The DFIS representation of the system also feeds into the ESB Networks OMS model, which is used to manage the response to outages and to reflect real-time conditions of the system as it is operated, through an overnight update. Note that the OMS system at ESB Networks is integrated with SCADA, such that breaker operations are reflected in OMS. MV maps from the OMS are displayed on the dispatcher console. The LV network is not.
Network Technicians have copies of the MV DFIS maps on their trucks. LV maps are not kept on the trucks.
ESB Networks is in the process of implementing a new mapping system that will include the LV network (see Figure 1 and Figure 2). Note that the LV system has been digitized, but has not been loaded into the existing DFIS.

Figure 1:
LV map

Figure 2:
Book of hand drawn detail sketches of the LV system – supplements the maps
7.4.5.10 - Georgia Power
Design
Mapping/Recording “As-Builts”
People
Mapping and documentation of the network are the responsibility of the Network Engineering group. Organizationally, the Network Engineering group is part of Network Underground. Organizationally, the Network Underground group is a separate entity, led by the Network Underground Manager, and consisting of engineering, construction, maintenance and operations resources responsible for the network underground infrastructure, including the development of standards for network equipment.
Management of the maps and records associated with network infrastructure is performed by Network Underground Engineering group, led by a manager, and comprised of Engineers (Electrical and Civil) and GIS Technicians concerned with the planning, design, and any service issues associated with the network. The Engineers are four-year degreed positions, while GIS Technicians have a combination of years of experience and formal education, including two-year and four-year degrees. Design engineers, GIS technicians, field inspectors, and field force all contribute to the timely and accurate mapping and recording of facilities associated with the network grid.
Process
Georgia Power uses a graphical information system to store its network and “as-built” maps. They also use software called Distribution Viewer, or DistView – a module of NaviGate by Gatekeeper Systems – to display its information and lt” maps. Within DistView, designers and engineers can view information from GIS (ArcFM) and other systems, including underground “layers” showing information such as primary facilities or secondary facilities, and call up manhole and vault detailed views. The DistView system indicates the locations on the secondary networks where customer services are provided. Using an event button, engineers can click on inspection and maintenance histories as well, with detail such as the dates of inspections and the names of the personnel who performed the inspection, including what their findings and recommendations were.
DistView can be accessed anywhere through Georgia Power. The system has a Notes feature that enables an engineer, for example, to enter notes from a remote location into the system by a laptop connected to the intranet. This connectivity this helps insure that field engineers and inspectors capture information as quickly as possible. Georgia Power assigns an engineer or engineering assistant to look at the notes that have been created in the system every Monday morning and look for open jobs. Notes are removed once they are addressed.
Within GA Power’s records, network locations are numbered by manhole, and every location has a network location number and GPS coordinates. Primary and secondary feeders are included in the map. Splices locations are also shown on the maps.
Engineers can import AutoCAD design drawings into Dist View. Importing background information for new designs facilitates the design process, eliminating the need for drafters to layout the background of the entire system.
Georgia Power still maintains drawings in its GIS system, however. Some of the older maps had been directly scanned into the GIS system, and the information has not yet been ported over into DistView. It is often easier for engineers to use DistView if they want a quick look at a site, but GIS may contain more detailed information that is not yet populated in DistView (See Figure 1.).

Figure 1:
DistView mapping system for Georgia Power
Even with DistView and GIS systems, Georgia Power keeps the old hard-copy drawings. In . Questions often arise about the location and dimensions of original facilities, even if those facilities have been modified or abandoned in place,
To date over 30,000 files in total, some digital and some of them scanned, have been imported into the system. Contractors were called in to open drawings and populate tables.
An open question for Georgia Power is relying on electronic file formats for archiving. Among the questions they’ve had to raise is how long will these electronic file formats be viable? Past attempts to digitize old drawings have relied on software that has since become obsolete. As of now, the maps are stored in PDF format, and they do keep hard copies in the file room. An additional layer of protection for its mapping system is a backup of the map files to an off-site disaster recovery center. Southern Company backs up all data stored on its network daily. The need for this was reaffirmed a few years ago when a tornado hit downtown Atlanta, fortunately missing the Georgia Power facility.
Georgia Power is focused on records data integrity, and has worked to make map and GIS update part of the overall job completion process. Milestones are tracked from the date of work order approval through completion and posting of records information. Milestones are tracked in Georgia Power’s JETS (job estimating and tracking) system.
When a job is complete in the field, the project foreman signs off on the work drawings, indicating any changes in the as built design, and returns the project to engineers within the Network UG Engineering group. The entry of the construction complete date by either the foreman or engineer triggers the close out process.
Within Network Underground Engineering, one of the GIS Technicians serves as a GIS coordinator, who prepares the posting package by pulling together all of the job completion information required to update maps and records. Georgia Power targets one week for update of maps and records to reflect field changes.
Technology
DistView software is used by engineers and planners for fast and accurate maps of nearly the entire Georgia Power underground network. The GIS system contains, to date, more complete mapping, including older, scanned maps. The map room is maintained as a backup and a check of what is stored electronically. Finally, the GIS and DistView maps are backed up to an off-site DR facility 24x7 in case a disaster takes out the computing systems at Georgia Power. The Job Estimating and Tracking System (JETS) is used to estimate projects and track costs.
7.4.5.11 - HECO - The Hawaiian Electric Company
Design
Mapping/Recording “As-Builts”
People
The HECO Maps and Records are maintained by of the Operating Engineering Division of the System Operations Department. The department is comprised of 5 people - 2 senior level people and 3 junior level people. The group is responsible for maintaining maps and facility records for HECO.[1]
Process
The Maps and Records group maintains maps, continuing property records, electronic facilities maintenance systems (EDMS) and other information systems, such as GIS.
The group is responsible for creating and maintaining Switching Diagrams which
(See Attachment C, are manually drawn (using Microstation) single line diagrams used by switching coordinators within System Operations to plan and execute switching. These diagrams are updated as a priority and are provided to the dispatcher on a daily basis. Others at HECO who required copies of switching diagrams receive updates every six months. , are manually drawn (using Microstation) single line diagrams used by switching coordinators within System Operations to plan and execute switching. These diagrams are updated as a priority and are provided to the dispatcher on a daily basis. Others at HECO who required copies of switching diagrams receive updates every six months.
HECO has implemented a GIS system that represents their distribution system, with the exception of secondary, services, and network vaults. Outside the network, all vaults, manholes, and underground facilities are represented in GIS. HECO does plan to record network vault information in their GIS system in the future. The GIS information is being used as a foundation for HECO’s Outage Management System (OMS).
HECO is not recording the location of underground splices within their GIS system. Other underground asset information is being recorded. Not all of this information is being captured spatially; that is, information about some assets is being recorded, but may not appear on GIS produced maps. HECO is not producing and maintaining detailed manhole drawings that detail the duct bank configuration within each manhole. Field crews do not rely on maps for circuit identification – they rely on testing and field circuit labeling.
When a change to the maps and records is required, the change is noted on a form known as a Mapping Revision Order (MRO). See Attachment - D . Priority changes are made to the maps and records within 24 hours. Priority changes are those that can impact day to day system operations and include things like switch replacements, changing switch numbers, installation of new transformers, etc. Non – priority changes are completed within a three week time frame. HECO has no mapping backlog older than three weeks. HECO is utilizing an MRO Checklist (See Attachment - E , to track the progress of an MRO.
The HECO Maps and Records group is responsible for maintaining the Wallboard in the Dispatch center. The Dispatch wall board is electronic, and changes mare made by the maps and records group to the software that drives the electronic display, and to the manually updated switching diagrams.
In performing their updates of the records, maps and records personnel rarely go into the field. If a field check is required, they will normally ask one of the Primary Trouble Men (PTM’s) to perform the field check and report field conditions to them.
The field crew is responsible for notifying the Dispatcher verbally of any changes from the design of the “as – built ” construction. The Dispatcher documents these changes and forwards the changes to the Maps and Records Department via a Mapping Revision Order (MRO). HECO is not performing routine post construction audits to assess the adherence of construction to design, and accuracy of the mapping system. They believe their records to be about 80% accurate.
Technology
HECO is using G/Technology by Intergraph as their GIS system. Their future plans are to tie their design system in with the GIS so that job designs feed the maps.
HECO has created a database for creating and tracking a computerized MRO. This has not yet been implemented.
[1] HECO does have a small mapping group that is part of System Operations.
7.4.5.12 - National Grid
Design
Mapping/Recording “As-Builts”
People
Mapping systems at National Grid are maintained by a mapping group located in Syracuse. For network systems infrastructure, master archival copies of underground conduit maps are kept in Syracuse, with working copies kept at the Albany office.
Post-construction audits are organized by National Grid’s Distribution Engineering Services group for the purpose of identifying opportunities for improvement in both design and construction. The Director of Distribution Engineering Services (DES) determines the number of required audits for Transmission, Distribution, and Underground construction and maintenance jobs, based on National Grid’s objectives for each fiscal year. The Director is responsible for selecting criteria for audits, and presenting audit findings to the executive management team.
Work Method Coordinators typically perform the audits. They select jobs for audit based on criteria established by the Director of DES, review the jobs prior to performing field visits, conduct the field visits and record findings, prepare reports, and review audit findings with the field. They also finalize the audit reports and participate in assessment.
Process
National Grid has implemented a GIS system. However, like many companies, the GIS and associated map products do not lend themselves readily to network systems. Consequently National Grid Albany will sometimes refer to archived underground maps of the network system kept at the Albany office. However, these maps have not been maintained. Because these archive maps are not accurate, the UG group will often perform field surveys of manholes and vaults to verify existing infrastructure and configuration prior to performing work.
Part of the work flow associated with the design of a new project is the performance of a “constructability review. “ After the design is drawn up, it is forward to a construction supervisor (Underground Field Supervisor) who meets with the designer and reviews the project to assure that it can be built as designed.
In addition, after the construction is completed, any as built changes are documented by the UG Field Supervisor and recorded so that they are reflected in the maps and records systems.
Random post-construction audits on construction and maintenance jobs take place to evaluate compliance with construction standards and assist National Grid to meet its vision of delivering unparalleled safety, efficiency and reliability.
Each fiscal year, the Work Methods Coordinators of Underground and Overhead Lines deliver a list of completed jobs that are eligible for audit based on the DES Director’s criteria. These jobs are selected from both National Grid in-house and contractor work - both maintenance and new construction. Each work order is considered a separate job for the purposes of audit, and audits are selected to try to span the division as best possible.
The first step in an audit is to review work requests and associated construction drawings for standards compliance and to become familiar with the job. If there are problems with the existing construction drawings, these are discussed with managers and the work crews. Any as-built drawings are also reviewed for changes from the construction drawings, and these are entered into the computer system to ensure the changes are properly documented.
The coordinators then go into the field with an audit checklist to inspect and take photographs. Field notes and pictures are used to build an audit report using a template provided by Distribution Engineering Services. Major and minor findings are documented, along with an overall summary of the audit.
Work Methods Coordinators meet with the field staff to discuss any extenuating circumstances or material issues that might have prevented the job from being constructed as designed. If necessary the designer is brought into this discussion. The audit report is then updated with any additional findings from this meeting.
Work Methods Coordinators meet to discuss the audit findings and assign the audit report a grade based on a grading standard on the DES information network. All audit reports are combined into a consolidated report with an executive summary of audit findings for the fiscal year.
Technology
Maps used for underground work include an index operating map, a single line operating map for each feeder showing the sectionalizing points including high side switches and NP’s in each vault on the feeder.
Maps also include UG conduit drawings, showing the duct back configurations and circuit routing in each vault and manhole.
National Grid also has secondary prints, showing the location, size and type of the secondary cable system components. Small service jobs are drawn up in GIS. Larger jobs are prepared in Microstation.
At the time of the EPRI Immersion, National Grid had embarked on a company-wide mapping project to reduce the number of different mapping products used at National Grid. A Distribution Standards representative is part of the project.
7.4.5.13 - PG&E
Design
Mapping/Recording “As-Builts”
People
Network maps are maintained by the Division Mapping group. Each division has its own mapping group; that is, there is a mapping group for San Francisco and another for Oakland. Organizationally, these groups report to the Distribution Engineering and Mapping organization, led by a Director. Within the Division Mapping group, PG&E has a senior mapping person working with the primary system, and another mapper working with the secondary system.
PG&E also has mappers who work within Division Operations (DO Mappers). These mappers are responsible for maintaining the circuit maps that depict the network within the operations center.
Process
Changes to the maps of the network infrastructure are driven by the planning engineer in most cases, as Planning initiates and performs the design of most changes to the network. Even changes to the maps driven by emergencies will flow through Planning, as crews will often involve planning in the developing the solution to the problem.
PG&E has an up-to-date documented procedure for maintaining network maps. (See Attachment C .)
One network map used at PG&E is the Circuit Map. The circuit map is a semi-schematic type of map that shows sectionalizing points and transformer locations for network primary circuits. Circuit maps are drawn and maintained by the Division Operations (DO) mappers using a CAD system.
Projects that go to construction are accompanied by job drawings, which may be a section of a circuit map marked up with the changes. At the conclusion of a job, the crews prepare a circuit drawing showing the network changes. This circuit drawing can either be hand drawn or assembled by cut and pasting copies of the circuit drawings provided with the project. The drawing indicates both the former circuit configuration and the present (post construction) circuit configuration.
These circuit drawings, indicating the field changes, are sent through Division Operations, where DO mappers update the Division Group Maps, which are displayed on the Operations center wall. These changes are made within 1 – 3 days of the when the change is received.
The changes then flow to Division Mapping, who makes the changes to all other maps and records maintained by PG&E for network infrastructure, including circuit maps, block maps, route sheets, and the update of the SAP Asset Register for certain network equipment changes. Division Mapping also updates maps in the Division Emergency Center (DEC). These maps and records changes affecting the primary system are made from within 1 to 5 days of receiving the changes in Division Mapping.
Another source of maps and records changes are corrections to the maps received from the Compliance group. In performing their work, the Compliance group may encounter maps and records discrepancies. Copies of the network transformer and network protector maintenance inspection checklists are sent to Division Mapping noting the changes to be made to the maps and records.
PG&E does not have a formal process for performing post construction audits of network projects.
Technology
For Network Systems, PG&E is utilizing various types of maps.
-
A Circuit Map, which is a CAD drawn, semi – schematic map showing primary feeders, sectionalizing points, and transformer locations. See Attachment D for sample Circuit Map
-
Distribution Map (Block Map), which shows all the network facilities (primary and secondary) in a given geographic area (usually a city block). These maps include a “Duct Side Drawing” which shows a plan view layout including duct bank configuration in each manhole. Note that the block maps show taps, but not inline splice locations. See Attachment E for a sample block map. These maps were originally hand drawn and maintained, and are now updated in CAD.
-
Route Sheet, which is a tool for physically (geographically) going from one vault to another, to facilitate performing switching to establish a clearance on network feeder. When division mapping updates SAP, they will also update the route she is the change to the system affects the route sheet itself.
PG&E has an in house GIS system called DART that models the radial system. However their network facilities beyond the network feeder circuit breakers are not represented in GIS.
When the system change involves a new network transformer, the Planning engineer is notified of the change so that he can provide division mapping with a new network bus number and specify what customers should be assigned to this new bus. Division Mapping then creates this new network bus within the DART system and reassigns customers to the new bus. This information is used for load modeling by the Planning engineer.
SAP serves as the asset register for network equipment. Division Mapping will update SAP to reflect system changes. When they update SAP, Division Mapping will also update the route sheet if affected by the system change.
PG&E has implemented wireless laptops on trucks to access the mapping information real time.
7.4.5.14 - Portland General Electric
Design
Mapping/Recording “As-Builts”
People
The “Mapper/Designer” working for the Service & Design group at the Portland Service Center (PSC) is responsible for recording “as-builts" associated with network projects.
The “Mapper/Designer” reports to the Supervisor of Service & Design at PSC and provides the computer-aided design (CAD), geographic information system (GIS), and design service. Mapping facilities also involves PGE’s GIS department, which verifies that any designs have electrical connectivity and ensure that ArcFM GIS contains the latest design.
Process
When designing a system, designers produce an electrical map used by the construction crews to mark up as-built field changes.
The Mapper maps everything in ArcFM GIS. When the field job is completed, it comes back to Service & Design to develop the “as-built” model and document the as-built. Once everything has been set up in design draft version on the GIS, the final post is entered on the GIS. The GIS holds the electrical drawings and conduit plans, while vault details stand alone.
Following the “as-built” finalization, the GIS Department sees the work order in Maximo and the design in “draft version” within ArcFM. The GIS Department performs some quality assurance/quality control (QA/QC) to make sure that there is electrical connectivity in the plan/design. This ensures that the required attributes are in the system, such as operating voltage, cable type, etc. The department also runs a reconciliation process to determine that nothing was missed due to other builds in the area, again ensuring electrical connectivity. This process ensures that the GIS contains the latest design.
After the structure has been built, the conduits used are marked on the field drawing and then noted in the GIS. PGE is starting to take pictures/images of vaults that can be included as part of the package. The design package and vault details are created for new construction but updated to reflect the in-vault conditions identified by the field force that differs from the records. Discrepancies are sent back to mapping and design for correction.
Butterfly Maps/Conduit Plans: PGE has butterfly maps for Class A vaults used to facilitate customer discussions, as they include information about customer requirements. The butterfly map does not show the locations of moles, splices, or cable limiters.For a vault, the conduit plan may warrant its own sheet and plan if it is particularly complex. The city requires permits; thus, for any construction on the network, PGE draws up a separate conduit plan.
Paper Maps: PGE migrated from Frame Intergraph and a CAD database to ArcFM. However, the new mapping is not yet updated and many paper maps that are not particularly accurate still exist. The secondary side of the network was never mapped but all recorded on paper, so there still is a backlog, which is migrating over to electronic format. PGE has faced challenges in how to view some of the diagrams/maps in the new ArcFM for the network. The feeders are clustered together, making it difficult for workers to view and understand the layout.
GIS Strategy & Roadmap Project: PGE is presently undertaking a GIS strategy and roadmap project to look at areas for improvement and develop a strategy. The company is identifying performance issues, functionality, usability, and resources. Similarly, it has embarked on an effort to improve the overall mapping accuracy in the network. Accordingly, PGE is gathering and consolidating documentation about the CORE network system, including the “butterfly” drawings for each vault and manhole.
Technology
Geographic Information System (GIS) – ArcFM/ ArcGIS
To support planning, engineers use ArcFM, which is built upon ESRI’s ArcGIS system. Users can access ArcGIS mapping software via a browser, desktop application, or mobile device, and organizations can share maps and data. ESRI’s system allows users to capture, analyze, and display geographical information, enabling display of maps, reports, and charts.
GIS is used to map assets and circuits, and can be linked to the customer information system and other enterprise applications. The maps provided with ArcGIS include facility maps, circuit maps, main line switching diagrams, and a service territory map [1,2].Operators can use ArcGIS to schedule work and dispatch crews, and they can also locate crews and view work status and progress [3].
With ArcGIS, operators and crews can locate assets and infrastructure, as well as determine how they are connected. The view of the electrical system includes connectivity, service points, and underground assets. Crews can follow how current flows through the interconnected network and determine upstream and downstream protective devices. The GIS allows users to overlay external data, including images, county maps, and CAD files onto the map view.
The GIS includes the ArcMap and ArcFM viewer, which allows designers to use compatible work units and send these to the Maximo system. In 2017/2018, PGE will investigate processes for transferring Arc GIS information into CYME, which will require a software development from the vendor, Schneider Electric. ArcFM will be built on top of ArcGIS, and the system will allow engineers to use CYME, which is presently used on the radial system, for the network.
ArcFM GIS software will help engineers design network layouts and create a package with details for relevant personnel. Schneider’s software is a map-focused GIS solution that allows users to model, design, maintain, and manage systems, displayed graphically alongside geographical information. ArcFM uses open-source and component object model (COM) architecture to support scalability, user-configurability, and a geographical database.
- ArcGIS Solutions. “Electric Facility Maps.” Solutions.ArcGIS.com.http://solutions.arcgis.com/utilities/electric/help/electric-facility-maps/ (accessed November 28, 2017).
- Smart Grid Report. Portland General Electric, Portland, OR: 2017. http://edocs.puc.state.or.us/efdocs/HAQ/um1657haq16327.pdf (accessed November 28, 2017).
- GIS for Electric Distribution. ESRI, Redlands, CA: 2010. http://www.esri.com/library/brochures/pdfs/gis-for-electric-distribution.pdf (accessed November 28, 2017).
7.4.5.15 - SCL - Seattle City Light
Design
Mapping/Recording “As-Builts”
Process
Network Maps and Asset Records
SCL utilizes a home-developed system called NetGIS as their repository for network
asset records, and to produce network maps. NetGIS enables SCL to produce CAD maps, and to maintain records associated with each network vault.
SCL personnel can obtain maps from the system, and can click onto a vault to
obtain a description of the equipment contained in the vault including:
-
Splice type and information
-
Ductbank configuration
-
Civil information
-
Ground points
-
Bus bar
When a change is made to the network, the GIS section updates the network feeder maps in NetGIS.
Technology
SCL utilizes a home-developed system called NetGIS. NetGIS is their repository for network asset records, and also the product they use to produce network maps. NetGIS is not a full, graphical geographic information system (GIS) system with electric connectivity. Rather, it enables SCL to produce CAD maps, and to maintain records associated with each network vault.
Note that their load flow analysis product is not tied in with NetGIS.
7.4.6 - Network Area Substation Design
7.4.6.1 - AEP - Ohio
Design
Network Substation Design
People
The specification for network substation design used in the AEP Ohio networks supplying metropolitan customers in Columbus and Canton is the responsibility of the Network Engineering group. This group, led by the Network Engineering Supervisor has direct responsibility for all aspects of network design for AEP Ohio, and provides a consultative support role to the other AE operating companies. Organizationally, the Network Engineering group is part of the corporate Distribution services organization, geographically based in downtown Columbus at AEP Ohio’s Riverside offices, and ultimately reporting to the AEP Vice President of Customer Services, Marketing and Distribution Services. Distribution Services supports all AEP network designs throughout its operating companies, including Texas, Indiana, Michigan, Oklahoma, and other locations.
AEP also has a Network Standards Committee, headed by the lead Network Engineering Supervisor in its downtown Columbus offices, and comprised of representatives from all AEP operating companies. This group works closely with the parent company’s Distribution Services organizations, and holds regular teleconference sessions on network findings, “lessons learned” in the field, and discusses potential network engineering solutions to common network design and implementation issues. Network substation design issues are discussed and recommendations made through this committee.
Process
AEP Ohio has network systems in both Columbus and Canton, Ohio. Each Columbus network is built to N-2 reliability. The Columbus urban area has four separate networks – North, South, Vine, and West – supplied from three substations. Each network is supplied from 138 kV/13.8 kV Δ -Y network transformers. All four networks, about 30 MVA each, are served by six dedicated network feeders at 13.8 kV, with each group of six originating from a single substation. There is no overlap in these networks. This is a preferred design in that the network feeders are sourced at the same voltage, which minimizes the possibility of problems with network protectors pumping or cycling. AEP reports few problems with protectors pumping, cycling, or opening under light network loading.
Substations supplying the network utilize a ring bus design, and consist of multiple substation transformers, with one used as a ready reserve hot spare unit. The substation transformer secondary (medium voltage) buses are connected in a complete ring with closed tie circuit breakers between all buses. Network feeders supplying any one network emanate from at least three secondary bus sections, with no more than two network feeders originating from any one bus section. Multiple station transformers are connected so that a minimum of two transformers operate in parallel during normal operation. Circuit breakers are then used to automatically remove any faulted bus sections from service without impacting normal operations. This provides N-2 service to all existing customers in the downtown region. All stations have a minimum of three transformers, with some having as many as five or six.
In Columbus, the Vine network primarily serves spot networks in a high-rise area of downtown (Vine station), with some mini-grids at 480 V. The other three networks (North, South, and West) serve a mix of grid (216 V) and spot loads.
Canton has one network supplied at 23 kV. The station that supplies Canton is designed to N-1, though networks themselves are also designed to N-2.
Technology
AEP has SCADA monitoring and control of its network feeders.
The Network Engineering group is responsible for maintenance and upgrades to the network substation designs. The group has sponsored various projects to enhance network substation functionality, including replacing all electro mechanical relays with microprocessor-controlled relays, modernizing the control house building and performing manhole repairs at station exit locations.
AEP is installing a master trip and close system that will enable the dispatcher to drop or pick up an entire network as a group, or be to enable or disable selected circuits to be operated.
At the time of the practices immersion, AEP is installing a significant upgrade in its network remote monitoring and control system. (See Remote Monitoring System )
7.4.6.2 - Ameren Missouri
Design
Network Substation Design
People
Distribution planning of the network at Ameren Missouri, including the planning of the substations that supply the networks, is performed by resources in several groups.
Area planning for the distribution system is the responsibility of Distribution Planning and Asset Performance. This group, led by a manager, is staffed with four-year degreed engineers, and includes the Standards Group as well as a planning engineering Group. Organizationally, Distribution Planning and Asset Performance is part of Energy Delivery Technical Services, reporting to a vice president.
Local distribution planning of both the network and non-network underground infrastructure in St. Louis is the responsibility of the engineering group within the Underground Division. This division is led by manager, and consists of both engineering and construction resources responsible for the downtown infrastructure. The engineering group is led by supervising engineer, and is comprised of Engineers and Energy Services Consultants (commonly referred to as Estimators) who deal with planning, design, and service issues. The engineers are four-year degree positions. Energy Services Consultants have a combination of years of experience and formal education, including two year and four year degrees. The engineers are nonunion employees; the estimators are in the union. Organizationally, the Underground Division is part of Energy Delivery Distribution Services, reporting to a VP.
Finally, Ameren Missouri has formed the “Underground Revitalization Department,” a team of engineers (all 4-yr degreed) focused on researching, evaluating, and developing plans for performing capital improvements to and revitalizing downtown St. Louis, including the network. Part of this group’s role includes addressing issues such as the development and update of planning criteria for the network. At the time of the practices immersion, the revitalization team had developed a series of planning criteria documents, including criteria for loading, route diversity, sectionalizing, and application of automation. In addition, they had developed recommended requirements for cable replacement, and conduit system design and replacement. This group is also performing area planning for the network, including the planning of new substations to supply the networks.
Organizationally, the Underground Revitalization Department is part of the Underground Division.
Process
The design of the distribution network system serving St. Louis consists of four distinct secondary network grids each supplied by a separate substation.
Together, the four network substations supply about 205 MVA of load. Three of the stations are sourced at 138 kV from overhead supplies, while one is served at 35 kV from an underground supply. Two of the substations are relatively new, and two are more than 50 years old.
Of the four substations, three of them have three transformer units each. In one of those three stations, two of the units are online, with one held in reserve. In the other two stations, all three units are in service. The fourth station is a two unit station.
At the time of the practices immersion, Ameren Missouri, through its downtown revitalization project, was developing plans to replace the oldest substation (the one with the 35kV supply), with a new station in a different location, as the oldest station is also out of phase with the other three.
Ameren Missouri’s substation design uses a ring bus with no more than two network feeders fed off of the same bus section at the station. A given bus section may serve both radial and network feeders. Network feeders are fed directly off of the substation bus (as opposed to radial feeders which feed through reactors to limit fault levels).
Technology
The network substations are each equipped with SCADA, monitoring and controlling network feeders and monitoring network equipment. The communications backbone is optic fiber, with two way communications to each network vault.
7.4.6.3 - CEI - The Illuminating Company
Design
Network Area Substation Design
People
Substation Design is the responsibility of the Transmission and Substation Design group, a corporate function at FirstEnergy responsible for the entire FirstEnergy system.
Process
As the load in downtown Cleveland has been on the decline, the existing network infrastructure has adequate capacity to carry the load, and in fact, has excess capacity. Consequently, CEI is not planning any new network substations or any expansions or modifications to the network substation serving the downtown network.
Hamilton Sub supplies the Network as well as other downtown load. It is supplied by two 138 kV sources (1957 vintage oil filled pipe type cables) feeding four substation transformers with dual secondary windings, supplying 12 isolated 11kv bus sections with manual ties. The network feeders and load are staggered among the bus sections / transformers to maintain N-1 reliability.
For new substation installations, FirstEnergy’s general philosophy is to utilize smaller modular substations “mod subs” with smaller transformers and minimal feeders emanating from each substation. These mod sub installations would be replicated to meet the load requirements in normal and contingency situations. In dense urban situations, alternative substation designs may be required.
Technology
The 138 kV oil filled pipe type cable system has been highly reliable for CEI. The CEI Underground department is responsible for the maintenance of this cable. The department manager acknowledged that if he had a problem with this cable, he may have to bring in outside help to aid him in resolving the problem as he may not have the expertise in house.
7.4.6.4 - CenterPoint Energy
Design
Network Area Substation Design
People
Substation Design is the responsibility of Substation Engineering, not part of Major Underground. Substation engineering at CenterPoint balances workload between internal and contract resources. Substation construction is contracted.
Process
CenterPoint supplies its network systems from three dedicated substations. These substations are supplied by a primarily overhead 138kV transmission system.
Distribution voltages supplied by these subs are 12 kV and 34.5 kV. The 35kV station uses 2 or 3 100 mVA units, designed to N-1. The 12.5 kV stations use 2 or 3 50 mVA units, also designed to N-1.
For contingency planning purposes, CenterPoint plans for the loss of the highest firm rated substation transformer.
As part of a risk mitigation strategy, CenterPoint recently implemented contingency plans for the loss of the entire station that supplies the 34.5 kV major underground system. This system serves critical loads, such as major hospitals and universities. CenterPoint extended feeders from other stations and built overhead tie points to be able to back up the load even in the event of the catastrophic loss of the entire station. In addition, CenterPoint maintains spare substation transformers.
7.4.6.5 - Con Edison - Consolidated Edison
Design
Network Area Substation Design
People
Organization
Central Engineering - Responsibilities include Civil / Mechanical Engineering, Control Systems Engineering, Design Engineering, Electrical Engineering, Equipment and Field Engineering, and Environmental Engineering & Program Support.
Engineering and Planning - Responsibilities include Energy Services, Distribution Engineering, Operations Services, Marketing and Sales, Planning and Analysis, and D.C. Elimination.
Employee Development
Con Edison invests in developing its design employees through three distinct programs focused on employee development. One program is focused on the development of newer engineering employees, another at incumbent employees, and the third at bargaining unit employees who are entering the management ranks. The programs are described more fully on page 3-53 of this report. Note that these programs are not limited to design employees, but are available to all employees who qualify.
Process
Substations in Manhattan and central Brooklyn are designed with a second contingency. Other Con Edison substations are designed for a first contingency.
Area Substation design (N-2) calls for five substation transformers (normally 65 MVA units) — four connected, and one spare that is energized but not connected.
Substations are designed with a double synchronous bus (Syn Bus), and major and minor bus sections (32 primary feeder positions at 13.8 kV). Area substations are designed to source two networks.
Network feeders are fed off of the minor bus sections. Diversity is built into the bus arrangement. More specifically, feeders are arranged so that if Con Edison loses a minor bus section, each circuit fed by that bus section doesn’t service the same area. In other words, if a pair of primary feeders is supplying a particular area, those feeders are supplied from different minor bus sections.
(See Attachment B ) . This attachment is not an actual Con Edison substation operating diagram, but is a representative diagram for a substantially established substation. A completely built-out substation might have four circuit breakers on many busses and have many feeders bifurcated (see 12E & 41W).
Some area substations are located in the bottom floors of buildings, with a multilevel design. For example, in one location, the substation transformers (138 kV: 13.8 kV) were located on the ground floor of a building. The syn bus, minor busses, circuit breakers, and a small control room were located on the third floor. This particular substation also housed a small Control Room, manned on day shift. The primary feeders fed down to the floor below the sub-transformers to source the network.
Primary feeders sourcing the networks either feed right into the networks, or are spliced if the bending radius or other factors prevent a direct pull. The Underground Group (Splicers) is responsible for making the terminations at the substation transformer secondary (13.8 or 27 kV).
7.4.6.6 - Duke Energy Florida
Design
Network Area Substation Design
Technology
In Clearwater, Duke Energy Florida has a true low voltage meshed secondary network. This network, a 125/216V grid, is supplied by three medium-voltage (7200/12470V) wye connected primary network feeders fed out of one substation. The substation that supplies the network is a large four-transformer station that supplies non-network loading as well. While all three network feeders are fed out of the same substation, the feeders are supplied from separate bus sections at the sub (open bus ties to manage fault currents – not using phase reactors), sourced by separate transformers. Because the feeders are supplied by three sources and have different loads, and because the network is very lightly loaded, Duke Energy Florida has experienced issues with open and frequently operating network protectors on their Clearwater system. Duke Energy Florida expects this situation to improve as the remaining non network load is removed from the feeders, and as planned new loading is added to the system.
St. Petersburg underground infrastructure is fed by 12 different feeders supplied from three different substations. The company moved away from a network grid system in St. Petersburg years ago, with eight two-feeder 277/480V spot network locations remaining in the system. The two feeders supplying any one spot network location are sourced from the same station. Most of the infrastructure in St. Petersburg is supplied by a primary and reserve feeder loop scheme, with automated transfer switches (ATS). The ATSs are tied in with SCADA and can be monitored and controlled from the DCC.
7.4.6.7 - Duke Energy Ohio
Design
Network Area Substation Design
People
Network area planning, including planning of the substations that supply the network, is the responsibility of the Distribution Planning group, within the Asset Management organization. Network Substation design, including modifications to the existing substations that supply the network, is the responsibility of a substation design engineer within the Transmission Planning organization. This engineer will involve the distribution planning engineer on the distribution part of the substation design.
Process
The design of the distribution network system serving Cincinnati consists of two network substations supplying four distinct secondary networks (two networks supplied by each substation). Three of the four networks in downtown Cincinnati are supplied by eight feeders, each, and the fourth network, by four feeders.
The two network substations are located close to one another, and are sourced at 138 KV. Parallel 138 kV feeders join the two substations.
One station has four 67MVA transformers, and the other, three 90 MVA units and one 67 MVA unit. Each station uses a ring bus arrangement on the secondary, with network feeders supplying a given network sourced from separate buses within the substation.
Each substation is visited at least weekly by night time mobile operators who perform inspections and network protector drop tests. Mobile Operators are responsible for performing switching and tagging within the substations.
Technology
The network substations are each equipped with electronic keying, and video monitoring.
One of the substation houses permanently stationed fault location equipment (Thumpers) as it is a multiple level station. The other station is located on the ground level, and can be accessed with a thumper van.
Power quality monitors are also positioned in each of the substations, measuring current and voltage coming off the transformers, supplying each network feeder.
7.4.6.8 - Energex
Design
Substation Design
People
Zone Substation Design
The Systems Engineering group, led by a group manager, and part of the Asset Management organization is responsible for Zone Substation Design Standards. This group is responsible for establishing the design standards for zone substations. Energex also has a Design organization within its Service Delivery organization, also led by a group manager, and responsible for performing designs of specific projects, including new construction and system reinforcement projects. The Design group is comprised of four year degree qualified engineers and engineering associates. Project engineers apply the appropriate, approved Zone Station Design standards and lay out the projects using the Energex design tools, such as Microstation and AutoCAD.
(See the Standards section of this report.)
Medium-Voltage Substation Building Vault Design
The Systems Engineering group, led by a group manager, and part of the Asset Management organization is responsible for medium-voltage substation building vault design. The Design group is comprised of four year degree qualified engineers. Project engineers apply the appropriate, approved medium-voltage substation building vault design standards and lay out the projects using the Energex design tools, such as AutoCAD.
Process
Medium-Voltage Substation Building Vault Design
Medium-voltage substations in the CBD are usually located within building vaults. The medium-voltage stations consist of primary (11 kV) switches protected by bus differential relaying, transformers, and secondary switchgear which supplies both the building load and feeds into the low-voltage network serving the CBD.

Figure 1:
Energex Employee giving safety briefing before entering a C/I substation, located in a building vault

Figure 2:
Dry type transformer supplied by the three feeder mesh

Figure 3:
Primary terminations (PILC) on dry type transformer

Figure 4:
Multiple dry type transformers

Figure 5:
Circuit breakers with bus differential relaying

Figure 6:
Low-voltage switchboard, with feeds to the customer
At some locations, Energex may “Tee” off the primary feeder with a substation consisting of an SF6 gas insulated ring main unit (the primary switch gear current design) with an “in” switch, an “out” switch, and a fused, switched tap leading to the transformer. The use of a packaged substation with a ring main unit is a common design outside of the CBD.
In URD applications, Energex uses a similarly designed “packaged” substation (see Figure 7), which is a pad-mounted unit consisting of the ring main unit (“in” switch, an “out” switch, and a fused, switched tap leading to the transformer), the transformer, and the low-voltage switchboard supplying the low-voltage network feeding the development (see Figure 8). Note that URD developments are fed by an extensive low-voltage network feeding through mini-pillars. Services are tapped from these mini-pillars to serve customers (see Figure 9).

Figure 7:
Typical pad-mounted 'packaged' substation supplying UG development (another view). Note mini pillar to the right of the sub

Figure 8:
Low-voltage switchboard supplying the LV network feeding the development

Figure 9:
Typical Home, note mini pillar in the foreground supplying the customer
Energex has SCADA at the substation, and some remotely monitored and controlled normally open tie points between 11 kV feeders out on the system, but in general, Energex has little SCADA beyond the substation. Energex is currently installing a power quality (PQ) meter on the low-voltage side of all distribution transformers greater than or equal to 300 kVA, three phase.
Technology
Zone Substation Design
The 11 kV distribution network supplying the central business district (CBD) in Brisbane is supplied by four zone substations. These zone substations are fed by 110-kV transmission via both underground and overhead transmission feeders and supply the network through 110-kV:11 kV transformers (see Figures 10 through Figures 11).
Typical transformer sizes are 60 or 80 MVA Wye-Delta units. In order to provide an earth reference for the 11 kV network, an earthing (grounding) transformer is connected to the 11 kV output of the main transformer (see Figures 12 and 13). All of the zone substation transformers have dual windings supplying the 11 kV bus. They regulate voltage at the stations with a combination of tap changers and capacitors.
A typical zone substation may supply 6 or 7 feeders from an 11 kV ring bus. All bulk and zone subs have full SCADA. However, Energex has deployed very little SCADA or automation beyond the substations.

Figure 10:
Gas insulated switchgear at Energex. 110:11 kV zone substation

Figure 11:
11 kV cables emanating from zone substation transformer secondary side

Figure 12:
Earthing transformer at zone substation

Figure 13:
Cables exiting zone substation

Figure 14:
Cables exiting zone substation
Medium-Voltage Substation Building Vault Design
At the time of the immersion, Energex was in the process of implementing the PowerOn Distribution Management Product from GE, which provides electronic displays of the distribution networks, both medium voltage and low voltage.
7.4.6.9 - ESB Networks
Design
Network Substation Design
(Network Substation and MV Substation Design)
People
The design of the substation infrastructure is performed by designers located within the Network Investment Management groups for larger designs, and within the ESB Networks Regions for the smaller designs. The Network Investment Management groups (North and South) are part of the Asset Investment group, within Asset Management. The Regions are organizationally part of the Operations Management Group, also part of the Asset Management organization.
Most designs are performed by an Engineering Officer – the designer position at ESB Networks.
The development and maintenance of guidelines for performing network substation design are the responsibility of the Specification Management group, part of the Asset Investment group, also part of the Asset Management organization at ESB Networks.
The Specifications Management group has developed thorough guidelines for the design of substations. This guideline includes specific direction for optimizing designs.
Note that in addition to the Operations Management and Asset Investment groups, the Asset Management organization consists of Program Management, Infrastructure Stakeholder Management, Assets & Procurement, and Finance & Regulation. These groups work closely together to manage the asset infrastructure at ESB Networks.
Technology
Network Substation Design
In Dublin, ESB Networks uses a meshed 38-kV substation design. ESB Networks has six 38-kV meshes in the Dublin area, two North, and four South. (Outside of Dublin, the 38-kV system is either radial or looped.) The mesh is a closed loop system supplied by transformers at either end supplied from different substations. The system is protected by impedance and differential relays, and can isolate interruptions in milliseconds.
The system provides high reliability, providing n-1 even with the loss of a feeder section. In the loss of any circuit section - the remaining transformers don’t see a loss of supply. In the loss of a sub transformer, the load is supplied from the remaining transformers. For planned work, ESB Networks may couple mesh systems to maintain security of supply.
Note that if ESB Networks takes out a 38-kV cable for service, it also may take out one of the substation banks because of the short circuit duty.
To prevent circulation among the substation transformers that comprise the mesh system, the transformers are interconnected with communications with one transformer considered the master, and as its voltage varies, the other units (slave units) follow suit by changing taps to match the master. In an abnormal operation, if a cable is taken out, for example, ESB Networks has the ability to access a screen within their SCADA, and regroup the transformer master/slaves relationships to reflect the abnormal configuration.
In its 38-kV system at ESB Networks, the neutral is arc suppressed using an arc suppression coil to counter the capacitive effects of the cable.
ESB Networks’ MV system is fed by radial cables. In Dublin, the MV system is a 10-kV system. In most of the rest of Ireland, ESB Networks has converted much of the 10 kV to 20 kV.
MV Substation Design
ESB Networks uses a standardized MV “packaged substation” consisting of an SF6 gas insulated ring main unit, the MV transformer (in Dublin, typically a 10-kVA primary to a 430-V secondary), and the secondary bus and protection that feed the secondary “mains” that supply the LV system in downtown Dublin.
The current design of the primary switch is an SF6 gas insulated ring main unit device (see Figure 1), with an “in” switch, an “out” switch, and a fused, switched tap leading to the transformer (kkt). The company describes these units as “maintenance free,” and obtains them from a supplier through a lease arrangement. ESB Networks does have older oil insulated devices installed on its system as well. These devices must be manually operated from within the indoor room. ESB Networks has not implemented automated control of these devices.

Figure 1:
SF6 gas insulated ring main unit
ESB Networks’ design is to loop its 10-kV MV feeders in and out of these switches, designing normally open tie points between feeders. This provides them the ability to sectionalize to isolate outage sections and to feed each MV transformer from either direction. Note that ESB Networks does utilize faulted circuit indicators. These are not remotely monitored, as ESB Networks engineers have determined that it is not economical to remotely monitor fault indicators unless remote switching capability is also implemented.
ESB Networks’ standard primary switchgear (ring main unit) is a “load make,” but not a “load break” device. The switch is designed with an anti-reflex handle that prevents an operator from inadvertently and reflexively opening the switch if the operator happens to close into a fault, as the device cannot break load. If the operator does close into a fault, ESB Networks relies on the tripping of the breaker that sources the 10-kV feeder.
The primary cable that runs from the primary switchgear to the transformer is laid in a cable tray (duct), easily accessible by removable duct covers either made of wooden blocks, or a glass reinforced polyester material.
Standard transformer sizes are 200, 400 and 630 kVA, with the 630-kVA unit being the most prevalent. Most customers in Dublin are served from the secondary system, but Dublin does have about 170 customers that take primary service at 10 kV - packaged substation. ESB Networks’ standard transformer is a dual-voltage unit, as most of its service territory outside of Dublin is served at 20 kV, while the feeders supplying downtown Dublin Park are 10 kV (see Figure 2 and Figure 3). ESB Networks describes these transformers as sealed units that do not require routine oil testing.


Figure 2 and 3:
Transformer
Secondary mains emanate from a secondary cabinet mounted adjacent to the transformer. The secondary mains are fused (see Figure 4 and Figure 5).

Figure 4:
Secondary mains – fuse cabinet

Figure 5:
Secondary fuse
ESB Networks’ standard switch unit can be motorized. ESB Networks can use these motorized switches to implement some urban automation. ESB Networks installs remote control in the MV switchgear, and plans to use this at stations that serve government buildings.
7.4.6.10 - Georgia Power
Design
Network Substation Design
People
Network standards, including the standard for network underground substation design, are the responsibility of the Standards Group and the Network Underground design engineers. These engineers are part of the Network Engineering Group, or principal engineers that report directly to the Network Underground Manager.
Organizationally, the Network Underground group is a separate entity, led by the Network Underground Manager, and consisting of engineering, construction, maintenance and operations resources responsible for the network underground infrastructure, including the development of standards for network equipment.
Network design is performed by the Network Underground Engineering group, led by a manager, and comprised of Engineers (Electrical and Civil) and Technicians concerned with the planning, design, and any service issues associated with the network. The Engineers are four-year degreed positions, while Technicians have a combination of years of experience and formal education, including two-year and four-year degrees.
Area Planners are responsible for performing studies to assure adequate transformer capacity. While part of a central organization, area planners are located throughout the Georgia Power territory. For example, an Area planner located in the Metro East region is responsible for planning of substations that supply the Atlanta network.
Standards were first documented and codified in the 1970s, and they include what was already documented on the network from the 1940s and any new standards developed since then. It is a living document, and the responsibility of the Standards Group comprised of senior engineers in the Network Underground group. Standards are available in both an online and printed book format.
Process
Georgia Power supplies 35 separate networks in Atlanta, with most being five-feeder networks, supplied at 20 kV. Secondary grids are supplied primarily at 120/208 V. Georgia Power also has many spot networks, supplied at 480 V.
Georgia Power supplies the downtown networks from multiple substations. Some substations supply only network load, while others supply both network and non – network loads. However, even at these mixed stations, Georgia Power uses “network only” transformers within the substation. These units supply bus sections that supply only network feeders. All feeders supplying any one network are fed off of the same substation bus.
Area Planners design the stations so that there is always capacity at the station to back up network feeders, as network feeders at Georgia Power have historically been designed without tie points outside the station. (Note - at the time of the immersion, GA Power was beginning to put normally open ties between network feeders at selected locations). For example, at a three-station bank, where one transformer is dedicated to supplying network load, and the other two-supply non-network load, the units that supply the non-network load would be sized with reserve capacity to back up the network load in the case of the loss of the network transformer (N-1).
There are two exceptions to the network-only feeders from substations:
- in an emergency and there are no alternate network feeders to take up the capacity from a lost network transformer [an N-2 situation]
- the MARTA rapid transit system. Georgia Power has made an exception in the case of the transit line because its entire system is in duct line and well protected from any possible damage.
Georgia Power uses LTC transformers to regulate voltage of the bus that supplies network voltages. This assures that all network feeders supplied by the bus are supplied at the same voltage, yielding good performance of the network system. (Georgia Power reports no problems with protectors cycling or pumping, for example). This approach to voltage regulation differs from the approach used in the non-network distribution system outside of Atlanta, where single phase regulation is the standard.
In Atlanta, Georgia Power typically limits its network size to 40MVA, although they do have some 50MVA networks (about 10MVA per feeder). Any customer asking for service is supplied by this network bus standard because Georgia Power’s Underground Network group feels it is more reliable and uniform, making on-going expansion and maintenance easier.
The company currently does not have a lot of room in the downtown Atlanta area for new substations.
Typically Georgia Power prefers to keep loads in the 70 to 90 percent range, and any transformer or network segment exceeding 90 percent loading is prioritized and tagged for the Area Planner and engineering for analysis, to add more capacity through additional transformation, off-loading service to another network grid, or by adding substations.
One unique aspect of the Georgia Power transformer operations is the use of re-rating of transformers for reserve contingency. By examining test criteria on a given transformer, Georgia Power may find the transformer capable of 115 to 130 percent of nameplate ratings through objective tests. The company then knows they have that reserve capacity in an emergency. High-priority (24x7 operations) and high-capacity customers are never put on re-rated transformers.
Duct bank configuration is standardized, as is racking within manholes. Primary feeders are in duct line at the bottom positions, with secondary feeders at the top. Configurations can vary according to the duty needed, and may be 2X4, 2X6, etc. Georgia Power is specifying six-inch duct line wherever possible to accommodate EPR and PILC cables greater than 750 MCM. Its older network sections, primarily in downtown Atlanta, have 4 inch conduits. As a result, Atlanta uses mainly lead cable in these constrained spaces. They are committed to keeping lead cable, as Georgia Power has found it to be very reliable and easily contained in the older four-inch conduits where cable size is limited.

Figure 1:
2 x 6 duct bank
A notable practice in cable racking in vaults and manholes is the use of the Georgia Power Peachtree racking system. Primary feeders are racked on the bottom, secondary are racked on the top, and the neutral on is on the very top. The Peachtree racking design allows for future expansion. Engineers may not need all four directions; but designers believe they have to put feeders in the right place for easier expansion. Feeders are numbered as well, from 1-6, also to more easily accommodate expansion and maintenance.
In cases of customer premise - based transformers, such as a spot network vault, Georgia Power supplies customers with detailed vault construction reference drawings. It is up to the customer to build and maintain the vault structure. Before installation of transformers and during vault construction, Georgia Power inspects the vault to make certain it meets with their standards. It is common practice for Underground Network group engineers to inspect the customer site before making vault recommendations (See Figure 2).

Figure 2:
Spot Network Vault
Technology
Georgia Power has recently acquired CYMDIST to model the entire secondary and primary grid. The program is designed for planning studies and simulating the behavior of electrical distribution networks under different operating conditions and scenarios. It includes several built-in functions that are required for distribution network planning, operation and analysis. The model Georgia Power has developed is extremely accurate including cable systems, cable ratings, cable capacities and specifications.
The Area Planner keeps detailed spreadsheets, continually updated, on upcoming and ongoing projects that may require new substations or spot networks.
The Georgia Power GIS system also tracks network statistics, so that if a particular network segment reaches a threshold, it is tagged for the area planner and network design group.
The Operations and Reliability Group monitors network performance continually, and offers significant objective feedback for future network plans based on its remote monitoring data.
7.4.6.11 - HECO - The Hawaiian Electric Company
Design
Network Area Substation Design
(15kV Distribution Substation Design)
People
15kV Distribution Substation Design is the responsibility of the Substation and Telecommunications Division of the Engineering department.
Process
HECO’s 15kV substation design philosophy is to use small, repeatable, consistently designed substations. A typical 15kV substation is comprised of a 10 MVA unit, with two circuits fed out of the substation. As loads require, this “modular” concept is repeated as required to meet the load requirements. Most 15kV substations are sourced by HECO’s 46kV transmission system.
Note that HECO also has 25kV distribution supplied through 2 substations sourced by 138kV. At these stations, HECO is using 50 MVA units.
Technology
HECO has over 250 10 MVA stations on their system. They have two mobile subs, a 5 and a 10 MVA unit, and have 3 10 MVA spares on the island.
7.4.6.12 - National Grid
Design
Network Area Substation Design
People
Network substation design, including modifications to the existing substations that supply the network, is the responsibility of the Substation Engineering Services group, part of the Engineering organization within Distribution Asset Management.
Process
The downtown network in Albany is fed by two substations. The Albany network is supplied by ten dedicated network feeders – three from one substation and seven from the other substation.
National Grid’s Albany network system is designed to n-2. That is, the system is designed to ride through the failure of any two components (primary and secondary cables, transformers, network protectors, and ancillary equipment) during a system peak, with only minor overloads to transformers, primary feeders and secondary mains.

Figure 1:
Network Unit - Protector
National Grid also has a separate 277/480 V spot network system supplied by five 34.5KV feeders and serving fourteen spot network locations. Two additional customers are dual fed primary voltage customers off of these 34.5kV feeders. There are also ten customers fed from eleven spot networks off of the 13.2kV general network feeders. Three of these are 125/216v, the rest 277/480v. Additionally, there is one customer fed off of two of these 13.2kV feeders through a padmounted PMH-9 switchgear. These spot network locations are designed to n-1.
Network substations are designed with a minimum of two high voltage supply circuits and two power transformers so that the failure of any transformer or supply circuit will not affect the network supply.
Technology
The network substations are each equipped with SCADA, monitoring and controlling network feeder breakers. National Grid does not have SCADA monitoring or control installed in their network beyond the substation. (Note: National Grid is piloting the application of remote monitoring in their Buffalo, NY network.)
7.4.6.13 - PG&E
Design
Network Area Substation Design
People
Network area planning, including planning of the substations that supply the network, is the responsibility of the network planning engineers within the Planning and Reliability Department. This department is led by Principal Engineer, who is also the department supervisor. This group does distribution planning for both the network and non-network systems. Eight engineers comprise this department. Six focus on the radial system, and two focus on the network system. For network systems, the two planning engineers are responsible for both network planning and network design.
Network substation design, including modifications to the existing substations that supply the network, is the responsibility of the Substation Engineering Department. This group involves the distribution planning engineer on the distribution part of the substation design.
Process
PG&E has secondary networks in both San Francisco and Oakland.
Secondary network grids are 120/208V. Secondary network spots are at 120/208V and at 277/ 480V.
The downtown networks in San Francisco are fed by four substations, and the Oakland networks are fed by two substations. They have 12 total networks, 10 being supplied by 12kV feeders and the other two, 34.5kV feeders. Each individual network system sourced at 12 kV is fed by 6 dedicated network feeders. Of the two 34.5kV sourced networks, one is fed by 4 feeders and the other, by 5 feeders. 12 kV primary feeders supplying the networks are typically PILC, and the 35kV are XLPE.
Each network is served by feeders supplied from a single substation. However, some feeders supplying a given network are fed from separate transformers at the station. In some cases, PG&E has experienced some challenges with circulating currents, such as unintended network protector operations. At the time of the immersion, PG&E was implementing changes to resolve this issue, such as redesigning the substation configuration to supply all feeders to a particular network from the same substation transformer.
Technology
The network substations are each equipped with SCADA, monitoring and controlling network feeders and monitoring network equipment. The communications backbone is optic fiber, with two way communications to each network vault. Within the substation, communications are transmitted over copper, and then from substations back to the operations center, PG&E’s fiber based communications infrastructure.
7.4.6.14 - SCL - Seattle City Light
Design
Network Area Substation Design
Process
SCL has a network design that breaks the network load into small, isolated sub-networks to limit the number of customers exposed to an outage in the event of loss of any one sub-network. Each sub-network is sourced by six primary feeders (at either 13.8 or 26.4 kV), and is designed to N-1.
All primary feeders that source a given sub-network are sourced from the same substation. This minimizes the potential for circulating currents on the secondary system due to load imbalances between two substation sources. SCL has 15 distinct sub-networks. SCL currently has no ties between the sub-networks, nor have they applied any distribution automation (remote operation) to the network feeders beyond the substation breaker.
7.4.6.15 - References
EPRI Unde rground Distribution Systems Reference Book (Bronze Book)
Chapter Section 4.3 - Network Substation Design
EPRI Low-Voltage Training Material
Network Substation Configurations
7.4.7 - Network Design
7.4.7.1 - AEP - Ohio
Design
Network Design
People
Design of the networks serving Columbus and Canton Ohio, the two areas of focus for this urban underground network immersion study, is performed in Columbus by the AEP Network Engineering group, which is organizationally part of the AEP parent company. Within the Network Engineering group, the company employs two Principal Engineers and one Associate Engineer who are responsible for network design for AEP Ohio. These planners are geographically based in downtown Columbus at its AEP Riverside offices. The Network Engineering group reports to the AEP Network Engineering Supervisor, and is organizationally part of the Distribution Services organization, reporting ultimately to the AEP Vice President of Customer Services, Marketing and Distribution Services. In addition to responsibility for designs of the AEP Ohio networks, the Network Engineering group also provides consultative support services to the other AEP operating companies.
Two Principal Network Engineers primarily oversee the designs for Columbus networks; one Associate Network Engineer primarily oversees Canton, but often helps with Columbus-based projects. The Network Engineers are responsible for all aspects of the network design, from inception to implementation, including the preparation of work orders, material acquisition, site inspections, and project completion.
AEP Ohio also has a Network Standards Committee, headed by the lead Network Engineering Supervisor in its downtown Columbus offices, and comprised of representatives from all AEP operating companies. This group works closely with the parent company’s Distribution Services organizations, and holds regular teleconference sessions on network findings, “lessons learned” in the field, and discusses potential network engineering solutions to common network design and implementation issues.
AEP Network Engineers design the network system in Columbus to a full N-2 resiliency, including the substations and spot network locations. This N-2 reliability is notable, as most urban underground network systems operate at an N-1 level. N-2 insures that if any system components fail, the remaining facilities can carry the load and maintain service. For example, all spot network locations are designed with at least three transformers, with any one transformer able to carry the peak spot network load. The AEP Network engineers will also perform radial (non-network) designs for customers who locate within the city centers, and who do not opt for or require network service.
AEP network engineers perform all designs associated with the network, including new service projects and system reinforcement projects. The Engineers perform all aspects of design including network unit design, equipment sizing, performing load flow analyses, and preparing project drawings that describe the designs for construction.
Two Technicians assist the engineers with the preparation of drawings in MicroStation and AutoCAD. This is a full-time position and is assigned to the Network Engineering department.
All civil design for network projects, including manholes, vaults and duct lines, is also the responsibility of the Network engineers, though much of the civil design work is outsourced to a civil engineering firm. The primary Civil Engineer at that firm is a retired AEP Ohio employee who has many years of experience working with AEP Ohio underground networks.
The AEP Network Engineer responsible for customer designs works closely with the AEP Customer Service Representatives and the customer to insure designs for customer service meet all AEP as well as customer specifications.
Process
AEP Ohio has network systems in both Columbus and Canton, Ohio. The Columbus urban area has four separate networks – North, South, Vine, and West – supplied from three substations. Each network is supplied from 138 kV/13.8 kV Δ -Y network transformers. All four networks, about 30 MVA each, are served by six dedicated network feeders at 13.8 kV, with each group of six originating from a single substation. There is no overlap in these networks. This is a preferred design in that the network feeders are sourced at the same voltage, which minimizes the possibility of problems with network protectors pumping or cycling. AEP reports few problems with protectors pumping, cycling, or opening under light network loading.
Each Columbus network is built to N-2 reliability. In Columbus, the Vine network primarily serves spot networks in a high-rise area of downtown (Vine station), with some mini-grids at 480 V. The other three networks (North, South, and West) serve a mix of grid (216 V) and spot loads.
Canton has one network supplied at 23 kV.
The substations that supply Columbus are also designed to N-2, using at least three transformers, with one serving as a ready reserve hot spare. The stations that supply Canton are designed to N-1. The AEP Ohio stations use a ring bus design, with two circuits emanating from each bus section. Other substation bus configurations are used at other AEP operating companies.
AEP designs call for precast manholes and vaults, though the company will pour in place in certain situations. For example, in repairing a deteriorated manhole, personnel may pour the bottom and precast the middle and top section. New manholes and vaults are designed with two ground rods at opposite corners and a ground ring, typically 4/0 cu. AEP is not tying the grounding with the manhole or vault rebar.
AEP duct banks are open cut, concrete encased. Many existing ducts are fiber (Orangeburg pipe). The new construction standard utilizes 5 inch PVC conduits. Typical duct back arrangement is a 4/3 duct bank with primary feeders occupying the lower positions in the duct bank.
For network circuits, AEP uses 500 Cu Flat strap EPR cable with a thin jacket to fit in 3 or 3 1/2 inch duct (See Figure 1) ). AEP also uses 750 Cu or Al cable for station exits for network feeders. For secondary, AEP has standardized on 750 Cu EAM insulated cables as this is the largest size that can fit in the 3 1/2 inch duct. As the ducts are expensive, AEP’s philosophy is to maximize the use of the ducts. In its typical designs, AEP leaves ducts open for communications.

Figure 1:
AEP Ohio PVC duct lines encased in concrete
All new network service designs reference the AEP parent company Network Design Criteria guide, which outlines both Single Contingency (N-1) and Double Contingency (N-2) Operations. Using this Design Criteria, the Network Engineer responsible for designing new service performs circuit analysis using CYMCAP and CYME SNA to determine the design needs to meet expected service requirements. Line drawings of the circuits and feeders are then drawn in MicroStation and AutoCAD by two Technicians within the Network Engineering group.
The Network Engineer then specifies the space and duct requirements for the service (vault, duct lines needed, etc.) in AutoCAD drawings and turns the requirements over to a Civil Engineer contractor to prepare the civil designs.
AEP Ohio PVC duct lines encased in concrete
AEP’s network unit design calls for a wall-mounted solid dielectric vacuum switch that is separate from the transformer, a submersible network transformer that can accept ESNA style (elbows or T bodies) connections, and a transformer mounted network protector (see Figures 2 and 3). All new AEP Ohio designs utilize Eaton CM52 network protectors and fiber-optic connections from the protector to the Operations Center for control and monitoring (see Figures 4 and 5).

Figure 2:
Primary transformer connection – T bodies

Figure 3:
Primary transformer connection – T bodies

Figure 4:
Network transformer. Note that the transformer does not have a primary switch compartment

Figure 5:
Network protector mounted on network transformer
AEP Ohio uses cable limiters on all its 480 secondary networks, at both ends of the mains (see Figure 6). The company also uses limiters in 216 V networks on cables sizes 250 MCM and above (though faults at 216 V will self-clear). Cable limiter application approach is documented in the AEP Guide to the Installation of Cable Limiters on Network Secondary and Service Cables. AEP uses the “Bussman” type cable limiters.

Figure 6:
Cable limiter used by AEP Ohio
Once final electrical and civil designs are completed, the Network Engineer secures permits, writes work orders, and oversees the construction of the service site, including on-site inspections and final commissioning.
Technology
Network Engineers follow the printed and online Network Design Criteria published by the parent company. CYME SNA and CYMCAP are used for circuit and load calculations and network maps. Line drawings are developed in MicroStation and AutoCAD before turning them over to a Civil Engineer contractor.
Design specifications include the following information:
-
Civil construction specifications, including vault or substation dimensions
-
Full electrical components, and their specifications, including N-2 design criteria for transformers and feeders
-
Manhole and duct line specifications, including grounding
-
Network protectors and Operation Center communications
The STORMS system is a design system that is used to prepare work orders and estimate projects. It utilizes compatible units with predetermined materials, costs, and labor hours associated to each unit. The use of this system for network design is relatively new to AEP.
7.4.7.2 - Ameren Missouri
Design
Network Design
People
Design of the urban underground infrastructure supplying St. Louis, both network and non- network, is the responsibility of the engineering group within the Underground Division, organizationally part of Energy Delivery Distribution Services, reporting to a VP. The Underground Division, led by manager, consists of both engineering and construction resources responsible for the downtown infrastructure. The engineering group is led by supervising engineer, and is comprised of Engineers and Energy Services Consultants (commonly referred to as Estimators) who deal with planning, design, and service issues.
Engineers design the system, including network and non network vaults and manholes, size equipment, perform load flow analyses, and prepare line drawings that describe the designs. All of the engineering positions are four-year degreed positions. Some engineers within this group have their PE licenses, although this is not a job requirement. Engineers are not represented by a collective bargaining agreement.
The Energy Services Consultants (Estimators) take the designs developed by the engineers and complete the design package, including all the physical elements of the design. Estimators have a combination of years of experience and formal education, including two year and four year degrees, and are part of the union, IBEW.
Recently, Ameren Missouri has formed the “Underground Revitalization Department,” a team of engineers (all 4-yr degreed) focused on researching, evaluating, and developing plans for performing capital improvements to and revitalizing downtown St. Louis, including the network. Part of this group’s role includes addressing issues such as the development and update of planning criteria for the network, and the design of enhancements to the downtown area, such as developing potential designs to build a new substation to supply network load in St. Louis.
Ameren Missouri has a Standards Group that has developed construction standards and material specifications for designs and equipment used in the network underground. These standards and specifications are used by engineers and estimators in developing network designs. Standards are available in both online and printed book format.
Process
The design of the distribution network system serving St. Louis consists of four distinct secondary network grids each supplied by a separate substation.
Each of the four network substations supplies about 205 MVA of load. Three of the stations are sourced at 138 kV from overhead supplies, while one is served at 35 kV from an underground supply. Two of the substations are relatively new, and two are more than 50 years old. At the time of the practices immersion, Ameren Missouri, through its downtown revitalization project, was developing plans to eliminate the oldest substation and add a new switching station in a different location, as the oldest station is also out of phase with the other three.
The secondary network grids supplying downtown St. Louis are 120/240 V volt grids, each served from one of the four substations. Ameren Missouri does not utilize 277/480 V secondary grids. However, most spot network locations are 277/480 V secondary spots.
Two of the 120/208 V secondary network grids are supplied with eight feeders each at 13.8kV. One of the secondary network grids is supplied by seven feeders at 13.8 kV, and the remaining network is supplied by six feeders at 13.8kV.
Ameren Missouri uses dedicated network feeders; that is, they do not supply radial load from feeders that supply the secondary network grids. Their protection settings for network feeders are “one shot to lock out”.
While Ameren Missouri uses neutral grounding reactors to reduce the fault duty for ground faults for radial feeders, they do not use them for network feeders.
Ameren Missouri designs their system to N-1. That is, the system is designed to ride through the failure of any one component during a system peak with only minor overloads to transformers, primary feeders, and second mains. Note that in some cases, Ameren Missouri provides N -2 in that they plan their system to be able to withstand a bus outage. They utilize a ring bus design with bus sections serving two feeders. Consequently the loss of a bus section may result in the loss of two feeders. In these situations the system design really provides N-2.
Until recently, Ameren Missouri did not have a design criterion which limited the number of primary feeders in a duct line. However, as part of the downtown St. Louis revitalization effort, Ameren Missouri is working on planning criteria that will dictate how many circuits may reside in a given duct. They propose that no more than two network circuits originating from the same station may reside in any one duct.
Up until the late 1980s, PILC cables were standard Ameren Missouri. The current standard for primary cables is EPR insulated cables; however, much PILC remains installed.
While their current duct standard calls for PVC duct, Ameren Missouri has considerable clay tile and fiber duct installed. Because of the small size of these ducts Ameren Missouri participated in the development of and is using a thinner wall EPR insulated primary cable which enables them to take advantage of the existing smaller duct system. The thinner wall cable allows Ameren Missouri to install this cable in their smaller sized conduit system.
Technology
Ameren Missouri has a good set of maps depicting their network infrastructure. Maps include:
-
Operating Map (Also called Byers Map) – this map showing electrical conductivity is used for switching.
-
Plat Maps, a detailed map of the network area, showing all geographic facilities on a block by block basis. These maps are geographically correct and show duct bank cross-sections.
-
Cable Route Maps – these maps are basically feeder one lines, depicting the route of the feeder from the substation to termination. They also show all manhole locations. These maps contain more detail than the operating maps.
-
Switching Maps - These maps are similar to the cable route maps, but also show switching devices.
Network infrastructure is represented in a GIS – BYERS system.
Ameren Missouri is in the process of converting to a new mapping system, Gtech. At the time of the practices immersion, Ameren Missouri had not yet decided how the new mapping system would be used with network facilities.
Estimators use a system called the Distribution Operational Job Management (DOJM) to prepare job estimates. This system enables an estimator to build the job using compatible units that represent certain construction standards and are accompanied by estimates of labor hours to install and materials and their associated costs. The DOJM system is based off of a Severn Trent product.
7.4.7.3 - CEI - The Illuminating Company
Design
Network Design
People
The design of the network is performed by the CEI Underground / LCI group (Design Group), part of the CEI Regional Engineering group, located in NRHQ (Northern Region Headquarters).
The group is comprised of Engineers (5) and Design Technicians (3). The department currently includes two younger employees brought into the department in anticipation of retirements, so that departmental knowledge is preserved.
The majority of the design of both the network and non-network systems is done in house. Underground network / non- network design is seldom outsourced at CEI.
The group’s responsibilities include network system and non – network system designs and the development of standards for the ducted manhole system including vault and manhole design standards and customer design standards[1] . The group prepares construction drawings for the conduit system, vaults and manholes.
The group is responsible for preparing designs for serving and interfacing with larger C&I customers.
The group is also responsible for preparing civil designs.
Process
The network serving downtown Cleveland (the Network) is a small part of the overall ducted manhole underground system serving the Cleveland Area. The bulk of the underground system is served through radial designs.
The Network serves about 399 customers. It consists of one 120 / 208V network grid supplied by five 11kV feeders (PILC, EPR and XLP) fed out of the Hamilton substation, and two spot networks. The network is lightly loaded (about 30% loaded, or about 8-10 MVA of network load), and serves mainly smaller customers. The system is designed to N-1, meaning that service continuity can be maintained with the loss of any one device.
The Network is made up of approximately 57 vaults, and includes 61 network transformers (500, 750, and 1000 kVA transformers). Network protector sizes range from 1600 – 3000 A. The secondary is made up of 500 cu cables (XLP) with cable limiters.
Hamilton Sub supplies the Network as well as other downtown load. It is supplied by two 138 kV sources to four substation transformers with dual secondary windings, supplying 12 11kv bus sections. The network feeders and load are staggered among the bus sections / transformers to maintain N-1 reliability.
CEI’s network feeders utilize separate duct banks and different routes wherever practical in order to reduce the probability of a multiple contingency situation. However, they do have certain instances, where multiple feeders share the same routes.
CEI limits the number of feeders entering a transformer vault to the one serving the transformer by serving all transformer vaults from taps fed off of the main duct run.
CEI does not using fire proofing or arc proofing tape, even in facilities that contain multiple primary feeders, or both primaries and secondaries. If they are working in a hole with old asbestos tapes or other materials, they remove the asbestos from all facilities in the hole before commencing the work.
CEI’s goal is to not increase the loading on the network, as they are unsure of the condition of secondary cables and thus the current carrying capability of the secondary. CEI does not add large loads to the network – most large loads are served either by multiple feeders from the 11kV sub- transmission system (see Non-Network design - Process ), or by CEI’s 33kV subtransmission system. Small loads will be added to the network.
When CEI receives an application for a new service in an area served by the network, they may involve the Planning engineers to see if they can carry the load on the network from a particular transformer or mole. Typically a new load of less than 400kW will be connected to the network. Larger loads are normally served from either the 4kV or 11kV radial systems.
If the project involves just a tap, the design will be performed by the engineers within the Design Group who focus on serving customers (the LCI ).
If the project involves a cable line extension, both a cable engineer, and an LCI engineer are usually involved in the design. The cable engineer would design the conduit system up to the point of the customer interface, and the LCI engineer would develop the service interface, including the transformation and switchgear.
Technology
Engineers will prepare the required construction drawings that show the duct configurations, shows the manhole design, references standards pages, etc. Wherever possible, they will use the GIS system as a foundation for a drawing. They may show a portion of an existing vault drawing if the project involves a revision. In general, the prints they produce are very clear and well received by the Underground Group.
[1] FirstEnergy has a corporate Standards group, but system wide standards for ducted manhole and network systems are not fully developed, as FirstEnergy companies “grew up” with different standards / equipment / approaches. Consequently, the CEI Underground / LCI group develops and maintains standards for the ducted manhole system serving the Cleveland area (network and non-network). FirstEnergy has formed a system wide users group focused on addressing and standardizing network issues across their system.
7.4.7.4 - CenterPoint Energy
Design
Network Design
People
Network design at CenterPoint is performed by the Engineering Department contained within the Major Underground Group. The Engineering department is led by a Manager and is comprised of four main sub groups.
One sub group is a technical group that includes the engineers who design the protection schema and remote monitoring systems in the underground.
Another sub group deals with the design of three phase pad mounted transformer installations, including looped commercial developments. This group, the Padmounts group, is comprised of Engineers, Engineering Specialists, and is supplemented with contractor resources. This group is not typically involved in network design.
Another sub group focuses on vault designs, interfacing very closely with the Key Accounts Consultants (also part of Major Underground) who interface with large customers. This group, called the Vaults group, is comprised of Engineers, Engineering Specialists, and is supplemented with contractor resources. Note this group designs submersible network vaults as well as building vaults.
The final subgroup is one focused on distribution feeder design. This group, the Feeders group, focuses on both network and non network feeders. This group is comprised of Engineering Specialists, Engineering Technicians, and is supplemented with contractor resources.
Process
CenterPoint has five 120/208 V secondary networks served by from 6 – 10 primary feeders each. Three different substations supply the networks, with two substations supplying two different networks each, and the remaining sub supplying one network. These networks serve customers in both downtown Houston and in areas outside central Houston. CenterPoint does not have a 480V network street grid.
The 120/208V network secondary grids are fed by 12.47 kV primary feeders
- but the feeders are not exclusively dedicated to serving the network; they do supply some radial load.
The street grids are fed from both 208V subway vaults and from 208 “dry vaults” which are building vaults that supply both the local building and the street grid.

Figure 1:
Picture of feed from a customer network vault out to the street grid
CenterPoint also provides spot network service to customers at 12kV with a 120/208 V and 480V secondary.
Note that in their network unit design, CenterPoint has made the decision to physically separate the transformer primary disconnect (into the transformer) from the unit itself. Similarly, CenterPoint physically separates the network protectors from the transformers as well. The decision to separate the components of the network unit was made for safety, so that an explosion or fire in one component does not impact the other component. See Network Unit Design - Process for more information.
Technology
Engineers will prepare the required construction drawings that show the duct configurations, the manhole or vault design, references standards pages, etc. using MicroStation CAD software. The Major Underground group also uses LD Pro by Itron to identify and cost estimate the material requirements for the project. Engineers will supplement these estimates with anticipated labor costs and estimated civil construction costs. (Note that CenterPoint has developed assembly units for selected construction types that contain a resource and cost estimate to perform the work associated with that construction type. However, most of these assembly units have been developed for overhead construction standards. Consequently, underground design involves a fair bit of manual intervention to develop cost estimates.
Estimates developed using LD Pro feed into CenterPoint’s SAP system which is used to establish an order to capture all of the costs associated with the project, including the costs of preconstruction activities. This SAP order is created in the initial stages of a project.
7.4.7.5 - Con Edison - Consolidated Edison
Design
Network Design
People
Organization
Central Engineering - Responsibilities include Civil / Mechanical Engineering, Control Systems Engineering, Design Engineering, Electrical Engineering, Equipment and Field Engineering, and Environmental Engineering & Program Support.
Engineering and Planning - Responsibilities include Energy Services, Distribution Engineering, Operations Services, Marketing and Sales, Planning and Analysis, and D.C. Elimination.
Employee Development
Con Edison invests in developing its design employees through three distinct programs focused on employee development. One program is focused on the development of newer engineering employees, another at incumbent employees, and the third at bargaining unit employees who are entering the management ranks. The programs are described more fully on page 3-53 of this report. Note that these programs are not limited to design employees, but are available to all employees who qualify.
Process
Network Design Criteria
Con Edison’s design criteria calls for no more than two feeders in any one duct bank that services the same areas. Also, feeders supplying any one area are sourced from different minor bus sections at the station so that the loss of a minor bus section won’t jeopardize any one area. Con Edison’s design criteria calls for no more than two feeders in any one manhole.
In the network system design used in Manhattan, four feeders typically run down the avenues (the main north-south thoroughfares on Manhattan). Two feeders run down one side of the street, and two run down the other side.
7.4.7.6 - Duke Energy Florida
Design
Network Design
People
Network design is performed by the Distribution Design Engineering group for Duke Energy Florida, which works out of offices in both downtown St. Petersburg and downtown Clearwater. The groups are responsible for designing new and refurbished network designs, as well as underground radial and looped distribution designs. The Distribution Design Engineering groups in Clearwater and St. Petersburg are led by a Manager, Distribution Design Engineering, and are organizationally part of a Distribution Design Engineering Group responsible for Duke Energy Florida’s Coastal region, led by a Director.
The Design Engineering group is comprised of two sub-groups: an Engineering group, comprised of degreed engineers, and a Technologists group, comprised of non-four year degreed Network Technologists. Work within the Design Engineering group, both in Clearwater and St. Petersburg, is assigned geographically, such that a designer (either an Engineer or a Technologist) is responsible for both network and non-network designs within an assigned geographical area. Some designers focus on commercial customers, while others focus on residential customers. For example, the St. Petersburg design group has two engineers that focus on commercial designs – both engineers have four-year engineering degrees.
The criteria for choosing non-degreed Technologists may include years of experience, and for new job postings, at least a two-year degree in electrical technology. The existing group has individuals with varied experience, including distribution operations, control and transmission.
The Design group is experiencing a large turnover in its Engineering staff, as a number of employees with many years of experience are retiring. A challenge for the group as positions turnover will be acquiring new resources with design experience.
The design of the network is also based on input from the Network Planning group. Network Planning at Duke Energy Florida is organizationally part of the Power Quality, Reliability, and Integrity Group (PQR&I), which is led by a Director of PQR&I for Duke Energy Florida.
To perform planning work, the Network Planning group divides the Duke Energy Florida territory into four separate zones. The cities of Clearwater and St. Petersburg, part of the South Coastal Region, are included in one of the four zones. Every zone is assigned a Lead Planning Engineer and Senior Planning Engineer, who are responsible for all distribution planning activities within the zone. This work includes recommending enhancements to meet anticipated capacity requirements. All Planners have four-year degrees in Electrical Engineering, a requirement for the position.
The design of the network is also influenced by the Duke Energy Florida Standards group, which Group oversees all standards for distribution equipment and materials. One Engineer within the group oversees all network equipment standards for Duke Energy Florida. This engineer is an Electrical Engineer, a requirement for the engineer who specializes in Network Standards. The engineer also has a PE license, a requirement to obtain certain levels within the engineer family. The Standards engineer has developed a Distribution Engineering Manual section on Secondary Networks, which provides good background information on network component design considerations including cable limiter placement and coordination, protector operation, and manhole and vault considerations. See Attachment C .
Duke Energy has a Corporate Standards committee which focuses on developing common standards throughout the Duke Energy family of companies. Across the Duke Energy family of companies, there is a core Network Group of four or five members within the broader Standards groups that assist each other and collaborate on choosing all material and specification standards for the underground network throughout the company, including Florida. This core underground team draws on members from across the Duke Energy operating companies.
Duke Energy Florida has developed network design standards, which are contained in the “Duke Energy Florida Section 29; Networks, Vaults, and Transclosures.” (See Attachment D .)
The Design engineers are engaged in a Duke Energy corporate-wide process to consolidate design standards for network systems among the various Duke operating companies, due to be finalized in 2017. A challenge will be to integrate historic design differences into the new guidelines. For example, historic cable limiter application approaches have differed among Duke Energy operating companies. The new standards will need to reflect these differences and include appropriate going forward standards.
Process
In Clearwater, Duke Energy Florida has a true low voltage meshed secondary network. This network, a 125/216V grid, is supplied by three medium voltage (7200/12470V) wye-connected primary network feeders fed out of one substation. The three feeders are targeted to be dedicated network – they historically had supplied both network and non-network load, but Duke Energy is nearing completion of a project to remove all non- network load so that the three feeders supplying the network grid are true dedicated network feeders.
The substation that supplies the network feeders is a large four-transformer station that supplies non-network loading as well. While all three network feeders are fed out of the same substation, the feeders are supplied from separate bus sections at the sub (open bus ties to manage fault currents), sourced by separate transformers. Because the feeders are supplied by three sources and have different loads, and because the network is very lightly loaded, Duke Energy Florida has experienced issues with open and frequently operating network protectors on their Clearwater system. Duke Energy Florida expects this situation to improve as the remaining non-network load is removed from the feeders, and as planned new loading is added to the system.
Duke Energy Florida has designed its network feeders with primary sectionalizing switches. They have historically used three-way (feeder in, feeder out, and alternate feeder) oil switches that can be used to sectionalize, transfer loading from circuit to another, or tie feeders together. Devices can be opened, closed, or put in the ground position. The older devices, locally referred to as “RA” switches (Rocker Arm), are motor operated, and can be operated from outside of the vault or manhole using a tethered control, or from SCADA. Part of the normal process for troubleshooting a network feeder is to sectionalize and restore service to the non-affected part of the network feeder.
Duke Energy Florida is in the process of replacing the oil-filled sectionalizing devices used on the Clearwater network feeders with solid dielectric vacuum switches. The oil devices are near end of life, and it is becoming more difficult to obtain parts. In addition, the move away from an oil insulated device is part of an effort by the Duke Corporation to move away from oil or gas insulated switchgear. As Duke Energy Florida pursues a permanent replacement for the RA switch, they are seeking a device that provides a visible open.
The replacement solid dielectric vacuum devices, under design specification at the time of the practice immersion, are slightly larger than the oil-filled devices and will be placed in sidewalk vaults. These devices, which do not have fault interruption capability, will be equipped with remote reporting faulted circuit indicators (FCIs) that communicate via SCADA to the DCC. The devices will provide a visible open through an interlinked system where the vacuum bottle must be open before you can open the visible break. The new devices will be placed on an angled stand so that the switch faces the vault exit and can be easily operated with a hot stick from outside the hole. The switches will also have the ability to be operated from above ground using a hand held pendant control that is hardwired to the switch. The decision to proactively replace the older oil gear with the new solid dielectric switches was collaborative involving the component engineer within the PQR&I group, the Standards engineer and the Network Group.
In St. Petersburg, the company moved away from a network grid system years ago, with eight spot network locations remaining in the system. Duke Energy Florida is not planning on reintroducing a network infrastructure in downtown St. Petersburg. Most of the infrastructure in St. Petersburg is supplied by a primary and reserve feeder loop scheme, with automated transfer switches (ATS). Outside the network, the primary and reserve looped feeder scheme is used in Clearwater as well. The ATSs are motor operated and most are tied in with SCADA and can be monitored and controlled from the DCC via a 900 MHz radio communications system. When ordered, the dispatcher can remotely open a feeder switch if it is equipped with communications. For those switches that have yet to be upgraded with SCADA, Network Specialists must manually operate them. Note that at the time of the practices immersion, Duke Energy Florida is in the process of upgrading switchgear communications infrastructure from 900 MHz radio to secure cellular.
St. Petersburg underground infrastructure is fed by 12 different feeders supplied from three different substations. Many of the in-service ATSs are oil-filled devices, with two oil-filled tanks with a bus tie between them. Duke Energy has prioritized ATSs with two oil-filled tanks located in building vaults for replacement. The replacement design utilizes two three phase solid dielectric vacuum switchers (MVS) looped together (jumpered from one to the other), with the transformers supplied radially off of the T bodies using load reducing 200 amp taps (see Figure 1).

Figure 1:
Solid dielectric design for a three-way 3Φ switch utilizing Elastimold MVS switches. This switch can be used as the high side disconnect for a network transformer, with the 200 A interface on the back of the 600 A T bodies (left side) used to supply the transformer
Duke Energy Florida does use cable limiters in its network design. Cable limiters are installed at each secondary junction on the secondary mains on the outgoing secondary cable. In addition, cable limiters are installed at all service connections. Duke Energy Florida uses full section limiters on the street main secondary grid. Half section limiters are used on service connection junction points and are sized to match the conductor size. This is to ensure a service conductor fault will be isolated before damaging the secondary main and associated limiters. Limiters are sized such that when a primary fault occurs, the primary protection should clear before any limiters blow. For a secondary fault, the limiters should clear the fault before the network protector fuse opens. Based on past experience, the limiters behave as anticipated.
Duke Energy Florida uses T-body joints for connecting cable sections, and elbow joint connections to the transformer.
The network unit supplying the network grid consists of a separate wall mounted primary switch, a network transformer, and transformer secondary mounted network protector (see Figures 2 and 3)

Figure 2:
Wall mounted primary switch supplying network transformer

Figure 3:
Transformer secondary mounted network protector
Technology
At 125/216V, Duke Energy Florida has standardized on the CM22 with internal NP fuses. At 277/480V, they have standardized on the CM52, a fully submersible protector with a dead front design. Duke Energy Florida’s network protector specification also calls for features such as:
External disconnects, which are used to separate the protector from the secondary collector bus. These disconnects are a safety feature used in a 480V design to mitigate arc flash risks. On this network protector, the NP fuses are internal and link style, as Duke Energy Florida is able to create the visible break between the NP and the secondary bus using the disconnects. Note that the disconnects can only be opened with keys which can only be accessed when the NP handle is in the open position because of an interlock system.
Wall-mounted ARMS (Arc Flash Reduction Maintenance System) modules, which enable a worker entering the vault to change the protection settings in the protector to reduce the fault clearing time and thus the arc energy in the event of a fault.
A submersible Stacklight, which is an annunciator system that indicates network protector status through a series of different colored lights.
Duke Energy Florida also uses a remote monitoring system. The company uses the Eaton VaultGard communication platform for recording and aggregating data from the network protector and vault. This information is communicated through a Sensus cellular monitoring system to a central server every half hour. Within the Network Group, information from Sensus, such as secondary loading, is monitored daily. Note that the Sensus system is read only, with the functionality to remotely control equipment being disabled for security purposes.
Duke Energy Florida is in the process of replacing the oil filled sectionalizing devices (RA switches) used on the Clearwater network feeders with a new solid dielectric vacuum switch design. Drivers for this replacement effort include the fact that the in service devices are a 1980s vintage device and are near their end of life, and it is becoming more difficult to obtain parts. In addition, the replacement is part of an effort by the Duke Corporation to move away from oil or gas insulated switchgear. As Duke Energy Florida pursues a permanent replacement for the RA switch, they are seeking a device that provides a visible open (see Figures 4 through 7).

Figure 4:
Network Feeder primary sectionalizing switch (RA) switch

Figure 5:
Network Feeder primary sectionalizing switch (RA) switch

Figure 6:
Control Box for network feeder primary sectionalizing switch

Figure 7:
Example of an RA switch replacement considered by Duke Energy Florida. The switch depicted is a vacuum switch with the breaker under oil. Duke Energy Florida is planning to move to a solid dielectric vacuum switch
7.4.7.7 - Duke Energy Ohio
Design
Network Design
People
Network design is performed by a Network Project Engineer and two Designers who are part of the Distribution Design organization. This organization is focused on all distribution design work for Duke’s Ohio and Kentucky utilities, including network design.
Theses resources work closely with one another and with the Planning Engineer focused on the network to design modifications to the network.
Process
The design of the distribution network system serving Cincinnati consists of two network substations supplying four distinct secondary networks (two networks supplied by each substation). Three of the four networks in downtown Cincinnati are supplied by eight feeders, each, and the fourth network, by four feeders. The primary voltage of network feeders is 13.2kV.
Duke Energy Ohio’s cable standard for the network primary is a 750 cu EPR flat strapped neutral cable or a 4/0 cu EPR cable (without flap strapped neutral). They chose the EPR cable with flat strapped neutral design because much of their old duct system consists of 3 1/2 inch square duct. Note that Duke Energy Ohio will pull three conductors bundled together through a single duct.
Duke Energy Ohio narrows their network to a specific geographic area. If there is new load being added to this geographic area, Duke will consider in adding the load to the secondary network. They have no plans to actively de-load the network. In some cases, Duke Energy Ohio has elected not to add new load to the network based on project specific factors.
New vaults that are designed to serve new load are designed above ground. Customers must provide all equipment and access points within their building. The City of Cincinnati does not provide a right of way space for underground vaults. Note that Duke Energy Ohio does have a significant number of submersible faults already built.
7.4.7.8 - Energex
Design
Network Design
Note: Energex does not utilize a low voltage meshed secondary “network” in its CBD. This section discusses their design approach in serving the Brisbane Central Business District.
People
Energex has a Systems Engineering group, led by a group manager, and part of the Asset Management organization. This group is responsible for establishing the design standards for the distribution network. Energex also has a Design organization within its Service Delivery organization, also led by a group manager, and responsible for performing designs of specific projects, including new construction and system reinforcement projects. The Design group is comprised of four-year degree qualified engineers and engineering associates.
Process
To serve the downtown Brisbane central business district (or CBD), Energex is using an 11kV primary system, and supplies loads using single feeder supplies, or - in the Central Business District - using two and three feeder meshed 11kV systems.
There are four major substations that supply the load in downtown Brisbane. These substations are sourced at 110 kV by a combination of overhead and UG feeders. Within the stations are multiple 110 kV: 11kV dual winding transformers supplying the 11kV bus that sources the 11kV distribution system.
Energex runs multiple primary feeders at 11 kV out of these stations as part of a meshed system. Most of the feeders supplying the CBD are part of a three feeder mesh, where each of the feeders is fed out of the same substation, and are normally tied together at a “mesh point” located at a medium-voltage substation location. The feeders supply medium-voltage substations containing transformers (typically, either 1000 or 1500 KVA units), that supply the low-voltage system that supplies the down town load. Energex designs the mesh with sectionalizing points (circuit breakers or CBs), normally SF6 or oil (older design) switches located at various points along the feeder, protected with bus differential relaying, and a pilot wire scheme, so that devices operate simultaneously. These sectionalizing points may be designed on either side of a medium-voltage station, or separating multiple units within a medium-voltage substation, such that even with the loss of any one feeder section, customers can be supplied from the remaining mesh after performing some switching. Note that Energex does not use any automatic switching schemes, or remote control of these switches. Energex does install basic alarming in their medium-voltage stations, such as alarms for an open breaker, and general alarms (battery charge, sump pump). Alarms communicate by wire to an RTU at the substation supplying the primary feeder, and then through a WAN back to their SCADA.
For example, some high rise facilities may be supplied by Energex via multiple transformers separated by a switch on the primary. In the case of a fault on one feeder section, the bus differential relays isolate the section, resulting in a loss of supply to one of the transformers supplying the customer, and thus a partial loss of service to the customer. However, the customer may have the ability to perform switching on his side to energize the de-energized secondary bus by closing a secondary bus tie, after decoupling the secondary bus from the Energex transformer (using an interlock system that would prevent him from closing the bus tie until after it has separated itself from the Energex transformer). In this scenario, the customer load is restored, being supplied by the remaining in-service transformer.
The primary feeders also have bus over current protection at the source and at the mesh point. As UG feeders supplying the CBD, the primary feeders do not employ automatic reclosing and, upon sensing a fault, trip and lock out immediately. At the supply substation (110 kV: 11 kV), Energex has automatic changeover of the buses, so that the bus remains energized even with the loss of any one substation transformer. CBD has transformers operating in parallel so there is no auto changeover required on CBD substation busses.
Characteristics of a Three-Feeder Mesh Network
(from the Energex Standard Network Building Blocks document, Feeders BMS 03929, Updated: 13/12/2012, see Figure 1).
The layout of a developed three-feeder mesh network is shown in Figure
- The network has the following characteristics:
Any two of the three feeders of the mesh ideally must be capable of supplying the total load of the mesh.
Distribution substations are installed generally in each major building.
Local low-voltage (LV) supply may be run onto the street from a distribution substation in a building in order to supply other customers on the street.
A fault in any of the 11 kV cables within the mesh results in the faulted cable being isolated by the circuit breakers (CB) at each end of it. Supply is maintained to the majority of the load supplied by the mesh.
Where the 11 kV bus in a distribution substation has a single CB for two transformers (e.g., Distribution Substation ‘A’), a fault in either 11 kV cable connected to the substation results in loss of supply to one transformer and partial loss of supply to the building. The building generally would have a transfer scheme on the LV side, a standby generator, or both.
If an 11 kV cable that has a teed connection to a load fails, the teed load loses 11 kV supply until the cable is repaired. Teed connections should not be installed in three-feeder mesh systems.
Individual distribution transformers are protected generally by fused units, sometimes by CBs.
A large CBD area may have many three-feeder mesh networks supplying it.
A three-feeder mesh may have a further backup connection to another three-feeder mesh, and other variations depending on the situation.
A CB may feed more than one mesh as shown, and protection must be arranged to suit (see Figure 1).

Figure 1:
Energex 11 kV CBD Feeder Diagram
Technology
Medium-voltage substations in the CBD are usually located within building vaults. The medium-voltage stations consist of primary (11 kV) switches protected by bus differential relaying, transformers, and secondary switchgear that supplies both the building load (see Figure 7) and feeds into the low-voltage network serving the CBD (see Figures 2 to 6 and Figure 8).

Figure 2:
Energex employee giving safety briefing before entering a C/I substation, locating in a building vault

Figure 3:
Dry type transformer supplied by the three feeder mesh

Figure 4:
Primary terminations (PILC) on dry type transformer

Figure 5:
Multiple dry type transformers

Figure 6:
Circuit breakers with bus differential relaying

Figure 7:
Low-voltage switchboard, with feeds to the customer
At some locations, Energex may “Tee” off the primary feeder with a substation consisting of an SF6 gas insulated ring main unit (the primary switch gear current design) with an “in” switch, an “out” switch, and a fused, switched tap leading to the transformer. The use of a packaged substation with a ring main unit is a common design outside of the CBD.

Figure 8:
Typical building vault substation with ring main unit (foreground) and transformer (background)
In URD applications, Energex uses a similarly designed “packaged” substation, a pad-mounted unit consisting of the ring main unit ( “in” switch, an “out” switch, and a fused, switched tap leading to the transformer), the transformer, and the low-voltage switchboard supplying the low-voltage network feeding the development (see Figures 8, 9 and 11). Note that URD developments are fed by an extensive low-voltage network feeding through mini pillars (see Figure 10). Services are tapped from these mini-pillars to serve customers (see Figure 12).

Figure 9:
Typical pad-mounted 'packaged' substation supplying UG development. High-voltage switches (ring main unit) in the front, transformer in the middle, and low-voltage switchboard in the back

Figure 10:
Typical pad-mounted 'packaged' substation supplying UG development (another view). Note mini pillar to the right of the substation

Figure 11:
Low-voltage switchboard supplying the LV network feeding the development

Figure 12:
Typical home, note mini-pillar in the foreground supplying the customer
Energex has SCADA at the substation, and some remotely monitored and controlled normally open tie points between 11kV feeders out on the system, but in general, they have little SCADA beyond the substation.
Energex is currently installing a PQ meter on the low-voltage side of all distribution transformers greater than or equal to 200 kVA, three phase.
At the time of the immersion, Energex was in the process of implementing the Power On DMS product, which provides electronic displays of the distribution networks, both medium voltage and low voltage.
7.4.7.9 - ESB Networks
Design
Network Design
Note: ESB Networks does not utilize a low voltage meshed secondary “network” system. This section discusses their design approach in serving Dublin. See Non-Network Design for more information.
People
Network design at ESB Networks is performed by engineers within the Network Investment groups – two groups responsible for planning network investments in the North and South. Organizationally, the Network Investment groups, both north and south, are part of the Asset Investment organization. In addition to the Network Investment groups, the Asset Investment organization is also comprised of a Generation Investment group and a Specifications group, each led by a manager. The Asset Investment group is part of Asset Management.
Network designs and design specifications are developed by engineers and by “Technologists,” who have developed their expertise through field experience.
ESB Networks may receive engineering consulting support from ESB Networks International (ESB NetworksI) for larger designs.
Network design standards and criteria are developed jointly between the Asset Investment group and the Strategy Manager, which is part of the Finance and Regulation group within Asset Management.
Technology
In central Dublin, the network operates at 10 kV, all of which is underground. Within Dublin there are 38 HV stations. Thirty-one are 38 kV:10 kV and seven are 110 kV: 10 kV. There are 2040 MV substations that consist of switchgear as part of the ring main unit, a transformer, and a secondary, all in one package. This provides 200, 400 and 630 kV in one packaged substation. The Dublin system is an N-1 design with forward feed and standby feed capacity. Dublin has 170 customers that take voltage at 10 kV; these customers are primary metered customers.
7.4.7.10 - Georgia Power
Design
Network Design
People
Design of the urban underground infrastructures supplying metropolitan areas in Georgia is the responsibility of the engineering group within the Network Underground group. The Network Underground group, led by the Network Underground Manager, consists of engineering, construction, maintenance and operations resources responsible for the network underground infrastructure at Georgia Power. It is a centralized organization, responsible for all Georgia Power network infrastructures.
The Network Engineering group, led by the Network Underground Engineering Manager, is comprised of Engineers (Electrical and Civil) and Engineering Representatives concerned with the planning, design, and any service issues associated with the network. The Engineers are four-year degreed positions, while Engineering Reps have a combination of years of experience and formal education, including two-year and four-year degrees. Engineers are not represented by a collective bargaining agreement.
In addition to the engineers with in the Network Underground Engineering group, the Network Underground group has two Principal Engineers who report to the Network UG Manager. These Principal Engineers also deal with issues of network design.
Engineers design the system, including vault designs, network unit designs, equipment sizing, perform load flow analyses, and prepare one-line drawings that describe the designs. The design is then turned over to draftsmen who do final CAD drawings that detail all the specifications, both civil construction and electrical component, and input them into the GIS system. There are 12 design engineers and 5 draftsmen (called “GIS Technicians).
Georgia Power has a Standards Group that has developed construction standards and material specifications for designs and equipment used in the network underground. Standards are available in both an online and printed book format. Standards were first documented and codified in the 1970s, and they include what was already documented on the network from the 1940s and any new standards developed since then. It is a living document, and the responsibility of the Standards Group comprised of the Principal Engineers in the Network Underground group. The standards are divided into two main sections: civil construction and network specifications and design.
Process
Georgia Power, as of the time of this immersion study, has 35 networks in the metro Atlanta area. The company tries to limit network sizes to 40 MVA but has a few 50 MVA networks in place there. Each network group is typically fed by 5 network feeders, though they do have some six feeder networks. The system is designed to n-1.
Network feeders are supplied from a network bus at the substation supplied by a substation transformer that feeds only network load. No non – network feeders will be fed off of the network bus. Feeders supplying any one network are sourced from the same substation. Georgia Power uses bus voltage regulation at the station.
Network feeders are dedicated, with no sectionalizing devices or tie points, though at the time of the immersion, Georgia Power was investigation the use of tie points for network feeders. (Note, Georgia power does have primary sectionalizing on network feeders supplying the airport for added reliability).
Typical duct bank configurations are two-wide by six high. Vaults/manholes have bay forms built into the corners to take the bend out of the cable in the manhole. Therefore, the cables can maintain the appropriate bending radius and still be near the wall in the corners. Single driven ground rods are used in the manholes.

Figure 1:
View of manhole corner (bay forms used to create corner)
Another notable aspect of Georgia Power’s network design is the use of what they call “Peachtree racking.” This standard calls for consistent racking approach that consists of primary cables racked on the bottom, with secondary cable pairs racked above (See Figure 2.). The racking system is clearly marked, and facilitates future expansion out of the manhole. Georgia Power has found this is a tremendous benefit in standardizing design, streamlining maintenance, and providing greater worker safety (See Figure 3.).

Figure 2:
GA Power employee explaining benefits of Peachtree racking within a training manhole

Figure 3:
Desktop training aid showing Peachtree racking approach
Georgia Power uses both Eaton and Richards dual-voltage network protectors. There are current-limiting fuses external to each protector (Figure 4), and newer protectors have external fuse boxes. This is to provide better arc flash protection by only uncovering one fuse at a time. They are in the process of converting older units that utilize electromechanical relays to units that use solid state relays. At the time of the immersion, they were evaluating new protector designs. Georgia Power’s current standard calls for network protectors to be fully submersible, and mounted on the network transformer.

Figure 4:
Current limiting fuses (covered with fire proof tape) positioned between collector bus and protector
Georgia Power has remote monitoring and control of all network protectors. They are tied to the Network Operations center either through radio, or through a fiber system that aggregates information from multiple vaults. Georgia Power has used SCADA for protectors for approximately 15 years.
Georgia Power’s standard for network transformers conforms to IEEE C57.12.40 ( IEEE Standard for Network, Three-Phase Transformers, 2500kVA and Smaller). GA Power also specifies units with the following minor modifications: 1) transformers are welded onto metal rails to keep them off the vault floors and make them easier to pick up with a fork lift (See Figure 5); and 2) every transformer has phasing tubes on top to identify phasing in the transformer (See Figure 6.). The phasing tubes provide a simple and foolproof way for tracing voltage. On the transformer end, field personnel can insert a probe into the phasing tube on a de-energized unit, and put a signal on the cable. On the joint end, crews can trace the connection to phase from this signal. They can then repeat the procedure for the remaining phases.

Figure 5:
New transformer – note rails welded to transformer bottom

Figure 6:
Transformer – phasing tubes
Georgia Power rarely uses cable limiters on its secondary network grid system in Atlanta.
Georgia Power will use sand type current limiting fuses between the secondary collector bus and the customer service, mainly to protect its network bus from customer faults. Georgia Power does not openly advertise the use of these limiters, and it expects the service itself to be fused on the customer end.
There are many secondary spot networks in the Georgia Power system, mainly 480 V, particularly in Atlanta. Georgia Power refers to a true spot network supplied by network feeders as a network vault service. Common network transformer sizes for spot networks are 1000 kVA and 2000 kVA. Note that GA Power may also use the term “overhead spot network” to describe some locations where they have a network supplied by two overhead systems. This is an exception rather than a rule.
Another notable feature in the Georgia Power network is the use of full rubber insulation on its bus conductor (See Figure 7 and Figure 8). This may be more costly than designs seen in other networks, but Georgia Power is satisfied that it adds another layer of protection and reliability to the system and to its customers, while enhancing employee safety by reducing exposure to shock and flash.

Figure 7:
Secondary collector bus with EPR insulation

Figure 8:
Secondary collector bus with 600 volt EPR insulation, cross section
Technology
Georgia Power uses its GIS system (ESRI) to keep extensive and detailed maps of all underground networks. Network maps are now drawn up in a CAD system by design engineers and draftsmen, which augment original maps that have been imported from the past and converted to raster drawings. CAD maps are fed into GIS. Network maps include the following information:
-
Civil construction specifications, including vault or substation dimensions
-
Full electrical components, and their specifications and placement
-
Manhole and duct line specifications
In addition, design engineers refer to the Standards Group online or hard copy book for standard designs and acceptable variations.
7.4.7.11 - HECO - The Hawaiian Electric Company
Design
Network Design
People
Underground network design is performed by the HECO T&D Division. This group is part of the Engineering Department. The group works closely with the Planning Division in network designs.
The group is comprised of 2 lead engineers, 13 design engineers and a supervisor. All are four year degreed engineers with about half the group having their PE license.
Process
The network serving Honolulu is a relatively small part of the overall ducted manhole underground system. The bulk of the underground system is served through radial designs.
The Network serves about 1600 customers. It consists of seven 120 / 208V network grid supplied by 8 11.5kV feeders (PILC, EPR and XLP), and 27 spot networks with 480y/277 V secondaries.
The Network is made up of approximately 140 network distribution transformers. The network system consists of about 181000 feet of primary and 44000 feet of secondary cable.
The system is designed to N-1, meaning that service continuity can be maintained with the loss of any one device.
An area substation supplies the Network as well as other downtown load. It is supplied by two 138 kV sources to three 50 MVA (138kV / 11.5kV) delta zig-zag substation transformers connected in a breaker and a half scheme on the 138 kV side, and a ring bus on the 11.5kV side.
HECO has no plans to increase the size or capacity of its secondary network systems.
Technology
HECO is using Siemens PTI PSSE, version 29.5 to perform load flow analysis in the network.
7.4.7.12 - National Grid
Design
Network Design
People
There are two designers who perform network designs for the National Grid Albany network.
One designer (a Design Investigator) focuses on designing smaller new services connections to the network, 800 amps and below. This individual has a two year degree, though the degree is not mandatory for the position. This designer has field experience as both a cable splicer and maintenance mechanic. This designer also performs some non- network UG and overhead service designs.
The other designer (a Designer C) performs all larger and more complicated network designs, including network reinforcements, large new services projects greater than 800 A, and vault designs. This individual has a two-year degree, a requirement for the position. This designer also performs non – network UG designs.
Organizationally, both designers are part of the Distribution Design organization, led by a manager, and part of the Engineering organization at National Grid. This organization is structured centrally, with resources assigned to and in some cases physically located at the regional locations. The designers who support the Albany network are both physically located at the NYE building in Albany.
Both designers are represented by a collective bargaining agreement. The Design Investigator and Designer classifications are two different classifications with different progressions.
Both designers work very closely with the field engineer, part of Distribution Planning, assigned to the underground department to support the Albany network.
National Grid will determine the appropriate service type for a customer based on their load, criticality and location. There have been times where they have asked a customer to accept network service (a sports arena, for example). National Grid Albany does not use a separate rate for network customers.
Process
The design of the distribution network system serving Albany consists of two network substations supplying one distinct 208Y/120 V secondary network system. The secondary network grid is supplied by ten dedicated network feeders – three from one substation and seven from the other substation.
National Grid’s Albany network system is designed to n-2. That is, the system is designed to ride through the failure of any two components (primary and secondary cables, transformers, network protectors, and ancillary equipment) during a system peak, with only minor overloads to transformers, primary feeders and secondary mains. For example, for a network with four primary cables, the design shall be such that the network system can withstand the failure of a primary cable with one cable out of service for other reasons.
Transformers are sized such that under single contingency conditions (n-1), loads on any transformer shall not exceed 120% of nameplate rating. Under double contingency conditions (n-2), loads shall not exceed 140% of nameplate rating. Under all conditions, loads shall not blow protector fuses.
National Grid also has a separate 277/480 V spot network system supplied by five 34.5KV feeders and serving fourteen spot network locations. Two additional large customers are dual fed primary voltage customers off of these 34.5kV feeders. There are also ten customers fed from 11 spot networks off of the 13.2kV general network feeders. Three of these are 125/216v, the rest 277/480v. Additionally, there is one customer fed off of two of these 13.2kV feeders through a padmount (PMH-9) switchgear. These spot network locations are designed to n-1.
Network substations are designed with a minimum of two high voltage supply circuits and two power transformers so that the failure of any transformer or supply circuit will not affect the network supply.
National Grid’s design calls diversified duct line routes for primary feeders to minimize the number of feeders in a given duct line. National Grid uses arc proof taping of cables. All duct lines are concrete encased, including primary cable ducts, and secondary cable duct. .
Much of the existing primary and secondary system is built with PILC cables. National Grid’s current standard calls for EPR insulated primary cables. The secondary cable standard calls for EPR insulated cables with a Hypalon (low smoke) jacket. National Grid does use cable limiters.
National Grid uses submersible transformers with throat mounted submersible type network protectors. Transformers are equipped with a primary disconnect and grounding switch.
Technology
National Grid has several maps depicting their network infrastructure. Maps include:
-
Index Operating Map, an 11x17 map showing a single line of network feeders.
-
UG Conduit Drawings, showing duct bank configuration and circuit routing.
-
Secondary prints, showing locations, type and size of secondary cable system components.
7.4.7.13 - PG&E
Design
Network Design
People
Network design at PG&E is performed by the planning engineers within the Planning and Reliability Department. This department is led by a Principal Engineer, who is also the department supervisor. This group does distribution planning for both the network and non-network systems, and is also responsible for network design. Eight engineers comprise this department. Six focus on the radial system, and two focus on the network system.
For network systems, the two planning engineers are responsible for distribution design.
Both network planning engineers are four year degreed engineers. The planning engineers are represented by a collective bargaining agreement (Engineers and Scientists of California).
The planning engineers work closely with project estimators (Estimators or Senior Estimators) who develop cost estimates and perform field checks to see if the design laid out by the planning engineer is workable in the field. The estimators also prepare the job packet for construction. PG&E has project estimators located in local offices to work with smaller projects, and estimators located in their Resource Management Centers, who work with larger projects. The estimators that work on network design projects are located in the San Francisco division.
Planning engineers and Estimators are represented by collective bargaining, Engineers and Scientists of California (ESC).
Process
The design of the distribution network system serving San Francisco consists of three network substations supplying 10 distinct secondary networks. The Oakland network is fed by one station supplying two network groups. Of the 12 total network groups, 10 are supplied by 12 kV feeders. At 12kV, the individual network groups are each supplied by six dedicated network feeders. Two network groups are supplied at 34.5 kV. One of these network groups is supplied by four feeders, and the other five.
PG&E’s design calls for no more than two feeders from the same network group in a given duct line. All duct lines are concrete encased, including primary cable ducts, secondary cable ducts and fiber ducts [1] .
The 12kV system is designed with PILC cables. 750 cu EPR with a flat strapped neutral is sometimes used as replacement for PILC cable where duct size is limited.
Each network is served by feeders supplied from a single substation. However, some feeders supplying a given network are fed from separate transformers at the station. In some cases, PG&E has experienced some challenges with circulating currents, such as unintended network protector operations. At the time of the immersion, PG&E was implementing changes to resolve this issue, such as redesigning the substation configuration to supply all feeders to a particular network from the same substation transformer bus section.
PG&E supplies 120/208V secondary network grids, and both 120/208V and 277/480V spot networks.
PG&E’s network system is designed to n-1. That is, the system is designed to ride through the failure of any one component during a system peak, with only minor overloads to transformers, primary feeders and secondary mains during peak periods.
PG&E is not planning to build any new networks, but they will add loads to the existing networks, particularly in San Francisco. In Oakland, PG&E tends to serve new loads from the radial system. Non-network customers are served from the radial system. If customers want a second supply for backup, they must pay for the costs of installation, ownership and reserved capacity per the applicable PG&E tariffs.
Within San Francisco, PG&E uses primary sectionalizing devices on network feeders (historically, the G&W T Ram). San Francisco’s experience is that when they open a network feeder, they often have network protectors that “hang up”; that is, do not open properly. Their primary feeder design with switches gives them the ability to isolate the section of the feeder where the bad protector is located, enabling them to complete their work on the fully de-energized section. This design also facilitates obtaining clearances and troubleshooting.
PG&E has been moving from using oil switches as network feeder sectionalizing switches to a solid dielectric switch. One driver for this change is a concern over the failure of the switch and the environmental and other hazards associated with oilfield gear. One challenge faced by PGE in the network application is that the fault duty in the network may exceed the rating of the dielectric switch. PG&E is currently working on ways to reduce the fault duty of their networks to be able to apply these devices.
When a new customer, such as a high-rise building, desires to connect to the PG&E network system, they will put in an application for service to the Service Planning department. The Service Planning department is responsible for gathering loading information. They are also familiar with the electrical system, and can determine whether or not the new customer can be served by the network or by the radial system. In ascertaining the customers expected load, PG&E will look at similar buildings to understand demand patterns. Planning engineers will also perform a low flow analysis to understand the impact on the system, running both the normal case and the n -1 case.
Typically, small to medium loads 500kVA and less requiring 120/208V service will be connected to the network grid. Loads from 500kVA to 1MW will get a 120/208Vspot. Loads greater than 1 MW will typically receive a 277/480 V spot network service.
The PG&E network grid load is growing slightly. Presently, PG&E has many high rises in their network that were formerly commercial locations that now serve residential customers. This has resulted in a changing load factor.
PG&E services spot networks using UG vault type transformers. Most times, the buildings will put their spot network vault underground, accessible from both the building and the sidewalk. Customers provide the space, lighting and ventilation.
PG&E’s design calls for no more than two transformers in a vault without some sort of fire isolation.
Technology
PG&E has a good set of maps depicting their network infrastructure. Maps include:
-
Circuit Maps, a semi- schematic map showing the circuits and sectionalizing points,
-
Distribution Maps (Block maps) showing all facilities in a certain geographic area
-
Duct Maps, showing duct positions in the network vaults and manholes. (Duct side drawing may be part of the distribution maps).
[1] PG&E will allow third party fiber in their ducts. For example, San Francisco 911.
7.4.7.14 - Portland General Electric
Design
Network Design
People
PGE has several different groups who share responsibility for network design.
Distribution/Network Engineers: Three Distribution Engineers cover and design the underground network, as well as work with customers to design customer-owned facilities, such as vaults, which may house network equipment. The Distribution Engineers are not based in the Portland Service Center (PSC) or CORE group but have direct responsibility for the network and work closely with the CORE. The Eastern District Central Supervisor, who reports to the Manager of Distribution and T&D Standards, oversees them. The underground Distribution Engineers are qualified electrical engineers. When needed, PGE hires civil engineers to support them with civil designs.
The Distribution Engineers develop the network and maintain its standards, which are forwarded to the Standards Department for inclusion in company standards documents. Distribution Engineers assume responsibility for network standards as they have the expertise specific to network equipment.
Distribution Engineers also provide the loading information that the Planning Department uses to create CYME and PSSE models.
Standards Department: The Manager of Distribution Engineering and T&D Standards oversees the Standards Department. This group consists of four standards engineers and one technical writer. This group is responsible for company standards, and works closely with the Distribution Engineers responsible for the network to assure that network standards are up to date.
Service & Design at PSC: Service & Design’s role is to work with customer projects, making it responsible for customer requests for new connections, and customer-generated system upgrades, such as a building remodeling. The supervisor for Service & Design’s wider responsibility includes the downtown network. The supervisor reports to the Service & Design Manager, who is a peer of the Distribution Engineering and T&D Standards manager. Both of these positions report to the General Manager of Engineering & Design and directly to the vice president.
The Supervisor of Service & Design at PSC and its group undertakes capital work if it is initiated by the customer. The “Mapper/Designer” reports to the Supervisor of Service & Design at PSC and provides the computer-aided design (CAD), geographic information system (GIS), and design service. A Field Inspector meets with customers/customer contractors. Two inspectors work for the Service & Design organization, with one specializing in the network.
Service & Design Project Managers (SDPM): Network planning associated with customer-driven projects requires regular coordination with the customer throughout the project life. PGE has a position called a Service & Design Project Manager (SDPM), who works almost exclusively with externally-driven projects, such as customer service requests. At present, two Service & Design Project Managers cover the network and oversee customer-related projects from the first contact with the customer to the completion of the project. They coordinate with customers to assure that customer-designed facilities comply with PGE specifications.
The SDPMs can be degreed engineers, electricians, service coordinators, and/or designers. Ideally, a SDPM has an associate degree or a combination of electrical engineering experience and appropriate education. In addition, SDPMs should have proven project management skills and understand PGE and industry standards and practices. They should also have knowledge of the National Electrical Safety Code (NESC) and National Electrical Code (NEC) as well as the ability to use or learn the relevant information technology (IT) systems. PGE prefers a selection of SDPMs with a diverse range of experience and backgrounds.
SDPMs work on both CORE and non-CORE projects. This ensures that expertise is distributed and maintained across departmental and regional boundaries.
Key Customer Manager (KCM): PGE has nine KCMs reporting to Manager of the Business Group. Generally, they are geographically distributed, with three on the west side, one downtown, one in Salem, three on the east side, and one acting as a rover. KCMs liaise with large customers and communicate their needs.
Process
Design Process
When a new building is constructed and ready to connect to the network, PGE follows a specific process/flow, which does not significantly differ for spot or grid networks. The process begins when a customer contacts the service coordination desk and receives a work order number, which tracks the process in the system. The customer is assigned to one of the SDPMs, who will discuss the project with the customer and determine what information has been provided, what is still needed, and a timeline for any scheduled visits.
The SDPM coordinates with the distribution engineering team to determine exactly what is needed. Every new load is analyzed using PSSE, under the direct supervision of Distribution Engineers. The Distribution Engineers determine the electrical design needed to service the new load.
Distribution engineering sends the distribution design to the SDPM, who determines the route that the conduit(s) must follow and where to install them. For example, if a distribution engineer specifies that they need to run two 500 MCM copper cables from a particular manhole to the building panel, the SDPM determines exactly how to accomplish it. Once the design layout is complete, the Distribution Engineers confirm the electrical layout. The SDPM also works with the building architect(s) on the design/construction of any new vaults to assure that the designs meet PGE specifications.
PGE also uses Field Inspectors, who meet periodically with the customer/customer contractors throughout the project construction. KCMs may also liaise with large customers about the project.
Customer Requests - Additional Load
Customer requests for additional load may flow through the KCMs or SDPMs. PGE has created a one-note “database” containing all of the new or proposed construction in the downtown area. The database acts as a way to record and monitor information on different projects due to the large volume of projects across the downtown district. The database also includes some projects in the River District that the CORE network does not service despite being downtown.
The manager of the SDPMs reviews this information on an informal basis to track progress and check that the anticipated projects will actually occur. Much of the proposed work in the database is tentative, so PGE does not utilize this information for load forecasting.
Once a project actually starts, the customer submits a “Service Coordination Request,” and the project is assigned a Maximo project number. The network KCM, who may be involved upfront in understanding the customer’s service requirements, coordinates with the SDPM and the building developer. The SDPM is directly involved in the technical and electrical design.
The KCM will continue to track the project and follows up when the proposal becomes an almost-complete building after construction. Overall, the KCM acts as a facilitator.
Network Equipment
PGE’s network infrastructure consists of five separate network systems supplied from two different substations. One substation supplies three networks, with four primary 12.4-kV feeders supplying each network. Of these three networks, one consists of all spot network locations while the other two include both spot and grid networks. The other substation supplies two networks, with four primary 11-kV feeders supplying each network. These two networks consist of both spot and grid networks. PGE uses a conventional network design with dedicated network feeders, supplying only network load. For reliability, different bus sections at the substation supply feeders that supply any one network.
The typical network unit consists of an integrated three-position disconnect and grounding switch, a network transformer connected in delta-wye, and a throat-mounted network protector. PGE uses straight Energy Services Network Association (ESNA) receptacles in the transformer. Note that PGE does have locations that differ from this typical design, including locations that utilized banked single-phase transformers, as well as separately mounted switches and network protectors.
The typical transformer sizes on the grid networks are 500 kVA or 750 KVA. For spot networks, transformers can be 500, 750, 1000, or 1500 kVA, depending on the spot network load requirements. All equipment is submersible.
For spot network locations, the vaults are typically customer-owned and located below grade. PGE does have some spot locations above grade and a few older installations with spot networks on the roof.
The primary cable system is a combination of lead cables and EPR insulated cables. PGE replaces lead cables with EPR cables as opportunities arise. They use transition, cold shrink, and heat shrink joints. Splices are “pressed,” as field crews have more confidence in compression connections than in shear bolt technology. Note that with the EPR cable systems, PGE is trialing the use of bolted ESNA-style connections, such as Y and H connections.
The secondary system uses both lead and EPR cables. PGE does not have a secondary cable replacement program underway.
In most of its spot network vaults, PGE has installed a ground fault relay scheme that measures the neutral and ground current through a current transformer (CT). If the current exceeds a threshold, it trips all of the network protectors supplying the spot and locks them into the open position. Once this system activates, the protectors can only close with manual intervention. PGE installed this scheme because the primary protection scheme will not see through to a fault on the downstream side of the protector prior to the collector bus. PGE has experienced incidents in which the customer bus in front of (upstream of) the switchgear faulted, and the ground fault protection scheme worked as intended.
For the protective system to function correctly, PGE requires that the customer-side ground and neutral not be grounded on the customer side, but instead be isolated, and that it be tied in with the ground fault scheme on the vault secondary side.
In addition, most vaults also have a trip scheme tied in with thermal sensors located above the collector bus and transformers. This scheme also trips all of the protectors supplying the spot.
Technology
PGE engineers use PSSE to analyze new customer loads on the network, model the impacts, and determine the required system reinforcements. PSSE can not only model power flows and system dynamics but also test contingencies, optimal power flows, and voltage stability. As a relatively antiquated system, presently PSSE can only model three-phase loads, not single phase. PGE is transitioning to CYME software and intends to add the secondary network module. Thus, PGE will use ArcGIS to model and display loops. PSSE cannot show loops and creates errors when modeling the secondary network, which has prevented accurate models from developing. PGE currently uses CYME for modeling on the radial system.
PGE uses ArcFM GIS software for designing network layouts and creating a package with details for relevant personnel. ArcFM builds upon ESRI’s ArcGIS. Schneider Electric’s software is a map-focused GIS solution that allows users to model, design, maintain, and manage systems, displayed graphically alongside geographical information. ArcFM uses open-source and component object model (COM) architecture to support scalability, user-configurability, and a geographical database.
PGE uses ArcFM with Maximo for Utilities 7.5, which creates work orders and reference numbers when customers confirm a project. After creating a design in ArcFM, designers send it to Maximo in which compatible units (CUs) can calculate the work details and scheduling.
7.4.7.15 - SCL - Seattle City Light
Design
Network Design
People
Organization
Network Design at SCL is performed by the Network Design Department, which is part of Energy Delivery Engineering. See Attachment A . The Network Design Department performs all planning and design of SCL’s networks.
The Network Design Department is made up of eight “System” engineers, who do all of the design for the network, and eight “Services” engineers, who interface with the customers, gather load information, coordinate construction activity, etc. The individuals in this group are four-year degreed engineers. Some have their PE licenses.
The engineers at SCL are represented by a collective bargaining agreement (IBEW, Local 17).
Process
Network Design
SCL has a network design that breaks the network load into small, isolated “sub-networks” to limit the number of customers exposed to an outage in the event of loss of any one sub-network. Each sub-network is sourced by six primary feeders (at either 13.8 or 26.4 kV), and is designed to N-1. All primary feeders that source a given sub-network are sourced from the same substation. This minimizes the potential for circulating currents on the secondary system due to load imbalances between two substation sources. SCL has 15 distinct sub-networks. SCL currently has no ties between the sub-networks, nor have they applied any distribution automation (remote operation) to the network feeders beyond the substation breaker.
Network Secondary
SCL has existing 208 and 480 V secondary networks. SCL will not expand the 480 V network, because of the potential for having a sustained arc at 480 V.
Spot network services to new large load buildings are normally supplied at 480 V.
SCL has high fault duty in their downtown area (100000 A).
Load Flow
SCL conducts a master load flow analysis twice per year using “extracts” from their monitored loading data after the summer and winter of each year. This master load flow analysis is performed on all network feeders. The analysis is performed by the Load Flow Engineer within the Network Design Department. This process is one of the drivers of reconductoring projects.
(Note: many feeders are analyzed more than twice per year because of load increases – see feeder assignment process discussion in next paragraph.)
SCL also performs a feeder load analysis as part of their Feeder Assignment process in response to anticipated new load. The term “Feeder Assignment” means determining which feeder or feeders will serve a new network load. A Network Services engineer requests the feeder assignment based on a new or supplemental load need. The System Engineer within the Network Design department performs an analysis to determine the best scenario for serving the new load. This analysis includes ensuring that the network design criteria are met, and that any feeder imbalance is restricted to less than 20%. (Note that about 80% of new load is served as a spot network, rather than tapping the existing network secondary.) See Attachment B , for a flow diagram of the Feeder Assignment Process.
When SCL performs a load flow analysis, they start off with the worst case (no accounting for diversity). They then re-run the case after applying a diversity factor.
Technology
Fire Protection
SCL uses both fire protection heat sensors and temperature sensors in vault design.
The fire protection heat sensors are designed to open all the network protectors in the vault when the heat sensor registers 225 ˚ F. SCL has installed fire protection heat sensors in 95% of its building vaults. These sensors are not utilized in “street” vaults.
The temperature sensors, part of the DigitalGrid (Hazeltine) system, send an alarm to the dispatcher at 40 ˚ C – well before the network protector trip threshold is reached. SCL currently has completed installation of these sensors in about 20% of their vaults. They plan to install these sensors in all of their network vaults (both in building vaults and in “street” vaults).
Cable Cooling System
SCL has designed and installed a novel chilled-water heat-removal system to increase the ampacity of cables at a certain location that was identified as a thermal bottleneck due to the number of adjacent network primary feeders, depth of burial, and other factors.
They have been successful in increasing the ampacity of these cables by 40% through the installation of this water-cooling system.
7.4.7.16 - References
EPRI Low-Voltage Training Material
Low Voltage Network Overview
EPRI Low-Voltage Training Material
Design Considerations for secondary networks
7.4.7.17 - Survey Results
Survey Results
Design
Network Design
Survey Questions taken from 2015 survey results - Summary Physical/General and Design (Question 72)
Question 17 : What is average number of feeders supplying a conventional network (street grid)?

Question 25 : What is the typical number of feeders required to supply your spot networks?

Question 72 : What type of secondary connection technology is used on your networks?

Survey Questions taken from 2012 survey results - Summary Physical/General and Design (Question 4.21)
Question 2.4 : How many feeders make up the network feeder group?

Question 2.7 : How many feeders (minimum) supply your spot networks?

Question 2.8 : Network primary operating voltages(s)?

Question 4.21 : What type of secondary connection technology is used on your networks?

Survey Questions taken from 2009 survey results - Summary Physical/General
Question 2.4 : Network primary operating voltages(s)? (this question is 2.8 in the 2012 survey)

7.4.8 - Network Protector Design
7.4.8.1 - AEP - Ohio
Design
Network Protector Design
People
Establishing specifications for the network unit, including transformers, network protectors and the primary switch design used in the AEP Ohio networks supplying metropolitan customers in Columbus and Canton is the responsibility of the Network Engineers in collaboration with the Network Engineering Supervisor. These personnel are geographically based in downtown Columbus at AEP Ohio’s Riverside offices. The Network Engineering group reports to the AEP Network Engineering Supervisor, and is part of the Distribution services group at AEP, reporting ultimately to the AEP Vice President of Customer Services, Marketing and Distribution Services. The AEP Distribution Services group, including the Network Engineering Supervisor supports all AEP network design issues throughout its operating companies, including Texas, Indiana, Michigan, Oklahoma, and other locations.
AEP also has a Network Standards Committee, headed by the lead Network Engineering Supervisor in its downtown Columbus offices, and comprised of representatives from all AEP operating companies. This group works closely with the parent company’s Distribution Services organizations, and holds regular teleconference sessions on network findings, “lessons learned” in the field, and discusses potential network engineering solutions to common network design and implementation issues. Network protector designs used throughout the AEP service areas are regularly studied and recommendations are made through this committee.
Process
AEP Ohio has standardized on Eaton CM52 network protectors, though the company has various in-service styles of both Eaton and Richards network protectors. Key drivers of AEP Ohio’s decision to standardize on the CM52 include its submersible, dead front design, which minimizes inadvertent contact with energized parts within the protector and enables quick and safe testing, and built in diagnostics which can be relayed through AEP’s SCADA system to network monitoring stations.
AEP is in the process of replacing older network protectors with Eaton CM52 network protectors. These replacement protectors use microprocessor relays and supplant mechanical and analog designs of previous network protectors in the AEP system. AEP Ohio is also contemplating the use of Eaton NP Serve, a network protector monitoring and control module, for better real-time data monitoring and control, including the ability to retrieve data from downstream devices, and perform applications such as secondary fault diagnostics.
Technology
AEP uses Eaton CM52 network protectors, a fully submersible protector with a dead front design (see Figure 1).

Figure 1:
AEP Network Engineering Supervisor Roy Middleton demonstrating dead-front enclosure network protector cabinet
AEP’s network protector specification also calls for other features that can be purchased with the CM52 including:
-
External disconnects are used to separate the protector from the secondary collector bus. These disconnects are a safety feature used in a 480-V design to mitigate arc flash risks (see Figure 2). On this network protector, the NP fuses are internal and link style, as AEP is able to create the visible break between the NP and the secondary bus using the disconnects. Note that the disconnects can only be opened with keys which can only be accessed when the NP handle is in the open position because of an interlock system.
-
ARMS (Arc Flash Reduction Maintenance System) modules enable a worker entering the vault to change the protection settings in the protector to reduce the fault clearing time and thus the arc energy in the event of a fault.
-
A remote racking system (RemRack) enables the Network Protector breaker to be racked out remotely from outside the vault while the door of the network protector remains closed. This feature prevents the worker from being exposed to an arc flash while racking out the breaker.
-
A submersible stacklight is an annunciator system offered by Eaton that indicates network protector status through a series of different colored lights (see Figure 3).

Figure 2:
Keys for protector top disconnects interlocked with NP handle position

Figure 3:
Externally mounted disconnect handles. Note 'stacklight' annunciator system on the left side
AEP Ohio also has an installed remote monitoring system. The company uses the Eaton VaultGard communication platform for recording and communicating data from the network protector to monitoring stations (see Figure 4). In addition, AEP Ohio is in the process of refurbishing its network monitoring system with dual looped, redundant fiber-optic communications network that will relay information to AEP Ohio monitoring stations (see Remote Monitoring System). This system uses optical cabling that ties in with the CM52 microprocessor-controlled relay to provide monitoring and control of the protector. The new system will offer a wider range of information than was available on protectors the company used in the past. AEP Ohio is considering moving to a new NP Serve product from Eaton which will provide more real-time data to its Operations Center over its fiber-optic network.

Figure 4:
VaultGard data communications link for network protectors
7.4.8.2 - Ameren Missouri
Design
Network Protector Design
People
Network standards, including the standard design for the network unit, including the network protector design, are the responsibility of the Standards Group.
This group develops both construction standards and material specifications for designs and equipment used in the network underground. These standards and specifications are used by engineers and estimators in developing network designs. Standards are available in both an online and printed book format. Updated versions of the book format version are issued every 2-3 years.
Organizationally, the Standards Group is led by a Managing Supervisor, and is part of the Distribution Planning and Asset Performance Department, part of Energy Delivery Technical Services. The group is staffed with engineers.
For the network unit standard, Standards engineers work closely with the organization responsible for network equipment testing and maintenance – the Service Test group. Ameren Missouri has an up to date material specification for the network unit; however, the construction standard for this installation is maintained separately, and is not part of the Construction Standards Book. Ameren Missouri plans to incorporate the standard for the network unit into its Construction Standards Book.
Process
Ameren Missouri uses submersible throat-mounted network protectors with microprocessor controlled relays.
Ameren Missouri has a network protector maintenance and repair shop located in St. Louis. They maintain an inventory of protectors which are tested and ready for installation.
Network Protectors are maintained on a two year cycle. (See Network Protector Maintenance for more information. ) Ameren Missouri does not do periodic network protector drop testing. for more information.) Ameren Missouri does not do periodic network protector drop testing.
Technology
Ameren Missouri has about 265 network protectors on their system. Their current standard is for the network protector to be throat mounted to the transformer secondary. Standard network protector sizes are 1875, 2000, 2250, 2825, and 3000 amp units.
Ameren Missouri uses protectors from both Eaton and Richards. At the time of the practices immersion, Ameren Missouri was in the process of moving to the CM52 network protector. This decision was based on an analysis performed by Ameren Missouri, and driven by certain attributes of the CM52, including the dead front design, modular replacement, and remote racking capability, which enables them to rack the breaker out of the bus with the NP door closed.
Ameren Missouri uses the ETI electronic relay as part of its remote monitoring system. Using this system, they are monitoring various points including voltage by phase, amps by phase, protector status, transformer oil top temp and water level in the vault. The monitoring points are aggregated at a box mounted on the vault wall that communicates via wireless.

Figure 1:
Transformer mounted network protector

Figure 2:
Transformer mounted network protector secondaries

Figure 3:
Transformer mounted network protector secondaries

Figure 4:
Remote monitoring control box mounted on vault wall
7.4.8.3 - CEI - The Illuminating Company
Design
Network Protector Design
People
The design of the network protectors is performed by the CEI Underground / LCI group, part of the CEI Regional Engineering group, located in NRHQ (Northern Region Headquarters).
Technology
The Network is made up of approximately 57 vaults, and includes 61 network transformers with protectors. Network protector sizes range from 1600 – 3000 A.
Network Protector information is kept in a manual file in the Underground Department.
7.4.8.4 - CenterPoint Energy
Design
Network Protector Design
People
The design of network vaults, including the use of network protectors is performed by the Vaults group within the Major Underground Engineering Department. The Vault design group is led by a Lead Engineering Specialist. The Engineering department is led by a Manager and is comprised of four main sub groups, including the Vaults group.
Process
For new designs, CenterPoint physically separates the network protectors from the transformer units, where they can. The driver for this change was to keep a fire in the network protector from spreading to the transformer.
Technology
About ten years ago, CenterPoint decided to rehabilitate their network infrastructure, including replacing all of their network protectors. They did some investigation of network protector types and elected to standardize on the CMD type protector.
They chose to standardize on the CMD because they believe that the dead-front, draw-out, spring-closed breaker mechanism and the externally mounted fuses make this is a safer design than some other network protector styles. They acknowledge that the CMD units are larger than some other styles.
7.4.8.5 - Con Edison - Consolidated Edison
Design
Network Protector Design
People
Organization
Central Engineering - Responsibilities include Civil / Mechanical Engineering, Control Systems Engineering, Design Engineering, Electrical Engineering, Equipment and Field Engineering, and Environmental Engineering & Program Support.
Employee Depelopment
Con Edison invests in developing its design employees through three distinct programs focused on employee development. One program is focused on the development of newer engineering employees, another at incumbent employees, and the third at bargaining unit employees who are entering the management ranks. The programs are described more fully on page 3-53 of this report. Note that these programs are not limited to design employees, but are available to all employees who qualify.
Process
Network Protector Design
Con Edison uses a mix of Eaton and Richards network protectors. At 120/208, Con Edison mounts the network protector directly on the transformer secondary. At 265/460, Con Edison’s design standard calls for the protectors to be mounted separately from the transformer, normally in a separate vault enclosure.
Depending on the application, Con Edison’s network protectors are either built with a submersible enclosure, built with a non-submersible (ventilated) enclosure, or mounted on an open frame.
The use of submersible network protectors is limited to those places where the units will likely be in water. Con Edison has divided its territory into hurricane flood zones, and is in the process of installing submersible network protectors in vaults located in the zones most susceptible to flooding. All new installations in these zones are submersible.
Con Edison does have plans to retrofit existing installations that have non-submersible units with submersible ones, but they face a challenge in that the submersible units take up more space.
In vaults with non-submersible (ventilated) network protector units, Con Edison installs a high water alarm to indicate when a sump pump may overflow and respective equipment integrity is in question.
In locations where the protector will be located in a compartment (for example, in a building), the protector is mounted on an open frame.
7.4.8.6 - Duke Energy Florida
Design
Network Protector Design
People
Standards for network design, including the network protector, are the responsibility of the Duke Energy Florida Standards group, which oversees all standards for distribution equipment and materials. One Engineer within the group oversees all network equipment standards for Duke Energy Florida. This engineer is an Electrical Engineer, a requirement for the engineer who specializes in Network Standards. The engineer also has a PE license, a requirement to obtain certain levels within the engineer family.
Duke Energy has a Corporate Standards committee which focuses on developing common standards throughout the Duke Energy family of companies. Across the Duke Energy family of companies, there is a core Network Group of four or five members within the broader Standards groups that assist each other and collaborate on choosing all material and specification standards for the underground network throughout the company, including Florida. This core underground team draws on members from across the Duke Energy operating companies. The Design Engineers are engaged in a Duke Energy corporate-wide process to consolidate design standards for network systems among the various Duke operating companies, due to be finalized in 2017.
Duke Energy Florida has developed network design standards, which are contained in the “Duke Energy Florida Section 29; Networks, Vaults, and Transclosures.” (See Attachment D.)
Process
The Standards engineers who focuses on network infrastructure works very closely with experts within the Network Group, including the department manager and senior network specialists. Network standards for infrastructure in Clearwater and St. Petersburg are the result of the collaboration between the Standards group and Network Group.
Technology
Clearwater
At 125/216V, Duke Energy Florida has standardized on the CM22, with internal NP fuses (see Figures 1 and 2). Duke Energy Florida uses a remote monitoring system in its network vaults in Clearwater. The company uses the Eaton VaultGard communication platform for recording and aggregating data from the network protector MPCV relay and from other vault sensors (Qualitrol). This information is communicated through a Sensus cellular monitoring system to a central server every half hour. Within the Network Group, information from Sensus, such as secondary loading, is monitored daily. Note that the Sensus system is read only, with the functionality to remotely control equipment being disabled for security purposes.

Figure 1:
CM22, spare unit, in case"

Figure 2:
CM22, spare unit
The network mains are supplied with four sets of cables using stud moles on the protector. Their vault design calls for the use of a separate uni-strut rack with insulated cable clamps that is mounted into the vault wall to support weight of the secondary cables.
Limiters are installed at each secondary junction on the secondary mains on the outgoing secondary cable.
St. Petersburg
At 277/480V spot network locations, Duke Energy Florida has standardized on the CM52, a fully submersible protector with a dead front design (see Figures 3 and 4). Duke Energy Florida’s network protector specification also calls for features such as:
-
External disconnects, which are used to separate the protector from the secondary collector bus. These disconnects are a safety feature used in a 480V design to mitigate arc flash risks. On this network protector, the NP fuses are internal and link style, as Duke Energy Florida is able to create the visible break between the NP and the secondary bus using the disconnects. Note that the disconnects can only be opened with keys which can only be accessed when the NP handle is in the open position because of an interlock system.
-
Wall-mounted ARMS (Arc Flash Reduction Maintenance System) modules, which enable a worker entering the vault to change the protection settings in the protector to reduce the fault clearing time and thus the arc energy in the event of a fault.
-
A submersible Stacklight, which is an annunciator system that indicates network protector status through a series of different colored lights.
Note that Duke Energy Florida has not installed the Sensus remote monitoring system in spot network protector vaults, in St. Petersburg.

Figure 3:
Spot network vault with CM52. Note uni-strut cable support racks

Figure 4:
note the external disconnects, stack light, and stud models atop the protector
7.4.8.7 - Duke Energy Ohio
Design
Network Protector Design
People
Network standards are the responsibility of the collaboration of the network engineer, the planning engineer, and the Dana Avenue supervision. This group uses the old Cincinnati gas and electric construction manual as a guide. Ultimately, Duke Energy will develop a common network standard across the system.
Process
Duke Energy Ohio has its own network protector refurbishment facility at Dana Avenue. They maintain an inventory of about 30 units, which are tested and ready for installation.
Technology
Duke Energy Ohio has about 410 network protectors on their system. Their current standard is for the network protector to be mounted to the transformer secondary; however, they have many existing freestanding network protectors on the system.
Duke Energy Ohio’s current standard is to use the CM52’s with communication enabled MCDV relays[1] . Note that Duke Energy Ohio is in the process of changing out old network protectors, replacing about 35 units per year, and selecting units for replacement based on vintage and condition.
Standard network protector sizes are 2000 and 2825 amp units at 208 V and 3500 amp units at 480 V. Duke’s network protector installations use external mounted, busman style fuses. (Although Duke has many existing installations with internal NP fuses installed.)
Network protector installations are designed with a shroud (blast hood) over them.

Figure 1:
Transformer Mounted Network Protector with external fuses

Figure 2:
Transformer Mounted Network Protector with external fuses
[1] Duke Energy Ohio is in the process of installing remote monitoring in their network.
7.4.8.8 - Energex
Design
Network Protector Design
Process
Energex does not require network protectors as its secondary is not meshed.
7.4.8.9 - ESB Networks
Design
Network Protector Design
Process
ESB Networks does not require network protectors as its secondary is not meshed. For its MV substations, ESB Networks uses overcurrent protection at the feeder source. Single-phase spurs are fused from the main line.
7.4.8.10 - Georgia Power
Design
Network Protector Design
People
Establishing standards for network protectors at Georgia Power is the joint responsibility of the Standards Group, comprised of senior network underground engineers from the Network Underground Engineering group and Principal Engineers who report to the Network UG Manager, and the Network Operations and Reliability group. Both the Network Underground Engineering group and the Network Operations and Reliability group are part of Network Underground.
The Network Underground Engineering group, led by a manager, is comprised of Engineers (Electrical and Civil) and Technicians concerned with the planning, design, and any service issues associated with the network. The Engineers are four-year degreed positions, while Technicians have a combination of years of experience and formal education, including two-year and four-year degrees.
The Network Operations and Reliability group, led by a manager, is comprised of Test Engineers, Test Technicians and other resources who perform system operations and maintenance activities. The Test Engineers are four year degreed positions, and are not part of the union. Together, the engineers develop standards for the use and type of network protectors on all of Georgia Power network underground systems, statewide.
Standards were first documented and codified in the 1970s, and they include what was already in place on the network from the 1940s and any new standards developed since then. Standards are available in both an online and printed book format.
Process
For network protectors, Georgia Power uses both Richards and Eaton protectors. Engineers have standardized on submersible protectors with dual ratings (208V or 480V). They deploy mainly Eaton CM 22 and Richards 313 and 314s. Engineering has bought and installed a few CM 52s for trial, but are concerned with stored energy in the unit spring. Once that issue is resolved, Georgia Power may move to this model or some other model with purely electronic relays.
While some older protectors have internal fuses, Georgia Power is moving to protectors with outside fuse boxes mounted on the top of the protectors (See Figure 1 and Figure 2.). These Class L current-limiting fuses provide backup protection if a protector fails to open for a primary fault. They also protect the GPC bus during faults on customer-owned service equipment. They also reduce the arc flash exposure for persons working inside the protector.

Figure 1:
New network protector: note fuse boxes on top of the protector

Figure 2:
Older network protector, being rehabbed
For network feeders, protective devices include the feeder breaker, network protectors and fuses installed on the secondary between the network and the customer. Current limiting fuses are used at the junction between the Georgia Power system and the customer’s facility.
Maintenance and Upgrades
Georgia Power is in the process of replacing older network protectors with either new units or refurbishing protectors in the field by replacing electromechanical relays with microprocessor based controls. The network protector replacement initiative is being performed in tandem with the Georgia Power three-year network protector inspection cycle performed by Test Technicians, part of Network Operations and Reliability. When the inspection team finds a protector that is old or needs to be upgraded with a microprocessor relay, they perform the upgrade during the field inspection whenever possible. Although this may slow the inspection crews down in their maintenance schedule, Georgia Power has stayed on track in its inspections and has found this practice the most cost-effective and expedient means for performing the upgrades and replacements.
Technology
All network protectors are connected to the Network Operations center by a SCADA system that runs on DSL, radio frequency, or fiber network connection to the Network Operations center. Protector monitoring and opening/closing of protectors can be performed remotely by operators within the Network Operations Center. Remote monitoring and control of protectors has been in place at Georgia Power for about 15 years (See Figure 3 and Figure 4.).

Figure 3:
Image from GA Power Network Control Room

Figure 4:
Image from GA Power Network Control Room showing NP status (CL – closed)
7.4.8.11 - HECO - The Hawaiian Electric Company
Design
Network Protector Design
People
Network protectors are sized by the Planning Division. The relay settings are determined by the Protection Division. The design of a network protector installation is performed by the T&D Division of the Engineering Department.
Technology
The Network includes approximately 140 network transformers with protectors (Network Units). Network protector sizes range from 1200 – 3000 A at 125/216V, and from 800 – 3000 A for 277/480 V spots.
HECO has remote monitoring of network protector status (Open / Close) at its dispatch center.
7.4.8.12 - National Grid
Design
Network Protector Design
People
Network standards, including the standard design for the network protector, are the responsibility of the Distribution Standards department, part of Distribution Engineering Services. Distribution Engineering Services is part of the Engineering organization, which is part of the Asset Management organization at National Grid. Within the Standards group, National Grid has two engineers that focus on underground standards.
National Grid has up to date standards and material specifications for network equipment, including the network transformer primary switch, network transformer and network protector. Network material specifications are updated annually. Standards are updated on a five-year cycle.
Note that because National Grid’s system is comprised of multiple network systems of different designs in both New York and New England, the standards book is organized with a common standards section that represents the whole company, and then individual sections that specify standards appropriate to the individual network systems that comprise their overall infrastructure.
Process
National Grid has a network protector maintenance and repair shop located in the NY East Division building in Albany – the same location as the UG Department headquarters. This shop receives new units, mounts them on the transformer, and performs operational checks. The shop maintains an inventory of protectors which are tested and ready for installation.


Figure 1 and 2:
Network protector maintenance
National Grid performs network protector inspections annually, and performs network protector diagnostic testing on a five year cycle. (Note that diagnostic testing of CMD style protectors is performed on a two-year cycle, as National Grid has experienced some performance issues with these units.)
National Grid performs network protector drop testing annually.
Technology
National Grid has about 250 network protectors on their Albany network system. Their current standard is for the network protector to be throat mounted to the transformer secondary. Protectors are either rated 216Y/125V or 480Y/277V.

Figure 3:
Transformer mounted network protector
Network protectors are sized to 140% of the transformer rating standard network protector sizes at 216Y/125V are 1200, 1875, 2825 and 3500 amp units. Sizes of units rated 480Y/277 include 800, 1200, 1875, 2825, 3500 and 4500 amp units. National Grid network protector installations may use either internally or externally mounted fuses.
National Grid uses network protectors from both Eaton and Richards Manufacturing. All new protectors are equipped by the NP repair shop with communication enabled relaying. National Grid has completed changing out all old network protector electromechanical relays with microprocessor controlled relays in NY East.
Spot network vaults are equipped with a ground fault protection system designed to trip (open) all of the network protectors in the vault in the event of a ground fault. The customer is required to buy, install, and wire the National Grid approved ground fault protection system. Ground fault protection system equipment is installed in the customer’s electric room. However, a current transformer required to monitor neutral currents is installed in National Grid’s transformer vault.

Figure 4:
Network Protector Note: CT for ground fault protection scheme

Figure 5:
Network Protector Note: conduit for ground fault protection scheme control wiring
7.4.8.13 - PG&E
Design
Network Protector Design
People
PG&E has effectively implemented an asset management process for network equipment. They have assigned a specific person as the “Manager of Networks”, part of the Distribution Engineering and Mapping organization. This asset manager is responsible for determining the investment, maintenance and replacement strategies for network assets including network protectors.
The manager of networks is both an electrical engineer, and an attorney. He collaborates closely with the network planning engineer (Reliability and Planning), cable experts within Standards, and the Maintenance and Construction Electric Network group, the organization responsible for the execution of the asset strategies developed by the manager of networks. Note that within the M&C Electric Network Group, PG&E has a network protector maintenance and repair shop led by an experienced supervisor who is a network protector expert.
EPRI observed strong working relationships between the manager of networks, and other key PG&E resources focused on network management. The manager of networks was visible and known to the field force, periodically meeting with field crews to review topics of interest.
The manager of networks has a well documented asset strategy for managing network assets. ( See Attachment A ..) PG&E also has standards for network protector requirements and ratings.
Process
PG&E uses throat-mounted network protectors. PG&E assumes a similar life expectancy to that of the network transformer. Consequently, when the transformer is replaced, they will replace the network protector as well. Note that many of their installed units were placed in the 1950s.
PG&E has a network protector maintenance and repair shop located in San Francisco. This shop is led by a network protector expert, and supplemented periodically by a cable splicer from the Oakland division (for training purposes). They maintain an inventory of protectors which are tested and ready for installation.
Network Protectors are maintained on a three year cycle. See Network Protector Maintenance for more information.
Technology
PG&E has about 1400 network protectors on their system. Their current standard is for the network protector to be throat mounted to the transformer secondary. Standard network protector sizes are 1875, 2825 and 3500 amp units. PG&E network protector installations use externally mounted fuses.
PG&E’s uses network protectors from both Eaton (CM52, CM22 models and Richards Manufacturing (137NP, 313NP models.) They do have some Eaton CMD units installed as well. All protectors are equipped by the NP repair shop with communication enabled relaying (MPCV).
PG&E is in the process of changing out old network protectors, replacing units as part of their transformer replacement program.

Figure 1:
Transformer Mounted Network Protector with external fuses (top of protector)

Figure 2:
Transformer Mounted Network Protector with external fuses and CT’s for remote monitoring
7.4.8.14 - SCL - Seattle City Light
Design
Network Protector Design
People
The design of the network protectors is performed by the Network Design Department, which is part of Energy Delivery Engineering. See Attachment A. The Network Design Department performs all planning and design of SCL’s networks.
The Network Design Department is made up of eight “System” engineers, who do all of the design for the network, and eight “Services” engineers, who interface with the customers, gather load information, coordinate construction activity, etc. The individuals in this group are four-year degreed engineers. Some have their PE licenses.
The engineers at SCL are represented by a collective bargaining agreement (IBEW, Local 17).
Technology
The Network is made up of approximately 1200 network transformers with protectors. Network protector sizes range from 1875 – 4500 amp.
See the pictures below for a photograph and schematic of a typical spot network vault at SCL.


7.4.8.15 - References
EPRI Underground Distribution Systems Reference Book (Bronze Book)
7.4.9 - Network Rehabilitation
7.4.9.1 - AEP - Ohio
Design
Network Rehabilitation
(Network Revitalization)
People
Network revitalization, improvements, and refurbishment are planned by the AEP Ohio Network Engineering group in tight collaboration with its parent company. The company employs two Principal Engineers and one Associate Engineer to perform all network design and planning activities for the Columbus and Ohio urban underground networks. These engineers are geographically based in downtown Columbus at its AEP Riverside offices, and organizationally part of the parent company Distribution Services organization. The Network Engineering group reports to the AEP Network Engineering Supervisor, who ultimately reports the AEP Vice President of Customer Services, Marketing and Distribution Services.
AEP also has a Network Standards Committee, headed by the lead Network Engineering Supervisor in its downtown Columbus offices, and comprised of representatives from all AEP operating companies. This group works closely with the parent company’s Distribution Services organizations, and holds regular teleconference sessions on network findings, “lessons learned” in the field, and discusses potential network engineering solutions to common network planning and implementation issues. This committee can and does recommend system revitalization, improvements, and refurbishments for the AEP Ohio networks to the parent company. After approval from the AEP parent company, AEP Ohio Network Engineering and the AEP Network Engineering Supervisor plan the revitalization projects and oversee their completion.
Process
AEP Ohio has a number of on-going network revitalization and refurbishment projects in the works, including the following:
Replacement of Secondary Cable
After incidents involving fire in manholes caused by faulty secondary cables in 2014, the parent company, AEP, determined that an investigation team should look into the incident and report its findings. The investigation included the following:
-
On-the-ground inspection of cables in duct lines by camera
-
Scientific modelling of the existing secondary cable and its loads
-
Load flow models to identify cables that are overloaded or nearly fully loaded
-
Examination of failed secondary cable at AEP Ohio, as well as outside testing by a third party consultant.
The summary report of these investigations determined that the secondary styrene butyl cable was the cause of the fire due to cracked insulation. Network engineering analysis found that its insulation breaks down due to overheating and may produce combustible gases. Network Engineering has performed load analyses that have identified the cable runs most at risk and are a priority in the replacement process.
The summary report in AEP Ohio served as a basis for examination of all network grid systems in the AEP operating companies. It was found that other locations may need to rehabilitate secondary cabling as well.
In response, AEP formed a Project Management Team to initiate and lead a program to inspect and replace selected secondary cables throughout the AEP system.
AEP Ohio and all AEP network operating groups have prioritized the secondary cable replacement according to conditions (see Figure 1).

Figure 1:
AEP mitigation and prioritization strategy for secondary cable replacement
The cable replacement project, totaling $300 million for all of AEP, will result in replacement of nearly 202,600 circuit feet of secondary cable in AEP Ohio. System-wide, AEP will replace in excess of 900,700 circuit feet of secondary cable. This massive undertaking also led AEP to reinforce its existing network inspections to aggressively perform the following throughout the AEP operating companies:
-
Visually inspect every manhole and vault
-
Note not only secondary cable conditions, but also note conditions of every other network component in the manhole and vault, including transformers, switches, primary cables, etc.
-
Record all inspections of manholes and vaults into the system-wide asset tracking database called NEEDS (Network Electrical Equipment Database System)
To help drive the system-wide inspections and spur replacements and repairs, a Gantt chart and a system dashboard were put in place and updated weekly to track the progress of the inspections and replacements program (see Table 1 and Figure 2).

Table 1:
Portion of weekly dashboard report on secondary network inspections

Figure 2:
Sample of Gantt chart for AEP Operating Companies’ inspection and rehabilitation schedule
Secondary butyl and other cable (such as cloth PILC and older durasheath XPLE) are being replaced with 750 EAM insulated cable. The 750 EAM cable was chosen by the engineers because it fits in the current duct lines and has the capacity and thermal rating required by the network. The older butyl cable was rated at 70 degrees C, whereas the 750 EAM is rated at 90 degrees C (see Figure 3).

Figure 3:
750 EAM secondary replacement cable rated at 90 degrees C
In addition, AEP Ohio has found that secondary lead cable in its system, when hot, can cause fires that threaten other cables in the duct lines. Therefore, lead cables are also scheduled for replacement under this revitalization and refurbishment project (see Cable Replacement).
Network Protectors
All 480 volt network protectors in AEP Ohio are scheduled for upgrades to Eaton model CM52 protectors as well as older 216 volt units. Many have already been installed. The CM52 offers greater safety, flexibility, and data collection and operation via the new fiber-optic SCADA system, also under deployment (see Design-Network Protector Design). All network protectors have microprocessor based relays.
Fire Protection
Eaton High Thermal Event Systems are being deployed on high value 480 volt spot networks located in building vaults. If a fire is detected, the system automatically trips, isolating the affected transformer or bus before fire can spread.
SCADA Fiber-Optic Cables
The entire SCADA communications network is being upgraded to a double-loop, fully-redundant fiber-optic cable network. The new SCADA network cable is fast, lightweight, and fault tolerant (see Remote Monitoring).
Network Transformers
AEP Ohio is updating all its transformers to units without an integrated primary switch as older systems come out of service. These newer transformers will require less maintenance for AEP Ohio. The network unit will include a wall-mounted solid dielectric vacuum switch to separate the transformer from the primary
Technology
AEP Ohio uses CYMCAP and CYME SNA modules for its cable ratings, load analyses, and network circuit modelling. Its NEED database tracks all system serialized assets and their conditions as recorded by inspections. NEED also includes civil asset information such as underground vault and manhole structures.
7.4.9.2 - Ameren Missouri
Design
Network Revitalization
People
Ameren Missouri has formed the “Underground Revitalization Department,” a team of engineers (all 4-yr degreed) focused on researching, evaluating, and developing plans for performing capital improvements to and revitalizing downtown St. Louis, including the network. This group’s role includes addressing issues such as the development and update of planning criteria for the network, development of both cable and transformer replacement strategies, development of a network transformer replacement strategy, development of route diversity criteria, development of the criteria for manhole covers, and criteria for conduit system replacement.
Background
The city of St. Louis underwent periods of growth during 1910 -1920 as well as during the 1950s and 60s. These times saw Union Electric (now part of Ameren Missouri) install much of its underground network, which is now of a vintage where it is starting to deteriorate. As the city undergoes a period of redevelopment designed to encourage residential and commercial growth, Ameren Missouri understands that these old systems must be revitalized to handle increasing consumer demand.
For example, the St. Louis area has new apartments and hotels, a development at Ballpark Village, the Lumiere Place Casino and Hotel, the Scottrade Center, Edward Jones Dome, and the Busch Stadium. All of these require reliable energy supply that the old system may not be able provide without rehabilitation. Note that most of these are serviced by Ameren Missouri’s radial system.
This urban rejuvenation project provides the perfect opportunity for Ameren Missouri to instigate a complete re-examination of its system, and harden it against outages by both increasing reliability and incorporating Smart Grid initiatives.
Ameren Missouri’s current underground system serving St. Louis has four substations, 28 radial circuits, and 29 network circuits providing 200 MVA of demand within a two square mile area. High population density makes upgrading old systems difficult; therefore, any revitalization projects must be designed to last well into the future, minimizing future disruption and ongoing maintenance costs.
Ameren Missouri has set up a group, the “Underground Revitalization Department”, to research present and future needs, and to create a plan for upgrading and extending the system to account for increasing loads and usage patterns. The planning phase is currently underway, and the construction is intended to start in 2012, spread over 8 – 12 years.
The Underground Revitalization Department team is a multidisciplinary group of Ameren Missouri experts assembled to oversee the work, and to look at every single aspect in creating a holistic revitalization approach. Currently, Ameren Missouri has nine active strategy teams and one lead team, utilizing a total of 26 employees.
Project Team: This five-person team has been given the directive of establishing the plan for upgrading the underground network in St. Louis. It is looking at where problems arise with the infrastructure, and using this to create a strategy for revitalizing the system while balancing cost, practicality, reliability, and capacity.
The Project Team ensures that there are open lines of communication between the revitalization strategy group and the company directors, making sure that the project fits with corporate strategies. This group is headed by a Project Team Leader, and reports to the Manager of Distribution Operations.
Strategy Lead Team: This team contains the team leaders from the nine project subgroups, and works to ensure that all of the elements of the project blend together seamlessly. Some of the engineers are members of multiple project sub group teams, further ensuring that the approach to revitalization is fully integrated.
Strategy Teams: The nine strategy teams cover the following areas:
-
Route Diversity
-
Distribution Automation and SCADA
-
Sectionalizing
-
Inspection and Maintenance
-
Cable Diagnostics
-
Manhole Covers
-
Conduit Systems
-
Cable Replacement
-
Transformer Replacement
Two further groups will be added in the future as the project enters the implementation phase:
-
Reducing Collateral Damage
-
MLK (new substation) Cutover Strategy
The teams are developing strategies, as well as detailed plans for applying those strategies to the downtown infrastructure.
Process
The Underground Revitalization Department team formation was driven by the need to invest in modernizing distribution infrastructure to meet the higher loads and changing needs of consumers in urban St. Louis and address the fact that older underground systems require a significant maintenance expense.
See Asset Management
At the time of the practices immersion, all but two of the strategy teams had drafted their strategies, helping the underground group decide exactly what is required and exactly what improvements need to be made to the network. The improvements and upgrades to the system are expected to span ten years, but Ameren Missouri believes in developing all of the strategies at the outset, and training in – house people who will be involved with the process from the very start, and thus develop an intimate knowledge of the systems.
Ameren Missouri is using a condition-based approach for equipment replacement, based on an assessment of the performance and condition of a line or component. Ameren Missouri has implemented a two-year inspection cycle for network vaults and a four year cycle for network manholes. They have developed a draft criteria used to evaluate, manage, and prioritize replacement of network transformers and protectors within downtown St. Louis. These criteria are based on key considerations such as the transformer’s age, location, physical condition, loading, history with similar transformers styles, and oil quality. Note that at the time of the EPRI practices immersion that these criteria were in draft form. (See Maintenance: Network Transformer Replacement Criteria) )
With respect to conduit systems, the strategy team assessed the use of the existing clay tile conduits, with the attendant problems of high rate of water ingress and fragility. Other options were considered, and it was concluded that the clay tiles conduits would be replaced. The tiles will be abandoned in place and not be extracted.
Ameren Missouri will not be reusing old iron pipes due to the danger of shorting if the pipe becomes delaminated and the fact that the pipes are only 3 inches in diameter. This makes them impractical for modern insulated cables, many of which have a larger diameter and produce considerable heat when bundled together. This has also given the team an idea for researching the link between the failure of the old lead cables and the amount of delaminating of the iron pipe.
With respect to cable replacement, the strategy team is working on developing recommended diagnostic procedures for existing primary cables of different types with cables that fail the test procedure being replaced accordingly. The team has further recommended replacement of unjacketed lead cables and cloth-covered secondary cables.
The strategy team has developed an overall strategy designed to create route diversity among distribution system circuits, in order to minimize the impact of minor and major events. The team has also devised a draft plan that includes achieving true n-2 reliability for all network feeders and true n-1 for all radial feeders. The strategy also addresses general system diversity practices such as requiring that the circuits supplying a spot network be sourced from separate substation buses, route diversity practices such as limiting the number of network primary circuits from the same substation in the same duct bank to no more than two, and construction practices such as fireproofing cables in manholes.
The strategy teams are working on re writing the planning criteria to include route diversity requirements.
Another area being studied is the approach to sectionalizing urban underground feeders. Currently, the underground network system does not have any primary sectionalizing devices in the main feeders. The strategy teams are considering modifying the design to call for the addition of primary network feeder sectionalizing and tie points with a goal of limiting the number of switch operations to clear a network feeder or feeder section to no more than six operations. With the present design, network feeder systems with 15 – 18 transformers take a long time for the switching process, so incorporating primary sectionalizing devices would significantly reduce the number of switching operations needed to clear a feeder section.
Another area of focus for the strategy teams to address the legal and public relations issues that will surface associated with obtaining easements and permitting to perform the downtown revitalization work.
Technology
Ameren Missouri uses a number of systems to ensure that potential upgrades and new system designs are feasible and cost effective before considering them for funding.
Circuit and Device Inspection System (CDIS): Inspection findings are entered into the CDIS, and an algorithm assigns a “structural score” and an “electrical score” based on the inspection findings and weightings for various findings developed by Ameren Missouri. The scores are used to prioritize remediation at the detail level (for example, should I rebuild a particular manhole). CDIS is the permanent repository for inspection findings. It is used to produce reports that summarize inspection findings as well as a dashboard that monitors inspection progress.
Integrated Spending Prioritization (ISP): Ameren Missouri uses an Integrated Spending Prioritization (ISP) tool to compare investments by analyzing costs, risks and benefits. This active asset management system is used to compare projects at a high level, and aids Ameren Missouri management in selecting investments that will be of most benefit.
EPRI Distribution Engineering Workstation (DEW) and Siemens PTI PSS/E Software: These applications allow engineers to analyze existing and proposed circuits and configurations. Apart from load estimations, protective device coordination and power flow analysis, the system can help the engineers design a system with appropriate conductor and cable sizing, as well as the optimal capacitor placement.
7.4.9.3 - Duke Energy Florida
Design
Network Rehabilitation
(Network Revitalization – Florida Primary and Secondary Network Improvement Plan and ATS Switchgear SCADA Communications Refurbishment)
People
Duke Energy Florida has implemented a comprehensive plan focused on improving the secondary network infrastructure in Clearwater and St. Petersburg. The development and implementation of this plan is being led by the Power Quality, Reliability and Integrity (PQR&I) group. This group, led by a Director, is responsible for all asset management, planning and reliability of the electric systems in Duke Energy Florida. The group consists of two teams, one focused on the Central Region and the other, the Coastal Region, of which Clearwater and St. Petersburg are a part. The Duke Energy Florida PQR&I group also works closely with the PQR&I Governance group, which supports different local operating jurisdictions.
The genesis of the project was a mandate from the Duke Energy Florida Distributions Operations Vice President to examine the overall health of the network infrastructure and to recommend improvements to assure its continued safety and reliability. This mandate was driven by a recognition that the infrastructure is aging and a desire to forestall significant events, such as manhole fires, which can impact reliability, safety and customer service.
The focus of the examination is the network infrastructure in Clearwater (a secondary grid) and in St. Petersburg (spot network locations).
Organizationally, the Duke Energy Florida field resources that construct, maintain, and operate the network infrastructure within Clearwater and St. Petersburg fall within a specific Network Group which is part of the Construction and Maintenance Organization. The Network Group is led by a supervisor who reports to the Region General Manager. The group consists of ten craft workers, five Electric Apprentices and five Network Specialists (the journey worker position), all part of the Network Specialist job family. These ten workers have responsibility for both the Clearwater and St. Petersburg underground systems, with some workers assigned to Clearwater and others to St. Petersburg, depending on the work load.
At the time of the practices immersion, the Network Group had assigned two Electrician Apprentices, and two Network Specialists (the journeyman position) to work with the St. Petersburg underground system, which includes the downtown area, the beachfront areas, and the southern peninsula. Much of the focus of these resources is the revitalization of the St. Petersburg network.
The Network Specialist is a jack-of-all trades, position, responsible for all facets of UG work, including cable pulling, splicing, and maintaining and operating equipment such as cables, joints, network switches, transformers, and network protectors. Network Specialists also work with the installation and maintenance of automation associated with the equipment they manage.
Duke Energy Florida is utilizing contractor resources to perform their cable replacements in Clearwater and St. Petersburg. The contractor crews are supervised by two Network Specialists who provide oversight and coordination to the contractor crew. A Short Term Decision Plan (STDP) in place with contractors has helped speed up the process of refurbishment. Note that Duke Energy Florida work teams are also held to work schedule goals and clear and stringent safety goals as part of a STDP. Safety, Customer Satisfaction, and Financial (O&M) components are a part of the STDPs in addition to the completion goals.
ATS Switchgear SCADA Communications Refurbishment
Duke Energy Florida recently added SCADA monitoring and control to automated transfer switches. These switches are part of a design that provides larger customers with a loop feed using a primary feeder, and a reserve feeder tied together at the customer’s site with an automatic transfer switch (ATS). In the event of an outage to the primary feeder, the customer’s load would be swapped over to the reserve feeder, on which capacity for the customer’s load has been reserved.
Duke added SCADA monitoring and control to these devices so that operation of the switch as well as monitoring of the switch status could be performed by the dispatcher. With this automation, when an event occurs that initiates operation of the ATS, the dispatcher would receive an alarm. The dispatcher can also initiate the swap of load from one feeder to the other or return the configuration to normal after the outage is restored.
The Network Specialist position was selected to install the automation, as the Network Specialist is the classification most familiar with the operation of ATS.
As part of the installation of the automation, the design included the addition of proximity sensors which detect the position of the switch blades as confirmation of the switch operating. The proximity sensors selected were an after-market component, and Duke Energy Florida has experienced frequent failures of this sensor, resulting in false alarms being sent to the Dispatchers in the DCC.
The Network Specialist position was selected to replace the faulty proximity sensors on the ATSs. Note that at the time of the practices immersion, Engineers at Duke Energy were working on developing a permanent solution.
Process
The process of assessing the health of the network infrastructure was implemented in three phases. The first, was an internal assessment performed by a team that included experts (Network Specialists) from the Network Group, the Network Group supervisor, and network engineering experts from the PQR&I group. This assessment included a description of system condition, including known issues and concerns, as well as a summary of recent investments made to the network system.
Phase two of this effort involved bringing in experts from other Duke Energy Operating companies to examine the condition of the network infrastructure and develop ideas for improvement.
The result of these two efforts was the identification of six key issues to be addressed, and a draft work plan for addressing these issues. The six issues identified are:
- Succession planning for craft resources
Duke Energy Florida plans to finalize training modules for network craft workers.
- Backlog of asset replacement and maintenance work
Duke Energy Florida plans to leverage contractor resources and off load non-network work.
- Long-term strategic plan for the network
Duke Energy Florida plans to task planning engineer with developing long-term vision for the network
- Design engineering expertise
Duke Energy Florida will review requirements, identify resource requirements, and assign resource or evaluate for FTE addition
- Modeling ability
Duke Energy Florida plans to identify and appropriate software/module and assign resources or evaluate for FTE addition
- Work methods process and procedure reviews.
Duke Energy Florida plans to perform a Cross-Jurisdictional (Duke energy wide) review and evaluation of enterprise standards
Duke Energy Florida has developed a work plan comprised of actions that support these issues, and has formed teams to focus on executing the plan in key areas. Below is a listing of the teams, and the major initiatives associated with each.
Team 1: Construction and Maintenance
-
Process & procedure reviews
-
Resource plan
-
Contractor oversight
Team 2: GIS
-
Map updates
-
GIS tool acquisition (to model secondary) and data transfer (to electronic)
-
Sustainability plan
Team 3: Planning
-
FTE addition – planning engineer
-
St. Petersburg / Clearwater short-term strategy
-
St. Petersburg / Clearwater long-term strategy
Team 4: Engineering & Construction Planning
-
Workforce & workload evaluation
-
Training & transition plan
-
Sustainability plan
Team 5: Work plan Execution
-
Offload non-network work from crews (e.g. ATS inspections, Design engineering, etc.)
-
Work plan functional model
-
Commissioning of outstanding devices (RA switches)
Team 6: Asset Plan
-
Slab replacements
-
Inspection process reviews
-
Asset replacement strategy
-
Grate replacements
Team 7: Standards
-
Replacement of switches with non-oil technology
-
Vertical feedthrough switches
-
Remote monitoring technologies
-
Manhole lid pressure relief device
At the time of the practices immersion, Duke Energy Florida had just launched these efforts. The third phase of their evaluation was to perform an external (third party) assessment of their plans – the performance of the EPRI practice immersion is part of that assessment process.
An example of the focus on network improvement is the revitalization efforts underway in St. Petersburg. The St. Petersburg underground system has certain components, such as manholes grates, cables, and elbows, in need of maintenance. Note that years ago, the decision was made to move away from low voltage network secondary systems in St. Petersburg. As a result, the former network infrastructure was broken into sections, essentially removing the grid, and leaving primarily spot networks. (Note - St. Petersburg does have a few unique locations where secondary network load remains and is supplied by transformers from a single radial feed. Engineers are working to redesign these locations). The existing infrastructure consists mainly of spot network locations, and medium voltage looped systems, with customers served by a primary and reserve feeder, with an automated transfer switch (ATS), which would swap load to the reserve feeder in the event of an outage to the primary feeder.
The following list briefly describes some of the refurbishment projects either completed or on-going in the St. Petersburg underground network.
- Duke Energy recently rebuilt a 480V spot network service. Located in a walk in building vault, the spot network supply includes four new Eaton CM52 network protectors that utilize the ARMs (Arc Flash Reduction Maintenance System) that enables workers entering the vault to change the protection settings in the protector to reduce the fault clearing time and thus the arc energy in the event of a fault.

Figure 1:
Wall mounted network protector control box, used to enable the ARMS system
-
Duke Energy replaced the cables that supply a large sporting complex. Note that during the larger sporting events held at the sporting complex, Duke Energy Florida will station network crew members at the transformer switches, so that they are on site to assist in restoring power in the event of an outage.
-
Duke Energy Florida has repaired and replaced primary switches that were identified as requiring an upgrade through inspection.
-
Duke Energy Florida upgraded older and deteriorating manholes and duct lines in a downtown center in anticipation of the construction of a new condominium and retail shopping center. Inspections of the existing manholes and duct lines showed the need for extensive manhole repair and for duct lines to be rerouted to accommodate the new construction.
-
Duke Energy Florida tied or networked the secondary of two radial transformers supplying significant loads, including a new condominium structure, a full block of restaurants, bars, a hotel, and concert venue, in order to provide a contingency in event of a transformer failure.
-
Duke Energy Florida is in the process of replacing many older network vault grates (see Figure 2).

Figure 2:
Rebuilt grating for network vault
- Downtown St. Petersburg has a high concentration of the medium voltage T-body connections constructed with center tap plugs that are highly susceptible to failure. The company has been replacing these components in conjunction with cable replacements, as most of the older design center plugs are associated with 1980s vintage cable systems.
ATS Switchgear SCADA Communications Refurbishment
When responding to these alarms on site, First Responders are provided with an ATS troubleshooting matrix that includes all items that should be checked. The company also has a training video for checking ATS switches.
The preferred resolution is to replace the sensors entirely with a new system.
7.4.9.4 - Duke Energy Ohio
Design
Network Rehabilitation
People
Duke Energy has a Reliability and Integrity group, focused on managing assets in to meet company performance goals, such as safety, reliability, and financial. Duke Energy has an Asset Manager within the Reliability and Integrity group, located in Charlotte, who directly supports the Dana Ave group in identifying opportunities to invest in the network assets.
The Asset Manager works closely with the Network Engineer, the Network Planning Engineer, and the Supervisor Construction and Maintenance within Dana Avenue to understand the condition of assets and identify opportunities to improve asset performance. The Asset Manager works closely with the UG Standards group, responsible for establishing specifications for network equipment. The Asset Manager also works closely with budgeting personnel to identify funds for investment in the asset base.
This group has implemented a ten year network rehabilitation plan that consists of changing out mainline cable sections, replacing PILC cables, and performing structural upgrades including rehabilitating vaults and manholes with structural deficiencies such as deteriorated roofs. Street vaults within Cincinnati have to be strong enough to support heavy equipment such as a fire trucks.
The design of the structural rehabilitation is performed either by structural engineers within the Substation group, or outsourced to engineering firms.
The rehabilitation field work is being performed by Dana Underground crews supplemented with contractor resources. Note that a few years before, Dana Avenue resources had been reassigned to other work centers to perform routine underground (non network) work. With the implementation of the ten year rehabilitation plan, Duke has returned these resources to the Dana Avenue group to support the rehabilitation efforts.
Process
Duke is in the second year of a ten year process of performing network facility rehabilitation. The driver of this rehabilitation is primarily to improve the reliability and safety of the network system.
The rehabilitation project was formulated based on an assessment of the network condition in Cincinnati. In the years prior to the implementation of the rehab project, some maintenance and rehabilitation needs had been subordinated to other investments. About three years ago, Duke Cincinnati experienced a violent failure of a network protector. From this, the Duke Reliability and Integrity group, together with the Dana Avenue leadership, the Network Engineer and Planning Engineer, met to develop a plan to rehabilitate aging and deteriorating facilities in the Duke Cincinnati network.
The group began by reviewing physical statistics, and historical maintenance and rehab methodologies. Historically, little physical statistic information was kept – records were kept by exception. They had a record of where the present problems were, but were not tracking what was fixed. Equipment replacements were driven primarily by load requirements, or equipment failure. . There was no primary cable replacement program in place; however, there was a network secondary cable replacement program underway. In addition, a review of past practices revealed that there was a limited pool of spare equipment in the event of a component failure.
The group (The Asset Manager, Dana Ave Supervisor, Network Engineer and Network Planning Engineer) began by establishing a pool of spare equipment – 10% of every type of network equipment installed. The group also gathered statistics on installed infrastructure, revealing that about 60% of the installed plant was beyond its useful life.
Using records / findings from inspections, the group implemented replacement of the equipment in the poorest condition, focusing on replacement of badly rusted or leaking transformers, and the oldest network protectors. (In the past two years, Duke has replaced approximately 24 network transformers). Historically, Duke had performed dielectric strength tests every four years. They are considering expanding this testing to better identify unseen problems.
From their analysis, Duke has implemented a ten year rehabilitation plan that includes replacement of mainline cable sections, replacement of PILC cables, assuring optimum transformer capacity in the network, rehab of network protectors with implementation of electronic relays, and performance of structural upgrades in deteriorated manholes and vaults.
Duke performs vault inspections 4 times a year, and manhole inspections every six years. Part of these field inspections includes identifying any structural or other potential civil deficiencies.
Duke will revisit the suspect manholes with either an in house civil expert or an external civil contractor to assess the civil condition and structural integrity of the manhole to identify high priority candidates for rebuild.
If it is determined that structural repairs must be made to the roof, Duke UG crews will build a temporary roof above their electrical facilities in the vault, but below the actual roof so that their facilities are protected from any debris that may fall during roof rehabilitation.

Figure 1:
Temporary Roof

Figure 2:
Temporary Roof (notice top of temp roof in red)
Note that while they are making the civil repairs, (and have the roads blocked off, etc) Duke will also perform an electrical rehab of the manhole facilities. For example, they will replace all of the lead cables in the manhole with poly cable.
Technology

Figure 3:
Installation of new manhole around existing facilities (note two sections of manhole bottom)

Figure 4:
7.4.9.5 - Energex
Planning
Network Rehabilitation
(Network Underground Refurbishment)
People
Refurbishment of the underground network is the responsibility of the Network Capital Strategy and Planning Group, part of the Asset Management organization. The Network Capital Strategy and Planning Group is led by a group manager.
Once every five years, Energex approaches their regulator with their investment plans, including investments in system refurbishment driven by their Conditioned Based Reliability Maintenance (CRBM program). Funding for Refurbishment and Replacement of equipment is approved and allocated by the Australian Electric Management Council (AEMC).
Process
Energex is coming up on its next round of regulatory funding and will seek approval for further underground network refurbishment. Based on its CBRM analyses, field tests, equipment failures, and safety and operation issues, it has determined it should replace obsolete relays with microprocessor based relays, replace gas filled transmission cables, replace oil circuit breakers with gas insulated breakers, rehabilitate the pit and duct system in the Central Business District, and replace oil switches with vacuum switches in the underground network.
Much of the planned or recommended refurbishment within the CBD depends on the approval of the Australian Management Electric Council (AEMC) when Energex’s five-year review comes due.
(See Asset Management in this report)
Technology
Energex uses Condition Based Risk Management System (CBRM) software from EA Technology to track the health and condition of assets throughout the underground network system. The system assigns a health index and risk score for all the assets in each class, such as circuit breakers, diagnostic tests of transformers, etc. Length of time in service and any refurbishment work is also input. The system can score assets based on aging mechanisms to predict the potential end-of-life of some components. Actual refurbishment and replacement work is driven by the calculated health scores.
7.4.9.6 - Georgia Power
Design
Network Rehabilitation
(Network Revitalization)
Background
The city of Atlanta, unlike many North American cities, has never seen a decline in population or density in the modern era. The network underground system in place now has grown from the original network installed at the turn of the 20th century, with improvements, upgrades, and maintenance continuous throughout the life of the network. Network engineers and designers have retained all original network maps wherever possible, and the originals are housed in a separate map room at Georgia Power. Updated, hardcopy maps are stored in the map room as well. Georgia Power has also scanned and converted to raster images all maps and stores them in its GIS system (ESRI).
The city of Savannah has proved challenging, as it is actually expanding its business district through the rehabilitation of historic buildings to small shops and condominiums. Georgia Power is upgrading the network there but must be mindful of the national historic district and limitations that imposes for new transformer placement, vault construction, and any other structural modifications.
It is notable that Georgia Power is not actively shrinking its networks. In fact, the company is on track to complete a new network in the Buckhead area of metro Atlanta and is proposing a plan for adding a network at the Port of Savannah. Note that the loading on the secondary network grid in Atlanta is declining, but that Georgia Power is using more spot networks than in the past to serve some customers.
People
The Network Underground Engineering group, in consultation with Area Planning engineers, and the Network UG Manager are responsible for making investment decisions based on their analyses of the implications of forecasted load on the system and conditions of assets in the field. Local distribution planning for the network underground infrastructure at Georgia Power is the responsibility of the engineering group within the Underground Division. The Underground Division is led by a Manager and consists of both engineering and construction resources responsible for the network infrastructure.
Decisions about investment in network equipment such as transformers and network protectors are the responsibility of Network Engineering group, and are based on equipment condition as determined through inspection and maintenance findings. This group reports organizationally to the Network UG Manager.
Network Operations and Reliability is comprised of both the field resources (field inspectors and field test engineers) that perform network equipment inspections and conduct network equipment maintenance, and the engineering resources that analyze the information from the inspection activity and make decisions whether to repair or replace network equipment based on the findings.
(See Attachment A for sample manhole inspection form.)
Decisions about investment in maintenance or repairs of structures such as manholes, transformers, or duct banks are the responsibility of engineers for civil, network, and structural design within the Network Underground group. This group is responsible for determining inspection approaches for structures, and for developing strategies for responding to inspection findings. In addition, this group develops standards for structure design and repair.
Projects of $2 million or less are brought before the Regional Distribution Council for approval. Any projects that require more funding are sent to the vice president of the Network Underground group and upper management for review and funding approvals.
Process
Georgia Power has a number of on-going wholesale network revitalization projects in the works, including the following:
- Georgia Power is in the process of replacing older network protectors with either new units or refurbishing protectors in the field by replacing electromechanical relays with microprocessor relays. The network protector replacement initiative is being performed in tandem with the Georgia Power three-year network protector inspection cycle. When the inspection team finds a protector that is old (such as a CM-1) or needs to be upgraded with a microprocessor relay, they perform the upgrade during the field inspection whenever possible. Although this may slow the inspection crews down in their maintenance schedule, Georgia Power has stayed on track in its inspections and has found this practice the most cost-effective and expedient means for performing the upgrades and replacements.
The network protector inspectors are called Test Technicians who are non-degreed employees usually drawn from the ranks of Senior Cable Splicers.
-
Georgia Power is replacing all porcelain pot heads identified during its routine, planned vault inspections
-
Georgia power is also replacing older equipment that is part of the network SCADA (remote monitoring and control) with new, solid state equipment. Where necessary, the connection to the Network Operations center is being upgraded as well. Fiber is the preferred connection, but in some areas this is not a possibility, particularly in older vaults.
-
Georgia Power completed vault inspections and found a number of brick roof vaults that were deteriorating. The company decided to proactively replace all brick roof vaults with solid concrete rather than fix or repair old ceilings.
-
Georgia Power is in the process of replacing standard manhole covers with a SWIVELOC design (See Figure 1). These manhole covers are intended to resist ejection during a fire or explosion inside the manhole. They include a latching mechanism which allows the cover to lift several inches to allow venting of sudden pressure, but does not allow it to fly off unrestrained. (See Figure 2) The replacement effort is prioritized with manholes containing secondary conductors being retrofitted first. This is a multi-million dollar project. Estimated duration of the project is five years.

Figure 1:
SWIVELOC Installation

Figure 2:
SWIVELOC – underside of cover
-
The Savannah network is undergoing significant upgrades in addition to consideration of a new network at the Port of Savannah. Georgia Power is making network protector improvements, upgrading or replacing fuse boxes, replacing some disconnects between the network bus and protectors, and retrofitting network transformers located within vaults inside buildings, with FR3 coolant [1] . Note that all new transformers utilize FR3 fluid, as this new specification was adopted company - wide (GPC).
-
Older transformers are being replaced as warranted as part of Georgia Power’s routine inspections. When a field inspector finds a transformer that is a candidate for replacement, it is brought to the attention of the network design group. Georgia Power’s network transformer standard conforms with IEEE C57.12.40, (IEEE standard for Network, Three-Phase Transformers, 2500kVA and Smaller, High Voltage, 34 500 GrdY/19 920 and Below, Low Voltage, 600V and Below, Subway and Vault Types (Liquid Immersed)). In addition, Georgia power calls for: 1) transformers are welded onto metal rails to make them easier to pick up with a fork lift and to keep them off the vault floors (See Figure 3 and 2) every transformer is specified with phasing tubes on top to test for phase identification in the transformer (“Phasing Tubes” enable an operator to insert robes into a deenergized unit (See Figure 4). They can then put a signal on the cable and use signal detection to determine phasing.)

Figure 3:
New transformer – note rails welded to transformer bottom

Figure 4:
Transformer – phasing tubes
- Georgia Power is selectively replacing lead cables with EPR. However, unlike many utilities, Georgia Power is maintaining lead wherever possible. The engineers find it reliable, cost-effective and easier to work with in confined manholes and vaults where there is limited space for the larger Y-splices required for EPR cables.
Technology
The company uses its GIS system to track inspections and flag any repairs that are needed. On-going, long-term projects such as SWIVELOC manhole replacements are tracked by spreadsheet and input into GIS.
[1] Envirotemp™ FR3™ fluid is a fire resistant natural ester dielectric coolant specifically formulated for use in distribution and power transformers. Envirotemp™ and FR3™ are licensed trademarks of Cargill, Incorporated. http://www.cargill.com/products/industrial/dielectric-ester-fluids/envirotemp-fr3/index.jsp
7.4.9.7 - PG&E
Design
Network Rehabilitation
Transformer Replacement Program
People
In 2009, PG&E instituted a program to replace underground network transformers, with the prioritization based on the results of the transformer oil sampling program.
Replacement of transformers and their associated network protectors is undertaken by the PG&E’s General Construction Department, using both internal PG&E resources and external contractors.
Civil work, including vault construction is performed by PG&E’s General Constructions Gas Department. The vault construction is not typically precast concrete due to the physical constraints in the downtown areas of Oakland and San Francisco.
Process
The majority of PG&E’s current underground network transformers were replaced during the 1980s with non-PCB (polychlorinated biphenyl) types as part of the PCB replacement program. This means that virtually all the transformers on the current PG&E distribution network are 1980s vintage.
In 2009 PG&E instituted a program to replace underground network transformers. The prioritization of units to be replaced is based on the results of the transformer oil sampling program. Replaced units are replaced with new, rather than refurbished transformers.
Note: In 2009 PG&E replaced 20 units with refurbished units, but found that refurbished units had certain drawback, namely:
- The cores, windings and paper insulation are from an existing unit and therefore, the life expectancy is less than it would be for a new unit.
- There is little flexibility in timing of removal and installation since the only source remaining for the refurbished units are those that are already in service.
As part of the replacement of the network transformers, the program project will replace the associated network protectors (NP’s). (Note that the 1980s program to change transformers as part of the PCB replacement program did not involve NP’s. As a result, PG&E currently has some network protectors, which have been in service since the 1950’s and 1960’s.) By replacing the network protector at the same location where the transformer is being replaced, PG&E will capture significant labor and operating efficiency by replacing both units at once. Also, the fact that a transformer is being replaced is an indication that associated equipment may be nearing the end of its service life. The loading, age, and exposure to environmental conditions of the transformer reflect directly on the associated network protector.
In some instances, network protectors may have already been replaced at some point in the recent past. If the project manager identifies network protectors that have been replaced, an alternate protector will be selected.
In 2010 PG&E anticipates replacing 29 transformer units and their corresponding “throat mounted” network protectors. Next year, 2011, they expect to replace 67 units (30 regular & 37 high-rise. (See High-Rise Replacement Program).
Technology
The current transformers on the PG&E underground network are of a three (3) chamber design. PG&E’s transformer replacement program will transition to a single oil tank design (filled with natural ester - Envirotemp® FR3™) coupled with a stand alone G&W vacuum switch mounted on the wall of the vault.
The reason for the change in design is that in the legacy design the smaller tanks (primary and ground switch) contain a limited amount of oil (25 – 30 gallons). A failure in these tanks is more likely to lead to a vaporization of the oil, and the potential for a catastrophic explosion to occur. PG&E has therefore decided to implement a single main tank design in order to mitigate the potential of a catastrophic explosion occurring in any of its transformers.
PG&E is using throat mounted network protectors. (Eaton CM52, CM22 models, Richard Manufacturing 137NP, 313NP models.)
7.4.9.8 - References
EPRI Underground Distribution Systems Reference Book (Bronze Book)
7.4.9.9 - Survey Results
Survey Results
Design
Network Rehabilitation
Survey Questions taken from 2018 survey results - Asset Management
Question 26 : Are you implementing targeted replacement programs for any of the following equipment?


Question 27 : If Yes, are any of your replacement programs Aged based, such as replacing all transformers >50 years old?


Question 28 : If Yes (to question 26), are any of your replacement programs Design based, such as replacing all high rise fluid filled transformers with dry type units, or replacing a certain type of cable?


Survey Questions taken from 2015 survey results - Design
Question 77 : Do you have any additional network “system hardening” initiatives underway?


Survey Questions taken from 2012 survey results - Planning and Maintenance
Question 3.13 : Do you have any network “system hardening” initiatives underway?

Question 6.32 : Are you currently implementing replacement programs for any of your network equipment?

Question 6.33 : If Yes, Please indicate which equipment is being replaced.


Survey Questions taken from 2009 survey results - Planning and Maintenance
Question 3.9 : Do you have any network “system hardening” initiatives underway?

Question 6.38 : Are you currently implementing replacement programs for any of your network equipment?

Question 6.39 : If Yes, Please indicate which equipment is being replaced.


7.4.10 - Network Reliability
7.4.10.1 - Con Edison - Consolidated Edison
Design
Network Reliability
(Network Reliability Index)
People
Organization
Central Engineering - Responsibilities include Civil / Mechanical Engineering, Control Systems Engineering, Design Engineering, Electrical Engineering, Equipment and Field Engineering, and Environmental Engineering & Program Support.
Employee Development
Engineering and Planning - Responsibilities include Energy Services, Distribution Engineering, Operations Services, Marketing and Sales, Planning and Analysis, and D.C. Elimination.
Con Edison invests in developing its design employees through three distinct programs focused on employee development. One program is focused on the development of newer engineering employees, another at incumbent employees, and the third at bargaining unit employees who are entering the management ranks. The programs are described more fully on page 3-53 of this report. Note that these programs are not limited to design employees, but are available to all employees who qualify.
Process
Network Reliability Index
Con Edison calculates a Network Reliability Index (NRI) to rank networks by reliability, to rank the feeders within each network by reliability, and to prioritize reliability improvements.
The utility started to develop the NRI program about 10 years ago. The NRI index is calculated using a probabilistic approach that is based on loading information gathered from their remote monitoring system, physical information such as transformer age and the presence of stop joints, and historic data such as average wet bulb and dry bulb temperature variables. The algorithm looks at 11 components and 3 temperature variables. Some other factors considered include failure rates for different temperatures and different load factors, load flow information from Con Edison’s PVL load flow system, circuit age, feeder ratings, and shift factor and pick-up factors of load from adjacent feeders.
Con Edison runs the NRI simulation for 20 years to predict the probability of a network to be in jeopardy of a failure, and what feeders may contribute to the jeopardy condition. The targeted reliability performance is for a network to experience no more than one failure in 1000 years (which is one network shutdown in 20 years systemwide). The NRI basis is that having any four related feeders out of service at one time in heat wave conditions and places a network in jeopardy.
The NRI ranking is used to prioritize investments in reliability improvement. Con Edison has a 10-year, $370 million program under way to improve the reliability of the distribution system (excluding substations.)
Some of the approaches the utility uses to improve reliability include:
-
Con Edison’s plan is to stop expanding the low-voltage network and begin feeding more customers from spot networks. For example, new customers with demands as low as 300 kW may be fed from spot networks in the future. In situations where Con Edison knows the system has secondary overloads, the utility will move customers to the primary. Their goal is to limit the exposure of the secondary network.
-
Con Edison has an initiative under way to reduce the size of networks by splitting the load of a given network into two distinct networks. The utility has targeted six networks for size reductions.
-
Con Edison has a program under way to change out paper and lead cables (primary) with Ethylene Propylene Rubber (EPR) cable, the current cable standard.
-
Con Edison is adding submersible s ulfur hexafluoride (SF 6 ) switches to the underground (UG) network in areas where the utility has bifurcated feeders. This addition will enable them to sectionalize between the bifurcated circuit sections.
7.4.10.2 - HECO - The Hawaiian Electric Company
Design
Network Reliability
Reliability Improvement Initiative – Replacing manual switches
People
The HECO T&D Division has implemented a program to replace manual throw-over switches with automatic throw-over switches to improve customer reliability.
Process
HECO provides dual primary feeds to customers in order to provide N-1 reliability. In many locations, these dual feeds are designed with a manually operated throw over switch. HECO has analyzed their historic reliability performance and has concluded that the time that it takes to dispatch a Primary Trouble Man (PTM) to operate the manual throw over switch contributes significantly to their system CAIDI[1] , particularly in certain locations, such as residential subdivisions, where many customers may be affected.
Consequently, HECO has implemented a plan to change out manual switches with automatic throw over switches in selected locations in order to improve system CAIDI.
[1] CAIDI, the Customer Average Interruption Duration Index, is an industry accepted reliability measure of outage duration.
7.4.10.3 - AEP - Ohio
Design
Network Reliability
People
Investment decisions for network equipment such as transformers and network protectors for improved and sustained reliability for AEP Ohio are the responsibility of the Network Engineers, which is part of the Network Engineering group. This group, led by the Network Engineering Supervisor, is responsible for all aspects of network design including reliability for AEP Ohio, and provides consultative support to the other AEP operating companies. Investment decisions to support network reliability are made at the AEP Ohio management level with recommendations from the network engineering group.
Investment decisions to support network reliability are also discussed at theThe Network Standards Committee, is an AEP wide committee that holds regular teleconference sessions on network findings, “lessons learned” in the field, and discusses potential network engineering solutions to common network design and reliability issues. For example, after manhole fires occurred at several locations across the AEP system that were found to be due to deteriorated Styrene Butyl secondary cable, the Network Standards Committee developed a recommended companywide response that included the decision to implement a replacement program and the selection of a suitable replacement cable (see Network Revitalization ).
Process
Network Engineers, working with the parent company, AEP, keep detailed information on network and cable loads to make certain the system has enough capacity to serve its customers. The network systems in AEP Ohio, designed to either an N-1 or, as in Columbus, a full N-2 configuration, have been highly reliable with only one outage to network customers in the past thirty years. Reliability is, in effect, “baked in” to the AEP network designs that are planned for contingencies as specified in the corporate Network Planning Criteria guide.
Load forecasts and service forecasts are maintained by the Network Engineers in conjunction with the AEP Distribution Planning group. Working together, they forecast load and circuit requirements for up to ten years. If any new, significant loads are anticipated on the AEP Ohio network that may affect reliability of the system, the Network Engineering group works with the Distribution planners for increased capacity.
Duct line configurations for feeders are very standardized, as is cable racking within vaults and manholes. Duct lines are concrete encased. AEP design guidelines include other strategies to preserve reliability, including sourcing no more than two feeders supplying any one network off of a given bus section at the station or through any given station exit, and implementing designs that attempt physically separate electric facilities to assure contingency operations. For example, for N-2 areas, AEP designs systems to have no more than two network feeders on the same network installed within common duct banks, manholes, or transformer vaults. For N-1 systems, designs assure that the loss of any single duct bank and/or its manholes or vaults causes no outage to any network customer.
AEP uses arc proof tapes on all network primary cables inside of manholes and transformer vaults, as well as any non-network feeders that pass through a network manhole of vault.
The Network Underground group has developing standards for new networks, as well as upgrading its existing network, for a more uniform and reliable system.
Technology
AEP is in the process of establishing Operations center monitoring of its Canton network. This system will utilize the company’s dual-loop, redundant fiber-optic SCADA communications network. Note that AEP is in the process of updating its network remote monitoring system.
7.4.10.4 - Ameren Missouri
Design
Network Reliability
People
Ongoing network reliability is the responsibility of multiple individuals at Ameren Missouri, including both Energy Delivery Technical Services and Energy Delivery Distribution Services.
Historically, Ameren Missouri focused much of its reliability improvement activity on their radial system. The network system, because of its inherent reliability, hasn’t historically garnered the same attention. Recently, however, Ameren Missouri has ramped up its focus on network system reliability through the formation of the Underground Revitalization Department.
The Underground Revitalization Department focuses on researching, evaluating, and developing plans for performing capital improvements to and revitalizing downtown St. Louis, including the network. Part of this group’s role includes addressing issues such as the development and update of planning criteria for the network, development of a cable replacement strategy, development of a network transformer testing and replacement strategy, development of route diversity criteria, development of the criteria for manhole covers, and a criterion for conduit system replacement. All of these efforts are aimed at preserving the high levels of reliability supplied by their network infrastructure.
Local distribution planning is responsible for making investment decisions based on their analyses of the implications of forecasted load on the system. Local distribution planning of both the network and non-network underground infrastructure in St. Louis is the responsibility of the engineering group within the Underground Division. This Center is led by manager, and consists of both engineering and construction resources responsible for the downtown infrastructure. Organizationally, the Underground Division is part of Energy Delivery Distribution Services, reporting to a VP.
Investment decisions for network equipment such as transformers and network protectors are based on equipment condition determined through inspection and maintenance findings. They are the responsibility of Distribution Operations. The Distribution Operations Group, led by a manager, reports organizationally to the Vice President of Energy Delivery Distribution Services. Distribution Operations is comprised of both the field resources (Distribution Service Testers) who perform network equipment inspections and conduct network equipment maintenance, and the engineering resources who analyze the information from the inspection activity and make decisions of whether to repair or replace network equipment based on the findings.
Investment decisions concerning maintenance or repairs of structures such as manholes, faults, or duct banks are the responsibility of engineers responsible for civil and structural design within Energy Delivery Technical Services. This group is responsible for determining the inspection approach to structures, and for developing strategies for responding to findings. In addition, this group develops standards for structure design and repair. As an example, this group was responsible for changing Ameren Missouri’s vault standard to include requirements such as a thicker ceiling to meet a traffic rating requirement, and using larger grate openings.
Process
An example of a reliability driven strategy under development by the downtown St. Louis Underground Revitalization Department team is the development of transformer replacement criteria for evaluating, managing, and prioritizing replacement of both network and radial transformers within downtown St, Louis. This is based on key considerations such as the transformer type, historic performance, age, oil quality, condition, and physical location.
This strategy includes implementing routine oil testing, and inspections aimed at identifying and recording equipment condition information used to determine when replacements are required. The criteria also include a Network Transformer Replacement Scorecard used by inspectors to score the relative severity of non – field repairable issues. Information is entered into a data base which is used to analyze, rank and prioritize transformer replacements.
The Underground Revitalization Department is developing other strategies to address network system reliability including route diversity, sectionalizing, application of distribution automation and SCADA to the network, inspection and maintenance approaches, cable diagnostic approaches, cable replacement strategies, and civil issues such as manhole covers and conduit systems.
7.4.10.5 - CEI - The Illuminating Company
Design
Network Reliability
People
Within the Regional Engineering department, CEI has a group that is focused on reliability and power quality (Reliability Group). The group is comprised of 11 people who focus on reliability performance improvement and reporting for the Illuminating Company (overhead and underground system performance). The Reliability group works closely with Underground Group.
CEI’s Asset Management resources also focus on reliability improvement and employ Circuit Reliability Coordinators (CRCs) who perform circuit inspections based on reliability performance (See “Asset Management” - People ). Because underground feeders tend to perform more reliably than overhead feeders, the main focus of these coordinators is on the overhead portion of the distribution system.
The Underground group is the group with the main focus on the reliability performance of the underground ducted manhole distribution system (network and non – network). This group performs diagnostic testing, preventive and corrective maintenance activities, and system reinforcement (programs discussed more fully in the Maintenance and Operation section of this report).
Process
The Reliability group is responsible for all internal and external reliability reporting such as regulatory required reports for PUCO. In general, Asset Management (asset management resources within the Engineering Services group) analyzes the results of reliability inspections and provides information to the Reliability group for Reporting.
The main reliability metric used by CEI is SAIDI (System Average Interruption Duration Index). The Reliability group periodically produces a SAIDI ranking of distribution circuits. This ranking includes all circuits whether overhead or underground.
The Reliability group tracks and analyzes outages on the system on a daily basis. They produce an inoperable equipment list, which is a daily summary of the circuits / circuit sections that are out of service. The Reliability group will advise the Underground group of whether the repairs to the inoperable equipment should be handled as an emergency or not.
In general, the distribution system, overhead and underground, is inspected on a five year cycle. The Underground group performs the inspections of the underground ducted manhole system, with manholes inspected and maintained on a five year cycle.
Padmounted equipment is visually inspected externally on a five year cycle, and opened up for an internal inspection on a 15 year cycle. The Underground group is not responsible for the inspection of pad-mounted equipment. Pad-mounted equipment inspections are performed by the Electrical Services group, who work with overhead and URD facilities.
The Underground group is performing proactive cable diagnostic testing on both lead and hybrid (lead and EPR cable) feeders. They test about forty feeders per year. Ideally, they would like to test one fifth of the system per year (about 240 Feeders) but resource constraints have limited them to 40/yr.
The responsibility for reporting, analyzing and correcting the findings from the underground inspections lies with the Underground Group.
This differs from how the results from overhead inspections are being treated at CEI. Overhead circuits are being visually inspected on a 5 year cycle. Also, the Regional Circuit Reliability Coordinators are visually inspecting additional overhead circuits driven by reliability improvement. The data from both surveys is being collected, analyzed by Asset Management (asset management resources within the Engineering Services group) and forwarded to the Reliability group for reporting. Circuits are priority ranked, one through five, with the urgency of repair tied to the ranking. For example, a priority one circuit may represent a safety issue, is of the highest priority, and is fixed right away. A priority two issue is addressed in 30 – 90 days, and so on.
Underground feeders are not being inspected by the CRC’s as the circuits the CRC’s are inspecting are driven by reliability performance (based on SAIDI) and the UG circuits are generally more reliable. In addition, it would be impractical for CRC’s to conduct these inspections because of the particular skills associated with manhole entry and the diagnosis of underground equipment. However, the Underground department is performing a similar priority ranking when performing manhole inspections, with the priority assessment based on the judgment of the inspectors. The priority is utilized in scheduling the repair or construction [1] .
In years past CEI has budgeted funds to proactively replace lead cable with EPR cables. However, they currently do not have a proactive lead cable replacement program in place. They are investing in replacing older oil filled cable terminations (Spreaders), which have had a history of leaking and failing.
Technology
CEI is using basic Microsoft office products (Word, Excel) to produce reliability reports.
[1] An opportunity for CEI would be to channel the results of the underground inspection to the asset management resources within the Engineering Services group so that their analysis and the subsequent reporting of the Reliability group include underground statistics.
7.4.10.6 - Duke Energy Florida
Design
Network Reliability
People
Reliability management is the responsibility of the Network Planning group at Duke Energy Florida, which is organizationally part of the Power Quality, Reliability, and Integrity Group (PQR&I), led by a Director of PQR&I for Duke Energy Florida.
To perform planning and reliability management work, the group divides the Duke Energy Florida territory into four separate zones. The cities of Clearwater and St. Petersburg, part of the South Coastal Region, are included in one of the four zones. Every zone is assigned a Lead Planning Engineer and Senior Planning Engineer, who are responsible for all distribution planning activities within the zone.
Engineers/Planners in these zones work on Reliability as well as Planning. Because Duke Energy Florida has seen minimal capacity demand growth in its urban underground grid, Engineers in the PQR&I group spend much of their time planning reliability and infrastructure upgrades.
All Planners have four-year degrees in Electrical Engineering, a requirement for the position.
Process
Because of the inherently reliable nature of the network design, and because their network system has been well maintained, Duke Energy Florida has not experienced major reliability problems. They also have not experienced power quality complaints from customers in their network.
Duke Energy Florida does have a hardening effort underway which includes replacement and upgrades of network infrastructure, such as replacing oil switches with solid dielectric vacuum switches, rebuilding deteriorated vault roofs and grates, and replacing cable and components that are aging or with which they have experienced performance issues.
Duke Energy Florida does have a remote monitoring system installed and is collecting asset data. Some of this information, such as frequent network protector operations, is used by the Network Group as a trigger for action. Other information, such as network transformer data, is being collected, but is not yet being used to trigger action. Duke Energy Florida’s goal is to expand the use of condition based analytics.
Technology
Duke Energy Florida has installed remote monitoring in its vaults. It uses a Qualitrol system to monitor information such as transformer oil level and temperature, and the status of the Oil Minder system. It uses the Eaton VaultGard system to aggregate information from the protector relay, such as voltage, current, protector position, etc. VaultGard also aggregates information from the Qualitrol system. Information is communicated from the VaultGard collection box via cellular communications by Sensus, a third party aggregator of information.
In the Duke Energy Florida design for spot network services within building vaults, the network system ground is separate from the building ground.
7.4.10.7 - Duke Energy Ohio
Design
Network Reliability
People
Duke Energy has an Asset Management organization that includes a group referred to as Reliability and Integrity (R & I) Planning. Within this group (R & I) there are resources focused on distribution integrity, looking at such things as inspection and maintenance approaches for assets of different type, and resources focused on reliability performance. This group is centered in Charlotte, with two resources, one Integrity resource and one Reliability resources focused on supporting Duke Energy Ohio, as well as other areas of the company.
The Asset Manager for Reliability collaborates closely with the network planning engineer (Part of the Distribution Planning organization), the network Project Engineer, Dana Avenue construction supervisors, and the Asset Manager for Distribution Integrity. In addition, the Asset Management group works closely with the standards department.
Process
The Dana Avenue underground group is focused on several initiatives to improve the reliability and integrity of the network system, including mainline change outs, PILC replacement, manhole refurbishment and structural upgrades. Much of this work is being done as part of a 10 year rehabilitation project underway at Duke Energy Ohio. (See Network Rehabilitation).
Duke Energy Ohio’s design criteria include considerations to assure continued system reliability. Examples include supplying only one feeder per network off of a given bus at the network substation, limiting the number of primary feeders in anyone vault or manhole to three or less in new installations, using arcproof tape to fire protect components, and actively identifying and mitigating high-risk areas. An example cited by Duke was a relocation of part of a substation to minimize the risk of flooding, performed in conjunction with a Department of Transportation project.
7.4.10.8 - Energex
Planning
Network Reliability
People
Reliability is the responsibility of the Network Capital Strategy and Planning Group, part of the Asset Management organization. The Network Capital Strategy and Planning Group is led by a group manager.
Process
For the ten past the years, Energex has been investing in improving the reliability of the distribution system, including the infrastructure supplying the CBD. About ten years ago, Energex was experiencing about five outages per 100 km on its 11 kV distribution system. Through a targeted program to improve their reliability, they have improved their performance significantly.
Strategies Energex has employed to improve reliability in their CBD include the following:
-
Changed from compression to shear bolts for splice connections.
-
Resolved issues associated with certain epoxies used in cable joints.
-
Cable replacement.
-
Addressed workmanship quality issues associated with joint preparation - both Energex employees and contractors.
-
Established acceptable outage rates for each outage class, and defined actions to be taken when rates are exceeded.
-
Established a protocol for maintenance for UG assets, including the establishment of priorities for correction of identified deficiencies.
-
Established a heath index and risk score for all asset classes.
One challenge Energex faces in improving reliability is that it uses two classes of jointers (the job classification at Energex responsible for preparing cable joints and terminations) — one class for distribution and one class used for working with underground networks. Each work classification has its own set of joint standards. Furthermore, much of the work done outside the CBD is performed by contractors. In addressing issues such as workmanship, Energex must address these varied groups.
Another challenge faced by Energex management is that based on the recent strong reliability performance, the regulator is likely to relax reliability targets to levels experienced in 2009 and 2010. This relaxation in targets may affect Energex’s ability to obtain funding for continued attention to maintenance at current levels.
Technology
Energex uses Condition Based Risk Management System (CBRM) software from EA Technology to track the health and condition of assets throughout the underground system. The system assigns a health index and risk score for all the assets in each class, such as circuit breakers, transformers, etc. Length of time in service, test results, acceptable outage rates, and any refurbishment work is input into the system. The system can “score” some assets based on aging mechanisms housed within the system that can be used to predict potential end-of-life. Actual refurbishment and replacement work is driven by the calculated health scores.
Normalized reliability performance in 2012/13 as reported in the Energex Distribution Annual Planning Report 2013/14-2017/18 (DAPR) is as follows:
| Normalized Reliability Performance | 2012 / 13 Actual | |
| SAIDI (mins) | CBD | 1.41 |
| Urban | 71.60 | |
| Short Rural | 156.40 | |
| SAIFI | CBD | 0.01 |
| Urban | 0.79 | |
| Short Rural | 1.53 |
7.4.10.9 - ESB Networks
Design
Network Reliability
People
Distribution planning at ESB Networks Networks, including the implementation of reliability standards, is performed by planning engineers within the Network Investment groups – responsible for planning network investments in the North and South. Organizationally, the Network Investment groups, both north and south, are part of the Asset Investment organization. In addition to the Network Investment groups, the Asset Investment organization is also comprised of a GeFneration Investment group and a Specifications group, each led by a manager. The Asset Investment group is part of Asset Management.
Planning is performed by one HV planner and four MV planners. Most of these individuals are degreed engineers, but some are “Technologists” who have developed their expertise through field experience.
Planning standards and criteria for reliability are developed jointly between the Asset Investment group and the Strategy Group, which is part of the Finance and Regulation group within Asset Management.
Process
Planners design the system to N-1, with most supplies having a “forward feed” (preferred) and a “standby feed” (reserve). The planning process involves running load flows to compare system loading to the feeder ratings and to evaluate the implications of anticipated incremental forecasted loading. Planners (engineers and technologists) model the system and perform analyses to understand anticipated requirements, including contingency studies (N-1 planning) to assure that ESB Networks can pick up customers with standby feeders within the emergency ratings of their transformers and cables (long-term cyclical overloads of no more that from 125-150 percent of rating, and short-term (emergency) loading of no more than 150-180 percent of rating). From this analysis, planners determine what reinforcement is necessary to be able to reliably serve customers in a contingency situation.
Another notable practice at ESB Networks is its cable reliability guidelines. If any cable experiences two faults, it is moved up the priority maintenance list and replaced. The cable is then forensically analyzed. ESB Networks has had problems with cable sheath corrosion due to the high concentration of salt in the air in Dublin, and it has found that cabling there needs to be strictly monitored.
Technology
For performing MV (10 and 20 kV) and for some 38-kV circuit studies, ESB Networks is using SynerGEE (GL Group). ESB Networks has tied this tool to its GIS database. For HV analyses (38 kV and 110 kV), ESB Networks uses PSS® Sincal from Siemens.
7.4.10.10 - Georgia Power
Design
Network Reliability
People
Investment decisions for network equipment such as transformers and network protectors are based on equipment condition determined through inspection and maintenance findings. Engineers in the Operations and Reliability Group of the Network Underground group are responsible for remotely monitoring the network system, and for performing inspection and maintenance of network assets. The Network Operations and Reliability group is comprised of both field resources (network field engineers, inspectors, and maintenance crews) that perform network equipment inspections and conduct network equipment maintenance, and the engineering resources that analyze the information from the inspection activity and make decisions whether to repair or replace network equipment based on findings from the field.
Investment decisions concerning maintenance or repairs of structures such as manholes, vaults, or duct banks are the responsibility of engineers responsible for civil and structural design within the Network Underground Engineering group. This group is responsible for determining the inspection approach to structures, and for developing strategies for responding to findings. In addition, this group develops standards for structural design and repair.
Process
Georgia Power engineers and area planners keep detailed information on network and cable loads to make certain the system has enough capacity to serve its customers. When the system flags a network or cable segment as near 90 percent capacity, the planner and/or design engineers analyze the system, and recommend changes for increasing the capacity of the system, such as adding new transformers, conductor, or adding new networks. Georgia Power makes plans up to four years in advance to insure adequate capacity and network reliability.
In Atlanta, Georgia Power tries to limit its network size to 40MVA, although they do have some 50MVA networks.
One notable aspect of its network underground substation design is that Georgia Power designs substations that use “network only” transformers that supply bus sections that source only network feeders. All feeders supplying any one network are fed off of the same substation bus. Also, voltage is regulated at the bus using load tap changer on the transformer secondary. This design approach assures consistent voltage among feeders supplying any one network, minimizing reliability issues associated with voltage imbalance such as pumping and cycling network protectors.
Area Planners design the stations so that there is always capacity at the station to back up network feeders, as network feeders at Georgia Power have historically been designed without tie points outside the station. (Note: at the time of the immersion, Georgia Power was beginning to put normally open ties between network feeders at selected locations). So, for example, at a three station bank, where one transformer is dedicated to supplying network load, and the other two-supply, non-network load, the units that supply the non-network load would be sized with reserve capacity to back up the network load in the case of the loss of the network transformer (N-1).
Duct line configuration for feeders emanating from substations are very standardized, as is cable racking within vaults and manholes. Primary feeders are in duct line at the bottom, with secondary feeders at the top. Duct bank is concrete encased. The Network Underground group has done a good job of developing standards for new networks, as well as upgrading its existing network, for a more uniform and reliable system.
Technology
Engineers in the Operations and Reliability Group at the Georgia Power Network Underground group are responsible for remotely monitoring the network system through its SCADA system that ties into the central Distribution Control Center, making recommendations about the type and implementation of network protectors, and are the first responders in the event of trouble on the network underground system. (See Operations section in this report.)
7.4.10.11 - National Grid
Design
Network Reliability
People
Network system reliability at National Grid is the shared responsibility of both the network planners within the Distribution Planning group and the Asset Strategy and Policy group.
The Reliability Analysis and Reporting group, within Asset Strategy and Policy, reviews circuit performance across the system, including network feeders, though most of their attention is focused on the radial system. For network feeders, this group works closely with planning engineers and UG engineers to develop recommendations for improvement. This group is also responsible for generating reliability reports. .
Note that the National Grid Albany network system has been highly reliable.
Process
National Grid has recently standardized its maintenance approach to network equipment, increasing the frequency of inspection from historical practice. One driver of increasing this maintenance frequency is to assure continued system reliability. Another is to increase the frequency of being able to gather data such as loading information to perform better analysis. Because National Grid has no remote monitoring on their network system (beyond the substation feeder breaker), the only opportunity they have to gather information about the equipment, whether condition information or loading information, is during field inspections. In general, network facilities in the Albany network are well-maintained.
At the time of the practices immersion, the Distribution Planning group was developing a specific recommended strategy for upgrading the secondary network system, which includes the addition of remote monitoring, increased maintenance, and network transformer oil testing such as dissolved gas analysis. In developing this strategy, each network was studied to determine whether to keep the network, expand it, shrink it, or eliminate it. The specific investment strategy for each network will be dictated by this overarching direction. For example, remote monitoring might appropriately be implemented in networks slated for expansion, whereas this might not be considered for networks planned for elimination.
A specific study of the network secondary distribution system serving Albany was performed as part of this process. The study included an analysis of thermal and voltage limits applied to the anticipated 2015 peak loading levels during normal, single and double contingency conditions. In addition this study analyzed the expected performance of the secondary network system for solid faults on secondary cables. Recommendations from this analysis include specific system reinforcements to meet anticipated peak loading levels and the application of cable limiters on each end of secondary mains and at secondary junctions.
The identification of secondary network system upgrades was prompted by an analysis performed by Distribution Planning to answer the question of whether outages to secondary network system, such as certain notable outages experienced by some other utilities, could potentially occur at National Grid. The analysis concluded that yes, the underlying issues that led to those other noteworthy outages, existed at National Grid and could potentially result in outages. The project to upgrade secondary networks has been added to the National Grid corporate risk register.
Technology
National Grid is loading network protector and network transformer information into Cascade, which will serve as the asset register.
National Grid uses a system called Computapole to record maintenance and inspection information. Network protector and transformer maintenance and repair data was previously maintained locally or in AIMSS. There is ongoing corporate wide discussion as to where the data will reside in the future. It may migrate to CASCADE with substation data, or may be maintained locally. NY East is and has been retaining data locally on Microsoft Access.
National Grid utilizes a prioritization decision support matrix that is used to determine project risk by weighing the anticipated probability and consequence of a particular event occurring. For example, an asset failure could be scored based on the probability or time to failure, and the consequences if indeed that asset would fail.
National Grid is piloting the implementation of remote monitoring in their network systems in their Buffalo, NY network.
7.4.10.12 - PG&E
Design
Network Reliability
People
Network system reliability at PG&E is a shared responsibility among the asset managers and planning engineers responsible for network infrastructure.
PG&E has effectively implemented an asset management process for network equipment. They have assigned a specific person as the “Manager of Networks”, part of the Distribution Engineering and Mapping organization. This asset manager is responsible for determining the investment, maintenance and replacement strategies for network assets including network transformers, network switches, and network protectors.
PG&E also has an asset manager called the Underground Cable Program Manager responsible for determining the investment, maintenance and replacement strategies for cable and cable systems. This asset manager is located within the Electric Distribution Standards and Strategy organization.
The network planning engineers, part of the Planning and Reliability Department, also have accountability for assuring network system reliability in both their design and planning activities.
The manager of networks, cable experts within the Standards group, and the network planning engineers collaborate closely with one another to establish investment strategies that assure continued network system reliability.
Finally, PG&E has a Reliability Manager that focuses on overall reliability of the division (network and non – network). This manager convenes bi- annual meetings to highlight and address reliability issues with proactive maintenance and refurbishment.
Process
PG&E has developed lifecycle plans that define assets management strategies for network equipment and cables ( See Attachment A ). These plans define strategies for replacement, maintenance, safety, etc. to meet PG&E’s asset reliability performance objectives. Some examples of specific strategies are summarized below.
One example of a reliability driven design strategy is PG&E’s decision to change the network unit design from one with a transformer mounted primary switch compartment to one with a remotely located solid dielectric switch as a primary sectionalizing point. This decision was made to eliminate a potential failure point to improve the reliability of the system.
Another example of reliability driven testing strategy is the implementation of cable diagnostic testing. PG&E has implemented the use of VLF testing, and has chosen the feeders to test based on historic feeder reliability performance based on analyses performed by planning engineers.
An example of a reliability driven maintenance strategy is the performance of annual transformer oil sampling and testing to identify and resolve impending transformer failures. (See Network Transformer Maintenance / Oil Testing.)
An example of a reliability driven replacement strategy is the implementation of a program to replace oil filled transformers located in high-rise buildings with dry type transformers to mitigate the potential effects of a catastrophic failure of an oil filled transformer in a high rise location.
7.4.10.13 - Survey Results
Survey Results
Design
Network Reliability
Survey Questions taken from 2015 survey results - Summary Physical/General and Design (Question 72)
Question 46: Have you developed any reliability metrics for assessing the performance of the network system?


Survey Questions taken from 2012 survey results - Planning
Question 3.14 : Have you developed any reliability metrics for assessing the performance of the network system?

7.4.11 - Network Transformer Design
7.4.11.1 - AEP - Ohio
Design
Network Transformer Design
People
Establishing specifications for the network unit, including transformers, network protectors and the primary switch design used in the AEP Ohio networks supplying metropolitan customers in Columbus and Canton is the responsibility of the Network Engineers in collaboration with the Network Engineering Supervisor. These personnel are geographically based in downtown Columbus at AEP Ohio’s Riverside offices. The Network Engineering group reports to the AEP Network Engineering Supervisor, and is part of the Distribution services group at AEP, reporting ultimately to the AEP Vice President of Customer Services, Marketing and Distribution Services. The AEP Distribution Services group, including the Network Engineering Supervisor supports all AEP network design issues throughout its operating companies, including Texas, Indiana, Michigan, Oklahoma, and other locations.
AEP also has a Network Standards Committee, headed by the lead Network Engineering Supervisor in its downtown Columbus offices, and comprised of representatives from all AEP operating companies. This group works closely with the parent company’s Distribution Services organizations, and holds regular teleconference sessions on network findings, “lessons learned” in the field, and discusses potential network engineering solutions to common network design and implementation issues. Network protector designs used throughout the AEP service areas are regularly studied and recommendations are made through this committee.
Technology
AEP’s network unit design calls for a wall-mounted solid dielectric vacuum switch that is separate from the transformer, a submersible network transformer that can accept ESNA style (elbows or T bodies) connections, and a transformer mounted network protector (see Figures 1, 2 and 3).

Figure 1:
Primary transformer connection – T bodies

Figure 2:
Network transformer. Note that the transformer does not have a primary switch compartment

Figure 3:
Network protector mounted on network transformer
7.4.11.2 - Ameren Missouri
Design
Network Transformer Design
People
Network standards, including the standard design for the network unit, including the transformer, primary switch and network protector design, are the responsibility of the Standards Group.
This group develops both construction standards and material specifications for designs and equipment used in the network underground. These standards and specifications are used by engineers and estimators in developing network designs. Standards are available in both an online and printed book format. Updated versions of the book format version are issued every 2-3 years.
Organizationally, the Standards Group is led by a Managing Supervisor, and is part of the Distribution Planning and Asset Performance Department, part of Energy Delivery Technical Services. The group is staffed with engineers.
For the network unit standard, Standards engineers work closely with the organization responsible for network equipment testing and maintenance – the Service Test Group. Ameren Missouri has an up to date material specification for the network unit; however, the construction standard for this installation is maintained separately, and is not part of the Construction Standards Book. Ameren Missouri plans to incorporate the standard for the network unit into its Construction Standards Book.
Process
Ameren Missouri’s network unit specification calls for a subway style transformer unit with an oil filled high-voltage disconnecting and grounding switch incorporated into the unit, and a throat mounted submersible network protector.
In general, Ameren Missouri uses a two chamber design for the network transformer – one chamber for the primary termination and one chamber for the switch compartment. However, their specification does allow for the high − voltage terminal and switch chambers to be combined into one chamber provided that the bushing height is equal to the two chamber design.
Ameren Missouri is not using cathodic protection in network unit installations. However, at the time of the practices immersion, Ameren Missouri was piloting the use of sacrificial anodes in selected network unit locations to assess their efficacy.
Technology
Ameren Missouri has recently modified its transformer standard to call for a tank design that can withstand high energies from internal faults before rupturing and, in the event of a tank rupture, direct ejected fluids downward into the vault. In addition, they require an anti corrosive coating in the bottom 12 inches of the tank.
7.4.11.3 - CEI - The Illuminating Company
Design
Network Transformer Design
People
The design of the network transformers is performed by the CEI Underground / LCI group, part of the CEI Regional Engineering group, located in NRHQ (Northern Region Headquarters).
Process
FirstEnergy has an Underground Distribution Network Desing Practice guideline. (Note that CEI’s network transformer design predates the development of the FirstEnergy Underground Distribution Network Design Practice.)
Guidelines from that practice include:
-
The Network Design practice calls for a maximum design loading of 100% of the transformer nameplate rating in a first contingency.
-
Network transformers should be physically isolated from one another, either separated by a firewall or located in separate vaults.
-
Network transformers must be adequately ventilated (20 square feet of clear opening per 100kVA of transformation). As transformers are replaced or upgraded, CEI will review the ventilation of existing vaults. Also, during maintenance in a customer owner vault, CEI will check the vault ventilation system to assure it is functioning. If not, they will send a letter to the vault owner.
-
Transformers should be connected to the system using 600 amp separable connectors (elbows) in order to improve repair times.
Technology
The Network is made up of approximately 57 vaults, and includes 61 network transformers (500, 750, and 1000 kVA transformers).
7.4.11.4 - CenterPoint Energy
Design
Network Transformer Design
People
Major underground design at CenterPoint is performed by the Engineering Department contained within the Major Underground Group. The Engineering department is led by a Manager and is comprised of four main sub groups.
One sub group is a technical group that includes the engineers who design the protection schema and remote monitoring systems in the underground.
Another sub group, the Padmounts group, deals with the design of three phase pad mounted transformer installations, including three phase looped systems used to serve commercial developments, and designs that use pad mounted transformers in conjunction with pad mounted switch gear to provide high reliability service to critical customers as described in this section. This group is comprised of Engineers, Engineering Specialists, and is supplemented with contractor resources.
Another sub group focuses on vault designs, interfacing very closely with the Key Accounts Consultants (also part of Major Underground) who interface with large customers. This group, the Vaults group, is comprised of Engineers, Engineering Specialists, and is supplemented with contractor resources.
The final subgroup is one focused on distribution feeder design. The Feeders group focuses on both network and non network feeders. This group is comprised of Engineering Specialists, Engineering Technicians, and is supplemented with contractor resources.
Process
For critical three phase loads, CenterPoint’s standard design utilizes a switch in conjunction with a pad mount transformer to improve reliability.
In this design, two primary feeds are brought into pad mounted switchgear. One feeder is the “normal” feed, and the other is the “emergency feed”. The switch gear has two fused taps that feed to pad mount transformers.
For this design, the loss of any one feeder enables CenterPoint to simply switch the load to the backup feeder by opening the normally closed switch and closing the normally open switch within the switchgear. In this design, the customers can be restored before CenterPoint troubleshoots and identifies and isolates the location if the problem that caused the interruption. Thus, this design type is more reliable than the three phase loop design, which is the CenterPoint standard for non critical loads. Note that all switching of padmount transformer switches is performed by the Major Underground group.

Figure 1:
Padmounted switchgear

Figure 2:
Three phase transformer served from switchgear
Technology
Historically, CenterPoint has used live front units with this design type. However, CenterPoint is currently moving to a dead front design.
7.4.11.5 - Con Edison - Consolidated Edison
Design
Network Transformer Design
People
Organization
Central Engineering - Responsibilities include Civil / Mechanical Engineering, Control Systems Engineering, Design Engineering, Electrical Engineering, Equipment and Field Engineering, and Environmental Engineering & Program Support.
Employee Development
Con Edison invests in developing its design employees through three distinct programs focused on employee development. One program is focused on the development of newer engineering employees, another at incumbent employees, and the third at bargaining unit employees who are entering the management ranks. The programs are described more fully on page 3-53 of this report. Note that these programs are not limited to design employees, but are available to all employees who qualify.
Process
Transformer Design
Con Edison’s uses both liquid-filled submersible and dry-type above-grade transformers for network applications. Transformer tanks are made of copper-bearing carbon steel or, in some cases, stainless steel. Tanks are covered with a zinc primer and black epoxy resin. Cathodic protection is required in certain locations, where debris and/or water conditions exist. Transformer tanks are designed with a sacrificial tank so that the units can absorb the forces of a full short circuit without breaching.
Network transformers are three phase, and are connected delta-wye. Most units are sized at either 500, 1000, or 2500 kVA.
Transformers are equipped with an oil drainage valve, a liquid level indicator, thermometer with alarm contacts, a no load tap changer (in some cases), a purge valve assembly for gas filling and pressure testing, a pipe plug for oil filling and purging, and traditional markings / nameplate / identification information.
According to Con Edison, their transformer specifications are more stringent than general industry standards and the IEEE standards. For example, their transformers are designed with very low impedances. Con Edison does stress their transformers at times, but not continuously. They believe that, even though their design criterion is N-2, their system is robust enough to manage greater contingencies.
Con Edison has been adding instrumentation for its remote monitoring system to new and existing transformer installations.
Con Edison evaluates transformer loadability based in top oil/hot spot temperature and thermal time constant calculations as per ANSI standards. They require their transformers to be designed to maintaining prescribed top oil and hot spot maximum temperatures under certain levels of loading, and given assumptions of the number of contingencies (modes of operation), operating ambient temperatures, vault temperature rise, and load cycle (five types).
For example, Con Edison requires that a transformer under normal conditions (N-0) be able to be loaded to 145% of rated current indefinitely. For 208/120-V units, under normal conditions (N-0), Con Edison’s specification requires that the hot spot temperature not exceed 105°C and the top oil temp not exceed 125°C under full load.
Modes of Operation vs. Loading
-
Five different 24-hr period load cycles are considered
-
Normal: indefinitely
- 145% of rated current
-
1st Contingency: 24-hr duration, once/month
- 170% of rated current
-
2nd Contingency: 24-hr duration following 1st Contingency, once/year
- 180% of rated current
Modes of Operation vs. Max. Temp Limits
-
Normal
- 105°C max winding temperature
-
1st Contingency
- 125°C max winding temperature
-
2nd Contingency
- 150°C max winding temperature
-
Max Oil Temperature
- 125°C all modes
Con Edison’s specifications include tables that list the maximum allowable loading limits for transformers of different size and type, given the load cycle and mode of operation. This specification also provides loading limits for associated network protectors.
7.4.11.6 - Duke Energy Florida
Design
Network Transformer Design
People
Standards for network design, including the network transformer, are the responsibility of the Duke Energy Florida Standards group, which oversees all standards for distribution equipment and materials. One Engineer within the group oversees all network equipment standards for Duke Energy Florida. This engineer is an Electrical Engineer, a requirement for the engineer who specializes in Network Standards. The engineer also has a PE license, a requirement to obtain certain levels within the engineer family.
Duke Energy has a Corporate Standards committee which focuses on developing common standards throughout the Duke Energy family of companies. Across the Duke Energy family of companies, there is a core Network Group of four or five members within the broader Standards groups that assist each other and collaborate on choosing all material and specification standards for the underground network throughout the company, including Florida. This core underground team draws on members from across the Duke Energy operating companies. The Design Engineers are engaged in a Duke Energy corporate-wide process to consolidate design standards for network systems among the various Duke operating companies, due to be finalized in 2017.
Duke Energy Florida has developed network design standards, which are contained in the “Duke Energy Florida Section 29; Networks, Vaults, and Transclosures.” (See Attachment D.)
Process
The Standards engineers who focuses on network infrastructure works very closely with experts within the Network Group, including the department manager and senior network specialists. Network standards for infrastructure in Clearwater and St. Petersburg are the result of the collaboration between the Standards group and Network Group.
Technology
Duke Energy Florida uses submersible network transformers to supply network customers. Transformer sizes range from 500 to 1500 kVA wye, with most units in Clearwater being 500kVA units, and most in St. Petersburg being 750kVA units. Transformer nameplate voltage rating is 12470 GRD.Y / 7200 - 208Y/120 (see Figure 1 and 2).

Figure 1:
Network transformers – spot network location

Figure 2:
Network transformer in submersible vault
In developing their network transformer specification, Duke Energy Florida mirrored the Con Edison specification, including specifying units that are designed to eject fluids to the floor in the event of a transformer tank rupture [1] , as shown if Figure 3.

Figure 3:
GE Omega transformer rupture mechanism
Duke Energy Florida monitors network transformer and vault information in Clearwater using a system by Qualitrol. Using the Qualitrol transformer sensor module, they monitor transformer oil level and temperature, as well as the Oil Minder system associated with the vault sump pump, which can detect the presence of oil in the water and cease pump operation.
Duke Energy has recently teamed with Qualitrol to pilot an installation using a dissolved gas monitor at one transformer location. The monitor itself fits into the drain port of the transformer and is tied into the Qualitrol receiver. Their goal is to build an algorithm that considers transformer vintage, DGA results, etc., and uses that information to trigger replacement.
Duke Energy Florida is also monitoring information at the network protector using the Eaton VaultGard system (see Figure 4). VaultGard aggregates information from the Qualitrol module as well as from the network protector MCPV relay, and communicates it to Sensus, a third party, via cellular communications. Sensus provides information back to the Network Group.

Figure 4:
VaultGard and Qualitrol control boxes on vault wall
7.4.11.7 - Duke Energy Ohio
Design
Network Transformer Design
People
Network standards are the responsibility of the collaboration of the network engineer, the planning engineer, and the Dana Avenue supervision. This group uses the old Cincinnati gas and electric construction manual as a guide. Ultimately, Duke Energy will develop a common network standard across the system.
Process
A standard network transformer installation calls for the transformer itself, elbows, cable, and grounding. For network installations, to cast each stock item set up separately so that each part is ordered individually.
Technology
Duke Energy Ohio utilizes submersible type transformers in their network. They used to buy a vault type and submersible type transformers but made the decision to buy strictly the subway type as the price difference between the two types was relatively small. Duke’s standard is to install network protectors on the transformers.

Figure 1:
Network protector mounted to transformer
New network transformers with provisions for mounting a network protector are purchased in 500 kVA, 750 kVA, 1000 kVA sizes with a 216Y/125 volt secondary voltage and in 1000 kVA, 1500 kVA, 2000 kVA and 2500 kVA sizes with a 480Y/277 volt secondary voltage. Transformers are purchased as 13,200 volt delta units with a tap changer on the primary.
Because Duke has had problems with equipment deterioration due to salt contamination, their transformer design calls for a protective shield over the transformer primary termination to protect the terminations from salt and other contaminants. In selected faults they will place a fiberglass barrier over top of the network protector.

Figure 2:
Primary dead front terminations
Duke’s network transformer specification calls for submersible grade units in all network applications, with specifications meeting or exceeding IEEE standards (C57.1240).
Duke also uses 600 amp separable connector elbows to terminate the primary on the transformer.
7.4.11.8 - Georgia Power
Design
Network Transformer Design
People
Network standards, including the standard design for the network transformer and primary switch, are the responsibility of the Standards Group and the Network Underground design engineers.
Organizationally, both the design of network systems, and the development of network standards are the responsibility of engineers within the Network Underground group. These may be engineers that are part of the Network Engineering Group, or principal engineers that report directly to the Network Underground Manager.
Organizationally, the Network Underground group is a separate entity, led by the Network Underground Manager, and consisting of engineering, construction, maintenance and operations resources responsible for the network underground infrastructure, including the development of standards for network equipment.
Network design is performed by the Network Underground Engineering group, led by a manager, and comprised of Engineers (Electrical and Civil) and Technicians concerned with the planning, design, and any service issues associated with the network. The Engineers are four-year degreed positions, while Technicians have a combination of years of experience and formal education, including two-year and four-year degrees. Engineers are not represented by a collective bargaining agreement.
In addition to the engineers with in the Network Underground Engineering group, the Network Underground group has two Principal Engineers who report to the Network UG Manager. These Principal Engineers also deal with issues of network design, and are responsible for the development and maintenance of standards for network equipment. Standards are available in both an online and printed book format. Standards were first documented and codified in the 1970s, and they include what was already documented on the network from the 1940s and any new standards developed since then. It is a living document, and the responsibility of the Standards Group comprised of the Principal Engineers in the Network Underground group. The standards are divided into two main sections: civil construction and network specifications and design.
Process
Georgia Power’s standard for network transformers conforms to IEEE C57.12.40 (IEEE Standard for Network, Three-Phase Transformers, 2500kVA and smaller), with two minor modifications to the manufacturer’s specifications:
-
transformers are welded onto metal rails to keep them off the vault floors and make them easier to pick up with a fork lift
-
every transformer has phasing tubes on top to test for current in the transformer. The phasing tubes are used to trace phases before operations. All new transformer installations are filled with FR3 organic ester fluid. Common transformer sizes for units supplying their network grid systems (208V) are 500 kVA and 1000kVA, with 500kVA units being the most common. For transformers feeding spot networks at 480V the most popular sizes are 1000 and 2000kVA units. Georgia Power does have 3000kV units supplying a small 4kV network.
Georgia power’s standard allows for both transformer units with separate compartments for the primary termination chamber and primary switch, and combined, one chamber designs, which are more recently being used for units with elbow type bushings. Georgia Power is using 200A-rated elbows and bushings for the primary terminations (See Figure 1).

Figure 1:
New network transformer inventory
The transformer mounted primary switch includes open, closed, and grounded positions (See Figure 2). Georgia Power does not require a sight glass on the primary switch compartment.

Figure 2:
Network transformer primary switch handle
Transformers are tested by Test Technicians who are part of the Network Operations and Reliability group (the Testing group). The group performs a transformer turns ratio test (TTR); a Megger test; and they take an oil sample for a dielectric test. These are industry standards tests that Georgia Power performs before putting the transformer into inventory.
Georgia power mounts the protector on the transformer and performs initial protector testing as well. This testing is performed by a two person team comprised of a Cable Splicer Senior and a Cable Splicer Journeyman. Georgia Power has implemented this approach to familiarize cable splicers with the network units they’ll be working on in the field.
Note: if a transformer has been in inventory for a long time, the Testing group will do a Megger test and an oil sample test again, to make sure it is safe to operate, and ready to commission.
7.4.11.9 - HECO - The Hawaiian Electric Company
Design
Network Transformer Design
(Padmount Transformers)
People
The Technical Services Division of the Engineering Department establishes transformer specifications for HECO.
Primary Trouble Men (PTM’s) perform switching on the units.
Technology
HECO’s standard three phase transformer design has fuses, taps, and an internal primary switch to enable a HECO Primary Trouble Man to switch between a primary and alternate feed.

7.4.11.10 - National Grid
Design
Network Transformer Design
People
Network standards, including the standard design for the network transformer , are the responsibility of the Distribution Standards department, part of Distribution Engineering Services. Distribution Engineering Services is part of the Engineering organization, which is part of the Asset Management organization at National Grid. Within the Standards group, National Grid has two engineers that focus on underground standards.
National Grid has up to date standards and material specifications for network equipment, including the network transformer primary switch, network transformer and network protector. Network material specifications are updated annually. Standards are updated on a five-year cycle.

Figure 1:
Network Unit - Primary switch compartment
Note that because National Grid’s system is comprised of multiple network systems of different designs in both New York and New England, the standards book is organized with a common standards section that represents the whole company, and then individual sections that specify standards appropriate to the individual network systems that comprise their overall infrastructure.
Process
A new standard network unit at National Grid includes a submersible network transformer with a high-voltage disconnecting and grounding switch incorporated into the unit, and a throat mounted network protector. The network transformer is equipped with 600 dead front apparatus bushings for the primary cable termination onto the transformer.

Figure 2:
Network Unit - protector

Figure 3:
Network Unit
National Grid Albany does not presently install any high side interrupters. Any faults would be seen by the feeder breaker.
National Grid’s standard design for a network unit calls for it to be placed on hot dipped galvanized I-beams within the vault. National Grid uses anodes to provide corrosion protection.
Technology
Spot network vaults are equipped with a ground fault protection system designed to trip (open) all of the network protectors in the vault in the event of a ground fault. The customer is required to buy, install, and wire the National Grid approved ground fault protection system. Ground fault protection system equipment is installed in the customer’s electric room. However, a current transformer required to monitor neutral currents is installed in National Grid’s transformer vault.
7.4.11.11 - PG&E
Design
Network Transformer Design
People
Network standards, including the standard design for the network transformer and primary switch design, are the responsibility of the Manager – Distribution Networks. PG&E has assigned one individual as the Asset Manager for network equipment, including all components of the network unit. This asset manager is responsible for network equipment design standards, developing life cycle strategies for network equipment, and making capital and maintenance investment decisions for network equipment.
Technology
The current transformers on the PG&E underground network are of a three (3) chamber design. PG&E’s transformer replacement program will transition to a single oil tank design (filled with natural ester - Envirotemp® FR3™) coupled with a stand alone G&W vacuum switch mounted on the wall of the vault.
The reason for the change in design is that in the legacy design the smaller tanks (primary and ground switch) contain a limited amount of oil (25 – 30 gallons). A failure in these tanks is more likely to lead to a vaporization of the oil, and the potential for a catastrophic explosion to occur. PG&E has therefore decided to implement a single main tank design in order to mitigate the potential of a catastrophic explosion occurring in any of its transformers.
7.4.11.12 - SCL - Seattle City Light
Design
Network Transformer Design
(Network Transformers - Corrosion)
People
Organization
Network Design at SCL is performed by the Network Design Department, which is part of Energy Delivery Engineering. See Attachment A . The Network Design Department performs all planning and design of SCL’s networks.
The Network Design Department is made up of eight “System” engineers, who do all of the design for the network, and eight “Services” engineers, who interface with the customers, gather load information, coordinate construction activity, etc. The individuals in this group are four-year degreed engineers. Some have their PE licenses.
The engineers at SCL are represented by a collective bargaining agreement (IBEW, Local 17).
Process
Network Transformers — Primary Switch
SCL’s specification for network transformers calls for either a one- or two-chamber design for the transformer primary termination and switch. SCL has historically used a two-chamber design – one chamber for the terminations and one for the switch.
The two-chamber design originated with the use of Paper-Insulated Lead-Covered (PILC) cable and the need for a place to make lead wipes for the primary terminations.
SCL has stayed with the two-chamber design standard, but is currently trying out a one-chamber design, because most of their primary conductors are crosslinked polyethylene (XLP), with XLP terminations.
Their specification for a combination switch and terminal chamber requires that:
- The high-voltage bushing (listed in Section 8.2.3 e of their material specification[1] 0038.3) may not be used to support switch contacts in any way. Only flexible cable leads may be connected to the bushings.
- The switch operating handle shall be 36 to 48 inches above the ground.
- Only one set of drain valve, vent/level plug, and liquid level gauge is required (and shall be per Section 8.2.1 of material specification 0038.3)
- The single chamber shall meet all other aspects of their material specifications for terminal and switch chambers (Sections 8.2.1, 8.2.2, and 8.2.3 of their specification 0038.3).
- The viewing window shall be large enough to see the bottom of the bushings in oil.
[1] SCL’s material specifications can be accessed at seattle.gov .
Network Transformers — Corrosion
SCL’s transformer specification conforms to ANSI standards (C57 12.40), and calls for a corrosion-resistant steel tank (5/12 inches thick with ½ inch cover and bottom). SCL does have some corrosion challenges with some transformers that are located near the waterfront. They have considered purchasing transformers with stainless steel tanks for these locations, but at this point are basically accepting a shorter transformer life at these locations (approximately 20-year life).
Cathodic protection is not being used for distribution transformers.
Note: SCL is utilizing cathodic protection for transmission oil-filled pipe-type cable.
7.4.11.13 - Practices Comparison
Practices Comparison
Design
Network transformer design


7.4.11.14 - References
EPRI Underground Distribution Systems Reference Book (Bronze Book)
7.4.11.15 - Survey Results
Survey Results
Design
Network Transformer Design
Survey Questions taken from 2018 survey results - Manhole Event Preparedness and Response
Question 6 : Do you require a firewall between two pieces of equipment in one vault?


Question 7 : Are you using a separately mounted primary switch (not part of the transformer unit)?


Survey Questions taken from 2015 survey results - Design
Question 51 : Do you require a firewall between two pieces of equipment in one vault? (example, between two network transformers) (check all that apply)


Question 55 : If you have primary termination and switch on your network transformers, does your specification call for?


Question 56 : Are you using a separately mounted primary switch (not part of the transformer unit)?


Survey Questions taken from 2012 survey results - Design
Question 4.9 : Do you require a firewall between two pieces of equipment in one vault? (example, between two network transformers)

Question 4.12 : For the primary termination and switch, does your network transformer specification call for a

Question 4.14 : Does your network transformer specification call for units with taps?

Survey Questions taken from 2009 survey results - Design
Question 4.9 : Do you require a firewall between two pieces of equipment in one vault? (example, between two network transformers)

Question 4.11 : Does your typical network design utilize: (see Graph below) (this is question 4.12 in the 2012 survey)


7.4.12 - Network Transformers—Primary Switch
7.4.12.1 - AEP - Ohio
Design
Network Transformers Primary Switch
People
Establishing specifications for the network unit, including transformers, network protectors and the primary switch design used in the AEP Ohio networks supplying metropolitan customers in Columbus and Canton is the responsibility of the Network Engineers in collaboration with the Network Engineering Supervisor. These personnel are geographically based in downtown Columbus at AEP Ohio’s Riverside offices. The Network Engineering group reports to the AEP Network Engineering Supervisor, and is part of the Distribution services group at AEP, reporting ultimately to the AEP Vice President of Customer Services, Marketing and Distribution Services. The AEP Distribution Services group, including the Network Engineering Supervisor supports all AEP network design issues throughout its operating companies, including Texas, Indiana, Michigan, Oklahoma, and other locations.
AEP also has a Network Standards Committee, headed by the lead Network Engineering Supervisor in its downtown Columbus offices, and comprised of representatives from all AEP operating companies. This group works closely with the parent company’s Distribution Services organizations, and holds regular teleconference sessions on network findings, “lessons learned” in the field, and discusses potential network engineering solutions to common network design and implementation issues. Network transformer/switch designs used throughout AEP are studied and recommended through this committee.
Process
AEP Ohio has networks in Columbus and Canton, Ohio. The Columbus urban area has four separate networks North, South, East, and West. All four networks are supplied from three substations and are served by six feeders each, with group of six sourced from the same substation. Canton has two separate networks servings its area. There is no overlap in among networks. Each network is built to N-2, with the Columbus networks being a true N-2 including the substation, and the Canton networks being N-2, with N-1at the station. This N-2 reliability is notable, whereas most urban underground network systems operate at an N-1 level. N-2 insures that if any two transformers go down, a third is available for picking up the network load and maintaining service. Some new service is deployed using spot networks and radial distribution within these areas, also planned and designed by the Columbus-based Network Engineering group.
AEP Ohio has network systems in both Columbus and Canton, Ohio. The Columbus urban area has four separate networks – North, South, Vine, and West – supplied from three substations. Each network is supplied from 138 kV/13.8 kV Δ -Y network transformers. All four networks, about 30 MVA each, are served by six dedicated network feeders at 13.8 kV, with each group of six originating from a single substation. There is no overlap in these networks. This is a preferred design in that the network feeders are sourced at the same voltage, which minimizes the possibility of problems with network protectors pumping or cycling. AEP reports few problems with protectors pumping, cycling, or opening under light network loading.
Each Columbus network is built to N-2 reliability. The substations that supply Columbus are designed using at least three transformers, with one serving as a ready reserve hot spare. In Columbus, the Vine network primarily serves spot networks in a high-rise area of downtown (Vine Station), with some mini-grids at 480 V. The other three networks (North, South, and West) serve a mix of grid (216 V) and spot loads.
Canton has one network supplied at 23 kV. The station that supplies Canton is designed to N-1, though networks themselves are also designed to N-2.
All new network service designs reference the AEP parent company Network Design Criteria guide, which outline both Single Contingency (N-1) and Double Contingency (N-2) Operations.
AEP had historically used a network unit design that incorporated the primary switch compartment into the transformer unit. However, its new standard calls for a separate wall-mounted solid dielectric vacuum switch to be used as the primary switch to disconnect the transformer from the primary circuit. The new transformer specification calls for transformers without an integrated primary switch as the wall-mounted vacuum interrupter serves this purpose.
AEP’s decision to move to separately mounted primary switch was driven by safety and operational flexibility. From a safety perspective, by moving to the wall-mounted vacuum switch, AEP has eliminated an oil-filled chamber on the transformer unit, eliminating the chance of a failure resulting in a fire and spreading to the remainder of the transformer unit. The wall-mounted switches can also be remotely operated from outside the vault of manhole.
From an operational flexibility perspective, the wall-mounted vacuum switch provides the ability to de-energize one network unit while leaving the rest of the circuit in service. Not having to take an entire circuit out of service improves reliability by not having to operate the remaining network in a first contingency, and eliminates a complicated and lengthy process to clear the entire feeder, that involves visiting all other transformer locations (grid and spots). In addition, clearing an entire feeder at AEP involves increased coordination with dispatcher resources as compared to operating a single switch which can be performed by local resources.
Technology
AEP is using the Elastimold MVI solid dielectric vacuum switch. This is a load break device and can be operated remotely from outside of the manhole or vault (see Figures 1 - 4).

Figure 1:
Wall-mounted vacuum switch, Elastimold MVI

Figure 2:
Wall-mounted vacuum switch

Figure 3:
Switch control cabinet

Figure 4:
Switch control cabinet – remote controller
In 480-V spot network vaults, AEP has historically supplied the vault with primary switches that are tied to the fire detection system, dropping the entire vault in the presence of a fire. Prior to the use of the solid dielectric vacuum interrupter, AEP had used SF6 switches in this application.
AEP’s new standard is to tie the solid dielectric vacuum switches to both the fire detection systems and transformer sudden pressure alarms. If the system senses a transformer pressure alarm, it would drop the circuit supplying that transformer. If the system senses a fire (high temperature in the collector bus), it would drop the entire vault.
7.4.12.2 - Ameren Missouri
Design
Network Transformers Primary Switch
People
Network standards, including the standard design for the network transformer and primary switch design, are the responsibility of the Standards Group.
This group develops both construction standards and material specifications for designs and equipment used in the network underground. These standards and specifications are used by engineers and estimators in developing network designs. Standards are available in both an online and printed book format. Updated versions of the book format version are issued every 2-3 years.
Organizationally, the Standards Group is led by a Managing Supervisor, and is part of the Distribution Planning and Asset Performance Department, part of Energy Delivery Technical Services. The group is staffed with engineers.
For the network unit standard; that is, the standards for the network transformer, primary disconnect and network protector, Standards engineers work closely with the organization responsible for network equipment testing and maintenance at Ameren Missouri – the Service Test Group. Ameren Missouri has up to date material specifications for the network unit equipment. However, the construction standard for this installation is maintained separately, and is not part of the Construction Standards Book. Ameren Missouri plans to incorporate the standards for the network unit equipment into its Construction Standards Book.


Figure 1 and 2:
Photos of transformer primary Disconnect and ground switch handle

Figure 3:
Photo of transformer primary Disconnect and ground switch handle
Process
Ameren Missouri’s network transformer specification calls for a subway style unit with an oil -filled high-voltage disconnecting and grounding switch incorporated into the unit. In general they utilize a two chamber design – one chamber for the primary termination and one chamber for the switch compartment – however, their specification does allow for the high − voltage terminal and switch chambers to be combined into one chamber provided that the bushing height is equal to the two chamber design.
The primary switch has five positions with the following operating sequence: Open, Transformer, Ground H3, Ground H3 & H2, and Ground H3, H2, & H1. The multiple ground positions are used for phasing.
For example, after a network feeder has been separated (for example because of splicing to repair cable), Traveling Operators will check phasing before restoring the feeder. They do this by going to a transformer location and moving the switch handle into the ground position. Back at the substation, they will hook up a home-developed annunciator device (called a rabbit cage.) This device uses a DC supply, and has indicator lights which illuminate when the cable legs are grounded.
When the transformer switch is in the ground position, all of the lights on the rabbit cage will be illuminated. The traveling operator will then move the switch handle - in the first position, the C light should go out, then the B light, finally the A light- indicating that the phasing at the transformer matches the phasing at the station. This test is always done twice before confirming phases.
The primary switch includes an electrical interlock to prevent operation when the transformer is energized.
The transformer switch compartment does not contain a site glass. Ameren Missouri does not require a visible break at the transformer disconnect switch.
Technology
Ameren Missouri currently has no primary sectionalizing devices on the network feeders. As part of their downtown revitalization Program, they are thinking about adding sectionalizing devices to limit the number of switching operations required to clear a network feeder (or feeder section) to six operations. Currently, they have some network feeders that have 15 - 18 network transformers. Thus, the switching process takes a long time. Inserting primary sectionalizing devices would minimize the number of switching operations required to clear a section of the feeder.
7.4.12.3 - CEI - The Illuminating Company
Design
Network Transformers Primary Switch
People
The design of the network transformers is performed by the CEI Underground / LCI group, part of the CEI Regional Engineering group, located in NRHQ (Northern Region Headquarters).
Process
The transformer primary switch is an externally operable disconnect switch with a ground position that short circuits and grounds the high-voltage windings and bushings connected to the feeder, and with phasing positions that are used to ground a given phase in order to perform phasing. For example, after locating and isolating a faulted section of cable, CEI crews may have to determine the phasing before reconnecting two cable sections. When phasing conductors to make repairs, they will go back to a network transformer and move the switch to the phase position to ground a particular phase. They will then use a small Megger tester to determine the corresponding faulted phase in the manhole.
Technology
CEI’s network transformer design includes a one-chamber design for the transformer primary termination and switch. The switch is an externally operable disconnect switch with a ground position and phasing positions.
7.4.12.4 - CenterPoint Energy
Design
Network Transformers Primary Switch
People
Network Unit design at CenterPoint is performed by the Engineering Department contained within the Major Underground Group. The Engineering department is led by a Manager and is comprised of four main sub groups.
One sub group is a technical group that includes the engineers who design the protection schema and remote monitoring systems in the underground.
Another sub group deals with the design of three phase pad mounted transformer installations, including looped commercial developments. This group, the Padmounts group, is comprised of Engineers, Engineering Specialists, and is supplemented with contractor resources. This group is not typically involved in network design.
Another sub group focuses on vault designs, interfacing very closely with the Key Accounts Consultants (also part of Major Underground) who interface with large customers. The Vaults group is comprised of Engineers, Engineering Specialists, and is supplemented with contractor resources. Note this group designs the layout of the vault including the design of the network unit.
The final subgroup is one focused on distribution feeder design. The Feeders group focuses on both network and non network feeders. This group is comprised of Engineering Specialists, Engineering Technicians, and is supplemented with contractor resources.
Process
CenterPoint designs their network unit so that the primary disconnect (into the transformer) is physically separate from the transformer itself. CenterPoint does not purchase transformer units with a primary disconnect. Further, they have revisited locations where they had older units with primary disconnects and redesigned them to physically separate the disconnect from the unit.
Historically, CenterPoint utilized network transformers with a two compartment design as they terminated PILC cables in the primary compartment. They have modified most of these units to separate the primary disconnect, and convert the transformer primary entrance to dead front elbows.
Technology
Figure 1 shows a separate 600 amp load break disconnect used as a primary disconnect coming into the vault. Figure 2 shows live front terminations into the unit feeding from that disconnect.

Figure 1:
600 amp load break disconnect

Figure 2:
live front terminations
On newer installations, CenterPoint is using dead front primary terminations (elbows), as shown in Figure 3

Figure 3:
Dead front primary terminations
7.4.12.5 - Con Edison - Consolidated Edison
Design
Network Transformers Primary Switch
People
Central Engineering - Responsibilities include Civil / Mechanical Engineering, Control Systems Engineering, Design Engineering, Electrical Engineering, Equipment and Field Engineering, and Environmental Engineering & Program Support.
Technology
Transformer Specification – Primary Switch
Con Edison’s network transformer specification differs from the transformer specification of many other utilities in that it does not call for an external primary disconnect ground switch.
Con Edison’s specification does call for an externally operable, two – position, high-voltage internal ground switch. In the Ground position, this switch will short circuit and ground the high-voltage windings and bushings connected to the feeder. The switch is mounted internally to the transformer because of space constraints in their vaults. The switch uses an electrical interlock to prevent the switch from being closed while the transformer is energized. This switch has been very reliable for Con Edison.
If Con Edison does have to disconnect a transformer from a primary feeder, the utility disconnects the feeders (lift the “elbows”) on the primary side.
7.4.12.6 - Duke Energy Florida
Design
Network Transformers - Primary Switch
People
Standards for network design, including the network transformer and primary switch, are the responsibility of the Duke Energy Florida Standards group, which oversees all standards for distribution equipment and materials. One Engineer within the group oversees all network equipment standards for Duke Energy Florida. This engineer is an Electrical Engineer, a requirement for the engineer who specializes in Network Standards. The engineer also has a PE license, a requirement to obtain certain levels within the engineer family.
Duke Energy has a Corporate Standards committee which focuses on developing common standards throughout the Duke Energy family of companies. Across the Duke Energy family of companies, there is a core Network Group of four or five members within the broader Standards groups that assist each other and collaborate on choosing all material and specification standards for the underground network throughout the company, including Florida. This core underground team draws on members from across the Duke Energy operating companies. The Design Engineers are engaged in a Duke Energy corporate-wide process to consolidate design standards for network systems among the various Duke operating companies, due to be finalized in 2017.
Duke Energy Florida has developed network design standards, which are contained in the “Duke Energy Florida Section 29; Networks, Vaults, and Transclosures.” (See Attachment D .)
Process
The Standards engineers who focuses on network infrastructure works very closely with experts within the Network Group, including the department manager and senior network specialists. Network standards for infrastructure in Clearwater and St. Petersburg are the result of the collaboration between the Standards group and Network Group.
Technology
In supplying primary to a network vault, Duke Energy Florida will normally T-tap from the primary in a separate manhole and run the tap into the network vault.
Duke Energy Florida’s network design calls for the primary disconnect to be separate from the network transformer. Historically, they had utilized a three-way feed-through bushing arrangement for high side transformer isolation point (see Figure 1). Their current design utilizes a wall mounted three phase solid dielectric vacuum switch, as the disconnect point between the primary distribution system and the network transformer (see Figures 2and 3). Duke Energy Florida does not remotely monitor or control network transformer primary disconnect switches.

Figure 1:
Network transformer disconnect point, older design three-way feed-through bushing arrangement

Figure 2:
Newer design, wall-mounted, three phase solid dielectric vacuum switch feeding to a submersible vault network transformer which supplies the grid

Figure 3:
Wall-mounted three phase solid dielectric vacuum switches supplying spot network transformers in a building vault
7.4.12.7 - Duke Energy Ohio
Design
Network Transformers Primary Switch
People
Network standards are the responsibility of the collaboration of the network engineer, the planning engineer, and the Dana Avenue supervision. This group uses the old Cincinnati gas and electric construction manual as a guide. Ultimately, Duke Energy will develop a common network standard across the system.
Technology
Historically, Duke used live front terminations on network transformers, with a two chamber design - one for the terminations and one for the primary switch. They recently changed their specification from live front terminations to dead front primary terminations (T bodies). The current specification calls for a one chamber design, with a non load break, three position (open, close, ground) primary disconnect switch mounted on the transformer primary.
The primary switch specification does not call for a site window. (Note that Duke will only operate the transformer primary switch in a no load condition, as the switch is a non load break switch. The primary feeder must be open and the secondary must be open in order to operate the switch).
This switch has an electrical interlock that prevents moving the switch when it is energized. The switch also has a mechanical stop in the closed position so that you have to hesitate going to the ground position so that the electrical interlock can function if necessary.
All new designs use EPR cables and T bodies as primary terminations.

Figure 1:
Building Vault Transformer, live front terminations

Figure 2:
Primary switch handle

Figure 3:
UG Vault Transformer – Dead Front Terminations

Figure 4:
Primary Switch Handle
7.4.12.9 - ESB Networks
Design
Network Transformers Primary Switch
People
The design of primary (MV) voltage infrastructure is performed by designers located within the Network Investment Management groups for larger designs, and within the ESB Networks Regions for the smaller designs. The Network Investment Management groups (North and South) are part of the Asset Investment group, within Asset Management. The Regions are organizationally part of the Operations Management Group, also part of the Asset Management organization.
Most designs are performed by an Engineering Officer – the designer position at ESB Networks. Designs are also performed by engineers and Technologists.
The development and maintenance of guidelines for performing primary network design are the responsibility of the Specification Management group, part of the Asset Investment group, also part of the Asset Management organization at ESB Networks.
The Specifications Management group has developed thorough guidelines for the design of primary switching. This guideline includes specific direction for optimizing designs.
Note that in addition to the Operations Management and Asset Investment groups, the Asset Management organization consists of Program Management, Infrastructure Stakeholder Management, Assets & Procurement, and Finance & Regulation. These groups work closely together to manage the asset infrastructure at ESB Networks.
ESB Networks may receive engineering consulting support from ESB Networks International (ESB NetworksI) for larger designs.
Technology
ESB Networks uses a standardized MV “packaged substation” consisting of an SF6 gas insulated ring main unit, the MV transformer (in Dublin, typically a 10-kVA primary to a 430-V secondary), and the secondary bus and protection that feed the secondary “mains” that supply the LV system in downtown Dublin.
The current design of the primary switch is an SF6 gas insulated ring main unit device (see Figure 1), with an “in” switch, an “out” switch, and a fused, switched tap leading to the transformer (kkt). The company describes these units as “maintenance free,” and obtains them from a supplier through a tendered arrangement. ESB Networks does have older oil-insulated devices installed on its system as well. These devices must be manually operated from within the indoor room. Note that the ring main units are designed with a venting system, such that any arcs will blow out the back of unit.

Figure 1:
SF6 gas insulated ring main unit
ESB Networks’ standard primary switchgear (ring main unit) is a “load make,” but not a “load break” device. The switch is designed with an anti-reflex handle that prevents an operator from inadvertently and reflexively opening the switch if the operator happens to close into a fault, as the device cannot break load. If the operator does close into a fault, ESB Networks relies on the tripping of the breaker that sources the 10-kV feeder.
ESB Networks’ standard primary switchgear (ring main unit) is a “load make,” but not a “load break” device. The switch is designed with an anti-reflex handle that prevents an operator from inadvertently and reflexively opening the switch if the operator happens to close into a fault, as the device cannot break load. If the operator does close into a fault, ESB Networks relies on the tripping of the breaker that sources the 10-kV feeder.
7.4.12.10 - Georgia Power
Design
Network Transformers Primary Switch
People
Network standards, including the standard design for the network transformer and primary switch, are the responsibility of the Standards Group and the Network Underground design engineers.
Organizationally, both the design of network systems, and the development of network standards are the responsibility of engineers within the Network Underground group. These may be engineers that are part of the Network Engineering Group, or principal engineers that report directly to the Network Underground Manager.
Organizationally, the Network Underground group is a separate entity, led by the Network Underground Manager, and consisting of engineering, construction, maintenance and operations resources responsible for the network underground infrastructure, including the development of standards for network equipment.
Network design is performed by the Network Underground Engineering group, led by a manager, and comprised of Engineers (Electrical and Civil) and Technicians concerned with the planning, design, and any service issues associated with the network. The Engineers are four-year degreed positions, while Technicians have a combination of years of experience and formal education, including two-year and four-year degrees. Engineers are not represented by a collective bargaining agreement.
In addition to the engineers with in the Network Underground Engineering group, the Network Underground group has two Principal Engineers who report to the Network UG Manager. These Principal Engineers also deal with issues of network design, and are responsible for the development and maintenance of standards for network equipment. Standards are available in both an online and printed book format. Standards were first documented and codified in the 1970s, and they include what was already documented on the network from the 1940s and any new standards developed since then. It is a living document, and the responsibility of the Standards Group comprised of the Principal Engineers in the Network Underground group. The standards are divided into two main sections: civil construction and network specifications and design.
Process
Georgia Power’s standard for network transformers conforms to IEEE C57.12.40 (IEEE Standard for Network, Three-Phase Transformers, 2500kVA and smaller), with two minor modifications to the manufacturer’s specifications: 1) transformers are welded onto metal rails to keep them off the vault floors and make them easier to pick up with a fork lift; and 2) every transformer has phasing tubes on top to test for current in the transformer. The phasing tubes are used to trace phases before operations. All new transformer installations are filled with FR3 organic ester fluid. Common transformer sizes for units supplying their network grid systems (208V) are 500 kVA and 1000kVA, with 500kVA units being the most common. For transformers feeding spot networks at 480V the most popular sizes are 1000 and 2000kVA units. Georgia Power does have 3000kV units supplying a small 4kV network.
Georgia power’s standard allows for both transformer units with separate compartments for the primary termination chamber and primary switch, and combined, one chamber designs, which are more recently being used for units with elbow type bushings. Georgia Power is using 200A-rated elbows and bushings for the primary terminations (See Figure 1).

Figure 1:
New network transformer inventory
The transformer mounted primary switch includes open, closed, and grounded positions (See Figure 2). Georgia Power does not require a sight glass on the primary switch compartment.

Figure 2:
Network transformer primary switch handle
Transformers are tested by Test Technicians who are part of the Network Operations and Reliability group (the Testing group). The group performs a transformer turns ratio test (TTR); a Megger test; and they take an oil sample for a dielectric test. These are industry standards tests that Georgia Power performs before putting the transformer into inventory.
Georgia power mounts the protector on the transformer and performs initial protector testing as well. This testing is performed by a two person team comprised of a Cable Splicer Senior and a Cable Splicer Journeyman. Georgia Power has implemented this approach to familiarize cable splicers with the network units they’ll be working on in the field.
Note: if a transformer has been in inventory for a long time, the Testing group will do a Megger test and an oil sample test again, to make sure it is safe to operate, and ready to commission.
7.4.12.11 - HECO - The Hawaiian Electric Company
Design
Network Transformers Primary Switch
People
Network transformers are sized by the Planning Division. The design of a network transformer installation is performed by the T&D Division of the Engineering Department. The transformer chosen would be based on HECO specifications.
The Technical Services Division of the Engineering Department establishes transformer specifications for HECO.
Technology
HECO’s network transformer design includes a two-chamber design for the transformer primary termination and switch .
7.4.12.12 - National Grid
Design
Network Transformers Primary Switch
People
Network standards, including the standard design for the network transformer and primary switch design, are the responsibility of the Distribution Standards department, part of Distribution Engineering Services. Distribution Engineering Services is part of the Engineering organization, which is part of the Asset Management organization at National Grid. Within the Standards group, National Grid has two engineers who focus on underground standards.
National Grid has up to date standards and material specifications for network equipment, including the network transformer primary switch. Network material specifications are updated annually. Standards are updated on a five-year cycle.
Note that because National Grid’s system is comprised of multiple network systems of different designs in both New York and New England, the standards book is organized with a common standards section that represents the whole company, and then individual sections that specify standards appropriate to the individual network systems that comprise their overall infrastructure.
Process
National Grid Albany’s network transformer specification calls for a subway style unit with a high-voltage disconnecting and grounding switch incorporated into the unit. For dedicated network feeders such as in the Albany network, the high-voltage switch is a “dead break” switch. Operation of the dead-break switch requires that the transformer be de-energized. The switch has electrical interlocks which prevent movement of the switch from any position when the transformer is energized.

Figure 1:
Primary disconnect and ground switch
Note that in applications where network transformers are connected to a non-dedicated feeder (not applicable to the Albany network), National Grid will call for a “mag break” high-voltage switch. Operation of the mag-break switch to the “open” position requires that only magnetizing current be present on the transformer. The switch has an electrical interlock that prevents switching from “closed” to “open” when the network protector is closed. This allows the switch to operate from “closed” to “open” when the primary feeder is energized provided the network protector is open. Operation of the mag-break switch from “closed” to “ground” position requires the transformer to be de-energized. A second interlock prevents switching from “closed” to “ground” when the transformer is energized.
Primary terminals for new purchases are 600 ampere apparatus bushings. (dead - front design).

Figure 2:
600A dead front primary termination

Figure 3:
Lead primary terminations
Technology
National Grid Albany uses a two chamber design for its network primary termination; one for the terminations themselves, and one for the internal disconnecting and ground switch. National Grid has many in service units with lead-wiped PILC primary terminations. Their current standard calls a dead front termination using for 600 A apparatus bushings.
7.4.12.13 - PG&E
Design
Network Transformers Primary Switch
People
Network standards, including the standard design for the network transformer and primary switch design, are the responsibility of the Manager – Distribution Networks . PG&E has assigned one individual as the Asset Manager for network equipment, including all components of the network unit. This Asset Manager is responsible for network equipment design standards, developing life cycle strategies for network equipment, and making capital and maintenance investment decisions for network equipment.
The Asset Manager is a four year degreed engineer, with a law degree. He has one four year degreed engineer working for him, but works very closely in a “matrixed” environment with other PG&E organizations key to the network, including Network Planning, Maintenance and Construction (responsible for executing the strategies developed by the Asset Management), and the Reliability organization responsible developing UG Cable strategies. The Asset Manager collaborates closely with these other field organizations, including monthly visits with field crews.
The Asset Manager is a true asset owner, held accountable for the performance of the network. As the VP, M&C Electrical Networks, the leader of the field resources focused on the network, described it, “Bob (the Asset manager) sets the strategy, M&C executes it”.
The Asset Manager has developed and maintains up to date standards that describe the Network Transformer and Primary Switch design.
Process
PG&E has changed their network unit design to separate the primary switch from the transformer tank itself. This new design physically separates the primary disconnect switch from the transformer itself creating a smaller footprint within the fault, making it easier to work on from a crew perspective, and minimizing the chances of a catastrophic failure in the main transformer tank migrating to a secondary failure in the primary switch.
PG&E plans to change all of their network units to this new design, anticipating that it will take 30 years to complete.
Technology
Historically, PG&E had used a two chamber design for its network primary termination; one for the terminations themselves, and one for the internal ground switch. PG&E has made the decision to move away from this design, instead using a solid dielectric switch mounted on the wall of the vault as the primary sectionalizing point, and using single tank transformers without a ground switch. The reason for this change is that PG&E has found that catastrophic failures of the transformer can be worsened by secondary explosions of the small oil chambers used for the primary disconnects and ground switch. There can be enough power in an arcing event that the small amount of oil in each of these smaller chambers is atomized causing a potential secondary explosion from the
PG&E plans to add SCADA monitoring and control to these primary switches.

Figure 1:
Photo of Solid Dielectric Switch

Figure 2:
Photo of Solid Dielectric Switch

Figure 3:
Photo of Transformer

Figure 4:
Photos of transformer - Protector
7.4.12.14 - SCL - Seattle City Light
Design
Network Transformers Primary Switch
People
Organization
Network Design at SCL is performed by the Network Design Department, which is part of Energy Delivery Engineering. See Attachment A . The Network Design Department performs all planning and design of SCL’s networks.
The Network Design Department is made up of eight “System” engineers, who do all of the design for the network, and eight “Services” engineers, who interface with the customers, gather load information, coordinate construction activity, etc. The individuals in this group are four-year degreed engineers. Some have their PE licenses.
The engineers at SCL are represented by a collective bargaining agreement (IBEW, Local 17).
Technology
Network Transformers — Primary Switch
SCL’s specification for network transformers calls for either a one- or two-chamber design for the transformer primary termination and switch. SCL has historically used a two-chamber design – one chamber for the terminations and one for the switch.
The two-chamber design originated with the use of Paper-Insulated Lead-Covered (PILC) cable and the need for a place to make lead wipes for the primary terminations.
SCL has stayed with the two-chamber design standard, but is currently trying out a one-chamber design, because most of their primary conductors are crosslinked polyethylene (XLP), with XLP terminations.
Their specification for a combination switch and terminal chamber requires that:
- The high-voltage bushing (listed in Section 8.2.3 e of their material specification[1] 0038.3) may not be used to support switch contacts in any way. Only flexible cable leads may be connected to the bushings.
- The switch operating handle shall be 36 to 48 inches above the ground.
- Only one set of drain valve, vent/level plug, and liquid level gauge is required (and shall be per Section 8.2.1 of material specification 0038.3)
- The single chamber shall meet all other aspects of their material specifications for terminal and switch chambers (Sections 8.2.1, 8.2.2, and 8.2.3 of their specification 0038.3).
- The viewing window shall be large enough to see the bottom of the bushings in oil.
[1] SCL’s material specifications can be accessed at seattle.gov
7.4.12.15 - Practices Comparison
Practices Comparison
Design
Network Transformer Primary Switch Design

7.4.12.16 - References
EPRI Underground Distribution Systems Reference Book (Bronze Book)
7.4.12.17 - Survey Results
Survey Results
Design
Network Transformers — Primary Switch
Survey Questions taken from 2018 survey results - Manhole Event Preparedness and Response
Question 7 : Are you using a separately mounted primary switch (not part of the transformer unit)?


Question 8: When do you operate a network transformer’s primary switch?


Survey Questions taken from 2015 survey results - Design
Question 55 : If you have primary termination and switch on your network transformers, does your specification call for?


Question 56 : Are you using a separately mounted primary switch (not part of the transformer unit)?


Survey Questions taken from 2012 survey results - Design
Question 4.12 : For the primary termination and switch, does your network transformer specification call for a

Survey Questions taken from 2009 survey results - Design
Question 4.11 : Does your typical network design utilize: (see Graph below) (this is question 4.12 in the 2012 survey)


7.4.13 - Network Unit Design
7.4.13.1 - AEP - Ohio
Design
Network Unit Design
People
Establishing specifications for the network unit, including transformers, network protectors and the primary switch design used in the AEP Ohio networks supplying metropolitan customers in Columbus and Canton is the responsibility of the Network Engineers in collaboration with the Network Engineering Supervisor. These personnel are geographically based in downtown Columbus at AEP Ohio’s Riverside offices. The Network Engineering group reports to the AEP Network Engineering Supervisor, and is part of the Distribution services group at AEP, reporting ultimately to the AEP Vice President of Customer Services, Marketing and Distribution Services. The AEP Distribution Services group, including the Network Engineering Supervisor supports all AEP network design issues throughout its operating companies, including Texas, Indiana, Michigan, Oklahoma, and other locations.
AEP also has a Network Standards Committee, headed by the lead Network Engineering Supervisor in its downtown Columbus offices, and comprised of representatives from all AEP operating companies. This group works closely with the parent company’s Distribution Services organizations, and holds regular teleconference sessions on network findings, “lessons learned” in the field, and discusses potential network engineering solutions to common network design and implementation issues. Network protector designs used throughout the AEP service areas are regularly studied and recommendations are made through this committee.
Process
AEP had historically used a network unit design that incorporated the primary switch compartment into the transformer unit. However, its new standard calls for a separate wall-mounted solid dielectric vacuum switch to be used as the primary switch to disconnect the transformer from the primary circuit. The new transformer specification calls for transformers without an integrated primary switch as the wall-mounted vacuum interrupter serves this purpose.
AEP’s decision to move to separately mounted primary switch was driven by safety and operational flexibility. From a safety perspective, by moving to the wall-mounted vacuum switch, AEP has eliminated an oil-filled chamber on the transformer unit, eliminating the chance of a failure resulting in a fire and spreading to the remainder of the transformer unit. The wall-mounted switches can also be remotely operated from outside the vault of manhole.
From an operational flexibility perspective, the wall-mounted vacuum switch provides the ability to de-energize one network unit while leaving the rest of the circuit in service. Not having to take an entire circuit out of service improves reliability by not having to operate the remaining network in a first contingency, and eliminates a complicated and lengthy process to clear the entire feeder, that involves visiting all other transformer locations (grid and spots). In addition, clearing an entire feeder at AEP involves increased coordination with dispatcher resources as compared to operating a single switch which can be performed by local resources.
Technology
AEP’s network unit design calls for a wall-mounted solid dielectric vacuum switch that is separate from the transformer, a submersible network transformer that can accept ESNA style (elbows or T bodies) connections, and a transformer mounted network protector (see Figures 1 and 2). All new AEP Ohio designs utilize Eaton CM52 network protectors and fiber-optic connections from the protector to the Operations Center for control and monitoring (see Figures 3 and 4).

Figure 1:
Wall-mounted primary switch

Figure 2:
Primary transformer connection – T bodies

Figure 3:
Network transformer. Note that the transformer does not have a primary switch compartment

Figure 4:
Network protector mounted on network transformer
7.4.13.2 - Ameren Missouri
Design
Network Unit Design
People
Network standards, including the standard design for the network unit, including the transformer, primary switch and network protector design, are the responsibility of the Standards Group.
This group develops both construction standards and material specifications for designs and equipment used in the network underground. These standards and specifications are used by engineers and estimators in developing network designs. Standards are available in both an online and printed book format. Updated versions of the book format version are issued every 2-3 years.
Organizationally, the Standards Group is led by a Managing Supervisor, and is part of the Distribution Planning and Asset Performance Department, part of Energy Delivery Technical Services. The group is staffed with engineers.
For the network unit standard, Standards engineers work closely with the organization responsible for network equipment testing and maintenance – the Service Test Group. Ameren Missouri has an up to date material specification for the network unit; however, the construction standard for this installation is maintained separately, and is not part of the Construction Standards Book. Ameren Missouri plans to incorporate the standard for the network unit into its Construction Standards Book.
Process
Ameren Missouri’s network unit specification calls for a subway style transformer unit with an oil filled high-voltage disconnecting and grounding switch incorporated into the unit, and a throat mounted submersible network protector.
In general, Ameren Missouri uses a two chamber design – one chamber for the primary termination and one chamber for the switch compartment. However, their specification does allow for the high − voltage terminal and switch chambers to be combined into one chamber provided that the bushing height is equal to the two chamber design.

Figure 1:
Network Unit – Primary terminations
Ameren Missouri is not using cathodic protection in network unit installations. However, at the time of the practices immersion, Ameren Missouri was piloting the use of sacrificial anodes in selected network unit locations to assess their efficacy.
Network protectors are purchased with microprocessor relays for use with Ameren Missouri’s remote monitoring system.
Ameren Missouri does not currently install any high side interrupters. Any faults would be seen by the feeder breaker.
Technology
Ameren Missouri has recently modified its transformer standard to call for a tank design that can withstand high energies from internal faults before rupturing and, in the event of a tank rupture, direct ejected fluids downward into the vault. In addition, they require an anti corrosive coating in the bottom 12 inches of the tank.

Figure 2:
Network Unit – network protector
7.4.13.3 - CenterPoint Energy
Design
Network Unit Design
People
Network Unit design at CenterPoint is performed by the Engineering Department contained within the Major Underground Group. The Engineering department is led by a Manager and is comprised of four main sub groups.
One sub group is a technical group that includes the engineers who design the protection schema and remote monitoring systems in the underground.
Another sub group deals with the design of three phase pad mounted transformer installations, including looped commercial developments. This group, the Padmounts group, is comprised of Engineers, Engineering Specialists, and is supplemented with contractor resources. This group is not typically involved in network design.
Another sub group focuses on vault designs, interfacing very closely with the Key Accounts Consultants (also part of Major Underground) who interface with large customers. The Vaults group is comprised of Engineers, Engineering Specialists, and is supplemented with contractor resources. Note this group designs the layout of the vault including the design of the network unit.
The final subgroup is one focused on distribution feeder design. The Feeders group focuses on both network and non network feeders. This group is comprised of Engineering Specialists, Engineering Technicians, and is supplemented with contractor resources.
Process
CenterPoint designs their network unit so that the primary disconnect (into the transformer) is physically separate from the transformer itself. CenterPoint does not purchase transformer units with a primary disconnect. Further, they have revisited locations where they had older units with primary disconnects and redesigned them to physically separate the disconnect from the unit.
Historically, CenterPoint utilized network transformers with a two compartment design as they terminated PILC cables in the primary compartment. They have modified most of these units to separate the primary disconnect, and convert the transformer primary entrance to dead front elbows.
See Network Design - Process
Technology
Figure 1 shows a separate 600 amp load break disconnect used as a primary disconnect coming into the vault. The next picture shows live front terminations into the unit feeding from that disconnect.

Figure 1:
600 amp load break disconnect

Figure 2:
live front terminations
On newer installations, CenterPoint is using dead front primary terminations (elbows), as shown in below.

Figure 3:
dead front primary terminations
CenterPoint has also elected to separate the network protectors from the units, where they can. The picture below shows the network protector placed on a stand but located physically separate from the unit. For new installations, CenterPoint would design the network protectors to be physically separate from the transformer. The driver for this change was to keep a fire in the network protector from spreading to the transformer.

Figure 4:
Network Protector separate from the transformer
Where CenterPoint is unable to separate the network protector from the transformer because of space constraints, they have replaced the transformer oil with R-Temp[1] , an alternate cooling fluid that has a higher flashpoint than mineral oil.
Because the R-Temp fluid is very viscous and thus doesn’t circulate and cool the transformer as well as oil, CenterPoint de-rates these transformers by 12%.

Figure 5:
R-Temp sticker on transformer
The largest network protectors used at CenterPoint are 2500A units.
[1] Note that R-Temp fluid is no longer available, and CenterPoint specification now calls for FR3.
7.4.13.4 - Duke Energy Florida
Design
Network Unit Design
People
Standards for network design, including the makeup of the network unit including the primary switch, network transformer, and network protector, are the responsibility of the Duke Energy Florida Standards group, which oversees all standards for distribution equipment and materials. One Engineer within the group oversees all network equipment standards for Duke Energy Florida. This engineer is an Electrical Engineer, a requirement for the engineer who specializes in Network Standards. The engineer also has a PE license, a requirement to obtain certain levels within the engineer family.
Duke Energy has a Corporate Standards committee which focuses on developing common standards throughout the Duke Energy family of companies. Across the Duke Energy family of companies, there is a core Network Group of four or five members within the broader Standards groups that assist each other and collaborate on choosing all material and specification standards for the underground network throughout the company, including Florida. This core underground team draws on members from across the Duke Energy operating companies. The Design Engineers are engaged in a Duke Energy corporate-wide process to consolidate design standards for network systems among the various Duke operating companies, due to be finalized in 2017.
Duke Energy Florida has developed network design standards, which are contained in the “Duke Energy Florida Section 29; Networks, Vaults, and Transclosures.” (See Attachment D ) In addition, the Standards engineer has developed a Distribution Engineering Manual section on Secondary Networks, which provides good background information on network component design considerations including cable limiter placement and coordination, protector operation, and manhole and vault considerations. See Attachment C.
Process
The Standards engineers who focuses on network infrastructure works very closely with experts within the Network Group, including the department manager and senior network specialists. Network standards for infrastructure in Clearwater and St. Petersburg are the result of the collaboration between the Standards group and Network Group.
Technology
Primary Switch
In supplying primary to a network vault, Duke Energy Florida will normally T-tap from the primary in a separate manhole and run the tap into the network vault.
Duke Energy Florida’s network design calls for the primary disconnect to be separate from the network transformer. Historically, they had utilized a three-way feed-through bushing arrangement for high side transformer isolation point (see Figure 1). Their current design utilizes a wall mounted three phase solid dielectric vacuum switch, as the disconnect point between the primary distribution system and the network transformer (see Figures 2 and 3). Duke Energy Florida does not remotely monitor or control network transformer primary disconnect switches.

Figure 1:
Network transformer disconnect point, older design three-way feed-through bushing arrangement

Figure 2:
Newer design, wall-mounted, three phase solid dielectric vacuum switch feeding to a submersible vault network transformer which supplies the grid

Figure 3:
Wall-mounted three phase solid dielectric vacuum switches supplying spot network transformers in a building vault
Network Transformer
Duke Energy Florida uses submersible network transformers to supply network customers. Transformer sizes range from 500 to 1500 kVA wye, with most units in Clearwater being 500 kVA units, and most in St. Petersburg being 750 kVA units. Transformer nameplate voltage rating is 12470 GRD.Y / 7200 - 208Y/120 (see Figure 4 and 5).
In developing their network transformer specification, Duke Energy Florida mirrored the Con Edison specification, including specifying units that are designed to eject fluids to the floor in the event of a transformer tank rupture [1], as shown in Figure 7.
Duke Energy Florida monitors network transformer and vault information in Clearwater using a system by Qualitrol. Using the Qualitrol transformer sensor module, they monitor transformer oil level and temperature, as well as the Oil Minder system associated with the vault sump pump, which can detect the presence of oil in the water and cease pump operation.
Duke Energy has recently teamed with Qualitrol to pilot an installation using a dissolved gas monitor at one transformer location. The monitor itself fits into the drain port of the transformer and is tied into the Qualitrol receiver. Their goal is to build an algorithm that considers transformer vintage, DGA results, etc., and uses that information to trigger replacement.
Duke Energy Florida is also monitoring information at the network protector using the Eaton VaultGard system (see Figure 6). VaultGard aggregates information from the Qualitrol module as well as from the network protector MCPV relay, and communicates it to Sensus, a third party, via cellular communications. Sensus provides information back to the Network Group.

Figure 4:
Network transformers – spot network location

Figure 5:
Network transformer in submersible vault

Figure 6:
VaultGard and Qualitrol control boxes on vault wall

Figure 7:
VaultGard and Qualitrol control boxes on vault wall

Figure 8:
VaultGard and Qualitrol control boxes on vault wall
Network Protector Clearwater
At 125/216V, Duke Energy Florida has standardized on the CM22, with internal NP fuses (see Figures 8 and 9). Duke Energy Florida uses a remote monitoring system in its network vaults in Clearwater. The company uses the Eaton VaultGard communication platform for recording and aggregating data from the network protector MPCV relay and from other vault sensors (Qualitrol). This information is communicated through a Sensus cellular monitoring system to a central server every half hour. Within the Network Group, information from Sensus, such as secondary loading, is monitored daily. Note that the Sensus system is read only, with the functionality to remotely control equipment being disabled for security purposes.
The network mains are supplied with four sets of cables using stud moles on the protector. Their vault design calls for the use of a separate uni-strut rack with insulated cable clamps that is mounted into the vault wall to support weight of the secondary cables.
Limiters are installed at each secondary junction on the secondary mains on the outgoing secondary cable.
St. Petersburg
At 277/480V spot network locations, Duke Energy Florida has standardized on the CM52, a fully submersible protector with a dead front design (see Figures 10 and 11). Duke Energy Florida’s network protector specification also calls for features such as:
-
External disconnects, which are used to separate the protector from the secondary collector bus. These disconnects are a safety feature used in a 480V design to mitigate arc flash risks. On this network protector, the NP fuses are internal and link style, as Duke Energy Florida is able to create the visible break between the NP and the secondary bus using the disconnects. Note that the disconnects can only be opened with keys which can only be accessed when the NP handle is in the open position because of an interlock system.
-
Wall-mounted ARMS (Arc Flash Reduction Maintenance System) modules, which enable a worker entering the vault to change the protection settings in the protector to reduce the fault clearing time and thus the arc energy in the event of a fault.
-
A submersible Stacklight, which is an annunciator system that indicates network protector status through a series of different colored lights.
-
Note that Duke Energy Florida has not installed the Sensus remote monitoring system in spot network protector vaults, in St. Petersburg.

Figure 9:
CM22, spare unit, in case

Figure 10:
CM22, spare unit

Figure 11:
Spot network vault with CM52. Note uni-strut cable support racks
}

Figure 12:
CM52 – note the external disconnects, stack light, and stud models atop the protector
7.4.13.5 - Duke Energy Ohio
Design
Network Unit Design
People
Network standards are the responsibility of the collaboration of the network engineer, the planning engineer, and the Dana Avenue supervision. This group uses the old Cincinnati Gas and Electric construction manual as a guide. Ultimately Duke Energy will develop a common network standard across the system.
Process
A standard network unit at Duke Energy Ohio includes a submersible network transformer with a one chamber primary switch, dead front terminations on the primary and a network protector mounted on the transformer secondary.
Duke is presently not installing any high side interrupters. Any faults would be seen by the feeder breaker.
Technology
See Figure 1

Figure 1:
Network Unit (Photograph from the Dana Avenue Training Facility)
7.4.13.6 - Georgia Power
Design
Network Unit Design
See Network Design
7.4.13.7 - National Grid
Design
Network Unit Design
People
Network standards, including the standard design for the network unit, are the responsibility of the Distribution Standards department, part of Distribution Engineering Services. Distribution Engineering Services is part of the Engineering organization, which is part of the Asset Management organization at National Grid. Within the Standards group, National Grid has two engineers that focus on underground standards.
National Grid has up to date standards and material specifications for network equipment, including the network transformer primary switch, network transformer and network protector. Network material specifications are updated annually. Standards are updated on a five-year cycle.
Note that because National Grid’s system is comprised of multiple network systems of different designs in both New York and New England, the standards book is organized with a common standards section that represents the whole company, and then individual sections that specify standards appropriate to the individual network systems that comprise their overall infrastructure.
Process
A new standard network unit at National Grid includes a submersible network transformer with a high-voltage disconnecting and grounding switch incorporated into the unit, and a throat mounted network protector. The network transformer is equipped with 600 dead front apparatus bushings for the primary cable termination onto the transformer.
National Grid Albany does not presently install any high side interrupters. Any faults would be seen by the feeder breaker.
National Grid’s standard design for a network unit calls for it to be placed on hot dipped galvanized I-beams within the vault. National Grid uses anodes to provide corrosion protection.

Figure 1:
Network Unit - Primary switch compartment

Figure 2:
Network unit - protector

Figure 3:
Network unit
Technology
Spot network vaults are equipped with a ground fault protection system designed to trip (open) all of the network protectors in the vault in the event of a ground fault. The customer is required to buy, install, and wire the National Grid approved ground fault protection system. Ground fault protection system equipment is installed in the customer’s electric room. However, a current transformer required to monitor neutral currents is installed in National Grid’s transformer vault.
7.4.13.8 - PG&E
Design
Network Unit Design
People
Network standards, including the standard design for the network unit, are the responsibility of the network asset manager (Manager of Networks). PG&E has assigned one individual as the Asset Manager for network equipment, including all components of the network unit. This asset manager is responsible for network equipment design standards, developing life cycle strategies for network equipment, and making capital and maintenance investment decisions for network equipment.
The asset manager is a four year degreed engineer, with a law degree. He has one four year degreed engineer working for him, but works very closely in a “matrixed” environment with other PG&E organizations key to the network, including Network Planning, Maintenance and Construction (responsible for executing the strategies developed by the Asset Management), and the Reliability organization responsible developing UG Cable strategies. The asset manager collaborates closely with these other field organizations, including monthly visits with field crews.
The asset manager is a true asset owner, held accountable for the performance of the network. As the VP, M&C Electrical Networks, the leader of the field resources focused on the network, described it, “Bob (the asset manager) sets the strategy, M&C executes it”.
The manager of networks has developed and maintains up to date standards that describe the network transformer and primary switch design.
Process
A new standard network unit at PG&E includes a wall mounted solid dielectric vacuum switch that serves as a primary disconnect, a submersible network transformer, dead front terminations on the transformer primary coming from the disconnect switch, and a network protector mounted on the transformer secondary.

Figure 1:
Solid Dielectric Switch

Figure 2:
Solid Dielectric Switch

Figure 3:
Transformer

Figure 4:
Transformer Protector
PG&E recently changed their network unit design to physically separate the primary switch from the transformer tank itself. This new design, used for both new installations and transformer replacements, results in smaller equipment footprint within the vault. This makes it easier to work in from a crew perspective, and minimizes the chances of a catastrophic failure in the main transformer tank migrating to a secondary failure in the primary switch.
PG&E plans to change all of their network units to this new design, anticipating that it will take 30 years to complete.
PG&E does not currently install any high side interrupters. Any faults would be seen by the feeder breaker.
Technology
Historically, PG&E had used a two-chamber design for its network primary termination; one for the terminations themselves, and one for the internal ground switch. PG&E has made the decision to move away from this design, instead using a vacuum switch mounted on the wall of the vault as the primary sectionalizing point, and using single tank transformers without a ground switch. The reason for this change is that PG&E has found that catastrophic failures of the transformer can be worsened by secondary explosions of the small oil chambers used for the primary disconnects and ground switch. There can be enough power in an arcing event that the small amount of oil in each of these smaller chambers is atomized causing a potential secondary explosion from the vaporized oil.
In the new design using the wall-mounted vacuum disconnect switch, the concern of a catastrophic failure of the smaller oil chambers in the old design are eliminated.
PG&E is using G&W vacuum switches in their new design. These switches are small enough that day can be dropped into a hole as one unit.
The new transformer consists of a single transformer tank – the primary termination compartment and switch compartment are eliminated. All new PG&E transformers are insulated with high flashpoint natural ester oil. PG&E is also selectively using explosion resistant tanks in high risk areas, and dry-type transformers in high rise buildings.
7.4.13.9 - Portland General Electric
Design
Network Unit Design
People
At PGE, distribution/network engineering develops and maintains the standards for the network unit equipment, including the primary disconnect and grounding switch, network transformer, and network protector. In addition, Distribution Engineers will establish network protector settings.
Standards are forwarded to the Standards Department for inclusion in company standards documents. Distribution Engineers assume responsibility for network standards as they have the expertise specific to network equipment.
The Distribution Engineers are not based in the Portland Service Center (PSC) or CORE group but have direct responsibility for the network and work closely with the CORE. The Eastern District Central Supervisor, who reports to the Manager of Distribution and T&D Standards, oversees these engineers. The underground Distribution Engineers are qualified electrical engineers.
Process
PGE’s network unit design calls for an integrated three-position disconnect and grounding switch, a submersible network transformer connected in delta-wye that can accept Energy Services Network Association (ESNA) style (typically straight ESNA receptacles) connections, and a transformer-mounted network protector (see Figures 1 through 4).

Figure 1:
Network unit, primary switch side

Figure 2:
Network unit, protector side

Figure 3:
Three-phase network transformer bank

Figure 4:
Separately-mounted network protector and primary switch
For the primary switch, PGE prefers a single switch chamber design rather than having a separate termination and switch chamber. The switch chamber includes a site glass to provide a visible opening, and the switch blades are painted white for more visibility.°
Transformer sizes are typically 500 kVA or 750 kVA in the area networks. Transformer sizes on spot networks can be 500, 750, 1000, or 1500 kVA, depending on the spot network load requirements.
All new designs utilize the Eaton CM52 network protectors. PGE has CMD units installed as well. (All installed protectors are one of these two styles).

Figure 5:
CM52

Figure 6:
CMD
The primary cable system is a combination of lead cables and EPR insulated cables. PGE replaces lead cables with EPR cables as opportunities arise. The secondary system uses both lead and EPR cables. PGE does not have a secondary cable replacement program underway.
PGE has a few locations with non-standard designs. For example, in a vault where spacing may not allow for a three-phase network unit, PGE may build the network unit by banking three single-phase transformers and using a separately mounted primary switch and network protector.
In most of its spot network vaults, PGE has installed a ground fault relay scheme that measures the neutral and ground current through a current transformer (CT). If the current exceeds a threshold, it trips all of the network protectors supplying the spot and locks them into the open position. Once this system activates, the protectors can only close with manual intervention. PGE installed this scheme because the primary protection scheme will not see through to a fault on the downstream side of the protector prior to the collector bus. PGE has experienced incidents in which the customer bus in front of (upstream of) the switchgear faulted, and the ground fault protection scheme worked as intended.
For the protective system to work correctly, PGE requires that the customer-side ground and neutral not be grounded on the customer side, but instead be isolated, and that it be tied in with the ground fault scheme on the vault secondary side.
In addition, most vaults also have a trip scheme tied in with thermal sensors located above the collector bus and transformers. This scheme also trips all of the protectors supplying the spot.
Network Improvements: In the last 10 years, PGE has invested in network units, including:
- Adding a remote monitoring system
- Replacing (in the last five years) slightly more than one third of the network protectors with a new all “dead-front” design to improve safety by minimizing exposure to arc flash when working with protectors. Its new standard network protector is the Eaton CM52.
Overall, PGE’s network rarely has problems with protectors pumping and cycling, as source network feeders from the same substation bus carefully regulate the voltage. However, in some older, lightly loaded buildings, it has protectors that hang open.
Monitoring Network Protectors: PGE remotely monitors network protector information, including the voltage and all three-phase currents at the network protector, on the transformer, and on the bus side of the protector. Other variables monitored include the power factor, temperature, and whether the position contact breaker within the network protector is open or closed. Readings are available in seconds.
PGE leverages access to this information to support the maintenance and operation of the system. For example, part of the clearance process for a primary feeder involves checking the monitored values to confirm that network protectors have opened. If the monitored information shows that one of the protectors is still closed, a crew will go the vault to troubleshoot.
Network Protector Quality Assurance: Crews bring new network protectors to the warehouse for testing according to some initial settings before acceptance into inventory. This is an initial quality assurance check to ensure no issues when the unit is installed. In addition, the Special Tester checks the equipment just before it enters service.
Technology
All PGE Network Protectors are either CMD or CM52 units from Eaton. Eaton’s CM52 Network Protectors carry a UL certification and BIL rating. They can cope with ratings between 800 and 4500 amps, and between 216 and 600 volts at 60 Hz. Eaton systems have high interrupting and fault close ratings, and the components are modular and standard across the different ratings. By using the same units, PGE reduces the need for a large part inventory and additional training for technicians and crews.
PGE uses CM52 network protectors in 125/216 and 277/480 volt Y connected secondary network systems. At PGE, the 125/216 volt systems are the area networks, while the 277/480 volt systems are the spot network locations. The systems include an air circuit breaker with an operation mechanism, network relays, and control equipment. The units are available as submersible variants and can be used standalone or mounted on the transformer throat. Submersible units are made of welded steel, which is bonderized and painted. The network protectors include an internal window that allows crews to see the internal hardware. The door can be hinged on either side [1].
CM52 units include externally-mounted, silver-sand fuses to interrupt fault currents if the networker fails to trip. Additional internal cooper-link or lead alloy fuses can be installed inside the enclosure.
On the CM52 network protectors used by PGE, fuses are mounted externally and do not include a “visual open.”
PGE is considering the use of the CM52 Arc Reduction Module System (ARMS) in future spot network locations. (Historically PGE has not used the system in part because much of the company’s in-service plant was the older CMD unit, which cannot fit with ARMS).
PGE does not use remote racking as standard because this would require complex retrofitting and modification.
Network Protector Remote Monitoring: PGE uses Eaton MPCV relays within its network protectors. The network fits with the Mint II system and has a PowerNet server platform interface. The optic fiber to the Mint II monitors is set in an H&L Fiber Loop configuration. The H&L Instruments system converts the fiber communications to the protocol used on the NPs, and vice versa.
At present, PGE only uses the system for monitoring, not for control. For example, when clearing a feeder, crews open the feeder breaker and double check through the remote monitoring that the protectors are open and that there is back-feed at the station.
PGE is assessing the Eaton VaultGard monitoring system to harden the system, using the looped fiber optic communications already installed throughout the downtown area. The reason for looking at VaultGard is that it is a web-based protocol with integrated software that allows a higher degree of control than PGE’s existing system.
Transformers: The typical transformer sizes on the grid network are 500 kVA or 750 KVA. For spot networks, transformers can be 500, 750, 1000, or 1500 kVA.
SF6 Switches: PGE has some older SF6 switches throughout the system that are being replaced with S&C Vista SF6 switches. Most are located in PGE’s radial urban underground infrastructure, but some may be used as primary switches for the network unit. PGE is verifying the integrity of the permanent pressure gauge on the switch, which is filled with SF6 and needs 8 psi (55 kPa) of pressure. Crews rely on the permanent pressure gauge if there is a tag on the switch and if it has been checked. The gauges are checked every year. The old switches do not always read the same as the calibrated gauge so they are being replaced.

Figure 7:
SF6 Primary Switch
- Instructions for the Eaton Type CM52 Network Protectors 800 to 4500 Amperes. Eaton, Moon Township, PA: 2010. http://www.eaton.com/ecm/groups/public/@pub/@electrical/documents/content/ib52-01-te.pdf (accessed November 28, 2017).
7.4.13.10 - References
EPRI Underground Distribution Systems Reference Book (Bronze Book)
7.4.14 - New Service Design
7.4.14.1 - Ameren Missouri
Design
New Service Design
People
Design of the urban underground infrastructure supplying St. Louis, including new service design, is the responsibility of the engineering group within the Underground Division, organizationally part of Energy Delivery Distribution Services, reporting to a VP. The Underground Division, led by a manager, consists of both engineering and construction resources responsible for the downtown infrastructure. The engineering group is led by supervising engineer, and is comprised of Engineers and Energy Services Consultants (commonly referred to as Estimators) who deal with planning, design, and service issues.
Engineers design the system, including network and non network vaults and manholes, size equipment, perform load flow analyses, and prepare line drawings that describe the designs. All engineering positions are four-year degreed positions. Some engineers within this group have their PE licenses, although this is not a job requirement. Engineers are not represented by a collective bargaining agreement.
The Energy Services Consultants (Estimators) take the one line designs developed by the engineers and complete the design package, including all the physical elements of the design. Estimators have a combination of years of experience and formal education, including two-year and four-year degrees, and are part of the union, IBEW.
Recently, Ameren Missouri has formed the “Underground Revitalization Department,” a team of engineers (all 4-yr degreed) focused on researching, evaluating, and developing plans for performing capital improvements to and revitalizing downtown St. Louis, including the network. Part of this group’s role includes addressing issues such as the development and update of planning criteria for the network, and the design of enhancements to the downtown area, such as developing potential designs to build a new substation to supply network load in St. Louis. Engineers who are assigned to this team will also participate in the design of spot network installations and indoor rooms.
Ameren Missouri has a Standards Group that has developed construction standards and material specifications for designs and equipment used in the network underground. These standards and specifications are used by engineers and estimators in developing network designs. Standards are available in both online and printed book format.
Process
Typically, small to medium loads 500kVA and less requiring 120/208V service are connected to the network grid. Customers with larger loads, or who request 480V service are normally served from either a padmounted transformer or an indoor substation. Padmounted services are usually not practical within St. Louis because of the downtown congestion.
The most common design for larger loads in downtown St. Louis is the indoor substation (also called “indoor room”). Most new services to larger downtown loads in St. Louis are served with a dual, primary metered feeder scheme: either two preferred feeders, or one preferred feeder and one reserve feeder. There are existing spot network services within St. Louis, but new services are not served via a spot network.
Larger customers often receive primary metered service, with Ameren Missouri providing two primary supplies to the customer. These primary supplies feed into switches, either fuses or breakers as chosen by the customer, and can be manually or automatically (auto transfer) operated. After the breakers, lines feed into the primary metering gear, and then on to the customer switchgear or transformation. Note that in this arrangement, all equipment except cable and meters are owned by the customer, including the primary switches that precede the primary metering point.
For a secondary metered customer, Ameren Missouri provides the switches and transformation that precede the metering point. In this design, Ameren Missouri may provide either a preferred and reserve feeder, or a two preferred feeder design.
In ascertaining expected customer load, Ameren Missouri will look at similar buildings to estimate demand using square footage and expected load density by customer type. They will also perform a load flow analysis to understand the impact on the system of connecting the new load. They will run both the normal and n -1 cases.
7.4.14.2 - CEI - The Illuminating Company
Design
New Service Design
People
The design of the network ducted manhole system is performed by the CEI Underground / LCI group (Design Group), part of the CEI Regional Engineering group, located in NRHQ (Northern Region Headquarters).
The group’s responsibilities include network system and non – network system designs and the development of standards for the ducted manhole system including vault and manhole design standards and customer design standards. The group prepares construction drawings for the conduit system, vaults and manholes.
Process
When CEI Underground/LCI group receives an application for a new service in an area served by the network, the engineer may involve the Planning department engineers to see if the new load addition can carry the load on the network from a particular transformer or mole. Typically a new load of less than 400kW will be connected to the network. Larger loads are served from either the 4kV or 11kV radial systems.
If the project involves just a tap, the design will be performed by the engineers within the Design Group who focus on serving customers (the LCI).
If the project involves a cable line extension, both a cable engineer, and an LCI engineer are usually involved in the design. The cable engineer would design the conduit system up to the point of the customer interface, and the LCI engineer would develop the service interface, including the transformation and switchgear.
The Underground Engineering / LCI group will perform the civil design as well.
Note that the customers served by the network do not pay a “network” rate for their electric service – their rates are the same as similar customers served by non-network infrastructure.
Technology
Engineers will prepare the required construction drawings that show the duct configurations, show the manhole design, reference standards pages, etc. Wherever possible, they will use the GIS system as a foundation for a drawing. They may show a portion of an existing vault drawing if the project involves a revision. In general, the prints they produce are very clear and well received by the Underground Group.
FirstEnergy’s CREWS system is used to develop a bill of materials and costs estimate.
7.4.14.3 - CenterPoint Energy
Design
New Service Design
(Network New Service)
People
New Services in the network are designed by the Vaults group of the Engineering Department within the Major Underground Group.
The Vaults group, led by a Lead Engineering Specialist, designs infrastructure the electrical infrastructure within vaults including network services. The group is comprised of Engineers, Engineering Specialists, and is supplemented with contractor resources.
If, in order to serve the customer, primary facilities must be extended, then the Feeders subgroup of the engineering department would be involved in the project to perform the design of the feeder extension.
Process
Customers served by the network do not pay a “network” rate for their electric service – their rates are the same as similar customers served by non-network infrastructure.
7.4.14.4 - Con Edison - Consolidated Edison
Design
New Service Design
People
Organization
Central Engineering - Responsibilities include Civil / Mechanical Engineering, Control Systems Engineering, Design Engineering, Electrical Engineering, Equipment and Field Engineering, and Environmental Engineering & Program Support.
Engineering and Planning - Responsibilities include Energy Services, Distribution Engineering, Operations Services, Marketing and Sales, Planning and Analysis, and D.C. Elimination.
Employee Development
Con Edison invests in developing its design employees through three distinct programs focused on employee development. One program is focused on the development of newer engineering employees, another at incumbent employees, and the third at bargaining unit employees who are entering the management ranks. The programs are described more fully on page 3-53 of this report. Note that these programs are not limited to design employees, but are available to all employees who qualify.
Process
The Energy Service Organization at Con Edison has various subsections that are involved in the process of responding to customer requests for service: the Service Assessment team, Engineering, Layout, and Project Management.
Service Assessment Team
The Service Assessment Team interfaces with the customer or contractor and prepares the load letter, which details the customer work request and scope of the work. They ensure that the load letter includes critical data such as type of use, commercial or residential, information on the number of units, etc. They create a project within a computer system (Commercial Operations Reporting System — CORS) used to track each project. The request then flows to Engineering.
Engineering
Within Engineering, a copy of the load letter and, sometimes, a plot plan is assigned to a senior design technician, who develops an estimated demand. These technicians apply different demand factors depending on the type of space to be served. They look at the location of the new building, look at the project plan, and determine how to provide the service. They may have to run a load flow study to determine how the grid will be affected by adding this new service. Engineering also develops information to be provided to the customer such as short-circuit current, in-rush service, etc.
The engineer looks at the project plan, and then determines whether or not a load flow must be done. Adding new customers to the 208-V secondary grid usually requires a load flow analysis. If the engineer decides that the load addition cannot be met by simply connecting the load to the grid, he or she develops a design that adds transformation to the network. Historically, load additions of 500 MW or greater require the addition of new transformers, though the utility analyzes each case to determine the best way to serve the load.
One of the challenges that Con Edison faces is dealing with “creepage.” This is a term used to describe the load creeping upwards over time, even though Con Edison may be unaware of it. For example, this phenomenon includes people adding window air conditioning, plasma TVs, and other devices that cause overall loading to increase over time with an existing customer base.
Con Edison currently doesn’t tie its meters to individual service points in their modeling system. The utility has difficulty understanding the load profiles of metered load in aggregate (an apartment building, for example). Con Edison is looking forward to the benefits of a future Advanced Metering Infrastructure (AMI) system, which will provide the ability to model aggregated loads and consider coincident demand.
Layout
After the engineering is performed, the project goes to the Layout group. The Layout group is responsible for the electrical layout and the “build,” which is the civil layout.
The Engineering tech who prepares the layout looks on their plate maps (electronic maps) to understand what facilities are already in place. The tech also looks at the sketch of the building point of entry. Sometimes the tech field-checks jobs to determine what lanes to use for conduits, etc. Layouts are performed on a micro-station using a tool called Smart Layout.
The Layout group develops the bill of material, establishes the accounting charges, and develops an hour’s estimate. At Con Edison, projects costing over $100,000 require a unique (project-specific) approval.
Con Edison uses a software system called DOCS (Division Operations Reporting System) to aid them in performing new service designs. DOCS is a work management system that the field and engineering use to define the elements of the job, resources, and the costs. This system is based on assembly units. They call for a device, and the material and labor associated with that device rolls up beneath it.
Con Edison develops a design that meets the customer’s needs. If customers desire additional capacity beyond their needs, the customers are required to pay the difference in cost. For example: A customer requests service for 4 MW of load. Let’s say that after Con Edison analyzes their loading, factors in diversity, etc., Con Edison determines that, in fact, the customer only requires 2 MW of capacity to meet their load demands. Con Edison would develop a design that meets the 2 MW need. Should the customer want service for 4 MW, the customer would be required to pay Con Edison for the incremental cost to service 4 MW. This is done either through a front-end payment, (which is reimbursed if the customer actually meets 4 MW), or through a minimum demand charge.
Project Management
Energy Services has two project manager positions — the CSR Project Manager, who manages smaller projects less than 1000 kW, and the CPM Project Manager, who manages larger projects, 1000 kW and greater.
The CSR and CPM Project Managers receive the layout and issue work orders to construction management (for contracted work) and electric operations to execute the project. They ensure that the customer gets service on time. They coordinate dates, check the customer’s work to make sure it makes sense, ensure that the termination points are adequate, obtain city approvals, etc.
7.4.14.5 - Duke Energy Florida
Design
New Service Design
People
Design of new services in the urban underground centers in Clearwater and St. Petersburg is performed by the Distribution Design Engineering group, which works out of offices in both cities. The groups are responsible for designing new and refurbished network designs, as well as underground radial and looped distribution designs. The Distribution Design Engineering group is led by a Manager, Distribution Design Engineering, and is organizationally part of a Distribution Design Engineering Group responsible for Duke Energy Florida’s Coastal region, led by a Director.
The Design Engineering group is comprised of two sub - groups: an Engineering group, comprised of degreed engineers, and a Technologists group, comprised of non-degreed Network Technologists. Work within the Design Engineering group, both in Clearwater and St. Petersburg, is assigned geographically, such that a designer (either an Engineer or a Technologist) is responsible for both network and non-network designs within an assigned geographical area. Some designers focus on commercial customers, while others focus on residential customers. For example, the St. Petersburg design group has two engineers that focus on commercial designs – both engineers have four-year engineering degrees.
The criteria for choosing non-degreed Technologists may include years of experience, and for new job postings, at least a two-year degree in electrical technology. The existing group has individuals with varied experience, including distribution operations, control, and transmission.
The Design group is experiencing a large turnover in its Engineering staff, as a number of employees with many years of experience are retiring. A challenge for the group as positions turnover will be acquiring new resources with design experience.
Network design standards are contained in the “Duke Energy Florida Section 29; Networks, Vaults, and Transclosures.” (See Attachment D .)
Process
Both downtown St. Petersburg and Clearwater are experiencing moderate growth. Most new work is designed with a non-network design. More specifically, most new larger buildings are designed with a primary and reserve looped feeder scheme, with an automated transfer switch (ATS), and fed through Duke Energy Florida’s ducted manhole system.
Design engineers typically perform preliminary research on circuit loads before design, but also work closely with Planners to make final design decisions with respect to anticipated circuit capacity. The Planners decide the scope of work from a macro level, such as determining, for example, where a feeder should be split to supply new load. A design process example cited by Duke Energy Florida personnel was the recent addition of two high-rise buildings in St. Petersburg. The existing network feeders there were projected to be overloaded with the addition of the new building load. The Design Engineers consulted with the Planning team (see Planning in this document), who performed modeling studies to determine whether the Designers could extend an existing feeder or needed to install a new feeder to the location to meet anticipated capacity requirements.
The Design Engineers perform the detailed design including selection of materials, and the project layout, including the cable route. The Design Engineer will inspect current GIS maps and perform site visits to manholes to inspect condition and duct line configuration to determine whether there is ample room to pull new cable.
One of the first steps in the design process is a thorough field investigation to find out what is currently in the manholes and duct lines, and to make certain it is mapped correctly in the current GIS. Field inspections are performed by Network Specialists under the supervision of a Network Design Engineer.
Any updates required to the GIS maps, as determined by inspection, are red-lined and submitted to the GIS technicians for input into the electronic system. The Network Designers have found that these field inspections and on-site red-line updates of the GIS are essential since the GIS mapping of the urban underground system and, in particular, the network, is out of date. The inspections serve two purposes: first they are necessary to understand field conditions and complete new service designs, and secondly, they serve to update the GIS, which is foundational to the company’s Outage Management System (OMS).
Note that Duke Energy Florida’s GIS system does not provide a true representation of the network system, detailing all primary and secondary feeders. Accurate, detailed maps of this infrastructure are maintained within the Network Group, and are separate from the company GIS (see Mapping). Hand-drawn manhole drawings, which are kept up to date by the Network Group and are currently the most accurate record of the manhole configuration, are in the process of being entered into the GIS. From within GIS, PDF versions of the manhole drawings can be accessed.
After inspection and GIS updates, the Design engineers complete design work using an online design system (a WMIS system, by Logica) that provides the ability so select compatible units (CU) for network infrastructure that includes estimated costs of labor and associated materials. This system produced a cost estimate and bill of materials. Design drawings are prepared online using the GIS system as a base, using a “red line” file. Final input acceptance of the as built “red-line” drawing is incorporated into the permanent GIS record by the GIS team.
Vault Design
Network vault designs, including vault dimensions and characteristics, and placement of required switchgear, network protectors and transformers, etc., are created one at a time, according to the location and design requirements at the site. Since there has been very low demand for new vaults, this custom design approach to vault design works effectively. All underground vault transformers are specified as submersible units, yet maintained as “dry,” with sump pumps installed in all vaults. Vault design standards are contained in the “Duke Energy Florida Section 29; Networks, Vaults, and Transclosures.” (See Attachment D ).
Final Designs: Peer Review
Final designs are submitted for a peer review, normally performed by senior design engineers, and – for network projects - network specialists. Circuits, project layout, CUs selected, etc. are checked against Duke Energy Florida standards by the peer reviewers and if any changes are required, they are sent back to the Designers. Peer reviewers are especially concerned with the “ constructability ” of any designs in a given area. The peer-review process includes online and informal meetings between the peer reviewers and the designers – this provides checks and balances throughout the design process. It is notable that the implementation of the peer review process was a direct result of feedback from the field.
When the design passes peer-review, and is below a certain dollar amount ($50,000), it can proceed directly to construction. If it is a higher cost project (above $50,000), it must go to management for review and sign-off. Anything above $100,000 must be reviewed by a Director. In most network designs, a customer charge (CIAC- contribution in aid of construction) is levied before work begins. Duke Energy Florida calculates the appropriate CIAC on a case by case basis, by determining the difference in cost between the estimated cost of its normal and customary radial design and the estimated cost of the proposed underground work. A Work Order is created once the Design passes peer review and customer charges are received.
Material and Component Ordering
For the purposes of performing the design, Duke Energy Florida has established compatible units (CUs) for certain network components that include material and labor estimates. Some of the high cost items with long lead times, however, are not included as CUs in the design system (Real-Time Adaptive Resource Management or RTArm, by Logica), such as network transformers. These items must be ordered “outside” the existing system. At the time of the immersion, approximately 80% of the network CUs were available, with 20% of network components having to be special ordered.
Once the Design has been final approved, it goes to a Construction/Maintenance Specialist to review the Work Request and make certain that the proper material and component CUs have been requested. The Construction/Maintenance Specialist must double check and order the CUs indicated in the final design/work order. The Construction/Maintenance specialist may add CU’s to better reflect the labor and material requirements of the project.
One challenge for Duke Energy in utilizing CUs for network projects is the variability in requirements for network labor, making it difficult to assign a particular labor estimate to a work type. In order to better estimate a network project, labor CUs may need to be entered into the system to cover activities such as the need to pump water out of flooded manholes.
Manholes, Network Feeders
In manholes, primary feeders are usually mounted on cable racks in the lower part of the manhole, while secondary cabling is mounted above, higher in the manhole. Many existing manholes contain three primary feeders in one manhole. The designers realize the placing of multiple feeders in one manhole increases the exposure and consequences of an event occurring in that manhole. Thus, for newer designs, designers strive to minimize the number of feeders in any one manhole hole. In underground radial designs, cables are routed to avoid a single-point-of failure by using looped cables from pull boxes.
All network feeders in downtown Clearwater (supplying a true 125/216V network) have their own network cable manholes/duct lines (not shared with non-network circuits).
Technology
Duke Energy Florida uses GIS system for mapping of the entire electric grid — radial as well as network. Note that Duke Energy Florida ’ s GIS system does not provide a true representation of the network secondary. Users of the GIS can access PDF drawings of manhole prints that detail manhole and vault infrastructure.
Duke Energy Florida is in the process of updating its GIS system records to fully represent network infrastructure. Duke Energy Florida is also migrating to a new GIS system, GE Smallworld.
Duke Energy Florida uses a Work Management Information System (WMIS), by Logica (now part of CGI). RTArm, by Logica, is used for material and component tracking and ordering, as well as assigning job hours for projects.
7.4.14.6 - Duke Energy Ohio
Design
New Service Design
(Engineering and Urban Development)
People
Network design is performed by two Designers who are part of the Distribution Design department. This department performs all distribution design work for Duke’s Ohio and Kentucky utilities.
The two designers, called Customer Project Coordinators (CPCs), who focus on the Cincinnati network, work closely with the Network Project Engineer, also part of the Distribution Design organization. These CPCs design customer driven changes and additions to the network system including the design of secondary buss work, transformer sizing, and network protector sizing. They work closely with the network Project Engineer to design system reinforcement projects.
In addition to working closely with the network Project Engineer, these CPCs work closely with the Planning Engineer focused on the network. For example, they will check with the Planning Engineer to assure the network can accommodate a load increase.
The CPC’s also work closely with construction crews. These crews need to be present when the CPC’s gain access to faults. Consequently, there is communication between the CPC’s and field crews on a daily basis. The CPC’s have a good working relationship with the field.
The two CPC’s also act as “key contacts” for customers other than major customers. Major customers have a separate key contact representative at Duke although many of the questions that arise from these major customers are ultimately answered by the two CPC’s.
The CPC’s are two-year degreed engineers.
Process
Duke Energy Ohio has a defined geographic area served by the secondary network system. Virtually all the load within that geographic boundary is served by the secondary network.
Duke Energy Ohio does not have a network service rate. Customers served by secondary network pay the same rates as customers served off of the non-network system. An exception is that Duke Energy Ohio has a three phase residential rate available within their network.
Much of the engineering work in the network is system reinforcement work driven identified by Duke. When new customer additions do arise within the boundaries of Duke Energy Ohio’s defined network, Duke Energy Ohio will decide whether or not to put the new load on the network system. While most load within the network boundary is served by the secondary network, Duke has made decisions not to put certain new load on the network, even when the load edition occurs within the network geography. An example is the “Banks" area of Cincinnati. This area is being redeveloped, with the majority of the load to be residential. Consequently, Duke Energy Ohio elected to serve this redeveloped area with a URD radial fed system, rather than add the load to the network secondary system.
A Duke engineer noted that having a firm geographic boundary for their network, makes it easier to respond to or reject special requests. For example, a building owner within the network boundary may not want to provide a vault, and request a radial type service. Duke can resist or reject this special arrangement, as they would not allow a radial service fed off of a network feeder.
Customer costs for connecting to the network system depend on the size of the load edition. Duke Energy Ohio performs a revenue test, comparing anticipated revenue with the costs. If the revenue of the new load edition is not enough to recover the costs, the customer will have to make a contribution. Duke will either collect this contribution upfront, or prepare an agreement with the customer requiring payment due after construction is completed.
Duke Energy Ohio designers (CPCs) will obtain load information from the customers. Using an Excel program, they will adjust the customer provided loads, considering diversity, to develop an estimated demand. From this, Duke will determine how many transformers/network protectors will be required to serve the new load. The CPC’s will provide the customer with a document that describes Duke’s requirements in terms of vault design. (See Design - Vault - Manhole Design ) The CPC’s will prepare the required engineering drawings, and bills of material.
Duke Energy Ohio’s CPC’s work closely with the customer to design building vaults. Much of the ultimate design tends to be dictated by the customer. Duke is considering developing a more standard vault design that they can provide to customers, although the knowledge it will be difficult to enforce customer compliance with the standard. (For example, a customer may not be willing to, or be able to provide the physical space required by the Duke standard)
Technology
The network distribution designers (CPCs) prepare an AutoCAD drawing. To develop the bill of material, they use a system called JET. Within this system they can pull the required material from an overall list of materials. By doing so, the JET system generates a cost estimate.
At the time of the EPRI immersion, Duke Energy Ohio was in the process of installing a system called Expert Designer (Bentley) , that will be used in the future for network design. Within Expert Designer, CPCs will use MicroStation to design and build the cost estimate for the job. The system will be tied to Duke’s EMACs system, which is used to order materials, and set up the billing for the customer. Duke Energy Ohio does have the ability to import customer drawing into their design system. Note that Duke Energy Ohio does not yet have connectivity between their GIS data for the network and their design systems.
7.4.14.7 - Energex
Design
New Service Design
People
The Systems Engineering group, led by a group manager, and part of the Asset Management organization is responsible for establishing design standards for the distribution network. Energex also has a Design organization within its Service Delivery organization, also led by a group manager, and responsible for performing designs of specific projects, including new service projects.
The Design group is comprised of four-year degreed engineers, with some assigned a focus on the distribution system. These designers are geographically situated at 15 different “hub” locations throughout its territory. They are distributed geographically to be close to the field, but the assignment of work is not strictly geographic, with work often assigned based on work peaks and troughs.
Design classification includes electricity supply design advisors who are the people who perform the job layouts. These advisors are not degreed engineers, but they are able to apply the standards and lay out the projects using the Energex design tools, such as AutoCAD.
Process
For a new project in the CBD, the Planning group would likely have the first contact. The project would be initiated by a customer request, such as a new high-rise in the CBD. The planning engineer would be responsible for understanding the anticipated demand (load) of the new customer, comparing that to the available capacity, and whether any reconfiguration or upgrade of the system is required.
As part of the analysis, the planning engineer would also look into the customer’s requirements, including any payments required by the customer. Customers must supply a room (vault) for the medium-voltage substation that meets Energex’s requirements, including fire ratings, ventilation, and alarms. Note that while the costs of dedicated transformers and secondary can be passed on to the customer, the costs of the mesh 11kV system, including any required upgrades, are borne by the entire customer base as defined by regulatory agreements.
The output of the planner’s work is a project scope document that includes a one-line diagram that outlines how the customer is to be served (i.e., number of transformers, switches, and where to tap into the existing 11kV mesh), and a letter of offer and contract with the customer.
The project flows to a design project coordinator, who leads the project, and whose role is to assure that nothing slips through the cracks. This person assigns and coordinates the various resources that are brought to bear on completing the project.
A project designer is responsible for the design of the project. The designer develops a specific project design, as well as costs estimates for the project. Design considerations include whether to utilize relay controlled circuit breakers as part of the meshed design, or whether the customer load is small enough to supply with a “T” off the main circuit to a ring main unit. Note that the CBD meshed 11 kV design using relay controlled CBs can quickly escalate costs. The designer lays out the 11 kV cabling design, as well as the low-voltage distribution board (secondary bus from which the LV system emanates). SCADA engineers may be involved in the project if there be a need to pull fiber into the new location. Engineers are assigned to address issues such as the design of the protective relays, pilot cables, control systems, grounding (earthing), etc.
Technology
AutoCAD, load flow analysis software, and project management software are used in the initial planning and implementation of new service.
7.4.14.8 - ESB Networks
Design
New Service Design
( LV Designs)
People
Organizationally, the design of both MV and LV infrastructure is performed by designers located within the Network Investment Management groups for larger designs, and within the ESB Networks Regions for the smaller designs. The Network Investment Management groups (North and South) are part of the Asset Investment group, within Asset Management. The Regions are organizationally part of the Operations Management Group, also part of the Asset Management organization.
For most designs, the design is performed by an Engineering Officer – the designer position at ESB Networks.
The development and maintenance of guidelines for performing MV and LV network design are the responsibility of the Specification Management group, part of the Asset Investment group, also part of the Asset Management organization at ESB Networks.
The Specifications Management group has developed thorough guidelines for the design of LV and MV networks. This guideline includes specific direction for optimizing designs.
Note that in addition to the Operations Management and Asset Investment groups, the Asset Management organization consists of Program Management, Infrastructure Stakeholder Management, Assets & Procurement, and Finance & Regulation. These groups work closely together to manage the asset infrastructure at ESB Networks.
Process
ESB Networks serves 90,000 rural customers with LV service by mini-pillar overhead (above ground) joint boxes on a pedestal. (Note, note that in Dublin, submersible junction boxes are utilized). Service to the mini-pillars is delivered through a low voltage network supplied from MV 200/400/630-kVA substations that include a ring main unit, LV panel, and transformer. These “all-in-one” units are only 11 cubic meters in volume, and transformers can be replaced without replacing the LV panel or ring main unit. ESB Networks practice is that these MV units are supplied by a main feeder at MV, 10kV 20kV.
LV cables are taken to the customer border, where builders are required to connect the customer. ESB Networks provides an Electrical Supply book for builder guidance. Note that most customers are served by the LV infrastructure (see Figure 1 through 3), and builders or contractors are required to connect customers to service within ESB Networks-specified guidelines. ESB Networks service is taken from the customer boarder and clipped or “cleated” to the house by the builder. ESB Networks provides a MV (primary) service to larger customers, usually with loads in excess of 500 kVA.

Figure 1:
Connection of standard LV house service with ESB Networks specifications

Figure 2:
Mini pillar on site

Figure 3:
Mini pillar, internal view
7.4.14.9 - HECO - The Hawaiian Electric Company
Design
New Service Design
People
New services are designed by the Customer Installations Department (CID). The CID is comprised of three divisions – Administration, Meter, and Planning and Design.
The Administration division, comprised of ten resources performs administrative tasks on behalf of the department. The Meter division, comprised of fifteen resources, installs meters and performs meter testing.
The Planning and Design division is comprised of 25 planning and design resources who design all new service projects from single family homes to large skyscrapers. These resources include Junior Customer Planners, the entry level position in the division, Customer Planners, and Design Planners, all represented by a collective bargaining agreement (Union positions). The Division also employs a full time drafter position, and Electrical Facility Technicians (EFT’s) who assist customers with obtaining permits, identifying existing as – built plans, and perform other research and administration associated with jobs involving excavations. The division also employs CID Engineers (non bargaining) who perform designs for larger (>500kW) service requests.
Process
The new service process starts with a potential customer completing a service request. If the project is small, the customer himself may submit the service request. For larger projects, it is typically an electric service contractor who submits the request. The request is made up of the customer’s application, plans, elevations, and a projected load sheet. The request includes information such as the date service is required, the service voltage, and, through the load sheet, an estimated load / demand. Note: Much of the application information / and load sheet information is available to customers at the HECO website, HECO.com.
New service requests are received by a central administration group (not part of CID) where the application is entered into HECO’s CIS system and assigned a tracking number. Projects are assigned to different individuals within CID depending on their size and location. For example, projects with anticipated loads of greater than 500kW are typically assigned to a CID engineer. Subdivision requests are forwarded to the department supervisor[1] .
All service requests with loads of greater than 100kW are reviewed by a CID engineer in order to make the load projections more realistic. HECO has found that anticipated load projections are often overstated by applicants.
The CID group will perform field investigations and prepare the layout to service the new load. They may submit requests to the Distribution Planning Division to assure that there is available capacity on a given circuit to serve a new load.
The CID group would also design new service connections in the network, where the service involves tapping of existing network facilities. If a new vault location is required for a network service (quite rare), the T&D Engineering Division would perform the design. Note: HECO uses cable limiters on service taps from the street grid. Cable limiters are only used on the customer end of the service if the service terminates in a bus room; otherwise, the service would feed into the customer breaker.
HECO’s line extension policy requires the customer to bear any costs of the extension that exceed an anticipated 60 months of revenue. Underground line extension costs include a calculation of the cost differential between underground and overhead – this differential is included in the cost estimate that is compared to the anticipated revenue to determine the customer contribution. The customer also bears the cost of providing the concrete encased conduit / duct back for the primary, and conduit on for the services, all the way to the meter entrance.
Technology
The CID Planning and Design division will prepare the required construction drawings. Drawings are either prepared by hand or laid out in Microstation. HECO’s GIS system may be used to find a point of connection, but is not being used as a base for construction drawings.
The Bill of Materials, and cost estimates are developed by using HECO’s Standard Material Unit (SMU) system, a legacy system.
[1] For subdivision requests, the developer will often hire an electrical consultant who lays out the infrastructure and duct bank configuration and provides a design to HECO. There are several established contractors who know the HECO system and HECO policies well.
7.4.14.10 - National Grid
Design
New Service Design
People
There are two designers who perform network designs for the National Grid Albany network.
One designer (a Design Investigator) focuses on designing smaller new services connections to the network, 800 amps and below. This individual has a two year degree, though the degree is not mandatory for the position. This designer has field experience as both a cable splicer and maintenance mechanic. This designer also performs some non- network UG and overhead service designs.
The other designer (a Designer C) performs all larger and more complicated network designs, including network reinforcements, large new services projects greater than 800 A, and vault designs. This individual has a two-year degree, a requirement for the position. This designer also performs non – network UG designs.
Organizationally, both designers are part of the Distribution Design organization, led by a manager, and part of the Engineering organization at National Grid. This organization is structured centrally, with resources assigned to and in some cases physically located at the regional locations. The designers who support the Albany network are both physically located at the NYE building in Albany.
Both designers are represented by a collective bargaining agreement. The Design Investigator and Designer classifications are two different classifications with different progressions.
Both designers work very closely with the field engineer, part of Distribution Planning, assigned to the underground department to support the Albany network.
National Grid will determine the appropriate service type for a customer based on their load, criticality and location. There have been times where they have asked a customer to accept network service (a sports arena, for example). National Grid Albany does not use a separate rate for network customers.
Process
The National Grid Albany network secondary system is confined to a certain geographic boundary within Albany. Typically, small to medium loads requiring 120/208V service will be connected to the network grid. Customers with loads > 800 kVA will typically receive a 277/480 V spot network service. National Grid designs spot networks to n-1 for peak load.
Most National Grid spot network vaults are located underground, rather than in building vaults. Some spot networks are at grade level or on building roofs. The buildings will supply the vault, providing space, lighting and ventilation.
In the National Grid vault design, the collector bus is supplied by the customer and located in a separate vault, with the customer’s equipment. National Grid runs secondary cables from the spot network units, through conduits and makes the secondary connections on the customer collector bus. National Grid uses cable limiters on secondary cables feeding from the network protector to the customer.
All other non - network loads are served by radial distribution systems. These distribution systems are primarily radial underground distribution with a preferred feeder / alternate feeder design, fed through a manhole / conduit system.
Much of the existing primary and secondary system is built with PILC cables. National Grid’s current standard calls for EPR insulated primary cables. The secondary cable standard calls for EPR insulated cables with a Hypalon (low smoke) jacket.
7.4.14.11 - PG&E
Design
New Service Design
People
A new customer who wishes to connect to the PG&E network system applies for service to the Service Planning Department. A Service Planning representative is assigned to interface between the customer and the planning engineers within the Planning and Reliability Department, who are responsible for design. The service planning representative acts as a key account manager. The planning engineers also work closely with project estimators who develop cost estimates and determine whether the design laid out by the planning engineer is workable in the field.
Process
The Service Planning Department gathers loading information. They are familiar with the electrical system and can determine whether the customer will be best served by the network or radial system. Planning engineers also perform a load flow analysis to understand the impact on the system of the additional load under both the normal and n-1 cases.
Technology
Typically small to medium loads, 500VA and less requiring 120/208V service will be connected to the network grid. Loads from 500VA to 1MW will get a 120/208V spot. Loads greater than 1MW typically receive a 277/480 V spot network service.
7.4.14.12 - SCL - Seattle City Light
Design
New Service Design
People
Organization
Network Design at SCL, including the design of new services, is performed by the Network Design Department, which is part of Energy Delivery Engineering. See Attachment A . The Network Design Department performs all planning and design of SCL’s networks.
The Network Design Department is made up of eight “System” engineers, who do all of the design for the network, and eight “Services” engineers, who interface with the customers, gather load information, coordinate construction activity, etc. The individuals in this group are four-year degreed engineers. Some have their PE licenses.
The engineers at SCL are represented by a collective bargaining agreement (IBEW, Local 17).
Documentation
SCL utilizes a Network Construction Guideline that includes sections that inform design and
construction. The guideline contains sections for:
-
Safety
-
General items, such as voltage and current tables for cables
-
Drawing standards
-
Cable installation and testing
-
Services
-
Cables, bus bars and secondary taps
-
Primary splices and terminations
-
Transformer installation and vault preparation
-
Duct and pole risers
-
Vaults and handholes
-
Streetlights
-
Meters
SCL’s guideline can be accessed at seattle.gov
Process
SCL serves customers from its existing 208 and 480 V secondary networks. Spot network services to new large load buildings are normally supplied at 480 V. Note that about 80% of new load is served as a spot network, rather than tapping the existing network secondary.
SCL performs a feeder load analysis as part of their Feeder Assignment process in response to an anticipated new load. The term “Feeder Assignment” means determining which feeder or feeders will serve a new network load. A Network Services engineer requests the feeder assignment based on a new or supplemental load need.
The System Engineer within the Network Design department performs an analysis to determine the best scenario for serving the new load. This analysis includes ensuring that the network design criteria are met, and that any feeder imbalance is restricted to less than 20%. See Attachment B , for a flow diagram of the Feeder Assignment Process.
7.4.15 - Non-Network Design
7.4.15.1 - Ameren Missouri
Design
Non-Network Design
People
Design of non network infrastructure for supplying downtown St. Louis customers, such as “indoor room” designs, is the responsibility of the engineering group within the Underground Division, organizationally part of Energy Delivery Distribution Services, reporting to a VP. The Underground Division is led by manager, and consists of both engineering and construction resources responsible for the downtown infrastructure. The engineering group, led by a supervising engineer, is comprised of Engineers and Energy Services Consultants (commonly referred to as Estimators) who deal with planning, design, and service issues.
Engineers design the system, including non-network designs, performing equipment sizing, load flow analyses, and preparing line drawings that describe the designs. All of the engineering positions are four year degreed positions. Some engineers within this group have their PE licenses, although this is not a job requirement. Engineers are not represented by a collective bargaining agreement.
The Energy Services Consultants (Estimators) take the one line designs developed by the engineers and complete the design package, including all the physical elements of the design. Estimators have a combination of years of experience and formal education, including two-year and four-year degrees, and are part of the union, IBEW.
Recently, Ameren Missouri has formed the “Underground Revitalization Department,” a team of engineers (all 4-yr degreed) focused on researching, evaluating, and developing plans for performing capital improvements to and revitalizing downtown St. Louis, including the network. Part of this group’s role includes addressing issues such as the development and update of planning criteria for the network, and the design of enhancements to the downtown area, such as developing potential designs to build a new substation to supply network load in St. Louis. Engineers who are assigned to this team will also participate in the design of spot network installations, and indoor rooms.
Process
Customers with larger loads, or who request 480V service are normally served from either a padmounted transformer or an indoor substation. Padmounted services are usually not practical within St. Louis because of downtown congestion. The most common design for larger loads in downtown St. Louis is the indoor substation (also called “indoor room”).
Most new services to larger downtown loads in St. Louis are served with a dual primary feeder scheme: either two preferred feeders, or one preferred feeder and one reserve feeder. There are existing spot network services within St. Louis, but new services are rarely served via a spot network. (Ameren Missouri does not provide new spot network services, but may rarely serve a customer via and existing spot.)
Larger customers often receive primary service, with Ameren Missouri providing two primary supplies to the customer. These primary supplies feed into switches, either fuses or breakers as chosen by the customer, and can be manually or automatically (auto transfer) operated. After the breakers, lines feed into the primary metering gear, and then on to the customer switchgear or transformation. Note that in this arrangement, all equipment except cable and meters are owned by the customer, including the primary switches that precede the primary metering point.

Figure 1:
Preferred / Reserve feeder Scheme Primary Switchgear

Figure 2:
Preferred / Preferred Scheme Primary Switchgear

Figure 3:
Preferred / Preferred Scheme Primary Switchgear

Figure 4:
Preferred / Preferred Scheme Transformation
For a secondary metered service from an indoor sub, Ameren Missouri would provide the switches and transformation that precede the metering point. In this design, Ameren Missouri may provide either a preferred and reserve feeder, or a two preferred feeder design.
The preferred/ reserve feeder design is a single transformer design. In the preferred/reserve feeder design, the loss of the preferred feeder causes the customer’s load to be transferred (either manually or automatically) to the reserve feeder.

Figure 5:
Preferred / Reserve feeder Scheme Transformer
In the preferred / preferred feeder design, the customer would continue to be supplied by the remaining feeder after the loss of one feeder.
Ameren Missouri plans to N -1 in St. Louis. Every feeder has both normal customer commitments and reserve commitments. Reserve feeders are planned in such a way that they will anticipate a certain amount of reserve commitment. When engineers perform contingency analysis, they model the system and run studies to ascertain if they can pick up load within the emergency rating of the reserve feeders. When they model the system with one feeder out, the models enable them to simulate customer load being connected to reserve features.
The customer is responsible for providing the indoor substation vault to Ameren Missouri specifications including:
-
Space in the room for required equipment
-
Doors (3 hr fire rated)
-
Space for ventilation
-
Lighting
-
Pulling eyes
-
Oil retention tank
-
Ground Grid
Ameren Missouri encourages, though doesn’t require, customers to tie their building ground in with Ameren Missouri’s ground system. Most customers do.
The vault ventilation system is separate from the building ventilation system. Ameren Missouri does not require or permit supplemental forced ventilation. Rather they work with the builder to assure that the louvers are big enough to have adequate ventilation without forced air.
7.4.15.2 - CEI - The Illuminating Company
Design
Non-Network Design
People
The design of the non – network ducted manhole system is performed by the CEI Underground / LCI group, part of the CEI Regional Engineering group, located in NRHQ (Northern Region Headquarters).
The group is comprised of Engineers (5) and Design Technicians (3). The department currently includes two younger employees brought into the department in anticipation of retirements, so that departmental knowledge is preserved.
The majority of the design of both the network and non-network systems is done in house. Underground network / non- network design is seldom outsourced at CEI.
The group’s responsibilities include network system and non – network system designs and the development of standards for the ducted manhole system including vault and manhole design standards and customer design standards. The group prepares construction drawings for the conduit system, vaults and manholes.
Process
The Cleveland downtown area is fed from three substations - Lakeshore, Hamilton, and Horizon. CEI has a large ducted manhole system that provides radial non – network service to the majority of customers in the Cleveland area. More specifically, they provide the following design types:
-
33 kV sub transmission feeding larger customers and distribution substations
-
11 kV sub transmission, serving the majority of large urban customers, with multiple feeds, through a ducted manhole system
-
13.2 kV – distribution voltage serving customers radially (prevalent in overhead and URD distribution, but they have some limited 13.2 distribution in the ducted manhole system, including feeder exits at the stations)
-
4340 V (4kV) delta – distribution voltage serving customers radially in a ducted manhole system. This is the most prevalent design type in the Cleveland area.
The Underground system consists of about 2000 miles of cable and 10,000 manholes.
Much of the CEI underground system is build with lead (PILC) cables. CEI has about 1550-1600 miles of PILC installed. The new cable standards include both EPR and XLP cable types. Typically, CEI uses EPR Cables when transitioning from lead to non – lead cable. Substation Feeder exits are typically designed with 750 AA XLP cables.
Similar to their approach to network design, if the non-network project involves just a tap, the design will be performed by the engineers within the Design Group who focus on serving customers (the LCI group). If the project involves a cable line extension, both a cable engineer, and an LCI engineer are usually involved in the design.
CEI’s line extension policy requires the customer to pay 40% of the costs for the line extension upfront[1] .
See Network design - Process
Technology
Engineers will prepare the required construction drawings that show the duct configurations, show the manhole design, reference standards pages, etc. Wherever possible, they will use the GIS system as a foundation for a drawing. They may show a portion of an existing vault drawing if the project involves a revision to an existing vault. In general, the design drawings they produce are very clear and well received by the Underground Group (field).
FirstEnergy is using a home grown system called Crews to develop a bill of materials and cost estimate for system designs. This system uses assembly units (called “compatible units” or “macro units” at FirstEnergy) which aggregate materials and cost estimates for certain construction unit types (single phase tangent structure pole top, as an overhead example). For underground system designs, FirstEnergy is in the process of adding underground compatible units to their system so that they can fully utilize Crews for underground designs.
[1]This line extension policy is subject to change based on a proposal before the PUCO
7.4.15.3 - CenterPoint Energy
Design
Non-Network Design
People
Major underground design at CenterPoint is performed by the Engineering Department contained within the Major Underground Group. This includes non – network designs such as running a main feeder and a back up feeder. The Engineering department is led by a Manager and is comprised of four main sub groups.
One sub group is a technical group that includes the engineers who design the protection schema and remote monitoring systems in the underground.
Another sub group, the Padmounts group, deals with the design of three phase pad mounted transformer installations, including looped commercial developments. This group is comprised of Engineers, Engineering Specialists, and is supplemented with contractor resources.
Another sub group, the Vaults group, focuses on vault designs, interfacing very closely with the Key Accounts Consultants (also part of Major Underground) who interface with large customers. This group is comprised of Engineers, Engineering Specialists, and is supplemented with contractor resources.
The final subgroup, the Feeders group, is focused on distribution feeder design. This group focuses on both network and non network feeders. This group is comprised of Engineering Specialists, Engineering Technicians, and is supplemented with contractor resources.
Process
CenterPoint uses various designs to serve urban load depending on the location, service voltage, load requirements, customer needs. Design types include network services, such as a 120/208V network grid system, and low and high side spots.
Similarly, CenterPoint also uses various non network designs to meet customer requirements. A common design is running multiple 12.4 kV primary feeds into a building vault, one normal and one back up, with either a manual or automatic throw over between the primary feeders, and supplying a 120/208 V or 277/480 V service to the customer through a CenterPoint owned transformer. CenterPoint maintains ownership of the transformer (s) in the customer’s vault in most cases. Electrically, the two feeders first come to a disconnect point. This can be a “feed through” connection, 600A blade type disconnects, or motor operated switches and vacuum interrupters.
In some cases CenterPoint uses an automatic throw over switch that will “throw” the load over onto the other feeder if one feeder is interrupted.
CenterPoint works closely with customers to try to meet their needs and often will customize their designs accordingly. Customers are responsible for the costs of any additional infrastructure they desire beyond a standard level of service provided by CenterPoint.
Technology


Figure 1 and 2:
Disconnects, Various design types


Figure 3 and 4:
Disconnects, Various design types
7.4.15.4 - Duke Energy Florida
Design
Non-Network Design
People
Non-network design in the urban underground centers in Clearwater and St. Petersburg is performed by the Distribution Design Engineering group, which works out of offices in both cities. The groups are responsible for designing new and refurbished network designs, as well as underground radial and looped (non-network) distribution designs. The Distribution Design Engineering group is led by a Manager, Distribution Design Engineering, and is organizationally part of a Distribution Design Engineering Group responsible for Duke Energy Florida’s Coastal region, led by a Director.
The Design Engineering group is comprised of two sub - groups: an Engineering group, comprised of degreed engineers, and a Technologists group, comprised of non-degreed Network Technologists. Work within the Design Engineering group, both in Clearwater and St. Petersburg, is assigned geographically, such that a designer (either an Engineer or a Technologist) is responsible for both network and non-network designs within an assigned geographical area. Some designers focus on commercial customers, while others focus on residential customers. For example, the St. Petersburg design group has two engineers that focus on commercial designs – both engineers have four-year engineering degrees.
The criteria for choosing non-degreed Technologists may include years of experience, and for new job postings, at least a two-year degree in electrical technology. The existing group has individuals with varied experience, including distribution operations, control, and transmission.
The Design group is experiencing a large turnover in its Engineering staff, as a number of employees with many years of experience are retiring. A challenge for the group as positions turnover will be acquiring new resources with design experience.
Process
Both downtown St. Petersburg and Clearwater are experiencing moderate growth. Most new work is designed with a non-network design. More specifically, most new larger buildings are designed with a primary and reserve looped feeder scheme, with an automated transfer switch (ATS), and fed through Duke Energy Florida’s ducted manhole system.
Design engineers typically perform preliminary research on circuit loads before design, but also work closely with Planners to make final design decisions with respect to anticipated circuit capacity. The Planners decide the scope of work from a macro level, such as determining, for example, where a feeder should be split to supply new load. The Design Engineers perform the detailed design including selection of materials, and the project layout, including the cable route. The Design Engineer will inspect current GIS maps and perform site visits to manholes to inspect condition and duct line configuration to determine whether there is ample room to pull new cable.
One of the first steps in the design process is a thorough field investigation to find out what is currently in the manholes and duct lines, and to make certain it is mapped correctly in the current GIS. Field inspections are performed by Network Specialists under the supervision of a Network Design Engineer.
Any updates required to the GIS maps, as determined by inspection, are red-lined and submitted to the GIS technicians for input into the electronic system. The Network Designers have found that these field inspections and on-site red-line updates of the GIS are essential since the GIS mapping of the urban underground system and, in particular, the network, is out of date. The inspections serve two purposes: first they are necessary to understand field conditions and complete new service designs, and secondly, they serve to update the GIS, which is foundational to the company’s Outage Management System (OMS).
After inspection and GIS updates, the Design engineers complete design work using an online design system (a WMIS system, by Logica) that provides the ability so select compatible units (CU) for infrastructure that includes estimated costs of labor and associated materials. This system produces a cost estimate and bill of materials. Design drawings are prepared online using the GIS system as a base, using a “red line” file. Final input acceptance of the as built “red-line” drawing is incorporated into the permanent GIS record by the GIS team.
Final designs are submitted for a peer review, normally performed by senior design engineers, and – for network projects - network specialists. Circuits, project layout, CUs selected, etc. are checked against Duke Energy Florida standards by the peer reviewers and if any changes are required, they are sent back to the Designers. Peer reviewers are especially concerned with the “ constructability ” of any designs in a given area. The peer-review process includes online and informal meetings between the peer reviewers and the designers – this provides checks and balances throughout the design process.
When the design passes peer-review, and is below a certain dollar amount ($50,000), it can proceed directly to construction. If it is a higher cost project (above $50,000), it must go to management for review and sign-off. Anything above $100,000 must be reviewed by a Director. A Work Order is created once the Design passes peer review and customer charges are received.
Once the Design has been final approved, it goes to a Construction/Maintenance Specialist to review the Work Request and make certain that the proper material and component CUs have been requested. The Construction/Maintenance Specialist must double check and order the CUs indicated in the final design/work order. The Construction/Maintenance specialist may add CU’s to better reflect the labor and material requirements of the project.
In manholes, primary feeders are usually mounted on cable racks in the lower part of the manhole, while secondary cabling is mounted above, higher in the manhole. Many existing manholes contain three primary feeders in one manhole. The designers realize the placing of multiple feeders in one manhole increases the exposure and consequences of an event occurring in that manhole. Thus, for newer designs, designers strive to minimize the number of feeders in any one manhole hole. In underground radial designs, cables are routed to avoid a single-point-of failure by using looped cables from pull boxes.
Technology
Duke Energy Florida uses GIS system for mapping of the entire electric grid — radial as well as network. Note that Duke Energy Florida ’ s GIS system does not provide a true representation of the network secondary. Users of the GIS can access PDF drawings of manhole prints that detail manhole and vault infrastructure.
Duke Energy Florida is in the process of updating its GIS system records to fully represent network infrastructure. Duke Energy Florida is also migrating to a new GIS system, GE Smallworld.
Duke Energy Florida uses a Work Management Information System (WMIS), by Logica (now part of CGI). RTArm, by Logica, is used for material and component tracking and ordering, as well as assigning job hours for projects.
7.4.15.5 - Duke Energy Ohio
Design
Non-Network Design
People
Both distribution network design and non-network design is performed by a Network Project Engineer and two Designers who are part of the Distribution Design organization. This organization is focused on all distribution design work for Duke’s Ohio and Kentucky utilities.
Theses resources work closely with one another and with the Planning Engineer focused on the network to design modifications to the network.
Technology
Duke Energy Ohio serves all loads – major and non major - within the geographic section of Cincinnati they have deemed their network service territory with true network designs. Smaller loads are served through the secondary grid, while larger loads are served with true spot networks.
Within this geography, Duke Energy Ohio is not using non network designs, such as running dual primary feeders with an automatic throw over switch to supply major loads.
7.4.15.6 - Energex
Design
Non-Network Design
Note: Energex does not utilize a low voltage meshed secondary “network” in its CBD. This section discusses their design approach in serving the Brisbane Central Business District.
People
Energex has a Systems Engineering group, led by a group manager, and part of the Asset Management organization. This group is responsible for establishing the design standards for the distribution network. Energex also has a Design organization within its Service Delivery organization, also led by a group manager, and responsible for performing designs of specific projects, including new construction and system reinforcement projects. The Design group is comprised of four-year degree qualified engineers and engineering associates.
Process
To serve the downtown Brisbane central business district (or CBD), Energex is using an 11kV primary system, and supplies loads using single feeder supplies, or - in the Central Business District - using two and three feeder meshed 11kV systems.
There are four major substations that supply the load in downtown Brisbane. These substations are sourced at 110 kV by a combination of overhead and UG feeders. Within the stations are multiple 110 kV: 11kV dual winding transformers supplying the 11kV bus that sources the 11kV distribution system.
Energex runs multiple primary feeders at 11 kV out of these stations as part of a meshed system. Most of the feeders supplying the CBD are part of a three feeder mesh, where each of the feeders is fed out of the same substation, and are normally tied together at a “mesh point” located at a medium-voltage substation location. The feeders supply medium-voltage substations containing transformers (typically, either 1000 or 1500 KVA units), that supply the low-voltage system that supplies the down town load. Energex designs the mesh with sectionalizing points (circuit breakers or CBs), normally SF6 or oil (older design) switches located at various points along the feeder, protected with bus differential relaying, and a pilot wire scheme, so that devices operate simultaneously. These sectionalizing points may be designed on either side of a medium-voltage station, or separating multiple units within a medium-voltage substation, such that even with the loss of any one feeder section, customers can be supplied from the remaining mesh after performing some switching. Note that Energex does not use any automatic switching schemes, or remote control of these switches. Energex does install basic alarming in their medium-voltage stations, such as alarms for an open breaker, and general alarms (battery charge, sump pump). Alarms communicate by wire to an RTU at the substation supplying the primary feeder, and then through a WAN back to their SCADA.
For example, some high rise facilities may be supplied by Energex via multiple transformers separated by a switch on the primary. In the case of a fault on one feeder section, the bus differential relays isolate the section, resulting in a loss of supply to one of the transformers supplying the customer, and thus a partial loss of service to the customer. However, the customer may have the ability to perform switching on his side to energize the de-energized secondary bus by closing a secondary bus tie, after decoupling the secondary bus from the Energex transformer (using an interlock system that would prevent him from closing the bus tie until after it has separated itself from the Energex transformer). In this scenario, the customer load is restored, being supplied by the remaining in-service transformer.
The primary feeders also have bus over current protection at the source and at the mesh point. As UG feeders supplying the CBD, the primary feeders do not employ automatic reclosing and, upon sensing a fault, trip and lock out immediately. At the supply substation (110 kV: 11 kV), Energex has automatic changeover of the buses, so that the bus remains energized even with the loss of any one substation transformer. CBD has transformers operating in parallel so there is no auto changeover required on CBD substation busses.
Characteristics of a Three-Feeder Mesh Network
(from the Energex Standard Network Building Blocks document, Feeders BMS 03929, Updated: 13/12/2012, see Figure 1).
The layout of a developed three-feeder mesh network is shown in Figure 1 The network has the following characteristics:
-
Any two of the three feeders of the mesh ideally must be capable of supplying the total load of the mesh.
-
Distribution substations are installed generally in each major building.
-
Local low-voltage (LV) supply may be run onto the street from a distribution substation in a building in order to supply other customers on the street.
-
A fault in any of the 11 kV cables within the mesh results in the faulted cable being isolated by the circuit breakers (CB) at each end of it. Supply is maintained to the majority of the load supplied by the mesh.
-
Where the 11 kV bus in a distribution substation has a single CB for two transformers (e.g., Distribution Substation ‘A’), a fault in either 11 kV cable connected to the substation results in loss of supply to one transformer and partial loss of supply to the building. The building generally would have a transfer scheme on the LV side, a standby generator, or both.
-
If an 11 kV cable that has a teed connection to a load fails, the teed load loses 11 kV supply until the cable is repaired. Teed connections should not be installed in three-feeder mesh systems.
-
Individual distribution transformers are protected generally by fused units, sometimes by CBs.
-
A large CBD area may have many three-feeder mesh networks supplying it.
-
A three-feeder mesh may have a further backup connection to another three-feeder mesh, and other variations depending on the situation.
-
A CB may feed more than one mesh as shown, and protection must be arranged to suit (see Figure 1).

Figure 1:
Energex 11 kV CBD Feeder Diagram
Technology
Medium-voltage substations in the CBD are usually located within building vaults. The medium-voltage stations consist of primary (11 kV) switches protected by bus differential relaying, transformers, and secondary switchgear that supplies both the building load (see Figure 7) and feeds into the low-voltage network serving the CBD (see Figures 2 to 6 and Figure 8).

Figure 2:
Energex employee giving safety briefing before entering a C/I substation, locating in a building vault

Figure 3:
Dry type transformer supplied by the three feeder mesh

Figure 4:
Primary terminations (PILC) on dry type transformer

Figure 5:
Multiple dry type transformers

Figure 6:
Circuit breakers with bus differential relaying

Figure 7:
Low-voltage switchboard, with feeds to the customer

Figure 8:
Typical building vault substation with ring main unit (foreground) and transformer (background)
At some locations, Energex may “Tee” off the primary feeder with a substation consisting of an SF6 gas insulated ring main unit (the primary switch gear current design) with an “in” switch, an “out” switch, and a fused, switched tap leading to the transformer. The use of a packaged substation with a ring main unit is a common design outside of the CBD.
In URD applications, Energex uses a similarly designed “packaged” substation, a pad-mounted unit consisting of the ring main unit ( “in” switch, an “out” switch, and a fused, switched tap leading to the transformer), the transformer, and the low-voltage switchboard supplying the low-voltage network feeding the development (see Figures 8, 9 and 11). Note that URD developments are fed by an extensive low-voltage network feeding through mini pillars (see Figure 10). Services are tapped from these mini-pillars to serve customers (see Figure 12).

Figure 9:
Typical pad-mounted 'packaged' substation supplying UG development. High-voltage switches (ring main unit) in the front, transformer in the middle, and low-voltage switchboard in the back

Figure 10:
Typical pad-mounted 'packaged' substation supplying UG development (another view). Note mini pillar to the right of the substation

Figure 11:
Low-voltage switchboard supplying the LV network feeding the development

Figure 12:
Typical home, note mini-pillar in the foreground supplying the customer
Energex has SCADA at the substation, and some remotely monitored and controlled normally open tie points between 11kV feeders out on the system, but in general, they have little SCADA beyond the substation.
Energex is currently installing a PQ meter on the low-voltage side of all distribution transformers greater than or equal to 200 kVA, three phase.
At the time of the immersion, Energex was in the process of implementing the Power On DMS product, which provides electronic displays of the distribution networks, both medium voltage and low voltage.
7.4.15.7 - ESB Networks
Design
Non-Network Design
People
Organizationally, the design of both MV and LV infrastructure is performed by designers located within the Network Investment Management groups for larger designs, and within the ESB Networks Regions for the smaller designs. The Network Investment Management groups (North and South) are part of the Asset Investment group, within Asset Management. The Regions are organizationally part of the Operations Management Group, also part of the Asset Management organization.
For most designs, the design is performed by an Engineering Officer (EO) – the designer position at ESB Networks.
The development and maintenance of guidelines for performing MV and LV network design are the responsibility of the Specification Management group, part of the Asset Investment group, also part of the Asset Management organization at ESB Networks.
The Specifications Management group has developed thorough guidelines for the design of LV and MV networks[1]. This guideline includes specific direction for optimizing designs.
Note that in addition to the Operations Management and Asset Investment groups, the Asset Management organization consists of Program Management, Infrastructure Stakeholder Management, Assets & Procurement, and Finance & Regulation. These groups work closely together to manage the asset infrastructure at ESB Networks.
[1] Note that the term “networks” here is a general term that refers to distribution infrastructure. It is not meant to describe an interconnected or meshed LV system.
Process
A typical ESB Networks distribution design for both an urban setting and a suburban setting involves the installation of either an “indoor sub” (common in an urban setting) or “unit sub” (common in a suburban setting or a “greenfield” residential development), which consists of primary ring main unit or switchgear, a larger three-phase transformer (common size is 630 kVA), and an extensive LV secondary system, designed with multiple junctions and normally open tie points between adjacent LV feeders. Note that most customers are served by the LV infrastructure. ESB Networks provides a MV (primary) service to larger customers, usually with loads in excess of 500 kVA.
The design approach in an urban setting is similar to the design approach used by most U.S. utilities, where dense loads are served by MV “substations,” supplying an extensive secondary network. A key difference is that many U.S. utilities use a meshed LV secondary network. Consequently, the MV “substations” are designed as “network units,” and thus include not only the primary switchgear and larger three-phase transformers, but network protectors that serve to prevent back feed onto the primary from the meshed secondary in the event of a primary feeder outage.
In urban settings, the MV substation is designed as an “indoor room,” occupying an aboveground building vault designed and built to ESB Networks specifications (see Figure 1). (See MV Substation Design for more information.) Note that ESB Networks uses almost no submersible vaults in Dublin.

Figure 1:
Exterior doors to an indoor room vault
In urban settings, ESB Networks uses a standardized MV “packaged substation” consisting of an SF6 gas insulated ring main unit, the MV transformer (in Dublin, typically a 10-kVA primary to a 430-V secondary), and the secondary bus and protection that feed the secondary “mains” that supply the LV system in downtown Dublin. The design is such that the transformer (typically a 630-kVA unit) can be replaced without replacing the ring main unit or LV panel.
The ring main unit consists of an incoming switch, and outgoing switch, and a fuse, switched tap to the transformer (kkT). One of these switches is typically normally open, and provides a sectionalizing point on the 10-kV MV system. Note that ESB Networks design guidelines discourage the use of gear with an additional tap (kkT units), as the company has found that this can lead to very complex designs that include loops within loops.
At ESB Networks, the LV feeders are designed electrically radial, with normally open ties between adjacent feeders, and multiple junction points for sectionalizing. These junction points are often accessed using “mini-pillars,” which are small aboveground pedestal boxes, and in belowground hand holes in the more urban settings. When installing a new indoor room MV station, ESB Networks attempts to split existing adjacent LV feeders to provide additional load support and opportunities for sectionalizing in outages.
For supplying housing developments in a more rural setting, ESB Networks uses an approach that is conceptually similar to the approach used in an urban setting. The company places a unit sub consisting of a ring main unit (switchgear) and larger three-phase transformer near the load center (see Figure 2 and 3), and supplies the customers from an extensive LV system (see Figures 4 through ). This approach differs from the U.S. approach to servicing housing developments of using a more extensive MV system, and small single-phase transformers.

Figure 2:
SF6 insulated ring main unit, kkT

Figure 3:
Sealed, oil-filled transformer

Figure 4:
Secondary panel

Figure 5:
Exterior door to a unit sub, used in residential developments

Figure 6:
Unit sub secondary cabinet – Note the fused secondary feeders emanating from the bottom

Figure 7:
Unit Sub Primary cabinet – Note the tap to the transformer
ESB Networks’ design guidelines acknowledge differences in developing optimal designs for urban areas versus housing developments in “greenfield” areas. As an example, the guidelines acknowledge that in urban areas, the size and type of loading on the system may change significantly with time. Also, in urban areas, the costs of adding LV cables in the future to support load growth can be very high because of excavation costs and the inability to pass costs on to a particular new customer. Consequently, the optimal designs for an urban infrastructure, as defined in the ESB Networks design guidelines, acknowledge these characteristics. For example, the guidelines indicate that a good urban design should acknowledge the difficulties associated with excavation, and thus take advantage of worthwhile opportunities to install additional circuits – especially if there is a strong likelihood that these additional circuits will be utilized (anticipated load additions, for example).
ESB Networks Network engineers have developed a list of design approaches to be avoided – referred to as the “dirty nine.” These refer to particular design approaches that are suboptimal and can lead to increased costs.
Technology
ESB Networks is using a home-grown Excel application for calculating load drop. At the time of the immersion, ESB Networks was experimenting as part of an electric vehicle pilot with the looping of LV feeders in certain locations. ESB Networks has installed fusing in the center of these loops, designed to blow if there is reverse power circulating currents.
7.4.15.8 - Georgia Power
Design
Non-Network Design
People
Non-network system designs are generally not handled by the Network Underground group. They are the responsibility of the Georgia Power Distribution groups in the Regions. However, , if any non-network design requires concrete-encased duct line construction, the Network Underground group will work closely with the regions on these projects. The Network Underground group is responsible for all duct line design throughout the Georgia Power system.
Non-network designs that utilize the ducted system, such as designs to large downtown loads that utilize a primary and reserve feeder scheme, are the responsibility of the Regions. However, projects that involve duct line designs will involve the Network Engineering group as well. This group, led by the Network Underground Engineering Manager, is comprised of Engineers (Electrical and Civil) and Technicians concerned with the planning, design, and any service issues associated with the network. The Engineers are four-year degreed positions, while Technicians have a combination of years of experience and formal education, including two-year and four-year degrees. Engineers are not represented by a collective bargaining agreement.
In addition to the engineers with in the Network Underground Engineering group, the Network Underground group has two Principal Engineers who report to the Network UG Manager. These Principal Engineers also deal with issues of network design.
Process
New services to larger loads in Georgia urban areas are served either with a spot network service, or with a dual, primary radial feeder scheme: either two preferred feeders, or one preferred feeder and one reserve feeder. These radial feeder schemes often include the ability to switch with a “PMH” type transfer – not a fast transfer scheme. Both spot network services and dual primary radial schemes are common at GA Power. Georgia Power engineers noted that some customers perceive the transfer service with two sources as more reliable than the network service.
There is no difference in electrical rates seen by the customer between a spot network service and dual primary feeder scheme. Costs differences are associated with the upfront costs for the infrastructure that is provided by the customer to accommodate the installation, with network vault costs being higher because of the need for more area, a higher fault rating for customer switch gear, etc. If a customer requires dedicated reserved capacity on a reserve feeder as part of a dual feeder supply, they must may for that reserved capacity. Customer connection costs for customers connecting to the secondary grid include costs associated with maintain and operating the network grid.
Typically, contracts come in from Marketing after a request for service to Georgia Power. This is the case for most large customers. It is customary for the Marketing representative handling the account to provide preliminary engineering with the load requirements for customer site. The group has a standard procedure to choose from models of different load types. The group can calculate load factors on all types of equipment, and project customer demand. The models do not require demand curves, only winter and summer peak load calculations, and the type of business the customer is engaged in. These factors are calculated before turning the project over to the design engineers.
7.4.15.9 - HECO - The Hawaiian Electric Company
Design
Non-Network Design
People
Underground non-network design is performed by the HECO T&D Division. This group is part of the Engineering Department.
The group is comprised of 2 lead engineers, 13 design engineers and a supervisor. All are four year degreed engineers with about half the group having their PE license.
The majority of the design of both the network and non-network systems is done in house. Underground network / non- network design is seldom outsourced at HECO.
The group’s responsibilities include network system and non – network system designs, and the preparation of construction drawings for the conduit system, vaults and manholes.
The department is a relatively young one, with many newer employees. The department manager noted that the group is an excellent training ground and a good stepping stone for other opportunities within HECO.
The T&D Division works closely with other groups, depending on the nature of the work. For customer work, they would interface closely with the Customer Installations Department (CID). For example, the CID would lead the design of a new customer vault, while the T&D Division would lead the design of a HECO vault or of a customer vault relocation. Similarly, the T&D Division works closely with the Civil / Structural Division, also part of the Engineering Department. The T&D Division would specify the size and type of vault needed, for example, while the Civil / Structural Division would perform the detailed civil design.
Process
HECO has a large ducted manhole system that provides radial non – network service to the majority of customers in Honolulu. More specifically, they provide the following design types:
-
46kV sub transmission - Pressurized gas filled cable feeding some large customers and distribution substations
-
25 kV distribution, serving large urban customers, with multiple feeds, through a ducted manhole system. The 25kV system was built as part of a master plan to convert all of the 12kV distribution on O’ahu to 25KV in response to anticipated load growth. HECO converted sections, and installed dual rated equipment in anticipation of conversion. However, as economic conditions have changed, HECO has abandoned this strategy and is now installing new distribution at 12kV.
-
12 kV distribution[1] , serving customers radials, with multiple feeds, through a ducted manhole system. Note that HECO runs all of its primary in concrete encased conduits.
Much of the older HECO underground system is build with lead (PILC) cables. The new cable standard is to use XLP insulated conductors.
The T&D Engineering group performs designs for both customer driven projects, such as relocations and line extensions, and for internally developed projects such as system reinforcement projects. The group designs reliability improvement projects and performs load balancing. The group also performs civil designs for duct lines, vaults and manholes, as well as assists with the development of standards for underground enclosures.
The group does not design the layouts for a development. This work is normally performed by either the Customer Installation Department (CID) or by a contactor engaged by the developer. If a circuit must be extended to serve a development, the T&D Engineering group will design that extension, but not the URD layout.
The group does not design services (service drops) to customers. Design of services to customers is performed by the Customer Installations Department (CID).
The HECO distribution system is designed to a true N-1.
The majority of customers in Honolulu are served by non network designs. HECO uses 2 main feeders into each large customer, a “Fuse” feeder and a “Switch” feeder. The “Fuse” feeder is the main feeder that normally supplies the customer. The Switch feeder is designed as a backup feeder for a given customer, even though that feeder does serve other customers as the main feeder. Circuits are typically loaded to no more than 50%, so that they can carry the full load of an alternate feeder.
All three phase transformers are fed from two primary feeders - a main feeder and an alternate. Single phase underground facilities are designed as loop systems with fault indicators located in every transformer.
All underground primary cable (newer)[2] is installed in concrete encased conduit, including URD designs. All secondary and service cables are installed in conduit as well, though not concrete encased in residential areas.
Technology
The design group is using various software applications for various tasks.
Their main design software is a homegrown application that is used to generate bills of material and cost estimates. They will use MicroStation to prepare construction drawings.
HECO is using “USAmp+” (USi) to perform cable ratings, and Pull-Planner (American Polywater) to assist with cable pulling calculations.
[1] HECO has both 11.5kV and 12.47kV Distribution systems.
[2] HECO does have older direct buried infrastructure installed.
7.4.15.10 - National Grid
Design
Non-Network Design
People
National Grid Albany uses radial distribution (non-network) designs to serve much of Albany. The underground department in Albany is responsible for the construction and maintenance of the radial system in Albany as well as the network systems.
Process
The Albany network secondary system is confined to a certain geographic boundary within Albany. All other loads are served by radial distribution systems. These distribution systems are primarily radial underground distribution fed through a manhole / conduit system. Much of the primary cable system is built with PILC cables.
In Albany, non-network customers are served radially with a preferred feeder / alternate feeder design.
Technology
National Grid utilizes fault current indicators (FCIs) liberally in their radial system.
7.4.15.11 - PG&E
Design
Non-Network Design
People
PG&E uses radial distribution (non-network) designs to serve much of San Francisco and Oakland. The Planning and Reliability Department group does distribution planning for both the network and not network distribution systems.
Process
PG&E network secondary systems are confined to certain geographic boundaries within San Francisco and Oakland. All other loads are served by radial distribution systems. These distribution systems are primarily radial underground distribution fed through a manhole / conduit system.
Within San Francisco, new loads to be built within the network geography will be served on the network. Loads outside this geography will be served by the radial distribution system. In Oakland, PG&E is actively minimizing load additions to the network. Consequently, new loads to be added within the network boundary in Oakland may be served by the radial distribution system, rather than by the network.
Non-network customers in both Oakland and San Francisco are served radially. PG&E does not provide a separate feeder to serve radial customers, even large ones, for free. If the customer wants a second “backup” feeder, they must pay for it. PG&E has a separate tariff that specifies the costs of the backup service, including the costs of installation, costs of ownership, and costs of reserve capacity. Note that PG&E may on occasion install a second feeder free of charge to selected new loads that benefit the public good.
7.4.15.12 - Survey Results
Survey Results
Design
Non-Network Design
Survey Questions taken from 2012 survey results - Design
Question 4.4 : What type of design are you using for new civil structures such as manholes and vaults?

Survey Questions taken from 2009 survey results - Design
Question 4.5 : What type of design are you using for new civil structures such as manholes and vaults? (this question is 4.4 in the 2012 survey)

7.4.16 - Non-Network Service
7.4.16.1 - Ameren Missouri
Design
Non-Network Service
People
Design of the urban underground infrastructure supplying St. Louis, including non-network service design, is the responsibility of the engineering group within the Underground Division, organizationally part of Energy Delivery Distribution Services, reporting to a VP. The Underground Division, led by a manager, consists of both engineering and construction resources responsible for the downtown infrastructure. The engineering group is led by supervising engineer, and is comprised of Engineers and Energy Services Consultants (commonly referred to as Estimators) who deal with planning, design, and service issues.
Engineers design the system, size equipment, perform load flow analyses, and prepare line drawings that describe the designs. All engineering positions are four-year degreed positions. Some engineers within this group have their PE licenses, although this is not a job requirement. Engineers are not represented by a collective bargaining agreement.
The Energy Services Consultants (Estimators) take the one line designs developed by the engineers and complete the design package, including all the physical elements of the design. Estimators have a combination of years of experience and formal education, including two-year and four-year degrees, and are part of the union, IBEW.
Recently, Ameren Missouri has formed the “Underground Revitalization Department,” a team of engineers (all 4-yr degreed) focused on researching, evaluating, and developing plans for performing capital improvements to and revitalizing downtown St. Louis, including the network. Part of this group’s role includes addressing issues such as the development and update of planning criteria for the network, and the design of enhancements to the downtown area, such as developing potential designs to build a new substation to supply network load in St. Louis. Engineers who are assigned to this team will also participate in the design of spot network installations and indoor rooms.
Ameren Missouri has a Standards Group that has developed construction standards and material specifications for designs and equipment used in the network underground. These standards and specifications are used by engineers and estimators in developing network designs. Standards are available in both online and printed book format.
Process
Customers with larger loads, or who request 480V service are normally served from a non - network design, either a padmounted transformer or an indoor substation. Padmounted services are usually not practical within St. Louis because of the downtown congestion; thus, the most common design for larger loads in downtown St. Louis is the indoor substation (also called “indoor room”).
Most new services to larger downtown loads in St. Louis are served with a dual, primary metered feeder scheme: either two preferred feeders, or one preferred feeder and one reserve feeder.
Larger customers often receive primary metered service, with Ameren Missouri providing two primary supplies to the customer. These primary supplies feed into switches, either fuses or breakers as chosen by the customer, and can be manually or automatically (auto transfer) operated. After the breakers, lines feed into the primary metering gear, and then on to the customer switchgear or transformation. Note that in this arrangement, all equipment except cable and meters are owned by the customer, including the primary switches that precede the primary metering point.
For a secondary metered customer, Ameren Missouri provides the switches and transformation that precede the metering point. In this design, Ameren Missouri may provide either a preferred and reserve feeder, or a two preferred feeder design.
In ascertaining expected customer load, Ameren Missouri will look at similar buildings to estimate demand using square footage and expected load density by customer type. They will also perform a load flow analysis to understand the impact on the system of connecting the new load. They will run both the normal and n-1 cases.
Technology
Most larger load locations within St. Louis are fed using non-network designs. See Non - Network Design - Technology for photographs of typical equipment used for larger non network services.
7.4.16.2 - CEI - The Illuminating Company
Design
Non-Network Service
(11kV Non – network Service to Large Customers)
People
The design of the non – network ducted manhole system is performed by the CEI Underground / LCI group (Design Group), part of the CEI Regional Engineering group, located in NRHQ (Northern Region Headquarters).
Process
CEI serves most large urban loads from their 11kV system (regarded as a sub-transmission system). This system is a delta system with a ground provided by a grounding transformer at the substation.
Most of the services to large urban loads are fed from multiple feeds into the buildings. A typical design involves two or more primary feeders entering a building vault at a large customer site. One feeder is considered the main feed, and the other(s), backup. CEI will try to source the multiple feeders in to a given building from multiple substations. Often, they include an auto – throw over scheme in the vault at the customer ’ s site (the customer is responsible for this cost). In other cases, the throw over switch is manual. The customer will normally provide a primary switch gear room and transformer room, or a vault. CEI maintains ownership of the transformer (s) in the customer’s vault in most cases. (See below for photographs of a typical installation)
The backup feeder they provide is a spare feeder (referred to as an “area spare”) that they run from the substation. Rather than reserving capacity on a customer by customer basis on feeders that serve customer load when normally configured, the 11kV system is designed with a spare feeder; that is, a feeder that under normal conditions is not loaded. Spare feeders are not fed off of dedicated spare transformers at the substation; rather, they are simply additional feeders fed off the bus at the sub, and feeding to multiple customers in the downtown for the purpose of backing up the main service feeders.
Each spare feeder backs up the load served by multiple feeders. The system is designed such that one spare feeder can back up 6 normal feeders. The six feeders backed up by a given spare are fed from multiple sources so that it is highly unlikely multiple feeders backed up by a given spare would be out of service at any one time.
For planned interruptions, such as needing to take a feeder out for maintenance or repair, CEI will go into each affected vault and perform a parallel transfer, which will tie in to the spare circuit, paralleled across the common bus in the “throwover” device. Then they will open the breaker for the normal circuit. This will often be transparent to the customer.
CEI will notify customers or the interruption to the normal feed where they have to, but not in all situations. If the circuit will be out for a few days, meaning that the customer is no longer receiving n-1, the Outage Coordinator - the person who makes customer contacts in anticipation of a planned outage - will notify critical customers that the alternate feeder is out of service.
To de-energize the spare feeder, CEI will send Underground electricians into all of the vaults, deactivate the auto transfer schemes and make a visible disconnect. When the spare feeder is de-energized, CEI will use that opportunity to address corrective maintenance issues along the feeder.
Technology
Below are photographs of a typical design involving two primary feeders entering a building vault – one is the supply feeder, and the other is the back up (Spare) feeder. In this example, the vault is provided by the customer and is built to CEI specifications. Electrically, the two feeders first come to a disconnect point. This can be a “feed through” connection as shown in photo below (Note: photo only shows the one incoming feeder shown – three phases, fed from the bottom).


In some designs, CEI requires the installation of “Minirupter”, a group operated interrupting device. From here the feeders go into an automatic throw over switch (in this example, a G&W switch). This device will “throw” the load over onto the other feeder if one feeder is interrupted. In the photo below the right is the normal feed, the left is the spare, and the center is the output from the device that will feed over to the transformer.
In this particular example, the transformer is housed in a separate transformer room, separated from the switch (above) by a wall. The feeder cables feed from the throwover switch through the wall into the transformer room.
Prior to going into the transformer – the circuits go through a set of power fuses. The picture below shows the cabinet in which the fuses are housed. The feeders enter through the top and continue to the transformer from the bottom (not shown)

The picture below shows the feeders going into the transformer (from the left).

See Spot Network Design - Process
7.4.16.3 - CenterPoint Energy
Design
Non-Network Service
(High Side Spot Networks)
People
High Side Spot Network design at CenterPoint is performed by the Engineering Department contained within the Major Underground Group. The Engineering department is led by a Manager and is comprised of four main sub groups.
One sub group is a technical group that includes the engineers who design the protection schema and remote monitoring systems in the underground.
Another sub group deals with the design of three phase pad mounted transformer installations, including looped commercial developments. The Padmounts group is comprised of Engineers, Engineering Specialists, and is supplemented with contractor resources. This group is not typically involved in high side spot network design.
Another sub group, the Vaults group, focuses on vault designs, interfacing very closely with the Key Accounts Consultants (also part of Major Underground) who interface with large customers. This group is comprised of Engineers, Engineering Specialists, and is supplemented with contractor resources. Note this group designs high side spot networks, where appropriate.
The final subgroup, the Feeders group, is focused on distribution feeder design. This group focuses on both network and non network feeders. This group is comprised of Engineering Specialists, Engineering Technicians, and is supplemented with contractor resources.
Process
For large, critical customers, such as medical centers, CenterPoint may provide a high side spot network service. This type of service, provided by CenterPoint to about twenty customers, utilizes transformer high side breakers and interrupters, low side disconnects between the transformer and the secondary bus, a normally closed tie breaker on the transformer secondary bus, and electronic relays to control the protection scheme.
An example service may involve four transformers, each sourced by a high side disconnect and interrupter. Transformers could be 3750 kVA or 5000 kVA units. There is a normally closed bus tie on the transformer secondary, with each side of the tie supplied by two transformers. (See photographs below). In the event of the loss of one of the incoming feeders, the secondary bus would continue to be energized by the remaining transformers. The firm capacity of the vault for planning purposes is set at 120% of the combined rating of three of the four transformers (N-1). In the event of the loss of one of the transformers, the secondary bus tie is opened so that the customer load can continued to be supplied from the remaining secondary bus section. (Note that the remaining transformer capacity in this scenario may not be able to supply the customer’s entire load, as the remaining bus section is supplied by only two of four transformers. This situation would only be temporary, however, until CenterPoint could isolate the failed unit, then close the bus tie, bringing the third unit back on line.)
For some large customers, CenterPoint will provide a three breaker auto transfer scheme rather than a high side spot network. This scheme splits the load between two feeders with a normally open tie breaker between the units. For 35kV service, they will normally split the load at 6000 kVA and greater. At 12kV, they will split the load at 4000 kVA and greater. They will sometimes use motorized switches to transfer the load between feeders. Though slower than breakers, they are less expensive. In newer installations, they are using SF6 switches.
Technology
Below are photographs of some CenterPoint High Side spot network facilities.

Figure 1:
High side disconnect (top left), high side interrupter (bottom right)

Figure 2:
480 V tie breaker

Figure 3:
Transformers being fed by 12kV primary cables
Photo above shows two transformers being fed by 12kV primary cables being fed from the disconnect and interrupter mounted on the wall on the right side. Secondary energizes the 480 V bus (top left). Note the 480V fused disconnect cabinet (grey cabinet) in the very left of the photograph, between the transformer and the secondary bus.
7.4.16.5 - HECO - The Hawaiian Electric Company
Design
Non-Network Service
(Large Customers)
People
Underground non-network design to large customers is performed by the Customer Installation Department (CID). If a line extension (usually in a public right of way) is needed to bring the line up to the point where the service design will begin, the T&D Division of the Engineering Department will design the line extension.
Process
HECO serves most large urban loads from either their 12kV system or 25KV distribution systems.
Most of the services to large urban loads are fed from multiple feeds into the buildings. A typical design involves two or more primary feeders entering a building vault at a large customer site. One feeder is considered the main feed, and the other(s), an alternate. HECO will try to source the multiple feeders in to a given building from multiple substations. Normally, the feeders will tie into an auto – throw over scheme in the vault at the customer’s site, often PMH gear. In other cases, the throw over switch is manual[1] . The customer will normally provide a primary switch gear room and transformer room, or a vault. HECO maintains ownership of the transformer (s) in the customer’s vault in most cases.
The backup feeder they provide normally serves other load, but has enough capacity to act as a backup for the normal feed into a given customer’s site.
For planned interruptions, such as needing to take a feeder out for maintenance or repair, HECO will go into each affected vault and perform a parallel transfer, which will tie in to the spare circuit, paralleled across the common bus in the “throw-over” device. Then they will open the breaker for the normal circuit. This will often be transparent to the customer.
HECO will notify customers of the planned interruption to the normal feed where they have to, but not in all situations. If the circuit will be out for a few days, meaning that the customer is no longer receiving n-1, Account Managers within the Energy Solutions Department of the Marketing Service Division will notify critical customers that the alternate feeder is out of service.
Technology
Below are photographs of a typical design involving two primary feeders entering a building vault – one is the supply feeder, and the other is the back up (Spare) feeder. In this example, the vault is provided by the customer and is built to HECO specifications. Electrically, the two feeders first come to PMH switching device (left figure), with an automatic throwover. From the switchgear, the circuits feed two transformers from fused taps.

Figure 1:
Padmounted Switchgear with auto throwover. PTM removing Fuses

Figure 2:
Three Phase Pad fed from fused tap in the switchgear
[1] Customer pays the incremental cost of the automatic throw-over switch. For certain customer types, such as hospitals, HECO will install automatic throw-over devices as standard.
7.4.16.6 - PG&E
Design
Non-Network Service
Process
Non-network customers in both Oakland and San Francisco are served radially. PG&E does not provide a separate feeder to serve radial customers, even larger ones, for free. If the customer want a second “backup” feeder, they must pay for it. PG&E has a separate tariff that specifies the costs of backup service, including the costs of installation, ownership, and reserve capacity. Note that PG&E may on occasion install a second feeder free of charge to selected new loads that benefit the public good.
7.4.17 - Organization
7.4.17.1 - AEP - Ohio
Design
Organization
People
Design of the networks serving Columbus and Canton Ohio, the two areas of focus for this urban underground network immersion study, is performed in Columbus by the AEP Network Engineering group, which is organizationally part of the AEP parent company. Within the Network Engineering group, the company employs two Principal Engineers and one Associate Engineer who are responsible for network design for AEP Ohio. These planners are geographically based in downtown Columbus at its AEP Riverside offices. The Network Engineering group reports to the AEP Network Engineering Supervisor, and is organizationally part of the Distribution Services organization, reporting ultimately to the AEP Vice President of Customer Services, Marketing and Distribution Services. The AEP Network Engineering Supervisor and the distribution services organization reporting to the AEP Vice President of Customer Services, Marketing and Distribution Services support all AEP network designs throughout its operating companies, including Texas, Indiana, Michigan, Oklahoma, and other locations.
Two Principal Network Engineers primarily oversee the designs for Columbus networks; one Associate Network Engineer primarily oversees Canton, but often helps with Columbus-based projects. The Network Engineers are responsible for all aspects of the network design, from inception to implementation, including the preparation of work orders, material acquisition, site inspections, and project completion.
AEP Ohio also has a Network Standards Committee, headed by the lead Network Engineering Supervisor in its downtown Columbus offices, and comprised of representatives from all AEP operating companies. This group works closely with the parent company’s Distribution Services organizations, and holds regular teleconference sessions on network findings, “lessons learned” in the field, and discusses potential network engineering solutions to common network design and implementation issues.
AEP Network Engineers design the network system in Columbus to a full N-2 resiliency, including the substations and spot network locations. This N-2 reliability is notable, as most urban underground network systems operate at an N-1 level. N-2 insures that if any system components fail, the remaining facilities can carry the load and maintain service. For example, all spot network locations are designed with at least three transformers, with any one transformer able to carry the peak spot network load. The AEP Network engineers will also perform radial (non-network) designs for customers who locate within the city centers, and who do not opt for or require network service.
AEP network engineers perform all designs associated with the network, including new service projects and system reinforcement projects. The Engineers perform all aspects of design including network unit design, equipment sizing, performing load flow analyses, and preparing project drawings that describe the designs for construction.
Two Technicians assist the engineers with the preparation of drawings in MicroStation and AutoCAD. This is a full-time position and is assigned to the Network Engineering department.
All civil design for network projects, including manholes, vaults and duct lines, is outsourced to a civil engineering firm. The primary Civil Engineer at that firm is a retired AEP Ohio employee who has many years of experience working with AEP Ohio underground networks.
The AEP Network Engineer responsible for customer designs works closely with the AEP Customer Service Representatives and the customer to insure designs for customer service meet all AEP as well as customer specifications.
Technology
AEP uses MicroStation as a graphics platform, and for preparing most engineering drawings. Some drawings are prepared using AutoCAD.
7.4.17.2 - Ameren Missouri
Design
Organization
People
Design of the urban underground infrastructure supplying St. Louis, both network and radial, is the responsibility of the engineering group within the Underground Division. Organizationally, the Underground Division is part of Energy Delivery Distribution Services, reporting to a VP. This Center, led by manager, consists of both engineering and construction resources responsible for the downtown infrastructure. The engineering group is led by supervising engineer, and is comprised of Engineers and Energy Services Consultants (commonly referred to as Estimators) who deal with planning, design, and service issues.
Engineers design the system, including vault designs, network unit designs, equipment sizing, perform load flow analyses, and prepare one-line drawings that describe the designs. All of the engineering positions are four-year degreed positions. Some engineers within this group have their PE licenses, although this is not a job requirement. Engineers are not represented by a collective bargaining agreement.
The Energy Services Consultants (Estimators) take the one line designs developed by the engineers and complete the design package, including all the physical elements of the design. Estimators have a combination of years of experience and formal education, including two year and four-year degrees, and are part of the union, IBEW.
Recently, Ameren Missouri has formed the “Underground Revitalization Department,” a team of engineers (all 4-yr degreed) focused on researching, evaluating, and developing plans for performing capital improvements to and revitalizing downtown St. Louis, including the network. This group’s role includes addressing issues such as the development and update of planning criteria for the network, and the design of enhancements to the downtown area, such as developing potential designs to build a new substation to supply network load in St. Louis.
Ameren Missouri has a Standards Group that has developed construction standards and material specifications for designs and equipment used in the network underground. Standards are available in both an online and printed book format.
7.4.17.3 - CEI - The Illuminating Company
Design
Organization
(Culture)
People
The design of the network is performed by the CEI Underground / LCI group (Design Group), part of the CEI Regional Engineering Services group, located in NRHQ (Northern Region Headquarters). “LCI” stands for Large Commercial and Industrial, as the group has new service design responsibility for large commercial and industrial customers.
EPRI observed an excellent working relationship between the Underground / LCI group (Design Group) and the Underground Network Cable Services Section (Underground Group). Each group voiced high degrees of respect for one another. The strong relationship is fostered by frequent face to face interaction between the engineers and the field force. In performing a design, an engineer will work with the field force to assure that the design is physically workable. For example, a designer may visit the field to determine whether there is enough room in a manhole for the proposed design. When preparing the job, the designer will put the name of the field crew that will be performing the work on the job print.
Process
While there is no formal program in place to foster the strong relationship, the managers of the two departments implement certain activities to continue to build the relationship. For example, a new designer joining the Design group will be assigned to work with the Underground Manager for a period of time to gain exposure to underground construction, maintenance, and operations (engineer may participate in performing fault location, for example). Similarly, a field employee (perhaps on light duty) will be assigned to work for a certain amount of time with the Design group.
Culture
Ducted Network Underground Users Group
People
FirstEnergy is made up of multiple operating companies, including CEI, whose distribution systems have been built historically from different standards. Each of those companies has some portion of their distribution infrastructure fed underground in ducted manhole conduit systems, either radially or with meshed secondary networks.
In order to focus on the unique challenges of underground ducted manhole systems, and to identify opportunities to synergize on the best ideas each operating company has to offer, FirstEnergy Standards organized a Ducted Network Underground Users group (Ducted Systems Users Group), led by a Senior Engineer within Corporate Design Standards, and with participation from each operating company.
Process
The Ducted Systems Users group meets three times per year. The focus of the group is to pair operating people and corporate people across the company to drive consistency across the system and look for best practices.
In 2008, the Ducted Systems Users group performed a review of the network and fully ducted systems across the company to identify needs and make recommendations. From this review, they produced a list of recommendations for addressing issues identified during their review. FirstEnergy is in the process of developing action plans to implement these recommendations.
Recommendations include:
-
Develop long range plans for network systems (Expand, maintain, or contract),
-
Assuring that underground systems are accurately represented in FirstEnergy’s project prioritization methodology,
-
Assessing current and longer term manpower needs,
-
Development of current system wide standards, practices manuals, and specifications for network, ducted system materials
-
Modeling network / ducted system infrastructure consistently and using up to date technology
-
Review planning and protection approach to network systems, including modeling.
7.4.17.4 - CenterPoint Energy
Design
Organization
People
Underground distribution design at CenterPoint is performed by the Engineering Department contained within the Major Underground Group. The Engineering department is led by a Manager and is comprised of four main sub groups.
One sub group is a technical group that includes the engineers who design the protection schema and remote monitoring systems in the underground.
Another sub group deals with the design of three phase pad mounted transformer installations, including looped commercial developments. This group, called the Padmounts group, is comprised of Engineers, Engineering Specialists, nd is supplemented with contractor resources.
Another sub group focuses on vault designs, interfacing very closely with the Key Accounts Consultants (also part of Major Underground) who interface with large customers. This group, called the Vaults group, is comprised of Engineers, Engineering Specialists, and is supplemented with contractor resources. This group is responsible for both the civil and electrical vault design.
The final subgroup is one focused on distribution feeder design. This group, called the Feeders group, is comprised of Engineering Specialists, Engineering Technicians, and is supplemented with contractor resources.
The four groups work closely with one another and with the construction organization.
Process
CenterPoint uses various designs to serve urban load depending on the location, service voltage, load requirements, and customer needs. Design types include Network service (network grid system is at 120/208V), Spot network service (208V and 480V secondary), High Side spot network design, multiple primary feeds with either manual or automatic throw over, and other designs as requested by the customer. All network services are supplied from the 12.47kV system.
CenterPoint works closely with customers to try to meet their needs. Customers are responsible for all civil costs, and costs of any additional electrical equipment they desire beyond a standard level provided by CenterPoint.
7.4.17.5 - Con Edison - Consolidated Edison
Design
Organization
(Culture)
People
Con Edison’s Network Organization includes:
Construction Responsibilities include Construction Management, Construction Services, Public Improvement, Substation and Transmission Construction, Administrative Services, and Environmental, Health and Safety (EHS) and Training.
Central Engineering Responsibilities include Civil / Mechanical Engineering, Control Systems Engineering, Design Engineering, Electrical Engineering, Equipment and Field Engineering, and Environmental Engineering & Program Support.
System and Transmission Operations Responsibilities include Financial Planning, Environmental and Safety Monitoring and Compliance, Transmission Planning, System Operation, and Transmission Operation.
Engineering and Planning Responsibilities include Energy Services, Distribution Engineering, Operations Services, Marketing and Sales, Planning and Analysis, and D.C. Elimination.
Substation Operations Responsibilities include Substation Planning, Environmental, Health & Safety, Protective Systems Testing, and Substation Operations.
Electric Operations Responsible for Con Edison’s Operations Centers including Manhattan, Brooklyn and Queens, and Staten Island, as well as the Transformer and Meter shops. Con Edison’s Operations Centers are responsible for Electric Construction, Electric Operations, Environmental, Health and Safety, and Financial Planning / Operations Services.
Purchasing Responsibilities include Minority Women Business Enterprise, Materials, Systems Support, Services, Technology and Strategic Initiatives, Construction, Major Projects, and Contractor Performance.
Enterprise Shared Services Responsibilities include Corporate Emergency Planning and Security, Equal Employment Opportunity Affairs, Research and Development, Facilities, Shared Services Administration, Human Resources, and Finance and Administration.
Employee Development
Con Edison invests in developing its design employees through three distinct programs focused on employee development. One program is focused on the development of newer engineering employees, another at incumbent employees, and the third at bargaining unit employees who are entering the management ranks. The programs are described more fully on page 3-53 of this report. Note that these programs are not limited to design employees, but are available to all employees who qualify.
7.4.17.6 - Duke Energy Florida
Design
Organization
People
Network design is performed by the Distribution Design Engineering group for Duke Energy Florida, which works out of offices in both downtown St. Petersburg and downtown Clearwater. The groups are responsible for designing new and refurbished network designs, as well as underground radial and looped distribution designs. The Distribution Design Engineering groups in Clearwater and St. Petersburg are led by a Manager, Distribution Design Engineering, and are organizationally part of a Distribution Design Engineering Group responsible for Duke Energy Florida’s Coastal region, led by a Director.
The Design Engineering group is comprised of two sub - groups: an Engineering group, comprised of degreed engineers, and a Technologists group, comprised of non-four year degreed Network Technologists. Work within the Design Engineering group, both in Clearwater and St. Petersburg, is assigned geographically, such that a designer (either an Engineer or a Technologist) is responsible for both network and non-network designs within an assigned geographical area. Some designers focus on commercial customers, while others focus on residential customers. For example, the design group has two Engineers that focus on commercial designs – both Engineers have four-year engineering degrees.
The criteria for choosing non-degreed Technologists may include years of experience, and for new job postings, at least a two-year degree in electrical technology. The existing group has individuals with varied experience, including distribution operations, control, and transmission.
The Design group is experiencing a large turnover in its Engineering staff, as a number of employees with many years of experience are retiring. A challenge for the group as positions turnover will be acquiring new resources with design experience.
7.4.17.7 - Duke Energy Ohio
Design
Organization
People
Network design, as well as non-network design, is performed by the Distribution Design department at Duke Energy Ohio. This department performs designs for Duke’s Ohio and Kentucky service territories. The group is led by manager and is broken into smaller design groups that focus on designs for particular Duke Service centers. Each of these smaller design groups is led by a supervisor.
The Distribution Design department employs a Project Engineer, reporting directly to the department Manager, who has prime responsibility for engineering support of the network. This engineer is a four year degreed engineer. The Project Engineer works closely with the Network Planning Engineer (Distribution Planning department) and the network Construction & Maintenance supervisors.
In addition, the Distribution Design department employs two Designers who are responsible for network designs, including load editions, forced work, and system reinforcement. These designers report to a Supervisor within Distribution Design. These Designers prepare the engineering drawings and other materials associated with job packages that go to Construction. These Designers are two year degreed engineers. Note that these designers have responsibility for non-network designs as well.
7.4.17.8 - Energex
Design
Organization
People
Energex has a Systems Engineering group, led by a group manager, and part of the Asset Management organization. This group is responsible for establishing the design standards for the distribution network. Energex also has a Design organization within its Service Delivery organization, also led by a group manager, and responsible for performing designs of specific projects, including new construction and system reinforcement projects. The Design and System Engineering groups are comprised of four-year degree qualified engineers and engineering associates.
7.4.17.9 - ESB Networks
Design
Organization
People
Design of the network underground at ESB Networks is performed by engineers within the Asset Investment organization. The Asset Investment organization is comprised of the Network Investment groups, both north and south, a Generation Investment group and a Specifications group, each led by a manager.
The Asset Investment group is part of Asset Management.
Design standards and criteria are developed jointly between the Asset Investment group and the Strategy Manager, which is part of the Finance and Regulation group within Asset Management.
7.4.17.10 - Georgia Power
Design
Organization
People
Design of the urban underground infrastructures supplying metropolitan areas in Georgia is the responsibility of the Network Engineering group within Network Underground.
The Network Underground Network group is a centralized organization responsible for management of network infrastructure throughout Georgia Power. The group is led by the Network Underground Manager, and is comprised of groups responsible for all aspects of managing the network, including network engineering, construction, operations and reliability.
Design of the network is the responsibility of the Network Engineering group. This group, led by the Network Underground Engineering Manager, is comprised of Engineers (Electrical and Civil) and Technicians concerned with the planning, design, and any service issues associated with the network. The Engineers are four-year degreed positions, while Technicians have a combination of years of experience and formal education, including two-year and four-year degrees.
In addition to the engineers with in the Network Underground Engineering group, the Network Underground group has two Principal Engineers who report to the Network UG Manager. These Principal Engineers also deal with issues of network design.
Georgia Power area planners and design engineers evaluate design the system to N-1, such that the system is designed to supply the load even with the loss of one key component. For example, if Georgia Power has three transformers at a substation, and one of the transformers serves the Network, then one of the responsibilities of a network designer is to insure that if a network bank fails for whatever reason, then the other two transformers can instantaneously pick up the full load of the failed network bank. This assures a high level of customer reliability.
Engineers design the system, including vault designs, network unit designs, equipment sizing, perform load flow analyses, and prepare one line drawings that describe the designs. All of the engineering positions are four-year degreed positions. Engineers are not represented by a collective bargaining agreement.
The GIS Technicians assist the engineers with drawings and completing the design package, including all the physical elements of the design.
Construction crews are responsible for ductlines and manholes and some vault construction; however, most Atlanta customers are given functional and dimensional requirements for vaults and are required to construct transformer vaults to meet the Georgia Power requirements.
The Georgia Power Marketing organization serves as the conduit between the customer and the design engineers for aiding in the design and cost estimates for projects. Often, customers will work directly with the engineers during the design and implementation phases. Most design engineers physically visit the site prior to and during project construction.
Georgia Power has a Standards Group that has developed construction standards and material specifications for designs and equipment used in the network underground. Standards are available in both an online and printed book format. Standards were first documented and codified in the 1970s, and they include what was already documented on the network from the 1940s and any new standards developed since then. It is a living document, and the responsibility of the Standards Group comprised of Principal Engineers in the Network Underground group. The standards are divided into two main sections: civil construction and network specifications and design.
7.4.17.11 - HECO - The Hawaiian Electric Company
Design
Organization
(Culture)
People
Design activities are performed by multiple groups at HECO. The T&D Engineering Division designs most of the customer driven and internally driven projects. They work closely with the Customer Installations Division, who focuses on the design of the service itself to the customer, and in laying out URD designs. The Technical Services Division focuses on standards, practices, and specifications and provides specialized engineering support, such as developing strategies for cable diagnostic testing, or facility replacement.
Designer / Line Worker Exchange
The Designer / Line Worker exchange program is aimed at C&M line workers who are close to achieving the Crew Leader level, and at Planners within the CID Planning and Design Division of the Customer Installation Department (CID).
Process
EPRI observed strong working relationships between the T&D Engineering Division, the Customer Installations Division and the Technical Services Division. In addition, EPRI noted an excellent working relationship between Technical Services Division engineers and the C&M Underground field force. High degrees of mutual respect were evident in the interactions observed by EPRI investigators.
HECO has implemented certain activities to foster the strong working relationship between the two groups. For example, it is not uncommon for a Technical Services Engineer to meet with the field force prior to the start of the work day to discuss a particular project and participate in the morning tailboard meeting. Also, the Engineer may be present during diagnostic testing to aid the field crew in administering the diagnostic test and in interpreting the results.
HECO has implemented a Designer / Line worker exchange program (see below) to raise each group’s appreciation of the work of the other, and to build strong relationships between the two groups. The program is aimed at Line workers who are close to achieving the crew leader level. The line workers are assigned to shadow the various divisions of the Customer Installations Department for a four week period, to better understand the design elements of a customer project. Similarly, though not part of the formal program, CID Planners are assigned to work in the line department, where they are given a combination of office and field experiences, and are able to see selected jobs all the way to completion.
HECO is considering expanding this exchange program to involve the T&D Division of the Engineering Department.
Designer / Line Worker Exchange
HECO has implemented a novel four week training program aimed at C&M line workers who are close to achieving the crew leader level. The line workers are assigned to shadow the various divisions of the CID group for a four week period, to better understand the design elements of a project. This four week rotation includes time with the Administration Division, the Meter Division, and the Planning & Design Division of the CID. This program is a formal one, required for progression to Crew Leader.
Similarly, CID Customer Planners within the Planning & Design Division are assigned to work in the C&M (line) department, where they are given a combination of office and field experiences, and are able to see selected jobs all the way to completion. Note that this program is informal, and not necessarily required for a Planner to advance to Designer.
HECO has found that this training raises each group’s appreciation of the work of the other, and has helped to build strong relationships between the two groups.
7.4.17.12 - National Grid
Design
Organization
People
At National Grid, distribution design is part of the Engineering organization. Engineering is part Distribution Asset Management organization, which also is includes Asset Strategy, Distribution Planning, Investment Management, and Transformation.
The Engineering organization is made up of: Substation Engineering Services; Distribution Design; Protection, Telecommunications and Meter Engineering; and Distribution Engineering Services.
There are two designers who perform network designs for the National Grid Albany network. They are part of the Distribution Design organization.
One designer (a Design Investigator) focuses on designing smaller new services connections to the network, 800 amps and below. This individual has a two year degree, though the degree is not mandatory for the position. This designer has field experience as both a cable splicer and maintenance mechanic. This designer also performs some non- network UG and overhead service designs.
The other designer (a Designer C) performs all larger and more complicated network designs, including network reinforcements, large new services projects greater than 800 A, and vault designs. This individual has a two-year degree, a requirement for the position. This designer also performs non – network UG designs.
Organizationally, both designers are part of the Distribution Design organization, led by a manager, and part of the Engineering organization at National Grid. This organization is structured centrally, with resources assigned to and in some cases physically located at the regional locations. The designers who support the Albany network are both physically located at the NYE building in Albany.
Both designers are represented by a collective bargaining agreement. The Design Investigator and Designer classifications are two different classifications with different progressions.
Both designers work very closely with the field engineer, part of Distribution Planning, assigned to the underground department to support the Albany network.
7.4.17.13 - PG&E
Design
Organization
People
Network design at PG&E is performed by the planning engineers within the Planning and Reliability Department. This department is led by a Principal Engineer, who is also the department supervisor. This group does distribution planning for both the network and non-network systems, and is also responsible for network design. Eight engineers comprise this department. Six focus on the radial system, and two focus on the network system.
For network systems, the two planning engineers are responsible for distribution design.
Both network planning engineers are four year degreed engineers. The planning engineers are represented by a collective bargaining agreement (Engineers and Scientists of California).
For large customers who wish to connect to the PG&E network system, a Service Planning representative is assigned to interface between the customer and the planning engineers within the Planning and Reliability Department who are responsible for the design. The service planning representative acts as a key account manager.
The planning engineers also work closely with project estimators (Estimators or Senior Estimators) who develop cost estimates and perform field checks to see if the design laid out by the planning engineer is workable in the field. The estimators also prepare the job packet for construction. PG&E has estimators located in local offices to work with smaller projects, and estimators located in their Resource Management Centers, who work with larger projects. The estimators that work on network design projects are located in the San Francisco division.
Cable design is the responsibility of experts within the Standards Department.
Planning engineers and Estimators are represented by collective bargaining, Engineers and Scientists of California (ESC).
7.4.17.14 - Portland General Electric
Design
Organization
People
Distribution/Network Engineers: Three Distribution Engineers cover and design the underground network, as well as work with customers to design customer-owned facilities, such as vaults, which may house network equipment. The underground Distribution Engineers are qualified electrical engineers and are not based in the Portland Service Center (PSC) or CORE group. The Eastern District Central Supervisor, who reports to the Manager of Distribution and T&D Standards, oversees them. When needed, PGE hires civil engineers to perform certain planning tasks.
Network Engineering develops and maintains the standards for the network, which are forwarded to the Standards Department. For example, Network Engineers developed the cable rating standards for the network cable systems. Distribution Engineers assume responsibility for network standards as they have the expertise specific to network equipment.
Distribution Engineers also provide the loading information that the Planning Department uses to create CYME and PSSE models.
Standards Department: The Manager of Distribution Engineering and T&D Standards oversees the Standards Department, and focuses on overhead and underground residential distribution (URD) systems rather than the network system. After recently experiencing reorganization, the group now employs one technical writer and four standards engineers.
Service & Design at PSC: Service & Design’s role is to work with new customers or existing customers with new projects, making it responsible for customer requests for new connections and customer-generated system upgrades, such as a building remodel. The supervisor for Service & Design’s wider responsibility includes the downtown network. The supervisor reports to the Service & Design Manager, who is a peer of the Distribution Engineering and T&D Standards manager. Both of these positions report to the General Manager of Engineering & Design and directly to the vice president.
The Supervisor of Service & Design at PSC and its group undertakes capital work if it is initiated by the customer. The “Mapper/Designer” reports to the Supervisor of Service & Design at PSC and provides the computer-aided design (CAD), geographic information system (GIS), and design service.A Field Inspectormeets with customers/customer contractors. Two inspectors work for the Service & Design organization, with one specializing in the network.
Service & Design Project Managers (SDPM): Network planning associated with customer-driven projects requires regular coordination with the customer throughout the project life. PGE has a position called a Service & Design Project Manager (SDPM), who works almost exclusively with externally-driven projects, such as customer service requests. At present, two Service & Design Project Managers cover the network and oversee customer-related projects from the first contact with the customer to the completion of the project. They coordinate with customers to assure that customer-designed facilities comply with PGE specifications.
The SDPMs can be degreed engineers, electricians, service coordinators, and/or designers. Ideally, a SDPM has an associate degree or a combination of electrical engineering experience and appropriate education. In addition, SDPMs should have proven project management skills and understand PGE and industry standards and practices. They should also have knowledge of the National Electrical Safety Code (NESC) and National Electrical Code (NEC), as well as the ability to use or learn the relevant information technology (IT) systems. PGE prefers a selection of SDPMs with a diverse range of experience and backgrounds.
SDPMs work on both CORE and non-CORE projects. This ensures that expertise is distributed and maintained across departmental and regional boundaries.
Key Customer Manager (KCM): PGE has nine KCMs reporting to Manager of the Business Group. Generally, they are geographically distributed, with three on the west side, one downtown, one in Salem, three on the east side, and one acting as a rover. KCMs liaise with large customers and communicate their needs.
Process
The PSC System Layout
The PSC service territory includes a mixture of overhead and underground facilities. West of the 405 freeway, PGE’s feeders are predominantly overhead and served by overhead crews located at the PSC. The PSC territory also contains five network systems, three of which are supplied from one substation and two from another substation. Each of the networks is designed to N-1, such that customers will remain in service even with the loss of any one piece of equipment.
The specific network systems are each assigned to individual underground Distribution Engineers.
The network uses a delta-wye configuration, and network and radial systems never mix together on individual feeders (i.e., all network feeders are dedicated to supplying network load).While network feeders supplying a network may emanate from different bus sections, PGE regulates the voltage and has had few problems with protectors pumping or cycling.
Many of the buildings in the downtown Portland area are becoming more energy efficient, reducing loading. In some locations, light loading conditions have caused network protectors to open.
Overall, due to the multiple redundancies in the network design, the downtown system is very reliable.
Substation Configurations: One of the two substations, which supplies three networks, is sourced by three 115-kV primary feeders, which supply four power transformers. The substation serves both network and radial feeders. Each of the three networks is supplied by four dedicated network feeders, at 12.4 kV, with each emanating from a different bus section. Voltage regulation is performed at the bus level. One of the networks consists of only spot network loads. PGE prefers to serve spot networks with four feeders, where possible, although some spot network locations are supplied by two or three feeders. The other two networks that this substation sources contain both grid network and spot network loads.
The other substation that supplies two networks is located on the other side of theWillamette River, and its feeders cross the waterway to supply downtown Portland. This is the older of the two substations. Each of the networks is supplied by four dedicated network feeders, at 11 kV, with each emanating from different bus sections. However, this substation also supplies radial load through radial feeders that emanate from the same bus sections as do the network feeders. Each feeder has its own regulator (in contrast to the other station, where regulation is at the bus level) to prevent pumping and cycling of network protectors because of voltage differences at the station. This gives PGE finer control, but limits capacity.
In the future, all loads that the second substation supplies will transfer to a new substation, which is under construction at the time of this immersion process. 12.4-kV feeders from this new station will supply networks [1].
Marquam Substation: PGE is building the new Marquam Substation, which will address a number of issues with the older substation:
- The new substation will eliminate the river crossing that the older substation used
- The new substation will have added capacity in anticipation of future load growth
- The substation solves the existing co-mingling of the radial and network feeders on the same bus
- The new facility will be able to cope with the load that the newer substation supplies when that substation is rebuilt in the future
- The new substation will include a group feeder pickup capability for quickly restoring the network after an outage.
The Marquam Substation will have the capability to serve five separate network systems with a peak load of 120 MVA. Two of the network systems will be transferred from the existing older station. A third will be transferred from the newer station within 10 years. The fourth and fifth network systems are earmarked for future load growth.
Marquam getaway duct banks will consist of four 48-in. (122 cm) diameter steel casings for crossing underneath a major roadway, with the conduit emanating from the casings tied into new vaults. Each of the casings will contain fourteen 6-in. (15 cm) diameter conduits.
The substation will have a maximum total network load of 75 MVA for each of the five network systems, and none of the separate four 12.4-kV feeders in each network will exceed 15 MVA load. Load balancing will balance primary feeders within a +/- 10% tolerance [2].
The new design will supply networks with a standard four-feeder system, and will provide future back-up capability for existing substations.
Technology
PSSE
PGE’s Planning Engineers use the PSSE application, which supports electric transmission system analysis and planning, and is used for modeling and simulations [3]. PSSE can model networks with up to 200,000 buses, and users can perform steady-state contingency analyses and test corrective actions and remedial schemes. Users can analyze balanced and unbalanced faults, as well as perform deterministic and probabilistic contingency analyses. PGE can use the system to model substation topology, and users can anticipate potential network issues and model alternatives. PSSE includes a comprehensive library.
PSSE supports a number of analyses, including:
- Power flow
- System dynamics
- Short circuits
- Contingency analyses
- Optimal power flows
- Voltage stability
The system is compatible with other systems, and add-ons support bidirectional flows and the modeling of distributed generation installations [4].
PSSE is presently only able to model three-phase loads, not single-phase loads. PSSE is also unable to show loops graphically and creates errors when modeling the secondary network, which has prevented accurate models. PGE is transitioning to CYME software, which is presently used for the radial system, and intends to add the secondary network. To do this, PGE will use ArcGIS/ArcFM to model and display loops.
Geographic Information System (GIS) – ESRI ArcGIS
To support planning, engineers use ArcFM, which is built upon ESRI’s ArcGIS system. Users can access ArcGIS mapping software via a browser, desktop application, or mobile device, and organizations can share maps and data. ESRI’s system allows users to capture, analyze, and display geographical information, enabling display of maps, reports, and charts.
GIS is used to map assets and circuits, and can be linked to the customer information system and other enterprise applications. The maps provided with ArcGIS include facility maps, circuit maps, main line switching diagrams, and a service territory map [5,6].Operators can use ArcGIS to schedule work and dispatch crews, and they can also locate crews and view work status and progress [7].
With ArcGIS, operators and crews can locate assets and infrastructure, as well as determine how they are connected. The view of the electrical system includes connectivity, service points, and underground assets. Crews can follow how current flows through the interconnected network and determine upstream and downstream protective devices. The GIS allows users to overlay external data, including images, county maps, and CAD files onto the map view.
The GIS includes ArcMap and ArcFM viewer, which allows designers to use compatible work units and send these to the Maximo system. In 2017/2018, PGE will investigate processes for transferring ArcGIS information into CYME.
Other Software Applications
PGE uses an Enterprise Resource Planning (ERP) system called PowerPlan, which has an Oracle attachment named “Pace.” This system provides financial data about projects. Other technologies used for planning include SharePoint, Field View, the PGE Engineering Portal, PI ProcessBook, and the T&D Database.
Maximo for Utilities 7.5
IBM’s Maximo for Utilities 7.5 system supports asset and work management processes for transmission and distribution utilities, covering most asset classes and work types. The system allows users to create work estimates and manage field crews. Maximo can integrate with a number of systems, including fixed-asset accounting, mobile workforce management solutions, and graphical design systems. The Maximo Spatial system is compatible with map-based interfaces, such as ESRI ArcGIS, and follows J2EE standards [8].
Maximo for Utilities supports operations across a number of areas:
A compatible unit library helps planners and designers estimate compatible units when creating a project.
Maximo 7.5 can upgrade with several optional modules, including the Asset Management Scheduler, which allows tasks to display in a Gantt view that shows the task dependencies and durations specified in the work order. The Spatial Asset Management module includes a map-based interface to track assets and locate work order and/or service request locations [9].
The PowerPlan Adapter is a corporate-level suite intended to facilitate accounting during operations. The system automates asset lifecycle management and supports compliance monitoring. The PowerPlan Adapter aggregates work orders and ensures that all aspects of a task are included. Users can add costs for labor, materials, and contractors when they arise [10].
Asset Resource Management (ARM) Field Manager: ARM Field Manager is a mobile platform that allows crews to access and report data for all work, including customer service information, emergency situation reports, procedure-based maintenance work, and compatible-unit based construction work.
Outage Management System (OMS)/Oracle NMS
PGE migrated to an Oracle NMS outage management system, which is based upon Websphere technology [11]. Oracle NMS is a scalable distribution management system that manages data, predicts load, profiles outages, and supports automation and grid optimization. The system combines the Oracle Utilities Distribution Management and Oracle Utilities Outage Management systems into one single platform. The system supports outage response and the integration of distributed resources [12].
Oracle NMS blends SCADA function and GIS models to combine as-built and as-operated views of the system. The application includes a number of advanced distribution management functions, including network status updates in real time, monitoring and control of field devices, switch planning and management, and load profiling. Oracle NMS can integrate with other supervisory control and data acquisition (SCADA) and GIS systems, and monitors network health-using data from a number of systems [13]. The NMS includes a simulation mode for training and supports switch planning and control.
Oracle NMS maintains a network model that handles the whole grid, includes every device, and integrates with existing systems using standards-based protocols such as Inter-Control Center Communications Protocol (ICCP), Common Information Model (CIM), and MultiSpeak-based web services. The system can also integrate with a range of GIS and advanced metering infrastructure (AMI) systems.
PGE’s NMS/OMS integrates outage information, location, switching, and work management functionality into a single system, in which operators can view and manage system status and operational data in real time. The system uses a data model to predict the location of outages and can present data on a dashboard via customized reports.
- Marquam Substation Project Quick Facts. Portland General Electric., Portland, OR: 2017. Click this (accessed November 28, 2017).
- Portland General Electric, Marquam Substation Network Distribution Ductbank Casings, internal document.
- Siemens. “Power Transmission System Planning Software.” Siemens.com. http://w3.siemens.com/smartgrid/global/en/products-systems-solutions/software-solutions/planning-data-management-software/planning-simulation/Pages/PSS-E.aspx (accessed November 28, 2017).
- PSS®E High-Performance Transmission Planning Application for the Power Industry. Siemens AG, Energy Sector, Erlangen, Germany: 2009. https://www.energy.siemens.com/hq/pool/hq/services/power-transmission-distribution/power-technologies-international/software-solutions/pss-e/psse_brochure_200902.pdf (accessed November 28, 2017).
- ArcGIS Solutions. “Electric Facility Maps.” Solutions.ArcGIS.com.http://solutions.arcgis.com/utilities/electric/help/electric-facility-maps/ (accessed November 28, 2017).
- Smart Grid Report. Portland General Electric, Portland, OR: 2017. http://edocs.puc.state.or.us/efdocs/HAQ/um1657haq16327.pdf (accessed November 28, 2017).
- GIS for Electric Distribution. ESRI, Redlands, CA: 2010. http://www.esri.com/library/brochures/pdfs/gis-for-electric-distribution.pdf (accessed November 28, 2017).
- T. Saunders, J. Souto Maior, and V. Garmatz. “IBM Maximo for Utilities.” IBM, 2012. ftp://ftp.software.ibm.com/software/tivoli_support/misc/STE/2012_09_11_STE_Maximo_for_Utilities_Upgrade_Series_v4.pdf (accessed November 28, 2017).
- IBM. “IBM Maximo for Utilities, Version 7.5.” IBM.com.https://www.ibm.com/support/knowledgecenter/en/SSLLAM_7.5.0/com.ibm.utl.doc/c_prod_overview.html (accessed November 28, 2017).
- Maximo Adapter. PowerPlan, Atlanta, GA: 2017.https://powerplan.com/resources/minimize-risk-and-optimize-maximos-implementation-with-powerplan (accessed November 28, 2017).
- Derek Harris. 2014. PGE Stephens Network System Split Report, internal document.
- Siemens. “Power Transmission System Planning Software.” Siemens.com. http://w3.siemens.com/smartgrid/global/en/products-systems-solutions/software-solutions/planning-data-management-software/planning-simulation/Pages/PSS-E.aspx (accessed November 28, 2017).
- Modernize Grid Performance And Reliability With Oracle Utilities Network Management System. Oracle, Redwood Shores, CA: 2014. http://www.oracle.com/us/industries/utilities/046542.pdf (accessed November 28, 2017).
7.4.17.15 - SCL - Seattle City Light
Design
Organization
(Culture)
People
Network Design at SCL is performed by the Network Design Department, which is part of Energy Delivery Engineering. See Attachment A. The Network Design Department performs all planning and design of SCL’s networks.
The Network Design Department is made up of eight “System” engineers, who do all of the design for the network, and eight “Services” engineers, who interface with the customers, gather load information, coordinate construction activity, etc. The individuals in this group are four-year degreed engineers. Some have their PE licenses.
The engineers at SCL are represented by a collective bargaining agreement (IBEW, Local 17).
Documentation
SCL utilizes a Network Construction Guideline that includes sections that inform design and construction. The Guideline contains sections for:
-
Safety
-
General items, such as voltage and current tables for cables
-
Drawing standards
-
Cable installation and testing
-
Services
-
Cables, bus bars and secondary taps
-
Primary splices and terminations
-
Transformer installation and vault preparation
-
Duct and pole risers
-
Vaults and handholes
-
Streetlights
-
Meters
7.4.17.16 - Survey Results
Survey Results
Design
Organization
Survey Questions taken from 2015 survey results - Summary Overview
Question 10 : Which of the following functions does your network engineering/planning group(s) perform? (check all that apply)

Survey Questions taken from 2012 survey results - Design
Question 4.1 : Do you have a dedicated / distinct network design group? Or are your network designers part of a design group that also performs non network design?

Question 4.2 : If yes, does your network design group do both electrical and civil designs?

Survey Questions taken from 2009 survey results - Design
Question 4.1 : Do you have a dedicated / distinct network design group? Or are your network designers part of a design group that also performs non network design?

Question 4.2 : If yes, does your network design group do both electrical and civil designs?

Question 4.3 : How many people perform Network Design at your company?

7.4.18 - Power Quality
7.4.18.1 - AEP - Ohio
Design
Power Quality
People
Power quality issues are addressed by the Customer Service Representatives working with the Network Engineers and the Network Engineering Supervisor in the downtown Columbus offices. Engineers can assist customers with power quality monitoring and also make recommendations for solving power quality issues.
Process
AEP Ohio has not experienced many issues with poor power quality in its network system. Most power quality issues are confined to customers’ on-premises switchgear, such as backflow from elevators.
7.4.18.2 - Ameren Missouri
Design
Power Quality
People
Power Quality issues are addressed by the Engineering Group within Distribution Operations, organizationally part of Energy Delivery Distribution Services, reporting to a VP. The engineering group is led by supervising engineer, and is comprised of Engineers and Energy Services Consultants (commonly referred to as Estimators) who deal with planning, design, and service issues.
Process
Ameren Missouri historically has had very few power quality issues arise in their network.
7.4.18.3 - CEI - The Illuminating Company
Design
Power Quality
People
Within the Regional Engineering department, CEI has a group that is focused on reliability and power quality (Reliability Group). The group is comprised of 11 people who focus on reliability performance improvement and reporting for the Illuminating Company (overhead and underground system performance). The Reliability group works closely with Underground Group and with Asset Management.
Process
In general, CEI’s approach to power quality is reactive; that is, they will perform power quality monitoring at a customer’s location upon receiving a complaint, or after a service issue has been raised. One exception is at major customer sites, such as an automobile plant, where they will employ proactive PQ monitoring.
Technology
CEI uses industry accepted power quality monitoring equipment such as recording monitors from Dranitz – BMI. They will utilize the software that was provided with the recording device to perform analysis.
7.4.18.4 - CenterPoint Energy
Design
Power Quality
People
The analysis of power quality issues with Major Underground infrastructure is performed by the Major Underground Engineering department. Most of the analysis is performed by the Consulting Engineer within the department, although other resources will be used as required, depending on the nature of the issue.
Process
Customer power quality issues typically come through the Key Accounts group. For example, a major customer may report that their chillers are tripping off or their computers are going down. The Key Account representative will mobilize the appropriate CenterPoint resources to respond to the complaint.
Technology
CenterPoint uses industry accepted power quality monitoring equipment such as recording monitors from Dranitz – BMI. They will utilize the software that was provided with the recording device to perform analysis.
7.4.18.5 - Con Edison - Consolidated Edison
Design
Power Quality
People
The Power Quality (PQ) group monitors PQ performance systems in networks and stations for the whole company. The department consists of three engineers, two technicians, and one specialist.
The group’s main focus is on customer analysis and problem resolution. In many cases, customer controls are too sensitive and respond to sags on the system. For example, Con Edison might experience a feeder lockout, and a customer control system could see a sag on the system, causing their facilities to trip (for example, elevator controls). In many cases, the solution is for the customer to change the settings on their controls to be less sensitive.
Process
The PQ group installs power quality monitors on the secondary of the network. More specifically, they select a multi-bank location in the middle of the network. They put the monitoring apparatus on the secondary bus, in a customer space. They do this for every network.
The group also places one PQ monitoring node in the area station that supplies that network. This monitoring point monitors the primary system behavior. The utility currently has installed a PQ node on the sub for each network in 48 out of 57 stations, with completion scheduled for the summer of this year.
Con Edison is in the process of placing a PQ monitoring node at every transformer in the station.
Technology
The older PQ monitoring installations use telephone lines to communicate information; the newer installations use Ethernet. Con Edison has worked with Dranetz to design new plug and play PQ meters for new installations.
The PQ group uses PQ view (from EPRI) to analyze the numbers and display the monitored information on PQ web. They also use PQ View to display information from their RTF application. RTF is Con Edison’s technology for predicting the location of faults in the underground (see the following RTF Application discussion).
Con Edison desires a flexible system that can integrate PQ data with other data, such as SCADA data. They are accomplishing this on a small scale using their heads up display (HUD) system.
7.4.18.6 - Duke Energy Florida
Design
Power Quality
People
Reliability management is the responsibility of the Network Planning group at Duke Energy Florida, which is organizationally part of the Power Quality, Reliability, and Integrity Group (PQR&I), led by a Director of PQR&I for Duke Energy Florida.
To perform planning and reliability management work, the group divides the Duke Energy Florida territory into four separate zones. The cities of Clearwater and St. Petersburg, part of the South Coastal Region, are included in one of the four zones. Every zone is assigned a Lead Planning Engineer and Senior Planning Engineer, who are responsible for all distribution planning activities within the zone.
Engineers/Planners in these zones work on Reliability as well as Planning. Because Duke Energy Florida has seen minimal capacity demand growth in its urban underground grid, Engineers in the PQR&I group spend much of their time planning reliability and infrastructure upgrades.
All Planners have four-year degrees in Electrical Engineering, a requirement for the position.
Process
Because of the inherently reliable nature of the network design, and because their network system has been well maintained, Duke Energy Florida has not experienced major reliability problems. They also have not experienced power quality complaints from customers in their network.
Duke Energy Florida does have a hardening effort underway which includes replacement and upgrades of network infrastructure, such as replacing oil switches with solid dielectric vacuum switches, rebuilding deteriorated vault roofs and grates, and replacing cable and components that are aging or with which they have experienced performance issues.
Duke Energy Florida does have a remote monitoring system installed and is collecting asset data. Some of this information, such as frequent network protector operations, is used by the Network Group as a trigger for action. Other information, such as network transformer data, is being collected, but is not yet being used to trigger action. Duke Energy Florida’s goal is to expand the use of condition based analytics.
Technology
Duke Energy Florida has installed remote monitoring in its vaults. It uses a Qualitrol system to monitor information such as transformer oil level and temperature, and the status of the Oil Minder system. It uses the Eaton VaultGard system to aggregate information from the protector relay, such as voltage, current, protector position, etc. VaultGard also aggregates information from the Qualitrol system. Information is communicated from the VaultGard collection box via cellular communications by Sensus, a third party aggregator of information.
In the Duke Energy Florida design for spot network services within building vaults, the network system ground is separate from the building ground.
7.4.18.7 - Duke Energy Ohio
Design
Power Quality
People
Duke Energy Ohio has a Power Quality group. This group is located in downtown Cincinnati, and are part of the Distribution Design organization within Field Operations.
Power quality issues associated with the Cincinnati network are usually addressed by the network Project Engineer. The Power Quality group assists the Network Project Engineer in resolving PQ issues.
Technology
Duke Energy Ohio has installed power quality monitors in their network substations at the transformer secondary. These monitors measure the current, voltage, power, and reactive power of each network feeder. These monitors also provide total power . / reactive power for each secondary network grid. The monitored information is tied in with the SCADA system.
Duke is not using routine sub cycle monitoring of network feeders. They will install digital fault recorders on network feeders when addressing a power quality issue.
7.4.18.8 - Energex
Design
Power Quality
People
Certain engineers or the Standards group within the Asset Management team supervise power quality issues throughout the network.
Process
Energex installs power quality monitors on the low voltage side of all distribution transformers greater than or equal to 300kVA, on substation transformers.
Energex is looking at moving to a 230-V standard (similar to Europe), where they are currently at 240 V +/- six percent. They believe there is enough tolerance for most residential customers to accept 230 V, except at industrial/manufacturing sites, which are at 250 V.
Technology
Voltage monitors are used throughout system for under/over-voltage monitoring.
7.4.18.9 - ESB Networks
Design
Power Quality
People
ESB Networks has a notable planning and documentation process that is based on continually updated criteria and standards. Input for planning and execution of projects can originate in any level of the company, from field crews through upper management.
ESB Networks standards cover all major aspects of the planning of its network underground system, including continuity, power quality, operational switching arrangements, substation designs, and environmental issues.
7.4.18.10 - Georgia Power
Design
Power Quality
People
Power quality issues are addressed by engineers in the Network Operations and Reliability Group, part of the Georgia Power Network Underground group. This group is responsible for remotely monitoring the network system. The Operations and Reliability Group is led by a Manager and is comprised of four-year degreed test engineers, and test technicians who deal system reliability issues, including power quality.
To advise customers on power quality issues arising on the customer’s side of the meter, Georgia Power has an Enhanced Power Quality group in the marketing department. This is a group of engineers who can assist customers with power quality monitoring and also make recommendations for solving power quality issues.
Process
Georgia Power has not experienced many issues with poor power quality in its network system.
7.4.18.11 - PG&E
Design
Power Quality
People
Power quality issues that arise in the network are normally addressed by the network planning engineer. PQ complaints in the network are rare, and usually stem from problems on the transmission system.
PG&E does have a separate Power Quality group that responds to PQ complaints. Within the Power Quality group, they have an engineer with over 15 years of experience in responding to PQ issues. The Power Quality group would typically assist the network planning engineer in resolving a PQ complaint.
7.4.18.12 - Portland General Electric
Design
Power Quality
People
Special Tester: The Special Tester position plays a major role in maintaining power quality and reliability throughout the system. Special Testers respond to power quality issues and voltage complaints.
The Special Tester assigned to the CORE has experience as a journeyman lineman, and has received additional training and technical skills, including a focus on network protectors and performing infrared (IR) thermography.
IR Technician: PGE also has an IR technician (IR tech) position. IR techs inspect primary systems and network protectors as part of the Quality and Reliability Program (QRP), a reliability-focused program offered to high-value customers. PGE has three IR techs who mainly focus on the transmission system, though they also work on high-priority secondary systems. None are dedicated solely to the CORE.
Distribution/Network Engineers: Three Distribution Engineers cover the underground network and have responsibility for network reliability. The Eastern District Central Supervisor, who reports to the Manager of Distribution and T&D Standards, oversees them. The underground Distribution Engineers are qualified electrical engineers.
Key Customer Manager (KCM): PGE has nine KCMs reporting to Manager of the Business Group. Generally, they are geographically distributed, with three on the west side, one downtown (and responsible for network customers), one in Salem, three on the east side, and one acting as a rover. KCMs liaise with large customers and communicate their needs. They may be involved when reliability or power quality issues emerge.
Process
Overall, due to the multiple redundancies in the design, the network is very reliable and has few outages. Accordingly, many of the reliability initiatives on the network and CORE focus on power quality and reliability for key customers. The network has few power quality issues and most arise when customers install 240-volt-rated equipment in a 216-volt environment. As a result, PGE is not presently investing in any significant hardening of the network infrastructure.
QRP Customers: In 2004, PGE offered the QRP to high-value customers requiring very high reliability. This program entails a high-level focus on quality and reliability, and targets 24 high-profile distribution and transmission customers.
QRP customers receive reliability reviews from PGE, including:
- An annual walk through inspection of underground facilities, including IR and visual inspections of equipment including splices, connectors, transformers, and pad-mounted switches
- Suggested targeted reliability improvement projects, including liaising with some major customers concerning distribution automation pilots
- Power quality metering with I-Grid or PML
- Tracking SEMI F47 power quality events, including momentary interruptions
- Root cause analysis for any events affecting service
- Meetings with account representatives, engineers, and field staff
- Crew checklist with requirements for hipot (high potential) testing all underground cables for all non-residential cables larger than 2/0 AL. This circuit verification is performed on network cables which have been out of service, before reenergizing the feeder. The crew foreman and Special Tester sign the checklist and it adds to the job records.
- Partial Discharge (PD) testing of newly installed cable terminations and splices
- Use of cable injection to extend the life of direct-buried cables
- Increased budgeting to replace cables with repeated faults or corroded concentric neutrals
- Installing all new primary cables in conduit
- Using all jacketed cables
- Transitioning from direct current (DC) hipot methods to alternating current (AC) very low frequency (VLF) cable testing of older cables
- Continue to maintain an on-line cable testing database of hipot readings and cable failures
- Root cause investigations and analysis on all significant outage events due to human error, equipment, or material failures
As part of QRP, IR inspections are performed on network infrastructure on a four-year cycle. This inspection includes all the primary infrastructure, beginning at the substation and including the network unit. The Special Tester or an IR tech perform inspections. Where resources permit, they may also IR test secondary systems.
PGE performs other activities as appropriate to bolster the reliability of the infrastructure to key customers. One example is the use of standby generators at one major customer to improve reliability and increase capacity. At another major customer, PGE is piloting the use of bolted connections for splices instead of compressions connections that have been traditionally used. For the purpose of this pilot, and to meet customer expectations, PGE is photographing each of the splices and the Standards Group is tracking the performance of the bolted connections.
Other Reliability Programs
PGE has a number of reliability programs for all its underground systems, including:
Monitoring Reliability (Non-Network): PGE’s Outage Management System (OMS) tracks and logs outages, and is integrated with the Customer Information System (CIS), GRID (an electronic map-based connectivity system), outage histories, and interactive voice response (IVR). All of this information is collated and a monthly evaluation ensures that the data is accurate. This verified data is used to calculate System Average Interruption Duration Index (SAIDI), System Average Interruption Frequency Index (SAIFI), and other data presented in PGE’s Annual Reliability Report.
Momentary outages are logged and recorded at substations equipped with supervisory control and data acquisition (SCADA) and MV90, a system that collects data at meters. Of PGE’s 146 distribution substations, 59% are fitted with SCADA and 35% with MV90. The remaining 5% of substations with neither system have readings taken monthly [1].
Power Quality:
Voltage Problems: PGE places recorders on circuits entering buildings if engineers need to understand what could cause voltage problems. The Special Tester downloads the recordings onto computers to analyze the issue. The Special Tester assigned to the CORE experiences slightly different issues then testers working on the radial system.
On the CORE, testers perform fewer recordings and work closely with the Network Engineers. One of Special Testers’ main jobs is to test the network protectors. They test the network protectors on the 480 spot networks once a year and the grid networks (125/216) every two years. The network protector testing is presently on schedule.
Fault Locating: To locate faults, crews use a DC hipot thumper, which all special testing crews have in the truck. Testers travel from manhole to manhole until they locate the fault.
Technology
PGE uses Oracle Network Management System (NMS) as an OMS system. Oracle NMS can integrate with CIS, GRID (an electronic map-based connectivity system), outage histories, and IVR to produce reliability metrics. Momentary outages are logged and recorded at substations equipped with SCADA and MV90, a system that collects data at meters [1].
- Seven-Year Electric Service Reliability Statistics Summary 2007-2013. Oregon Public Utility Commission, Salem, OR: 2014. http://www.puc.state.or.us/safety/14reliab.pdf (accessed November 28, 2017).
7.4.18.13 - SCL - Seattle City Light
Design
Power Quality
Unspecified
7.4.19 - Spot Network Design
7.4.19.1 - AEP - Ohio
Design
Spot Network Design
People
Spot network design of the networks serving Columbus and Canton Ohio, the two areas of focus for this urban underground network immersion study, is performed in Columbus by the AEP Network Engineering group, which is organizationally part of the AEP parent company. Within the Network Engineering group, the company employs two Principal Engineers and one Associate Engineer who are responsible for network design for AEP Ohio. These planners are geographically based in downtown Columbus at its AEP Riverside offices. The Network Engineering group reports to the AEP Network Engineering Supervisor, and is organizationally part of the Distribution Services organization, reporting ultimately to the AEP Vice President of Customer Services, Marketing and Distribution Services. The Network Engineering group reports to the AEP Network Engineering Supervisor, who in turn reports Distribution Systems Planning Manager. Distribution Systems Planning reports to the Director of Engineering Services who in turn reports to the AEP Vice President of Customer Services, Marketing and Distribution Services. In addition to responsibility for designs of the AEP Ohio networks, the Network Engineering group also provides consultative support services to the other AEP operating companies.
Two Principal Network Engineers primarily oversee the designs for Columbus networks; one Associate Network Engineer primarily oversees Canton, but often helps with Columbus-based projects. The Network Engineers are responsible for all aspects of the network design, from inception to implementation, including the preparation of work orders, material acquisition, site inspections, and project completion.
The Network Engineers perform all aspects of spot network design, including network unit design, equipment sizing, performing load flow analyses, vault designs, and preparing job drawings that describe the designs. A Technician assists the engineers with the preparation of drawings using MicroStation and AutoCAD. This is a full-time position and is assigned to the Network Engineering department.
Process
New service requests in the downtown areas served by AEP Ohio networks are referred to the Network Engineering group by Customer Service Representatives. Rather than dividing the territory by geographic location, AEP Customer Service Representatives are assigned service types, such as public works, new office construction, manufacturing, etc. In contrast, the Network Engineers divide the system up geographically, with each Network Engineer having responsibility for two networks (four total networks in Columbus and two in Canton). The Service Representatives know which Network Engineer to contact for customers services according to the location.
AEP has seen growth in spot network load in its downtown networks. Engineers note that while load on the network grids is declining, new buildings are moving into the cities and many are taking service through a spot network, while others are being served with radial designs using pad-mounted equipment.
Spot networks at AEP Ohio provide service at 480 V. In keeping with its double contingency design for its Columbus networks, each spot network has at least three transformers. Transformers are sized such that if any two transformers of a three unit spot are down, the remaining unit can carry the peak load and retain service to the customer.
Newer spot network vault designs include wall-mounted solid dielectric vacuum switches for each primary feeder supplying the spot, EPR insulated primary cables terminating on the network transformers with an ESNA style connection (elbows or T bodies), and transformer mounted network protectors (see Figures 1 and 2).

Figure 1:
Wall-mounted vacuum switch

Figure 2:
Primary termination on transformer
Protectors are designed with secondary disconnects to be able to separate the protectors from the collector bus (see Figures 3 and 4).

Figure 3:
Network protector

Figure 4:
Non-load break disconnects to separate protector from secondary bus work
AEP has historically used multiple collector bus designs, including bus duct, open copper bus bar, and cable bus designs. Its preference and current standard is to use a cable bus design that utilizes crabs (see Figure 5). AEP also installs disconnects between the secondary bus and the customer service (see Figure 6).

Figure 5:
Spot network vault secondary cable bus – note use of vertically mounted crabs
}

Figure 6:
Non-load break disconnects separating customer service from secondary cable bus
Spot network vaults are designed with systems that will de-energize vault components in the event of certain alarms. For example, a fire alarm system will drop the entire vault by opening primary switches if collector bus temperature sensor thresholds are exceeded. A transformer supped pressure alarm will result in the opening of the switch that supplies that transformer, dropping the unit from service.
AEP spot networks call for the customer to ties their ground to the building steel.
Technology
Network Engineers are guided by Network Design Criteria published by the parent company. CYME SNA and CYMCAP are used for circuit and load calculations and for producing network maps. Line drawings are developed in MicroStation and AutoCAD before turning them over to a Civil Engineer contractor to complete the civil designs. At the job conclusion, the “as-builts” are incorporated into CYME SNA and updated in the Smallworld GIS.
Design specifications include the following information:
-
Civil construction specifications, including customer vault dimensions
-
Full electrical components, and their specifications, including N-2 design criteria for transformers and feeders
-
Duct line specifications and grounding
-
Network protectors and Operation Center communications
7.4.19.2 - Ameren Missouri
Design
Spot Network Design
People
Design of the urban underground infrastructure supplying St. Louis, including spot network design, is the responsibility of the engineering group within the Underground Division, organizationally part of Energy Delivery Distribution Services, reporting to a VP. The Underground Division, led by a manager, consists of both engineering and construction resources responsible for the downtown infrastructure. The engineering group is led by supervising engineer, and is comprised of Engineers and Energy Services Consultants (commonly referred to as Estimators) who deal with planning, design, and service issues.
Engineers design the system, including network and non network vaults and manholes, size equipment, perform load flow analyses, and prepare line drawings that describe the designs. All engineering positions are four-year degreed positions. Some engineers within this group have their PE licenses, although this is not a job requirement. Engineers are not represented by a collective bargaining agreement.
The Energy Services Consultants (Estimators) take the one line designs developed by the engineers and complete the design package, including all the physical elements of the design. Estimators have a combination of years of experience and formal education, including two-year and four-year degrees, and are part of the union, IBEW.
Recently, Ameren Missouri has formed the “Underground Revitalization Department,” a team of engineers (all 4-yr degreed) focused on researching, evaluating, and developing plans for performing capital improvements to and revitalizing downtown St. Louis, including the network. Part of this group’s role includes addressing issues such as the development and update of planning criteria for the network, and the design of enhancements to the downtown area, such as developing potential designs to build a new substation to supply network load in St. Louis. Engineers who are assigned to this team will also participate in the design of spot network installations and indoor rooms.
Ameren Missouri has a Standards Group that has developed construction standards and material specifications for designs and equipment used in the network underground. These standards and specifications are used by engineers and estimators in developing network designs. Standards are available in both online and printed book format.
Process
Most new services to larger downtown loads in St. Louis are served with a dual, primary metered feeder scheme: either two preferred feeders, or one preferred feeder and one reserve feeder. There are existing spot network services within St. Louis, but new services are not served via a spot network. In some instances, Ameren Missouri may connect a service to an existing spot.
Ameren Missouri designs spot networks to n-1 for peak load, planned or unplanned.
Most spot networks at Ameren Missouri supply 277/480.
Most spot network locations in St. Louis are located within underground vaults, not within building vaults.
Typically, small to medium loads 500kVA and less requiring 120/208V service are normally connected to the network grid. Customers with larger loads, or who request 480V service are normally served from either a padmounted transformer or an indoor substation. Padmounted services are usually not practical within St. Louis because of the downtown congestion. The most common design for larger loads in downtown St. Louis is the indoor substation (also called “indoor room”).
Larger customers often receive primary metered service, with Ameren Missouri providing two primary supplies to the customer. These primary supplies feed into switches, either fuses or breakers as chosen by the customer, and can be manually or automatically (auto transfer) operated. After the breakers, lines feed into the primary metering gear, and then on to the customer switchgear or transformation. Note that in this arrangement, all equipment except cable and meters are owned by the customer, including the primary switches that precede the primary metering point.
For a secondary metered customer, Ameren Missouri provides the switches and transformation that precede the metering point. In this design, Ameren Missouri may provide either a preferred and reserve feeder, or a two preferred feeder design.
In ascertaining expected customer load, Ameren Missouri will look at similar buildings to estimate demand using square footage and expected load density by customer type. They will also perform a load flow analysis to understand the impact on the system of connecting the new load. They will run both the normal and n -1 cases.
Technology
Most larger load locations within St. Louis are fed using non-network designs. However, Ameren Missouri does serve spot network locations throughout the city. These are true spot networks, with multiple primary feeders, transformers and network protectors supplying large load centers (high rises). Primary feeders are dedicated to supplying the spot network or street grid loads; that is, they do not serve radial customers.
Note that Ameren Missouri’s secondary network grid is a 216/125 V network - they do not have any 480 V secondary grids.
7.4.19.3 - CEI - The Illuminating Company
Design
Spot Network Design
People
The design of the network is performed by the CEI Underground / LCI group (Design Group), part of the CEI Regional Engineering group, located in NRHQ (Northern Region Headquarters).
Process
The Cleveland network serves only two spot networks, each with a 120/208V secondary. Most major customers in Cleveland are served primarily by CEI’s 11kV sub transmission system – see 11kV Non – network Service to Large Customers - Non-Network Service - Process
7.4.19.4 - CenterPoint Energy
Design
Spot Network Design
People
Spot Network design at CenterPoint is performed by the Engineering Department contained within the Major Underground Group. The Engineering department is led by a Manager and is comprised of four main sub groups.
One sub group is a technical group that includes the engineers who design the protection schema and remote monitoring systems in the underground.
Another sub group, the Padmounts group, deals with the design of three phase pad mounted transformer installations, including looped commercial developments. This group is comprised of Engineers, Engineering Specialists, and is supplemented with contractor resources. This group is not typically involved in spot network design.
Another sub group, the Vaults group, focuses on vault designs, interfacing very closely with the Key Accounts Consultants (also part of Major Underground) who interface with large customers. This group is comprised of Engineers, Engineering Specialists, and is supplemented with contractor resources. Note this group designs building vault spot networks.
The final subgroup, the Feeders group, is focused on distribution feeder design. This group focuses on both network and non network feeders. This group is comprised of Engineering Specialists, Engineering Technicians, and is supplemented with contractor resources.
Process
CenterPoint provides a spot network service to customers at 12kV with a 120/208 V secondary. Transformer sizes are usually either 600 kVA or 750 kVA units. Each vault is designed with a firm capacity of 120% of one of the banks, the remaining bank in a first contingency. So, for example, a vault with two 600kVA units would have a firm capacity of 720 kVA.
CenterPoint also provides a 480V spot network service in a customer provided building vault (dry vault). In this design, the primary disconnects are normally mounted on the wall, remote from the transformers. These vaults are typically supplied by either 1000 kVA or 1500 kVA units. Each vault has a firm capacity of N-1 with 120% overload. So, for example, a vault with two 1000 kVA units would have a firm capacity of 1200 kVA.
All vaults have a visible disconnect, either a blade that is open in air or gas that they can see, or an Elbow that is parked. Before they check for dead and ground, they must have a visible disconnect on every point feeding that cable.
Technology
Below are photographs of facilities in a typical building vault. Note that the transformer and network protector are physically separate, a standard design at CenterPoint.

Figure 1:
Transformer and network protector

Figure 2:
Spot network vault secondary buswork
7.4.19.5 - Con Edison - Consolidated Edison
Design
Spot Network Design
People
Organization
Central Engineering - Responsibilities include Civil / Mechanical Engineering, Control Systems Engineering, Design Engineering, Electrical Engineering, Equipment and Field Engineering, and Environmental Engineering & Program Support.
Employee Development
Con Edison invests in developing its design employees through three distinct programs focused on employee development. One program is focused on the development of newer engineering employees, another at incumbent employees, and the third at bargaining unit employees who are entering the management ranks. The programs are described more fully on page 3-53 of this report. Note that these programs are not limited to design employees, but are available to all employees who qualify.
Process
Con Edison serves many spot networks (they call them 460’s). Typically, these consist of multiple transformers (with a 460-V secondary) located in vaults just outside a building, connected via secondary cables to network protectors located within the building. Con Edison has about 1800 transformers with a 460-V secondary. The utility has one limited 460-V street grid in Manhattan.
Note that in their spot network design, each network transformer is located in a separate vault, and within the building, each network protector is located in a separate room. In many cases, the transformers are located under the street outside the building, while the network protectors are located indoors.
In some cases, Con Edison serves a 460-V customer through a “Reach,” which is a term used to describe a situation where Con Edison serves a 460-V customer by tapping the 460-V secondary in one building and running cable to another. This arrangement “reaches” from one building to another. The utility installs a disconnect switch called a “Pringle Switch” (Eaton) to be able to disconnect.
7.4.19.6 - Duke Energy Florida
Design
Spot Network Design
People
Network design, including the design of spot networks at Duke Energy Florida, is performed by the Distribution Design Engineering group for Duke Energy Florida, which works out of offices in both downtown St. Petersburg and downtown Clearwater. The groups are responsible for designing new and refurbished network designs, as well as underground radial and looped distribution designs. The Distribution Design Engineering groups in Clearwater and St. Petersburg are led by a Manager, Distribution Design Engineering, and are organizationally part of a Distribution Design Engineering Group responsible for Duke Energy Florida’s Coastal region, led by a Director.
The Design Engineering group is comprised of two sub - groups: an Engineering group, comprised of degreed engineers, and a Technologists group, comprised of non-degreed Network Technologists. Work within the Design Engineering group, both in Clearwater and St. Petersburg, is assigned geographically, such that a designer (either an Engineer or a Technologist) is responsible for both network and non-network designs within an assigned geographical area. Some designers focus on commercial customers, while others focus on residential customers.
The Designers work closely with the distribution Planning group in designing spot networks. Planners perform load modeling and analysis and provide input to the designers. For new spot network locations, designers will develop and submit a preliminary design to a peer review group for comment and suggestions. This peer review involves construction personnel who will review the design for “constructability.” Work does not begin until a spot network design has been signed off by the review group.
The design of the network is also influenced by the Duke Energy Florida Standards group, which Group oversees all standards for distribution equipment and materials. One Engineer within the group oversees all network equipment standards for Duke Energy Florida.
Process
Duke Energy Florida has eight 277/480V spot networks locations in St. Petersburg. All are two feeder spot networks, some with two transformers and others with a four transformer configuration (In the four transformer spot, feeders use split, separated busses to the transformers, with the first feeder supplying the first and second transformer, and the second feeder supplying the third and fourth transformer). Two feeders supplying any one spot network are sourced from the same substation.
Note that years ago, downtown St. Petersburg did have a network grid, but the company moved away from that, with the spot networks being the only remaining secondary network installations in St. Petersburg. Most of the infrastructure in St. Petersburg is comprised of a primary and reserve feeder loop scheme, with automated transfer switches (ATS). The ATSs are tied in with SCADA and can be monitored and controlled from the DCC.
Spot networks are located in building vaults. At some locations, the installation is comprised of transformer secondary mounted network protectors. At others, network protectors are located separate from network transformers (see Figures 1 and 2).

Figure 1:
Spot network location with pad mounted transformer

Figure 2:
Indoor spot network location with separately mounted network protectors
Spot network vault civil maintenance, including maintenance of optional air conditioning, is the responsibility of the property owner. Many spot network locations include chemical fire suppression systems, installed at the owner’s expense. These systems are tested yearly by the property owners under Duke Energy Florida supervision.
Technology
Duke Energy Florida’s spot network design utilizes separately installed wall-mounted primary disconnect switches. Their current standard calls for a solid dielectric load break three-phase vacuum switch.

Figure 3:
Solid dielectric primary disconnect switches supplying a spot network
At 277/480V, Duke Energy Florida has standardized on the CM52, a fully submersible protector with a dead front design. Duke Energy Florida’s network protector specification also calls for features such as:
-
External disconnects, which are used to separate the protector from the secondary collector bus. These disconnects are a safety feature used in a 480V design to mitigate arc flash risks. On this network protector, the NP fuses are internal and link style, as Duke Energy Florida is able to create the visible break between the NP and the secondary bus using the disconnects. Note that the disconnects can only be opened with keys which can only be accessed when the NP handle is in the open position because of an interlock system (see Figure 4).
-
Wall-mounted ARMS (Arc Flash Reduction Maintenance System) modules, which enable a worker entering the vault to change the protection settings in the protector to reduce the fault clearing time and thus the arc energy in the event of a fault (see Figure 5).
-
A submersible Stacklight, which is an annunciator system that indicates network protector status through a series of different colored lights(see Figure 4).

Figure 4:
Top of network protector. Note the external disconnects and Stacklight

Figure 5:
Control box for enabling ARMS system
Duke Energy Florida does not typically utilize a secondary collector bus in its spot network vault locations. Rather, secondary is run in cable trays to a demarcation point with the customer’s facilities. Limiters are typically not used between service runs and the customer.
Duke Energy Florida also uses a remote monitoring system. The company uses the Eaton VaultGard communication platform for recording and aggregating data from the network protector and vault. This information is communicated through a Sensus cellular monitoring system to a central server every half hour. Within the Network Group, information from Sensus, such as secondary loading, is monitored daily. Note that the Sensus system is read only, with the functionality to remotely control equipment being disabled for security purposes.


Figure 6 and 7:
Spot network location
7.4.19.7 - Duke Energy Ohio
Design
Spot Network Design
People
Network design, including the design of spot networks, is performed by a Network Project Engineer and two Designers who are part of the Distribution Design organization. This organization is focused on all distribution design work for Duke’s Ohio and Kentucky utilities, including network design.
These resources work closely with one another and with the Planning Engineer focused on the network.
Process
Any significant new load within the geographic bounds of the Cincinnati network is served via a 480V spot network.
Technology
Duke Energy Ohio has 480V spot network locations throughout Cincinnati. These are true spot networks, with multiple primary feeders, transformers and network protectors supplying large load centers (high rises). Primary feeders are dedicated to supplying either the spot network or street grid loads; that is, they do not serve radial customers. There are a few isolated locations where a 480V service is fed from a spot vault to service an adjacent load.
Note that their secondary network grid is a 208 V network - they do not have any 480 V secondary grids.
Below are some photographs from a spot network vault.

Figure 1:
Spot Network Transformer

Figure 2:
Spot Network Protector


Figure 3 and 4:
Secondary Cables from Protectors to Collector Bus
7.4.19.8 - Georgia Power
Design
Spot Network Design
People
Design of the urban underground spot networks supplying metropolitan area customers in Georgia is the responsibility of the network engineering group within the Network Underground group. The Network Underground group, led by the Network Underground Manager, consists of engineering, construction, maintenance and operations resources responsible for the network underground infrastructure at Georgia Power. It is a centralized organization, responsible for all Georgia Power network infrastructures.
The Network Engineering group, led by the Network Underground Engineering Manager, is comprised of Engineers (Electrical and Civil) and Technicians concerned with the planning, design, and any service issues associated with the network. The Engineers are four-year degreed positions, while Technicians have a combination of years of experience and formal education, including two-year and four-year degrees. Engineers are not represented by a collective bargaining agreement.
In addition to the engineers with in the Network Underground Engineering group, the Network Underground group has two Principal Engineers who report to the Network UG Manager. These Principal Engineers also deal with issues of network design.
Engineers design the system, including spot network designs, vault designs, network unit designs, equipment sizing, perform load flow analyses, and prepare one-line drawings that describe the designs.. The design is then turned over to draftsmen who do final CAD drawings that detail all the specifications, both civil construction and electrical component, and input them into the GIS system. There are 12 design engineers and 5 draftsmen (called Technicians).
Georgia Power has a Standards Group that has developed construction standards and material specifications for designs and equipment used in the network underground. Standards are available in both an online and printed book format. Standards were first documented and codified in the 1970s, and they include what was already documented on the network from the 1940s and any new standards developed since then. It is a living document, and the responsibility of the Standards Group comprised of the Principal Engineers in the Network Underground group. The standards are divided into two main sections: civil construction and network specifications and design.
Customer requests for receiving spot network service usually come in through the Georgia Power Marketing group. Some Marketing group members are degreed engineers, others are not. All have extensive experience in performing standard load calculations. The Marketing group is not represented by collective bargaining.
Process
New services to larger loads in Georgia urban areas are served either with a spot network service, or with a dual, primary radial feeder scheme: either two preferred feeders, or one preferred feeder and one reserve feeder. These radial feeder schemes often include the ability switch with a “PMH” type transfer – not a fast transfer scheme. This type of service is fairly extensive at GA Power, as customers perceive the transfer service with two sources as more reliable.
There is no difference in electrical rates seen by the customer between a spot network service and dual primary feeder scheme. Costs differences are associated with the upfront costs for the infrastructure that is provided by the customer to accommodate the installation, with network vault costs being higher because of the need for more area, a higher fault rating for customer switch gear, etc. If a customer requires dedicated reserved capacity on a reserve feeder as part of a dual feeder supply, they must may for that reserved capacity.
Typically, contracts come in from Marketing after a request for service to Georgia Power. This is the case for most large customers. It is customary for the Marketing representative handling the account to provide engineering with the load requirements for customer site. The group has a standard procedure to choose from models of different load types. The group can calculate load factors on all types of equipment, and project customer demand. The models do not require demand curves, only winter and summer peak load calculations, and the type of business the customer is engaged in. These factors are calculated before turning the project over to the design engineers.
Most spot networks on the Georgia Power networks are 480V. (They do have some 4160V spot networks). A typical spot network vault will be supplied by two or three network units located within the vault. These units are sourced by 20kV network circuits. Georgia Power will allow multiple units in the same vault (room), as transformers are insulated with FR3 rather than oil. The most commonly used transformer sizes for spot network locations are 1000 and 2000kVA units.
Georgia Power uses a fully insulated (EPR) bus conductor for its collector bus. This may be more costly than designs seen in other networks, but Georgia Power is satisfied that it adds another layer of protection and reliability to the system and to its customers. In 480V spots, Georgia Power will position a current limiting fuse on the protector spade leading to the collector bus.
Technology
Georgia Power uses its GIS system to keep extensive and detailed maps of all spot networks. Spot network maps and designs are now drawn up in a CAD system by design engineers and draftsmen. CAD maps and designs are fed into GIS. In addition, design engineers refer to the Standards Group online or hard copy book for standard designs and acceptable variations.
Georgia power has remote monitoring and control of all network protectors in spot network locations. At large customer locations, they may have bus monitoring installed as well. Information from the spot networks is tied to the Network Operations center either through radio, or through a fiber system.
7.4.19.9 - HECO - The Hawaiian Electric Company
Design
Spot Network Design
People
Underground network design is performed by the HECO T&D Division. This group is part of the Engineering Department. The group works closely with the Planning Division in network designs.
The group is comprised of 2 lead engineers, 13 design engineers and a supervisor. All are four year degreed engineers with about half the group having their PE license.
Process
HECO serves 27 spot networks in Honolulu, all with 480y/277 V secondaries. Note that most major customers in Honolulu are served by HECO’s radial non – network designed systems.
7.4.19.10 - National Grid
Design
Spot Network Design
People
Network design at National Grid, including the design of spot networks, is performed by the network designer. This designer, a Designer C, performs all larger and more complicated network designs, including spot network designs, both electrical and vault.. This individual has a two-year degree, a requirement for the position. This designer also performs non – network UG designs. This designer works very closely with the field engineer, part of Distribution Planning, assigned to the underground department to support the Albany network.
Organizationally, the Designer C is part of the Distribution Design organization, led by a manager, and part of the Engineering organization at National Grid. This organization is structured centrally, with resources assigned to and in some cases physically located at the regional locations. The designers who support the Albany network are both physically located at the NYE building, in Albany.
The designer is represented by a collective bargaining agreement.
Process
National Grid Albany designs spot networks to n-1 for peak load.
National Grid has a 277/480 V spot network system supplied by five 34.5KV feeders and serving fourteen spot network locations. Two additional large customers are dual fed primary voltage customers off of these 34.5kV feeders. There are also ten customers fed from 11 spot networks off of the 13.2kV general network feeders. Three of these are 125/216v, the rest 277/480v. Additionally, there is one customer fed off of two of these 13.2kV feeders through a padmount (PMH-9) switchgear. Note that the primary feeders supply only the spot network loads – National Grid Albany does not have a 277/480V secondary grid network. Spot network locations are designed to n-1.
National Grid’s design calls diversified duct line routes for primary feeders to minimize the number of feeders in a given duct line. National Grid uses arc proof taping of cables. All duct lines are concrete encased, including primary cable ducts, and secondary cable duct. .
Much of the existing primary and secondary system is built with PILC cables. National Grid’s current standard calls for EPR insulated primary cables. The secondary cable standard calls for EPR insulated cables with a Hypalon (low smoke) jacket.
A typical spot network will consist of two to four network transformers sized to meet loading requirements (National Grid uses transformers from 500kVA to 2500kVA in Albany - 300kVa are used in smaller networks; most spot networks are served with either 2000 or 2500 kVA units). National Grid uses submersible transformers with throat mounted submersible type network protectors. Transformers are equipped with a primary disconnect and grounding switch.
Typically, small to medium loads requiring 120/208V service will be connected to the network grid. Customers with loads > 800 kVA will typically receive a 277/480 V spot network service.
Most National Grid spot network vaults in Albany are located underground, rather than in building vaults. Some spot networks are at grade level or on building roofs. The buildings will supply the vault, providing space, lighting and ventilation.
In the National Grid vault design, the collector bus is supplied by the customer and located in a separate vault, with the customer’s equipment. National Grid runs secondary cables from the spot network units, through conduits and makes the secondary connections on the customer collector bus. National Grid uses cable limiters on secondary cables feeding from the network protector to the customer.
Technology
National Grid has 14 different spot network locations in Albany served from five primary 34.5kv feeders. These are true spot networks, with multiple primary feeders, transformers and network protectors supplying large load centers. Three of the five primary feeders supplying the spot networks are dedicated to supplying the spot network; that is, they do not serve radial customers. The other two feeders also serve other loads, one supplying a large primary metered customer, and the other serving as a substation tie. There are also ten customers fed by 11 spot networks, and one dual fed through a padmount PMH-9 switchgear on the 13.2kV general network feeders.
Note that their secondary network grid in Albany is a 208 V network - they do not have a 480 V secondary grid network in Albany.
Spot network vaults are equipped with a ground fault protection system designed to trip (open) all of the network protectors in the vault in the event of a ground fault. The customer is required to buy, install, and wire the National Grid approved ground fault protection system. Ground fault protection system equipment is installed in the customer’s electric room. However, a current transformer required to monitor neutral currents is installed in National Grid’s transformer vault.
Below are some photographs from a spot network vault.

Figure 1:
National GridSpot Network unit Note - cable limiters protecting secondary cables feeding from top of protector

Figure 2:
Secondary cables feeding into customer equipment room

Figure 3:
CT that is part of ground fault protection system
7.4.19.11 - PG&E
Design
Spot Network Design
People
Network design at PG&E is performed by the planning engineers within the Planning and Reliability Department. This department is led by a Principal Engineer, who is also the department supervisor. This group does distribution planning for both the network and non-network systems, and is also responsible for network design. Eight engineers comprise this department. Six focus on the radial system, and two focus on the network system.
For network systems, the two planning engineers are responsible for distribution design.
Both network planning engineers are four year degreed engineers. The planning engineers are represented by a collective bargaining agreement (Engineers and Scientists of California).
The planning engineers work closely with project estimators (Estimators or Senior Estimators) who develop cost estimates and perform field checks to see if the design laid out by the planning engineer is workable in the field. The estimators also prepare the job packet for construction. PG&E has project estimators located in local offices to work with smaller projects, and estimators located in their Resource Management Centers, who work with larger projects. The estimators that work on network design projects are located in the San Francisco division.
Planning engineers and Estimators are represented by collective bargaining, Engineers and Scientists of California (ESC).
Process
PG&E designs spot networks to n-1 for peak load.
Typically, small to medium loads 500kVA and less requiring 120/208V service will be connected to the network grid. Customers with loads from 500kVA to 1MW desiring 120/208V service can be supplied by a 120/208Vspot network. Loads greater than 1 MW will typically receive a 277/480 V spot network service. PG&E does not have a 277/480V network grid.
In ascertaining expected customer load, PG&E will look at similar buildings to understand demand. They will also perform a low flow analysis to understand the impact on the system of connecting the new load. They will run both the normal case and n -1 case. The decision of whether to serve a customer from the grid or a spot may depend on the impact of the load and associated infrastructure additions to the overall grid capacity. If, for example, adding a new customer and associated transformers helps the grid in an n-1 situation, PG&E may decide to serve the load from the grid rather than from a spot.
In the network, PG&E services spot networks using UG vault type transformers. Most times, the buildings will put their spot network vault underground, accessible from both the building and the sidewalk. Customers provide the space, lighting and ventilation.
PG&E will design the layout for the spot network vault and provide specifications for the customer. A typical spot network is served by three transformers. Note that PG&E’s design calls for no more than two transformers in any vault without fire isolation.
In most cases, PG&E does not require the customer to supply a secondary collector bus. Rather, they use secondary cables in cable trays and tie the secondary directly to the customer’s service using landing lugs on the customer bus stubs (bus bar). See Attachment B for a copy of PG&E’s Service Entrance From Underground Vault Using Bus Bars standard.
Note, sometimes in a 208V spot, the number of cables requires a collector bus.
PG&E covers their secondary cables with rubber mastic and ties their secondary cables into the secondary bus. PG&E does not use cable limiters in spot networks.
Technology
PG&E has both 208 V and 480V spot network locations throughout San Francisco and Oakland. These are true spot networks, with multiple primary feeders, transformers and network protectors supplying large load centers (high rises). Primary feeders are dedicated to supplying either the spot network or street grid loads; that is, they do not serve radial customers.
Note that their secondary network grid is a 208 V network - they do not have any 480 V secondary grids.
Below are some photographs from a spot network vault.

Figure 1:
Spot Network Unit

Figure 2:
Secondary Cables from protectors to secondary cable

Figure 3:
Secondary Cables to customer service bus stubs
7.4.19.12 - SCL - Seattle City Light
Design
Spot Network Design
People
Organization
Network Design at SCL is performed by the Network Design Department, which is part of Energy Delivery Engineering. See Attachment A . The Network Design Department performs all planning and design of SCL’s networks.
The Network Design Department is made up of eight “System” engineers, who do all of the design for the network, and eight “Services” engineers, who interface with the customers, gather load information, coordinate construction activity, etc. The individuals in this group are four-year degreed engineers. Some have their PE licenses.
The engineers at SCL are represented by a collective bargaining agreement (IBEW, Local 17).
Process
SCL installs multiple network transformers with network protectors in the same vault to supply a spot network load. Depending on the size of the load, SCL may install two separate vault locations in the building. See Attachment C for an SCL schematic and photograph of a typical spot network vault installation.
SCL’s grounding practice in building vaults is to tie the system ground in with the building steel / grounding system.
SCL runs a separate low-voltage secondary neutral (in addition to the tape shield) through each vault tied in with the substation ground. This neutral is necessary for two reasons: to maintain ground connectivity to maintain the same potential from one vault to another, and to carry the neutral currents experienced with system imbalances.
Technology
Fire Protection
SCL uses both fire protection heat sensors and temperature sensors in vault design.
The fire protection heat sensors are designed to open all the network protectors in the vault when the heat sensor registers 225 ˚ F. SCL has installed fire protection heat sensors in 95% of its building vaults. These sensors are not utilized in “street” vaults.
The temperature sensors, part of the DigitalGrid (Hazeltine) system, send an alarm to the dispatcher at 40 ˚ C – well before the network protector trip threshold is reached. SCL currently has completed installation of these sensors in about 20% of their vaults. They plan to install these sensors in all of their network vaults (both in building vaults and in “street” vaults).
Cable Cooling System
SCL has designed and installed a novel chilled-water heat-removal system to increase the ampacity of cables at a certain location that was identified as a thermal bottleneck due to the number of adjacent network primary feeders, depth of burial, and other factors.
They have been successful in increasing the ampacity of these cables by 40% through the installation of this water-cooling system. See Attachment D for a detailed description of the project.
7.4.19.13 - References
EPRI Underground Distribution Systems Reference Book (Bronze Book)
7.4.19.14 - Survey Results
Survey Results
Design
Spot Network Design
Survey Questions taken from 2015 survey results - Summary Overview and Design
Question 25 : What is the typical number of feeders required to supply your spot networks?

Question 55 : If you have primary termination and switch on your network transformers, does your specification call for?


Survey Questions taken from 2012 survey results - Design and Summary Physical/General (Question 2.7)
Question 2.7 : How many feeders (minimum) supply your spot networks?

Question 4.11 : In a building vault, do you tie your neutral in with the building steel / ground system?

Question 4.12 : For the primary termination and switch, what does your typical network design utilize?

Survey Questions taken from 2009 survey results - Design
Question 4.10 : In a building vault, do you tie your neutral in with the building steel / ground system? (this question is 4.11 in the 2012 survey)


Question 4.11 : Does your typical network design utilize: (see Graph below) (This question is 4.12 in the 2012 survey)


7.4.20 - Standards
7.4.20.1 - AEP - Ohio
Design
Standards
People
Network standards for AEP Ohio are the responsibility of the Network Standards Committee. This committee has representatives from all AEP operating companies with urban electrical grid networks. The committee is responsible for formulating, studying, and recommending improvements or refurbishments to its operating company networks.
Note that while AEP’s approach to developing the standards is through this committee, selected engineers may “own” certain areas of standards focus. For example, one engineer is the point person for the network transformer standard, another engineer is focused on electrical stands, and another engineer is focused on civil standards. These point people work closely with regional representatives from across the system through the network standards committee.
Process
The network standards committee works closely with the parent company’s Distribution Services organization, and holds regular teleconference sessions on network findings, “lessons learned” in the field, and discusses potential network engineering solutions to common network design and reliability issues.
The following are examples of revised, modified, or new standards that were the direct outcome of teleconferences and studies made by the committee:
-
Replacement program for secondary cable
-
Adoption of the CM52 network protector
-
Upgrade to a new fiber-optic SCADA communications network
-
Use of “super vaults” wherever possible in new vault construction
Technology
Standards are available in both an online and printed format.
7.4.20.2 - Ameren Missouri
Design
Standards
People
Ameren Missouri has a Standards Group, led by a Managing Supervisor, and reporting to the Manager – Distribution Planning and Asset Performance. The Standards Group is responsible for developing and maintaining distribution standards for the company, including network equipment. This group also prepares material specifications for distribution equipment and engineering practice guidelines.
Within this organization are experts who focus on developing and maintaining specific underground standards. For example, they have a cable engineer, who is an expert with cable and cable systems, and responsible for the development of cable standards for the company (See Cable Design). Another example is a staff member who is a tools expert.
Standards Group engineers/subject matter experts are available to respond to questions and issues raised by the field force. The department has established key performance indices for service that include responding to materials issues within twenty calendar days.
Recently, Ameren Missouri has formed the “Underground Revitalization Department,” a team of engineers (all 4-yr degreed) focused on researching, evaluating, and developing plans for performing capital improvements to and revitalizing downtown St. Louis, including the network. Part of this group’s role includes addressing issues such as the development and update of planning criteria for the network, and the design of enhancements to the downtown area, such as developing potential designs to build a new substation to supply network load in St. Louis. Engineers assigned to this team will also participate in the design of spot network installations, and indoor rooms.
Process
Standards Group engineers work closely with the Service Test Group within Distribution Operations on developing equipment standards such as those for transformers and network protectors. Standards also work closely with Safety and Construction in the development of new construction standards.
Standards Group engineers visit each operating center at least annually to discuss issues with standards, communicate changes and gather feedback from the field force.
Standards Group engineers arrange and support training in new materials and equipment. For example, standards engineers participate in annual refresher training of the network unit delivered to the field force by the Distributions Operations Group. The Standards Group also arranges vendor demonstrations for the field force of new or changed equipment.
The Standards Group has implemented a formalized Unsatisfactory Performance Report (UPR) process used by the field force to report problems with distribution materials. The process includes:
- Claimant completes UPR form and submits to Supervisor of Standards - with sample of defective equipment if possible;
- Supervisor enters case into UPR database and assigns to Standards engineer;
- Engineer reviews report and sample, then determines response based on knowledge of item or report from manufacturer after submittal to manufacturer for analysis;
- Engineer responds to claimant and forwards to secretary;
- Secretary distributes to distribution list and posts on Standards website
(See Attachment B for a sample of the UPR form.) for a sample of the UPR form.)
Technology
Distribution standards and material specifications are available to employees in an on line format through an internal Ameren Missouri website, or in a printed book format. Updated standards books are issued about every two to three years. These updated include engineering practice guidelines.
The Standards Group issues a quarterly newsletter entitled “The Standards Report” that includes changes in standards that have occurred in the previous quarter as well as articles on relevant issues. (See Attachment C for a sample of the newsletter.) for a sample of the newsletter.)
7.4.20.3 - CEI - The Illuminating Company
Design
Standards
(Design Standards / Practices / Specifications)
People
FirstEnergy has a Corporate Operations Services organization which contains the corporate Design Standards organization.
The Design Standards organization is comprised of 9 people, either Engineers or Distribution Specialists with field experience. The group is “equipment line” focused, with a primary individual and a backup individual focused on a given equipment line (cable, for example).
The group is focused on the material, and works closely with the supply chain, including the selection of suppliers.
In conjunction with construction practices for ducted systems, FirstEnergy has formed a system wide group, Ducted System New Product Review Committee, charged with reviewing materials and standards associated with network systems. The group is lead by a Senior Engineer within the corporate Design Standards group, and has representation from all Operating Companies, including CEI.
The group meets quarterly and focuses on sharing new materials and specifications. A main focus of the group is communication. For example, FirstEnergy recently issued a new network protector specification and utilized this forum to communicate the issuance of the spec across the system.
Process
The group develops Material Specifications, Construction Standards, and Engineering Practices Manuals.
Material specifications exist for most of the equipment used in ducted manhole systems (cable, terminations, elbows, T bodies,etc)
There are minimal system wide construction standards for networks and underground ducted systems. For example, there is no standard design for an underground vault. Most of the construction standards for ducted systems exist within the individual operating companies, and are left over from the time when standards departments existed within each operating company. The Ducted Systems Users Group, focused on identifying and addressing the needs of the ducted systems across the company, has recognized the need to develop system wide standards for networks / ducted systems, and has recommended doing so. (See Ducted Network Underground Users Group)
Engineering Practices are documents that provide an in depth explanation of selected technical duties. For example, an engineering practice may provide guidance on transformer sizing. FirstEnergy has developed two Engineering practices that focus on networks; and Underground Distribution Network Design Practice, and a Cable Limiter Application Policy for Secondary Network Areas. (See Attachment A and Attachment E)
Technology
Standards / Specifications / Practices are available to employees as a hard copy documents or on FirstEnergy’s intranet (local drive).
7.4.20.4 - CenterPoint Energy
Design
Standards
(Design Standards / Practices / Specifications)
People
At CenterPoint, the Distribution Standards and Materials group (Standards group) is part of Distribution Engineering & Services Electric Distribution Engineering Group, a separate group from Major Underground. This group is responsible for distribution standards and materials company wide.
Major Underground has a Staff Engineering Specialist who liaises with the Standards group. This individual, part of the Major Underground organization, coordinates with Standards to address inventory issues and specification issues, and to coordinate equipment failure root cause analyses. This individual also works with vendors to troubleshoot equipment problems. In addition, this individual will perform incoming material inspections for switches and breakers, and perform site evaluations of new vendors.
Note that for most high volume material, the Standards group has material coordinators assigned who interface with CenterPoint operating centers on material issues. However, in Major Underground, because of lower volume of materials, and generally higher unit costs, CenterPoint utilizes the Staff Engineering Specialist to liaise with Standards as described above.
The Service Center – Underground Operations, where the Major Underground group is located, houses the “parent” warehouse for underground material for CenterPoint.
Process
The Standards group develops construction standards for Major Underground with input from the Major Underground design groups (Vaults, Feeders and Padmounts Groups). Civil Construction standards are included in the standards.
The Standards group does not currently produce engineering guidelines for major underground design, but they are considering developing such a guide.
The Standards group issues a monthly newsletter highlighting material and standards issues. Hard copies of the newsletter are provided to the field force.
7.4.20.5 - Con Edison - Consolidated Edison
Design
Standards
People
Con Edison has excellent documentation of work processes, guidelines, and standards. In every case where EPRI would expect to see formal documentation of a specification or procedure, Con Edison was able to produce an up-to-date document. Moreover, the standards themselves were properly aimed at their intended audience, with field guidelines including bulleted lists, tables, drawings, and so on, to facilitate the use of the guideline by field employees.
In some cases, Con Edison standards exceed ndustry standards. For example, their transformer standard specfications are more stringent that general industry standards and the IEEE standards.
Con Edison has expert resources that stand behind the information in their written documentation, and revisit it to ensure its continued currency and relevance. For example, Con Edison has expert cable resources that produce their network cable specifications. These individuals stay current on cable trends and ensure that the specifications reflect the latest industry thinking.
Process
Underground Network Equipment Standards Committee
Con Edison has an underground network standards committee that meets periodically (usually about six times a year) to address issues with underground standards and equipment. The committee includes representatives from the Distribution Equipment Engineering department, the transformer repair shop, and field construction representatives, both union and management. At these meetings, the group reviews equipment failure causes and characteristics. The members of the team perform vendor visits and attend seminars to give presentations. Con Edison focuses the meeting content on current needs and issues, such as responding to a safety incident. Con Edison has found this committee to be highly valuable for identifying and resolving issues with equipment and standards.
7.4.20.6 - Duke Energy Florida
Design
Standards
People
The Duke Energy Florida Standards Group oversees all standards for distribution equipment and materials. One Engineer within the group oversees all network equipment standards for Duke Energy Florida. This engineer is an Electrical Engineer, a requirement for the engineer who specializes in Network Standards. The engineer also has a PE license, a requirement to obtain certain levels within the engineer family. The Standards group reports to a Director, also required to be an Electrical Engineer.
Duke Energy has a Corporate Standards committee which focuses on developing common standards throughout the Duke Energy family of companies. Across the Duke Energy family of companies, there is a core Network Group of four or five members within the broader Standards groups that assist each other and collaborate on choosing all material and specification standards for the underground network throughout the company, including Florida. This core underground team draws on members from across the Duke Energy operating companies.
Duke Energy Florida has separate Overhead and Underground Standards documentation, with all content available on line. Network accessories are a separate chapter in the Underground book.
As a result of the merger between Duke Energy and Progress electric, the Duke Energy Florida Standards group is in the process of updating its Standards documentation, seeking to consolidate standards from the former companies and develop standard approaches where possible. This process is schedule to be completed mid-2017. The Network Standards book containing the Network Equipment subsection details both Duke Energy and Progress Electric (now Duke Energy Florida) equipment. The task of merging them is difficult as different equipment is currently deployed in the field. Wherever possible, the Standards group will recommend similar/equivalent equipment, depending on the deployment.
Process
Standards consist of both Overhead Standards and Underground (including networks) Standards books. Both are kept online. The Underground Standards book is broken out into sub-sections, such as Secondary Network Equipment, Switchgear, Cable, etc. (See Attachment F for a sample page from the standards book).
The group also maintains a Network Design Guidelines book, last updated eight years ago, which specifies recommended design criteria for networks, and a Network Training guidebook for recommended Network Engineer Training sessions. The training guidebook serves as an introduction to a training module covering network basics and includes documentation on Secondary Network Design.
For certain items, such as network protectors, the Standards book also details material specifications, used for purchasing equipment. For example, the Duke Energy Florida has standardized on CM22 (Eaton) network protectors, except at 480V spot network locations, where a CM52 is specified. Many of these specifications are determined in consult with the broader corporate wide Standards group. Duke Energy Florida standards engineers are planning to coordinate closely with engineers from Duke Energy Ohio to update Material specifications for network equipment, as the Ohio group has extensive network underground equipment.
As part of their process for modifying standards, all requests for changes in standards must go through the corporate Standards Committee, where approval can be granted or substitutes proposed.
A complication for the Duke Energy Florida Standards group is integrating its purchasing and procurement systems with the main accounting and ordering systems of the corporation. Florida underground Standards had to develop its own Compatible Units (CUs) for every component and work activity, and integrate it into the Duke corporate system. Previously, the Network group had work request numbers and ordered all CUs directly under that one number, rather than reporting/recording work and material in detail by CU. Commonly used network materials and components are now part of the main corporate system, with the exception of larger purchase items with long lead times, such as network transformers, which are special ordered.
Florida is in the process of moving its legacy Work Management and materials ordering system to Maximo. Once integrated with Maximo, contractors will also have the ability interface with the system.
Overhead Standards
Overhead systems are a part of the company Standards, which include all standardized components and materials for overhead construction. Most Overhead Systems are presented in the ordering system in a “kit” format (combinations of compatible units which comprise common designs) to simplify ordering and design work.
Manhole and Vault Standards
The Standards group reviews, approves, and publishes civil design standards for underground structures, such as manholes, duct lines, and vaults. Duke Energy Florida has existing, older specifications for pre-cast manholes, but is in the process of merging them with Duke corporate standards. Most new vault or duct line designs are custom built, however. As an example, the Standards Group, in cooperation with Network Designers, specified a custom vault for a spot network service to Duke’s new Distribution Control Center (DCC) including network transformers, network protectors, collector bus, and secondary services. The Standards group maintains documentation of “as builts” and any custom civil designs on the network. Vault and manhole design standards are contained in the “Duke Energy Florida Section 29; Networks, Vaults, and Transclosures.” (See Attachment D)
Cable Standards
Cable and Cable Accessory Standards are determined by the Network Standards group, in cooperation with the local (Duke Florida) and Duke Corporate Network Standards groups. Incoming cable and accessories are spot inspected to identify failures.
Failed cable samples are sent to a Duke Energy Florida Engineer for forensic analysis and/or sent to external laboratories for analysis.
One cable problem that Duke Energy Florida is addressing through standardization is related to currently installed T-body splices in the field. The older style center tap connection point between two T-bodies has an external, metal ring than can corrodes over time when submersed in water and creates a high stress point on the tap. Florida has standardized on a replacement center tap with an EPDM rubber coating. Florida is also evaluating whether T-bodies are necessary in new construction, particularly in locations where a three-way split is not required (simply connecting two cables). In these locations, they are substituting T-bodies, the historical design, with standard splices. One complication of replacing existing, corroded center plugs, usually found during inspections, is that many are underwater. If the water is removed (while energized), the plug may fault because it is using the water to de-stress. Experience has shown that if the water is removed, the center plugs typically fail shortly thereafter. Areas identified with the older style center plugs, with the exposed metal rings, are scheduled for replacement. Duke Energy Florida will de-energize the circuit segment to be worked and replace the center plugs as soon as possible. Standard operating procedure in the field is to spike the de-energized cable to make certain it is not live before any replacement work is performed.
Cable Splicing Standards
Duke Energy Florida currently utilizes push on and crimped splices as a standard, but is considering standardization on cold shrink splices using shear bolt connections as a future standard. Overall, older push on and crimp solutions have experienced some failures due to workmanship issues, and Duke Energy Florida believes that the new standard will minimize workmanship problems. The final decision had not been made at the time of this report, however.
Equipment Failure Reporting
Duke Energy Florida currently uses a Facility Management Data Repository to report and document failed equipment. The report, developed by Progress Electric, includes all relevant information, such as who discovered/reported the defect, where it happened, etc. These reports are issued as bulletins over the company’s internal network first to Standards, and then companywide via a Web portal. The emphasis at Duke Energy Florida is to catch defects before they lead to failures. The Network Group led the state in 2015 with these “good catches” that identified defects and corrected them before they caused network problems.
A Network Engineer is assigned to the Standards group who performs forensic analysis of failed components. Overall, however, Duke Energy Florida has seen very few failures over the years.
Technology
The underground network Standards guide is available online.
In terms of material, components, and work management, Florida is in the process of migrating from its legacy systems to Maximo, a Duke corporate standard. RTArm, by Logica Software, is now used by Duke Florida as a scheduling program, designed to support distribution operations. This will be integrated with Maximo, the system that is currently the Duke corporate standard.
Duke Florida also uses a company-wide Web portal for near miss and defective equipment bulletins. Engineers and Network Technicians can reference these bulletins, past and present, online.
7.4.20.7 - Duke Energy Ohio
Design
Standards
People
Duke energy has the standards department located in Charlotte. Within this organization, they have one individual, and engineer, who focuses in particular on developing and maintaining underground standards. This engineer works very closely with the field force. Any questions or issues with respect to underground equipment including conduit, faults, manholes, post, go through this individual.
The Standards department prepares the Construction Standards and a Construction Work Practices Book entitled the Underground Construction Handbook. These are two separate documents. The Construction Standards book typically describes standards at a higher level than the Construction Work Practices Book (Handbook), which drills down to the detail.
For example, for a standard for a lead splice, the Construction Standards book would contain a picture of the splice, stock numbers, pricing, etc. The UG Construction Handbook would contain detailed cutback requirements for preparing the splice.
See Attachment D for a representative splice drawing from the Underground Construction Handbook (A 15KV trifurcating stop joint drawing).
Note that Duke Energy is in the process of creating one Construction Standards book for the company, combining prior standards books used by Duke’s Carolina companies and Midwest companies. The current construction standards manual does not contain standards for network specific equipment such as network protectors or transformers. Duke has formed companywide team, with representation from around the company, to develop network standards.
Duke is not looking to create a common Construction Book for the company at this time, as these construction books contain location specific details of certain installations, such as details of the buss work at a particular vault in Cincinnati. These details are available on paper and online templates that can be used by designers. Note that because the Duke Energy system is combined of multiple operating companies, there is little standardization among the in-service construction across Duke Energy.
Process
Duke standards include detailed descriptions of the construction, drawings of the construction, as well as things such as stock numbers, pricing, and the amount of cluster labor associated with the installation of the standard, as well as any associated standards.
The standard department keeps these up-to-date on a regular basis. For example labor and material costs are revisited annually and updated based on a five-year rolling average of actual costs.
Construction drawings are usually developed in CAD or MicroStation.
Technology
Duke Energy displays its standards on an online standards viewer developed by Duke. This database includes standards for non-network specific components such as splices, but does not include network components such as network protectors and network transformers. Note that Duke Energy is in the process of creating standards for network equipment. They have defined the team, with participation from around the company, to develop standards for network components.
This software was developed by the standards department in collaboration with planning and the reliability and integrity group.
Standards information is available to field personnel through manual construction standard books located in the trucks.
7.4.20.8 - Energex
Design
Standards
People
The Standards group is comprised of engineers, mostly four-year degree qualified engineers, though some are engineering associate positions. The Standards group is a part of System Engineering, within the Asset Management group.
Energex has comprehensive engineering standards, construction standards, and maintenance standards. Standards are made available to employees on the internet. Energex performs a complete review of all standards on a one to three year cycle. As changes occur mid cycle, Energex distributes bulletins that provide the updated information to the employee base.
The Standards group also produces standard building block documents for different asset types, which serve as overall guides for installation of assets of each type. For example, Energex has a standard building block guide for network feeders, which serves as a guide for all planning, design and construction processes for all new feeder installations in substations, overhead and underground areas.
The Standards group also produces the material specifications for T&D materials. This group works closely with their counterparts from Ergon, a sister utility serving the remainder of Queensland, to develop specifications, and work closely with the vendors to evaluate products and with procurement to obtain products. Standards engineers perform the technical evaluation of all vendor offerings.
Process
The standards group has assigned a lead subject matter expert (SME) for each asset type. For example, one standards engineer may be the SME for new substation products. SMEs provide engineering support for issues that arise that are not covered in the existing standards guidelines.
Energex has also formed Operating Advisory Councils, with representatives from Standards, Design, and field resources who utilize the standards and materials specified by Standards. The OAC meets monthly, and includes jointers, who can provide real world feedback to the group on materials, tools, and standards. The OAC is also used to introduce new equipment. The OAC may establish dead trials of a new product at the Energex training facility performed by field workers to gather their feedback in the selection process.
Technology
Standards are all kept in documents in an electronic business management system. Standards manuals are updated and formally reviewed on a one to three-year basis. There are no hard copies of the standards; all are on the company intranet. Between formal reviews, when a new revision is made to the standards, it is posted in the appropriate manual and a bulletin is broadcast to company personnel. The bulletin details the change in standard and refers to the page number in the manual where the change has been made.
7.4.20.9 - ESB Networks
Design
Standards
People
Design standards for ESB Networks underground networks are developed by the Asset Investment group working closely with the Assets and Procurement group. Organizationally, both Asset Investment and Assets & Procurement are part of Asset Management. Within the Asset Investment group, there is a Specifications Group led by a manager. Within the Assets and Procurement group, there is an Underground Networks group which focuses on underground equipment such a cable, and a Strategic procurement group.
Process
Designs are comprehensively reviewed every five years. The recommendations and any changes are recorded and published on the ESB Networks intranet. In addition, engineers attend monthly meetings capturing information from field crews, planners, and asset managers for use in reformulating or proposing changes to design standards. For example, ESB Networks has moved to standardizing on SF6 switchgear due to its compact size and better resiliency in its underground network system. As a result, all new switchgear is SF6, and the company has a project underway to replace existing switchgear with SF6 over the next few years.
Technology
Design standards are reviewed and changes are recorded in the company online intranet for use by planners, design engineers, and contractors.
7.4.20.10 - Georgia Power
Design
Standards
People
Network standards are the responsibility of the Standards Group within the Network Underground group. The standards group is comprised of two principal engineers who work in the Network Underground group. One of these engineers reports to the Network UG Engineering group, and the other, directly to the Network UG Manager.
The Network Engineering group, led by the Network Underground Engineering Manager, is comprised of Engineers (Electrical and Civil) and Technicians concerned with the planning, design, and any service issues associated with the network, including standards and material specifications for network equipment.
In addition to the engineers within the Network Underground Engineering group, the Network Underground group has two Principal Engineers who report to the Network UG Manager. These Principal Engineers also support the development of network standards, policies, and procedures
Georgia Power maintains up to date material specifications and standards for network design and construction. The standards contain information pertaining to duct lines, manholes, vaults, cables, joints and terminations, services and network equipment.
The standards group also produces guidelines and functional requirements for vault design that are provided to customers responsible for the design of building vaults.
Process
Standards Group engineers work closely with the Testing Group within the Network Operations and Reliability group to develop equipment standards such as those for transformers and network protectors. The Standards Group also works closely with Safety, Maintenance, and Civil Construction in the development of new construction standards.
The standards group utilizes an informal process for vetting new standards with the work force. They will invite selected field foreman to the office and provide an overview of the new material. The Foreman will then introduce the new material to the field force. In the case of introducing a new device to the field, the standards engineers will prepare a demonstration, often with the participation of the vendor, and invite the field force to comment and provide feedback. This information is factored in before the new material is introduced to the field.
The process for reporting failed equipment is also informal. For example, if a splice fails, the decision of whether or not to perform a post failure forensics analysis lies with the field foreman. If the splice is very old, the foreman may decide that it simply came to the end of its life and not report it. If a newer splice, the foreman may package and send the failed splice into the standards group. Some forensics analysis of failed joints and terminations is performed by Georgia Power engineers, and other analysis is performed by NEETRAC.
Technology
Standards are available in both an online and printed book format. Standards were first documented and codified in the 1970s, and they include what was already documented on the network from the 1940s and any new standards developed since then. The standards are divided into three main sections: civil construction, and electrical specifications and design, and an engineering handbook.
7.4.20.11 - HECO - The Hawaiian Electric Company
Design
Standards
(Design Standards / Practices / Specifications)
People
HECO Construction Standards, Engineering Standards and Material Specifications are developed and maintained by the Technical Services Division within the Engineering Department.
The Technical Services Division is comprised of 9 people, either Engineers or Distribution Specialists with field experience. The group is “equipment line” focused, with a primary individual and a backup individual focused on a given equipment line (cable, for example).
The group is focused on the material, and works closely with the supply chain, including the selection of suppliers.
Process
The group develops and maintains Construction Standards, Engineering Standards and Material Specifications and for underground ducted systems.
Their Construction Standards book includes both standards for the construction of typical underground installations, such as a three phase pad mounted transformer installation, and Engineering Standards, such as a Conduit Application guide.
Technology
HECO Material Specifications are available to employees on the HECO intranet on a webpage established and maintained by the Technical Services Division.
The HECO Construction Standards are available to employees as a hard copy. HECO is currently in the process of adding these standards to the Technical Services Division web page.
7.4.20.12 - National Grid
Design
Standards
(Design Standards / Practices / Specifications)
People
Distribution standards, including standards for network equipment, are developed and maintained by the Distribution Standards group, part of Distribution Engineering Services. The group is also responsible for developing material specifications.
Distribution standards include a section on network equipment and enclosures, as well as separate sections for cables and joints. Standards are updated on a five - year cycle. The materials specifications section is updated annually.
The distribution standards for National Grid were developed by consolidating the pre - existing standards of the operating companies that now comprise National Grid. These standards include a section of standards that are representative of and applicable across all of National Grid, as well as standards that are uniquely applicable to one operating company or another.
Standards Engineers have a close working relationship with Work Methods resources (See Work Methods), also part of Distribution Services. This group serves as the eyes and ears of the field force, working closely with the field, performing job audits and writing underground operating procedures. Changes to standards are often communicated to the field through Work Methods and / or the use of Utility Bulletins (See Safety – Utility Bulletins.)
Standards Engineers also collaborate closely with the Underground Engineers.
Standards resources stay connected with industry happenings through continuing education and participation in industry groups such as IEEE.
Process
Distribution Standards are maintained on a five-year cycle.
The Standards group will annually communicate changes to the standards to the field through presentations. These presentations are used to communicate changes made to the standards book and to solicit feedback. New standards are reviewed, as well as the results of field audits (typically performed by Work Methods)
Field Audits, performed on random projects by Work Methods, are performed each year to identify and resolve issues with the standards and how they are being built. Work methods resources select jobs ad random, review the job design, and the “as built” construction to identify opportunities for improvement.
Ideas for new standards and materials are vetted and tested by the Standards group. As an example, the Standards group commissioned laboratory tests of various duct sealants before selecting a product as an National Grid standard.
National Grid’s process for reporting minor equipment defects is through the use of a Defective Equipment Report form. The person identifying the equipment defect would complete the form, and send it to Standards. National Grid has an Electric Operating procedure, EOP UG009, which tracks splice and other equipment failures. In addition, a splice form is required to be filled out by the splicing crew for splices made in conventional duct and manhole systems (not URD). These forms are given to a clerk for database entry.
For more significant defects or failures that may have resulted in significant outages or safety issues, National Grid will implement a formal incident analysis (IA) process. An IA team is formed with a team leader assigned by the company Safety Department. Standards would be involved in performing forensic analyses (either internally or externally) on failed equipment associated with the incident.
Technology
Distribution standards are available to field personnel both electronically and in manual form. National Grid maintains a standards website, which includes the ability to for the field force to submit questions. These questions are reviewed and answered on a weekly basis.

Figure 1:
Underground Construction Standards Book
National Grid communicates changes through the Utility Bulletin, a brief write up used to quickly communicate information to the field force, engineers and supervision. Utility Bulletins may include information about new products, including how to apply them and when to use them, as well as issues of work methods or safety.
7.4.20.13 - PG&E
Design
Standards
(Design Standards / Practices / Specifications)
People
PG&E has a standards department, entitled Electric Distribution Standards and Strategy located in San Francisco. The department, part of the Distribution Engineering and Mapping group, is responsible for developing and maintaining distribution standards for the company, including network equipment.
Within this organization, they have experts who focus on developing and maintaining specific underground standards. For example, they have a cable standards engineer, who is an expert with cable and cable systems, and responsible for the development of cable standards for the company.
For network equipment, the Standards Department works closely with the Manager of Networks, also part of Distribution Engineering and Mapping. The manager of networks has lead responsibility for network equipment and has produced a program reference binder for the San Francisco and Oakland networks. This binder contains key information about the network systems, including network strategies, roles and responsibilities, project information, capital and expense budgets, detailed work procedures, information about maintenance programs, training, and pertinent engineering standards, including standards for vaults, manholes, transformers, and network protectors.
PG&E also has a position called Senior Distribution Specialist, part of the Electric Distribution Standards Strategy group. There is one senior distribution specialist assigned to the underground system. This specialist is a subject matter expert, and acts as an interface between the Standards Department and field resources. (See Senior Distribution Specialist for more information). Specialists act as the “eyes and ears” of the Standards Department, and meet with standards engineers every two months to address issues.
Process
Electric Distribution Standards and Strategy group convenes a Standards Committee comprised of standards representatives, field representatives, field supervisors, and the manager of networks.
Technology
Distribution standards, and the information contained in the San Francisco and Oakland Networks Program Reference Binder are available to field personnel both electronically and in manual form.
7.4.20.14 - Portland General Electric
Design
Standards
People
For PGE, the network Distribution Engineers develop and maintain the standards for the network, which are then forward to the Standards Department for inclusion in company standards. For example, network engineering developed the cable and submersible transformer standards for the network. The reason for this arrangement is that the Distribution Engineers have the knowledge of the equipment unique to network systems.
The network’s engineers use some informal standards for vault construction and are working with the Standards Department to formalize the process. Network engineering is ultimately responsible for the design and specifications of vaults and vault equipment, and has overall responsibility for the appropriate standards.
Service & Design Project Managers (SDPMs) may also be involved in developing network standards. For example, one network SDPM is working on a standard for customer-owned vaults that house PGE equipment. This is often the case in spot network locations, where the customer provides the vault to PGE specifications, and PGE owns the equipment inside the vault up to the interface with the customer at the collector bus.
The Manager of Distribution Engineering and T&D Standards oversees the Standards Department. The group employs one technical writer and four standards engineers.
Process
Network Documentation: At present, PGE is working on developing formalized standards and specifications network equipment. The written specifications presently covering the network include network transformers and cables. PGE does not have a specific material specification for a network protector but has standardized on the Eaton CM52.
These standards are primarily material specifications that inform the purchase of equipment and are not intended to be construction guidelines for field crews. However, PGE has begun developing building/construction standards and best practices for the network by assembling and consolidating loosely stored standards drawings kept by distribution engineering.
PGE is presently gathering and consolidating documentation about the CORE network system, making it easier to locate standards and specifications pertaining to the underground network system. In addition, the utility is gathering the “butterfly” drawings depicting each vault and manhole. The butterfly maps show vault grounding. Distribution engineering is working with the Design Department to update these plans. In the future, the butterfly diagram will include the specifications for cable racking and spacing.
Vaults
PGE’s Network Engineers are responsible for vault construction standards. As with much of the network equipment, some of the standards associated with vault construction are informal, and PGE is working with the Standards Department to formalize them. At present, the designer, inspector, and customer discuss the specific requirements on a case by case basis. On the radial system, more Class A vaults are being constructed, so PGE is focusing on developing better standards for these before formalizing standards for new network vaults.
Other Standards
Ladder Extension: PGE is investigating installing underground ladder extensions on manhole/vault ladders to make it easier to get in and out of a vault/manhole. This could take the form of a temporary extension that can slip onto the existing ladder to extend it when crews work in a vault/manhole.
Power Tool Standardization: Across the company, PGE changed all its battery-operated tools to one brand instead of managing inventory, multiple brands, and multiple batteries. They now use a single brand (Makita) and single type of battery. (Sherman + Reilly batteries also fit the Makita tools.) The company also moved away from reliance on hand tools to mechanized/battery-operated tools in order to lessen the risk of carpal tunnel syndrome and improve ergonomics.
This may also improve work quality because it is easy to adjust the settings on the tools, allowing workers to make a more accurate crimp or a cleaner cut, for example. PGE can set tools to certain standards and document this, such as setting a certain crimping standard for the number of pounds to apply on a joint.
Bolted Connections: At a major customer, PGE is piloting use of bolted connections for splices instead of the compression connections that have been traditionally used. For the purpose of this pilot, and to meet customer expectations, PGE is photographing each of the splices. The Standards Group is also tracking the performance of the bolted connections.
Splicing: PGE no longer uses lead splices in the network, and replaces or transitions lead to EPR as opportunities arise. PGE uses both cold shrink and heat shrink technologies.
Quality Assurance (QA) Requirements
PGE has a good QA program with manufacturers, which is very detailed and includes vendor audits. The QA Tester is certified in ISO 9001 and, when undertaking an ISO audit, will bring Distribution Engineers to provide technical knowledge. The QA Tester audits the vendors’ manufacturing floor. For example, when they chose the Eaton Network Protector, Type CM52, the QA Tester looked at their manufacturing process and visited the vendor.
PGE thoroughly tests and audits equipment and component suppliers. This includes checking that the supplier follows QA procedures, such as ISO 9001:2008 [1]. If a component fails, PGE tests similar components in the batch to ensure that the fault is not a production issue affecting all units.
PGE will work with manufacturers and vendors to improve QA processes and equipment specifications on an ongoing basis. PGE also ensures that engineering diagrams are identifiable to a specific engineer to ensure traceability and accountability, as well as checks that all measuring and test equipment is calibrated and audited.
PGE can audit the production facilities to ensure compliance with PGE and other relevant standards. Inspectors will check processes and documentation. They may also request training documentation for employees at the facility to ensure that they have received the correct training [2].
New Equipment Audits/QA: At the Portland Service Center (PSC), PGE performs an intake audit/inspection of network equipment as it is received. All network equipment is delivered to the PSC, and the material/inventory clerk undertakes visual inspection for shipping damage.
Before network protectors are placed in the field, they are set up in the “shop,” configured with the initial settings, and cycled through various tests. The procedure includes the usual network protector maintenance procedures and tests, including the application of the test kit.
Transformer Turns Ratio (TTR) Testing: New transformers are TTR tested, either on arrival or before deployment to the field. The TTR test is an AC low-voltage test which determines the ratio of the high-voltage winding to all other windings at no-load. The ratio test is performed on all taps for every winding. Note that the Special Tester performs TTR testing.
New Cable Testing: PGE does not test new cables because they have had no issues and believe their cables are high quality.
PGE does perform a circuit verification test by administering a DC hipot test before energizing the cable after installation. Crews also perform VLF testing on the substation getaway cables. PGE is not performing tan delta testing. PGE is not testing secondary cables.
Example = Cable Standards
PGE has experienced few cable-related issues on the network, and part of that is related to its comprehensive cable standards. For example, on its underground system, PGE uses 15-kV EPR Jacketed Concentric Neutral Cable, which is covered by Specification L20506. Some of the cable characteristics in that specification are presented here.
The specification includes the 0.39-, 0.59-, and 0.79-in2 (500-, 750-, and 1000-kcmil) copper-jacketed cable sizes used on PGE’s network. The cable is suitable for use in ducts, direct burial, wet and dry conditions, and in sunlight and open air. The cable follows a number of industry standards and specifications. The center conductor is copper wire processed under ASTM B3, ASTM B496, and ICEA S-94- 649-2013, Part 2. The moisture barrier, outside diameter of the central conductor, and the conductor shield conforms to ICEA S-94-649-2013.
The insulation is class III ethylene-propylene rubber, meets the applicable standards, and can meet a maximum operating temperature of 221°F (105°C). The insulation shield is a black, semiconducting thermoset polymer polyolefin or ethylene propylene rubber extruded directly over the insulation. The concentric neutral conductor is flat-strap copper and can handle a neutral fault current capacity of 18,000 A for 12 cycles at a maximum of 221°F (105°C) normal operating temperature. The jacket is non-conducting black, polypropylene, or thermoplastic rubber, and the cable should be marked appropriately. Cable ends are capped to avoid water ingress.
Cable reels are made from steel and have a maximum size of 96 in. (29 cm) in diameter and 53 in. (16 cm) regarding maximum width. The inside cable end is fastened to the flange and delivered without wrapping. The outside cable ends are fitted with factory-installed pulling eyes, which act as a common eye for all three phases of the triplexed cable set. It has a maximum working strength equal to the sum of the maximum allowable strengths for each of the center conductors of the triplexed cable set. The pulling eye provides a waterproof seal for the cable end [3].
- Portland General Electric (PGE) Assessment Report of GE Shreveport, internal document
- ibid.
- Portland General Electric. From L20506 15-kV EPR Jacketed Concentric Neutral Cable, internal document.
7.4.20.15 - SCL - Seattle City Light
Design
Standards
People
Organization
Network Design at SCL is performed by the Network Design Department, which is part of Energy Delivery Engineering. See Attachment A . The Network Design Department performs all planning and design of SCL’s networks.
The Network Design Department is made up of eight “System” engineers, who do all of the design for the network, and eight “Services” engineers, who interface with the customers, gather load information, coordinate construction activity, etc. The individuals in this group are four-year degreed engineers. Some have their PE licenses.
The engineers at SCL are represented by a collective bargaining agreement (IBEW, Local 17).
SCL utilizes a Network Construction Guideline that includes sections that inform design and
construction. The guideline contains sections for:
-
Safety
-
General items, such as voltage and current tables for cables
-
Drawing standards
-
Cable installation and testing
-
Services
-
Cables, bus bars and secondary taps
-
Primary splices and terminations
-
Transformer installation and vault preparation
-
Duct and pole risers
-
Vaults and handholes
-
Streetlights
-
Meters
Process
Standards Meeting
SCL convenes a monthly standards meeting at which issues with the design standards are discussed and resolved. The meeting is attended by network design engineers and crew leaders.
7.4.20.16 - Survey Results
Survey Results
Standards
(Construction)
Ducted System New Product Review Committee
Survey Questions taken from 2012 survey results - Design
Question 5.9 : Do you have a process for inspecting or testing incoming network materials?

Question 5.10 : If yes, what material is inspected or tested?


Survey Questions taken from 2009 survey results - Design
Question 5.10 : Do you have a process for inspecting or testing incoming network materials?


7.4.21 - System Hardening
7.4.21.1 - CenterPoint Energy
Design
System Hardening
People
CenterPoint invests in initiatives to strengthen or harden its infrastructure. This includes things such as network equipment rehabilitation in Houston, hardening activities in Galveston, and reinforcing infrastructure to address potential contingencies, such as the catastrophic loss of a substation.
Process
CenterPoint had experienced failures of older network protectors. In older network units, the protector was attached to the transformer, so that some protector failures would result in a transformer oil fire. Similarly, primary transformer switches would sometimes fail catastrophically. CenterPoint decided to redesign a few network unit locations to physically separate the protector and primary switch from the transformer where space permitted. Most of the older protectors were replaced with new units, with communication enabled relaying. Where they didn’t have room, they would replace the transformer oil with a higher flash point alternate.
CenterPoint has also implemented efforts to improve their ability to back up major substations in the event of the catastrophic loss of the station. In one case, CenterPoint built additional overhead tie points to improve their ability to back up a particular station serving a major load center. In another case, they added infrastructure and ties to be better able to back up a major substation serving a key customer and major load center.
In 2008, CenterPoint experienced a hurricane (Ike) that severely impacted its facilities, particularly in the Galveston Area. As a consequence, CenterPoint identified certain areas to invest in hardening its facilities, so that they are better able to withstand the affects of a significant wind and flooding event. Hardening activities include things such as raising the elevation of key substation equipment, and using stainless steel equipment in coastal areas, including padmounted equipment.

Figure 1:
Elevated Substation Control House

Figure 2:
Elevated Substation Facilities
Major Underground has been involved in system hardening activities, including a particular project to redesign the alley ways in Galveston.
Parts of Galveston are served by overhead distribution in alleyways. This distribution is quite old and congested, with clearance issues in some locations. In some locations, the clearances were so tight, that if a customer wanted to perform a building renovation, CenterPoint would cut in primary and secondary isolators in order to de-energize the distribution in the customer work area. In an effort to resolve these issues, and to better harden the system against the effect of storms, CenterPoint developed a novel design.
Moving the infrastructure underground with a conventional underground design was rejected because of space issues (no room for padmounted switches or transformers), and because of the significant flooding that can occur in a major storm, as was experienced in hurricane Ike. Consequently, CenterPoint developed a solution where they install underground dead front style equipment on wood poles in the alley ways; that is, equipment that eliminates any exposed energized conductors.
The project, presently underway, includes retro fitting overhead transformers with dead front bushings and elbows, and the development and installation of a padmount style SF6 switch installed on an overhead pole and rack, with two line feeds (one main and one emergency) and four load feeds. In total, CenterPoint plans to install about thirty of these switches.
This novel design eliminates the alleyway congestion, and addresses CenterPoint’s concerns with clearances, safety and infrastructure hardness.
Technology
See the pictures below.

Figure 3:
Galveston Alleyway

Figure 4:
Transformer Bank – note elbows on primary

Figure 5:
Overhead Switch

Figure 6:
Overhead Switch (Close up)
7.4.21.2 - Con Edison - Consolidated Edison
Design
System Hardening
People
Planning for the Future (Third Generation group (3G))
Con Edison has formed a group tasked with addressing the challenges they face in meeting their projected demand and service needs given their current system design. Con Edison refers to their current design, which is a conventional networked secondary design, as second generation, or “2-G.” The group is referred to as the “3 G” group, in that they are focused on new, third-generation system designs to meet their challenges.
Many of the challenges that Con Edison faces are similar to those faced by other network utilities. In some cases the challenges may be exacerbated at Con Edison because of their large size and physical constraints. Some of the challenges they face are the high costs of redundant systems necessary to provide N-2 levels of reliability in parts of their territory, increasing fault current, limited physical space to expand the system, low equipment utilization factors, and new load types and distributed generation.
The 3-G group is looking specifically at ways to apply technology to reduce costs by avoiding or deferring capital expansions, increase operating flexibility, and increase equipment utilization while maintaining customer reliability and service.
For example:
-
They have performed international benchmarking studies and participated in employee exchange programs with foreign utilities to identify practices used in utilities internationally to address some of the same challenges that they face.
-
They are working with the vendor community to identify new technologies, such as fast switches that can be used to transfer load between feeders beyond the substation secondary bus.
-
They are redesigning their approach to substation design, seeking to avoid building them, or building new stations in a way that makes more use of installed assets, eases congestion, and makes their construction cheaper while being capable of operating with the same reliability.
-
They are revisiting their approach to connecting new customers, seeking changes to customer connection requirements that reduce the number of customers connected from the networked secondary grid.
7.4.21.4 - Energex
Design
System Hardening
Due to its unique geography, the Brisbane CBD is subject to flooding. As a result, Energex has done much to improve, harden and upgrade its infrastructure to handle worst-case scenarios, with a focus on reliance, mitigation options, remote control of devices, etc. The company has many best practice flood and contingency plans. See Flood Plan .
7.4.21.5 - Georgia Power
Design
System Hardening
7.4.21.6 - PG&E
Design
System Hardening
Transformers - High-Rise Replacement Program
People
PG&E has instituted a proactive program to replace oil filled transformers located in high rise buildings. The program is aimed at mitigating the potential effects of a catastrophic failure of an oil-filled transformer in a high rise location.
Replacement of transformers will be undertaken by the PG&E’s General Construction Department, using both internal PG&E resources and external contractors.
Process
In 2011 PG&E will be replacing 37 high-rise oil transformers with dry type transformers if vault size, ventilation, and other conditions allow. Otherwise, the transformers will be replaced with an explosion resistant main tank design utilizing natural ester oil.
The program calls for the replacement of any transformers within the footprint of the building, including the ground floor. The assumption is that many of the buildings may still be adversely impacted in the event of a catastrophic transformer explosion located in a vault below the building due to the lack of fire suppressant systems, and the inter-connectivity of the vault ventilation system with the building ventilation.
The program will replace a total of 92 high-rise units within three years. The majority of the replaced units will be scrapped because PG&E is moving to the single tank design in non high rise locations (see Transformer Design)
In addition, as part of the program, network protectors will be replaced depending on the age and condition of the unit. Since many of these protectors are relatively new, it is not anticipated that many of them will be replaced.
In 2010, as part of an interim step before beginning the major replacement project, PG&E pre-selected eight high-rise units, and changed out the main tank mineral oil with natural ester. Natural ester provides a higher flash point than mineral oil, and provides some additional time to install the dry type units. The units selected were ones where there were elevated levels of dissolved gases that appeared during the testing of the units.
Technology
In conjunction with ABB, PG&E recently developed and completed the selection of the new dry-type transformer to be installed in high-rise buildings in the San Francisco and Oakland.

Figure 1:
Network transformers are available with dry-type core and coil assemblies, and use special polyester resin or cast epoxy as the principal insulation means for primary and secondary windings. The choice depends upon the economics of the project
The typical Dry-Type Network Transformer in a typical high rise, PG&E owns the transformers, while the rest of the vault infrastructure is owned by the customer. The cables running up the buildings are steel jacketed with intermittent splices – these are customer owned. The customer typically runs a spare set of cables in the buildings.
Note that PG&E continues to work with ABB to develop a second generation dry type transformer with a smaller footprint.
7.4.21.7 - Survey Results
Survey Results
Design
System Hardening
Survey Questions taken from 2015 survey results - Design
Question 77 : Do you have any additional network “system hardening” initiatives underway?

Survey Questions taken from 2012 survey results - Planning
Question 3.13 : Do you have any network “system hardening” initiatives underway?

Survey Questions taken from 2009 survey results - Planning
Question 3.9 : Do you have any network “system hardening” initiatives underway?

7.4.22 - Three Phase Loops
7.4.22.1 - CenterPoint Energy
Design
Three Phase Loops
People
Major underground design at CenterPoint is performed by the Engineering Department contained within the Major Underground Group. The Engineering department is led by a Manager and is comprised of four main sub groups.
One sub group is a technical group that includes the engineers who design the protection schema and remote monitoring systems in the underground.
Another sub group deals with the design of three phase pad mounted transformer installations, including three phase looped systems used to serve commercial developments. The Padmounts group is comprised of Engineers, Engineering Specialists, and is supplemented with contractor resources.
Another sub group focuses on vault designs, interfacing very closely with the Key Accounts Consultants (also part of Major Underground) who interface with large customers. The Vaults group is comprised of Engineers, Engineering Specialists, and is supplemented with contractor resources. This group is typically not involved in three phase loops designs.
The final subgroup is one focused on distribution feeder design. The Feeders group focuses on both network and non network feeders. This group is comprised of Engineering Specialists, Engineering Technicians, and is supplemented with contractor resources.
Process
CenterPoint serves commercial developments with a three phase loop design. Three phase loops utilize three phase pad mounted transformers with three primary switches incorporated into the transformers. One switch is on the incoming feed, one switch is on the outgoing feed, and the third switch isolates the primary from the transformer.
In the normal configuration, cables feed in and out of these units in a loop fashion. If there is a fault in a cable section, CenterPoint can restore service by isolating the faulted section and switching within the transformer cabinets to restore customers. Note that in the loop design, customers are not restored until after the problem is found, or at least isolated to a cable section.
Note that CenterPoint does not use fault current indicators in its three phase loop design, as they have found the fault indicators to be unreliable.
Sometimes, CenterPoint will design a manhole in front each of the transformers rather than loop directly in and out of units. In this design, cables in the manhole would be tapped to and from each transformer. Often manholes are used because the primary must be installed before the contractor or customer is ready with the pads on which to place the three phase units. In this case, CenterPoint will pull cables to the manholes. Then, at a later date when the pads are ready, they will place the transformers units and pull the cable to and from the manholes.
The loop design is a reliable one in that load can be supplied from alternate directions. CenterPoint does offer an alternate design that provides even better reliability utilizing pad mount transformers in conjunction with a switch (See Padmount Transformer with Switch ). However, the installation cost of the three phase loop design costs is about half of the pad with switch option.
Technology
CenterPoint purchases three phase transformers with three switches, one being the incoming feed, one the outgoing feed, and the third switch isolates the transformer from the primary bus in the transformer. Three phase units are also purchased with taps.

Figure 1:
Three Phase Transformer - Primary Compartment Note three switches: A -in, B - out, and TX, which separates the transformer from the 12kV bus

Figure 2:
Three Phase Transformer - Secondary Compartment
7.4.23 - Vault - Manhole Design
7.4.23.1 - AEP - Ohio
Design
Vault Design
People
Network standards, including standards for vault and manhole designs, are the responsibility of the Network Engineering group in cooperation with the Network Standards Committee and the parent company, AEP.
The Network Standards Committee, headed by the lead Network Engineering Supervisor in its downtown Columbus offices, and comprised of representatives from all AEP operating companies. This group works closely with the parent company’s Distribution Services organizations, and holds regular teleconference sessions on network findings, “lessons learned” in the field, and discusses potential network engineering solutions to common network design and implementation issues. Vault and manhole designs used at AEP Ohio and throughout the AEP system are developed through this committee.
Process
During the design phase, AEP Network Engineers lay-out the design of network vaults and manholes using one-line drawings that indicate the position and dimensions of all internal components, such as duct lines, cable position and racking, transformers and network protectors, secondary bus, and grounding. These drawings are then converted to electronic architectural drawings by a Technician using MicroStation and AutoCAD. AEP works closely with its Civil Engineering contractor to prepare associated civil designs.
The electronic drawings are sent to the Civil Engineering contracting firm who is also responsible for the civil construction. The contractor is expected to construct the vault to AEP specifications, in consult with AEP Engineers. If changes need to be made in vault or manhole designs prior to or during construction, the contractor informs AEP Ohio Engineers who make changes to their electronic drawings. Note that AEP has worked closely with its civil contractor for many years and has a strong working relationship.
Wherever possible, AEP Ohio uses pre-cast manholes and vault designs. These designs include ground rod sleeves, as each new manhole and vault is designed to be grounded with two driven ground rods at opposite corners the vault, with a ground ring (usually 4/0 cu) around the vault/manhole. The grounding is not tied to the vault / manhole rebar. Note that this design differs from an historic design which had the ground bus mounted to the vault ceiling. AEP moved away from this design as deteriorating vault ceilings in older vaults could compromise the grounding system integrity. In spot network vaults on customer premises, the vault grounding is usually tied to the customer’s steel building frames (see Figures 1 and 2).

Figure 1:
Manhole grounding (older design) with ceiling-mounted grounding, note ground pad

Figure 2:
Manhole grounding (newer design) with floor-mounted ring bus
In cases of customer premise-based transformers vaults, such as a spot network vault or customer service vault, AEP supplies a Civil Engineering contractor with vault construction reference drawings that detail duct lines, transformer and network protector type and placement, and SCADA. Customer spot networks have at least three underground commercial transformers (UCTs), as all AEP Ohio network service is designed to operate in a double contingency (N-2). The Civil Engineer contractor builds the vaults under the supervision of the Network Engineering group. Historically, the AEP demarcation point between AEP and the customer has included connections at a customer’s bus duct, connections at a crab in the manhole, or connections at a disconnect switch. The current design calls for a set of 4500A disconnect switches, where customers pick up their load onto their switchgear on site. It is common practice for Network Engineers to inspect the customer site before commissioning. Customer vaults are a mix between on premise vaults in basements and sidewalk vaults on the street (see Figure 3).

Figure 3:
Sidewalk vault
The Super Vault
Of particular note is the inception of what AEP Ohio calls “super vaults.” After concerns were raised over space limitation in vaults, wherever possible, AEP is installing a larger vault design that can more easily accommodate its use of at least three transformers in the same vault, its use of an insulated secondary bus design that uses racked secondary crabs, its use of wall-mounted primary vacuum interrupters supplying each network unit, and use of submersible transformer mounted CM52 network protectors with disconnects between the protector and collector bus, and between the collector bus and customer switchgear. Where space permits, this larger vault design will be installed (see Figures 4 and 5).

Figure 4:
Spot network “super” vault. Note the wall-mounted primary disconnect switch on left wall

Figure 5:
Spot network “super” vault
Network Engineers design vaults with an insulated secondary busses that uses racked crab connections to bus the secondary cables coming from the protectors and to feed customer services (see Figure 6).

Figure 6:
Secondary collector bus using Homac crabs
Technology
Network Engineers design vaults and manhole according to the printed and online AEP Network Planning Criteria guide in cooperation with its Civil Engineering contractor. Vault and manhole drawings are compiled in MicroStation and AutoCAD and updates are made to Smallworld GIS for company-wide reference and access.
AEP Ohio uses the Eaton VaultGard system for monitoring and controlling network protectors over its dual-loop, fully redundant fiber-optic SCADA communications network.
AEP uses a ladder extension safety post on its permanently mounted vault ladders to facilitate vault entry. This device provides a handhold for safer movement to and from the ladder (see Figures 7 and 8).

Figure 6:
Ladder safety post extension

Figure 7:
Ladder safety post extension
7.4.23.2 - Ameren Missouri
Design
Vault-Manhole Design
(Vault Design)
People
In heavily populated areas such as downtown St. Louis, Ameren Missouri relies upon both network designs and non network designs such as indoor substations (also called “indoor rooms” at Ameren Missouri), to supply power to buildings.
The Ameren Missouri standards manual currently focuses on the electrical design protocols of network vaults. Ameren Missouri is in the process of adding civil design standards including vault structure, and manhole structure designs to the manual. Because building vaults (particularly, indoor room vaults) is often the responsibility of the customer, Ameren Missouri has developed comprehensive vault design specifications to enable external contractors to build safe and effective vaults that adhere to Ameren Missouri standards.
Design of the urban underground infrastructure supplying St. Louis, including network vaults and non network “indoor rooms”, is the responsibility of the Engineering group within the Underground Division, organizationally part of Energy Delivery Distribution Services, reporting to a VP. This Center, led by a manager, consists of both engineering and construction resources responsible for the downtown infrastructure. The engineering group is led by supervising engineer, and is comprised of Engineers and Energy Services Consultants (commonly referred to as Estimators) who deal with planning, design, and service issues.
Engineers design the system, including spot network vault designs (less common) and indoor room designs (most common). All of the engineering positions are four-year degreed positions. Some engineers within this group have their PE licenses, although this is not a job requirement. Engineers are not represented by a collective bargaining agreement.
The Energy Services Consultants (Estimators) take the one line designs developed by the engineers and complete the design package, including all the physical and civil elements of the design. Estimators have a combination of years of experience and formal education, including two-year and four-year degrees, and are part of the union, IBEW.
Recently, Ameren Missouri has formed the “Underground Revitalization Department,” a team of engineers (all 4-yr degreed) focused on researching, evaluating, and developing plans for performing capital improvements to and revitalizing downtown St. Louis, including the network. As part of this group’s role, they are addressing issues such as the development and update of planning criteria for the network, and the design of enhancements to the downtown area, such as developing potential designs to build a new substation to supply network load in St. Louis. Engineers who are assigned to this team will also participate in the design of spot network installations, vaults and indoor rooms.
Currently, the Ameren Missouri standards manual is focused only on the electrical design protocols of vault design, but the new manual currently under development will include civil design standards, including vault structure, manhole design, and handholds.
Process
Ameren Missouri has 265 vaults that house transformers and network protectors (and many more that are empty.) Most of these network vaults are part of the network grid system. A typical grid network vault is owned by Ameren Missouri and is located beneath the sidewalks.
Submersible vault “lift out” hatches for installing and removing the network unit are typically solid, not vented. Vaults are designed with two entrances, one on either side of the vault. Both entrances use ventilated covers. Ameren Missouri mounts a vault tag just under the access grate on the primary side of the network unit. In this way, an operator who is performing switching knows in which vault entrance to enter to perform switching.

Figure 1:
Ameren Missouri workers opening ventilated vault entrance cover

Figure 2:
Vault tag visible through the grate, indicating that this particular vault entrance accesses the primary side of the network unit
Vault entrances are designed with a pull – out access and protection apparatus referred to as either the “safety basket” or the “cage”. The “cage” is a device that is raised above the vault entrance, and is used to ease vault entry and exit by providing a hand rail for moving on or off the vault ladder, and for work area protection, by preventing either pedestrians or workers from accidentally falling into the hole. (See photographs below).
Vault ladders are permanently mounted to the vault wall.


Figure 3 and 4:
The 'Cage'
Technology
Ameren Missouri has installed a remote monitoring system in every vault on their network, providing automatic feedback of the conditions within vaults. This monitors voltage by phase, loading by phase, protector status, transformer tank pressure, oil level, oil temperature alarm status, and the water level in the vault.
This system uses ETI electronic metering in the protector relay, and the monitoring points are aggregated at a box mounted on the vault wall that communicates via wireless, with one box per network unit. The Power Line Carrier System transmits from the vaults to receivers at the area substations, with the information available on the intranet via Net RMS. The readings are tied in with SCADA.
Information is accessed via a computer, with the information provided by a third party, and the system obtains readings from the protector every 12 or 15 minutes. The system also allows operators to request the current status by polling protectors and provides graphics for easy comparison with historical readings. The system is new and is not yet fully accurate, but adjustments and improvements are ongoing.
The vaults do not use fire alarm systems. Some vaults have sump pumps that drain into the street or into the storm sewers, with socks preventing oil contamination.
7.4.23.3 - CEI - The Illuminating Company
Design
Vault-Manhole Design
People
Civil Design is the responsibility of the CEI Underground / LCI group within Engineering Services. This group maintains and establishes vault / manhole design standards for the region.
In addition, Corporate Standards has issued a Distribution Engineering Practice for Network Design that includes guidelines for a new vault and manhole design. (See Attachment A.) Note that CEI’s in place design predates the engineering practices guideline developed by First Energy.
CEI typically retains the services of five different contractors retained for to perform civil work.
Process
Civil Design is the responsibility of the CEI Engineering Services group.
A “Vault” at CEI, is an enclosure that contains a transformer, and is ventilated and kept dry. Vaults can be located in the street or in buildings. Customer Vaults inside buildings may contain customer switchgear.
CEI network vaults are designed with sump pumps. CEI is not utilizing oil sensing monitors to deactivate the sump in the presence of oil in the water in their existing vault installations. FirstEnergy’s Design practice does call for an oil sensor shut off control in new sump pump installations.
CEI’s present vault design calls for two separate personnel entrances. If the vault is to contain two transformers, they are to be separated by a firewall – or located in separate vaults.
In a vault within a customer’s building, the transformer ground is tied in with a ground around the vault, and is tied in with the building ground.
A “manhole” is an enclosure typically located in the street used for accessing cables. Manholes that contain equipment such as switches are designed with two separate personnel access openings.
CEI will build large “interceptor” manholes to intercept a number of substation exits cables before bringing them into a new station, or before they feed into the grid. CEI may also use an “area way”, which is a tunnel that is used to contain substation exit cables en route to a main manhole.
Technology
CEI utilizes precast designs for new manhole / vault installations. The only exception would be situational, such as the need to install a manhole around an existing duct bank, which would force a “pour in place”. CEI’s system does have some older brick manholes with dirt floors.
CEI is not using skid free vault and manhole covers. They are monitoring the OSHA proposed recommendations on a Friction Coefficient, but have not yet changed their standard. CEI avoids avoid putting vault and manhole covers in pedestrian areas such as cross walks.
7.4.23.4 - CenterPoint Energy
Design
Vault-Manhole Design
People
Vault Design is the responsibility of the Vault Design group within the Engineering Department. The Engineering department is part of Major Underground. The Vaults group is led by a Lead Engineering Specialist, and is comprised of five resources, including an engineer and Staff Engineering Specialists.
Process
These resources interface with major customers to design building vaults. The customer will provide CenterPoint information about their loads and preliminary drawings. The Vault Design group will develop the anticipated demand and design the vault layout to meet their load needs. CenterPoint doesn’t have a standard footprint for a building vault. Instead, they work individually with customers to establish vault dimensions and characteristics. If the customer asks for a standard, CenterPoint will provide them some information, but they have found that the customer’s architect will typically have changes.
CenterPoint will provide all of the specifications to the customer. For example, CenterPoint requires that the customer provide concrete encased duct bank to bring primary feeds into the vault. They require a 2 x 6 duct bank arrangement, using 6 inch conduits, with 4 inches of concrete cover and two inches of concrete between conduits. Upon initial installation, three of the holes will be occupied; two circuit conduits and a neutral conduit.
The actual infrastructure is built by the customer according to CenterPoint specifications. When built, CenterPoint will inspect the facilities to ensure they meet specifications.
CenterPoint prepares a Terms and Conditions document that contains information about what equipment they will put in the vault, customer expectations, CNP standards, and easement information. CenterPoint requests a “right to occupy” the vault space. This is a legal document that the customer must sign so that they can occupy the building.
Most new installations at both 12 and 35 kV are designed with a main feed and an emergency feed with an automatic transfer scheme. However, CenterPoint does have multiple spot network installations in place.
Technology
Vaults are designed with concrete walls and are equipped with pulling eyes. All transformer vaults have a minimum of two entrances, with fire doors with a three hour fire rating. The doors are equipped with panic hardware.
Building vaults are designed with a dedicated independent unit to ventilate the vault. CenterPoint does not permit the customer to use their air conditioning system to ventilate the transformer vault. They will allow the customer to install either air conditioning or forced air cooling, but they encourage air conditioning. The system must be a separate closed system so that air from the vault is not mixed with other building areas in case of a fire. Also, they require the customer to install smoke and fire dampers.
CenterPoint also uses thermostats in their air conditioned customer vaults. In certain vaults, when the temperature reaches 95 degrees the system will send a signal to the customer and an alarm back to CenterPoint’s remote monitoring system. When the temperature reaches 130 degrees, the thermostat heat probe system will trip a primary breaker to isolate the vault.
In certain vaults, the design includes a water sensor that will send an alarm to CenterPoint’s remote monitoring system and the customer if the water level rises to one level in the vault, and trip the primary breaker when the water level reaches a second predetermined height.

Figure 1:
Water Level Sensor
In some vaults, the water sensor will alarm the remote monitoring system, but not trip a breaker. CenterPoint will set this alarm level so that it alarms before a sump pump in the hole would begin pumping water or oil into the street. Note that CenterPoint is not using an Oil Minder system on sump pump installations,

Figure 2:
Heat Probe

Figure 3:
Temperature Control Box

Figure 4:
Remote Monitoring Control Box
In a network vault, the heat temperature probes will trip all network protectors.
7.4.23.5 - Con Edison - Consolidated Edison
Design
Vault-Manhole Design
People
Organization
Central Engineering - Responsibilities include Civil / Mechanical Engineering, Control Systems Engineering, Design Engineering, Electrical Engineering, Equipment and Field Engineering, and Environmental Engineering & Program Support.
Employee Development
Con Edison invests in developing its design employees through three distinct programs focused on employee development. One program is focused on the development of newer engineering employees, another at incumbent employees, and the third at bargaining unit employees who are entering the management ranks. The programs are described more fully on page 3-53 of this report. Note that these programs are not limited to design employees, but are available to all employees who qualify.
Process
Vault/Manhole Design
Con Edison has a specification that lists all standard and nonstandard types of transformer manholes and vaults and describes their application in forming various arrangements of single or multi-bank installations for 208V network systems.
Con Edison uses two standard-sized equipment installations within vaults: a 500-kVA transformer with protector (also referred to as a “network unit”), and 1000-kVA network unit. For 500-kVA network units, there are two standard reinforced concrete vaults: one that houses the network unit itself (the overall inside dimensions are: 11 ft, 0 in. L x 4 ft, 2 in. W x 7 ft, 0 in. H), and another that houses the crab connections of multiple transformer ties and services or street ties, or both (the overall inside dimensions are: 8 ft, 6 in. L x 5 ft, 5 in. W x 7 ft, 6 in.). These vaults are either pre-cast or field poured, depending on conditions.
For 1000 kVA network units, there are six standard and one nonstandard reinforced concrete vaults. Three of these are for the purpose of housing the transformers-protector units (each vault with different dimensions, and one vault design with a service takeoff). The remaining four are bus vaults, designed to accommodate the interconnections of 1000 kVA network unit secondaries, street ties and service take-offs (each with different dimensions and including a single bus, single bus with diving bell, double bus, and double bus with diving bell vault design). The standard vault structures are available as pre-cast or field poured, depending on conditions.
Con Edison has specifications for pre-cast vaults for use in sidewalk areas. These structures are designed to satisfy typical or “ideal” conditions. Cable entries and other openings are fixed for the most common applications of pre-cast structures, which makes for an inherent lack of flexibility in installation. Therefore, certain field conditions preclude the installation of pre-cast structures, and field-poured installations must be used.
Con Edison field-inspects a percentage (target – 50%) of the field-poured manholes and vaults installed each year. The focus of the inspection is to ensure the proper and adequate placement of rebar in the concrete.
Con Edison has a specification for the design and construction of 265/460 transformer vault and network compartments by a contractor.
This specification describes the division of responsibility between the contractor and Con Edison, and provides the dimensional requirements as well as the design and construction requirements for these structures.
Con Edison’s manhole specification calls for pre-cast floors, walls, wedges, and roof slab, with a cast iron manhole frame and cover.
7.4.23.6 - Duke Energy Florida
Design
Vault - Manhole Design
People
Network design, including the design of manholes and vaults, is performed by the Distribution Design Engineering group for Duke Energy Florida, which works out of offices in both downtown St. Petersburg and downtown Clearwater. The groups are responsible for designing new and refurbished network designs, as well as underground radial and looped distribution designs. The Distribution Design Engineering groups in Clearwater and St. Petersburg are led by a Manager, Distribution Design Engineering, and are organizationally part of a Distribution Design Engineering Group responsible for Duke Energy Florida’s Coastal region, led by a Director.
The design of network is also guided and supported by the Duke Energy Florida Standards group, which Group oversees all standards for distribution equipment and materials. One Engineer within the group oversees all network equipment standards for Duke Energy Florida. Duke Energy has a Corporate Standards committee which focuses on developing common standards throughout the Duke Energy family of companies. Across the Duke Energy family of companies, there is a core Network Group of four or five members within the broader Standards groups that assist each other and collaborate on choosing all material and specification standards for the underground network throughout the company, including Florida. This core underground team draws on members from across the Duke Energy operating companies.
Vault and manhole designs adhere to the Duke Energy Florida Standards Guide, as developed by the Duke Energy Network Engineers in cooperation with the corporate Duke Energy Standards group. See “Duke Energy Florida Section 29; Networks, Vaults, and Transclosures.” (See Attachment D .) This document contains manhole standards for various manhole configurations, information about manhole lids and cable racking materials, and guidelines for constructing both building vaults and submersible (sidewalk and street) vaults, including equipment placing, ventilation requirements, and sump pump installations.
Process
Manhole civil designs vary depending on the manhole configuration. For example, a three-way manhole has a different shape than does a two way manhole. Most in service manholes were built many years and were poured in place. All network feeders in downtown Clearwater (supplying a true 125/216V network) have their own network cable manholes/duct lines (not shared with Non- network circuits).
The duct bank configuration can vary depending on infrastructure, but a typical configuration is a 3 x 3 duct bank. Duke Energy Florida is consistent in the assignment of duct positions. For example, primary cables (12470 / 7200V) are always pulled through the bottom duct positions. The neutral (Duke Florida does pull a separate neutral) is always pulled through a duct in the same position (duct number five). Secondary cables are run in the upper ducts.
A standard manhole configuration for Duke Energy Florida includes insulated metal cable racks that support cables, with primary feeders located on the lower racks and secondary feeders on the upper racks see Figures 1 and 2). Duke Energy Florida specifies the position of facilities on the cable racks, with positions closest to the wall being the cable ties across the vault, middle positions being the street mains, and outside (away from the wall) being for services. Each manhole has a ground ring around the roofline tied to a driven ground. Every Duke Energy Florida manhole and vault has a driven ground.

Figure 1:
Cables feeding into manhole from duct bank

Figure 2:
Cable racks supporting secondary
Many existing manholes contain three primary feeders in one manhole. The designers realize that placing multiple feeders in one manhole increases the exposure and consequences of an event occurring in that manhole. Thus, for newer designs, designers strive to minimize the number of feeders in any one manhole hole. In underground radial designs, cables are routed to avoid a single-point-of-failure by using looped cables from pull boxes.
Duke Energy uses “mole” connectors for secondary cables and applies cable limiters.
Network vault designs, including vault dimensions and characteristics, and placement of required switchgear, network protectors, and transformers, etc., are created one at a time, according to the locality and design requirements at the site. Since there has been very low demand for vaults, this custom design approach has been satisfactory. Note that designs are informed by the Duke Energy Florida standards.
All underground vault transformers are specified as submersible units, yet maintained as “dry,” with sump pumps installed in all vaults.
Technology
Manholes
The Duke Energy Florida Network Group has developed a simulated manhole, made of plywood, for training purposes. This manhole, mounted on wheels so that it can be moved, contains cable racks and can be used for training of manhole configuration (see Figures 3 and 4).

Figure 3:
Training manhole - exterior

Figure 4:
Interior of training manhole showing racking
Duke Energy Florida Network Group maintains detailed manhole prints that show all of the facilities that are placed on each wall, duct bank positions, cable rack positions, as well as detailed manhole dimensions. On the drawing, each wall is laid flat on the drawing itself (if you were to take a scissors and cut the walls and fold them up you would replicate the manhole shape). See sample manhole drawing, Attachment E . PDF versions of the manhole prints and Excel versions of the supporting data sheets can be accessed from the GIS system.
Duke Energy Florida is investigating the application of self-ventilating manhole systems, though hadn’t installed any at the time of the practices immersion. They noted that their manhole tops are not designed with “lips,” making the installation of a Stabilock style system much more problematic. To add the lip to the existing opening would result in an opening which is too small (29 ½ inches). Consequently, to install self-venting manhole systems that require the lip for retention requires a change out of the manhole roofs, which is a costly effort.
Vaults
All underground vaults have sump pumps with an Oil Minders system installed, designed to alarm and stop pumping in the presence of oil in the water see Figures 5 and 6). The Oil Minder system is monitored by the Qualitrol system, installed in each vault.

Figure 5:
Network Vault, sump pump

Figure 6:
Sump pump Oil Minder system
All vaults have permanently installed, grounded ladders. Each vault has ventilated grates with two access points for a man to enter the vault – one on the primary switch side and one on the protector side (see Figures 7 and 8). At the time of the practices immersion, Duke Energy Florida was in the process of replacing vault grating systems (see Figure 9).

Figure 7:
Network vault, two entrances, one on either end of vault

Figure 8:
Network vault, permanently mounted ladder

Figure 9:
New vault top / grate
A typical network vault, located underground, contains a wall-mounted solid dielectric switch (such as the Elastimold MVS) as a sectionalizing point between the primary and the network transformer (see Figures 10 and 11). The handle of this device can be operated from outside the hole.

Figure 10:
Network vault, wall-mounted primary disconnect switch

Figure 11:
Network transformer, elbow connections supplied from disconnect switch
The transformer is supplied using ESNA style (separable) connections. The network protector (CM22) is typically mounted on the transformer secondary. Protectors are equipped with micro process or relays (Eaton MPCV) that monitor protector and other vault conditions.
Duke Energy Florida has installed remote monitoring in its vaults. It uses a Qualitrol system to monitor information such as transformer oil level and temperature, and the status of the Oil Minder system. It uses the Eaton VaultGard system to aggregate information from the protector relay, such as voltage, current, protector position, etc. VaultGard also aggregates information from the Qualitrol system (see Figure 12). Information is communicated from the VaultGard collection box via cellular communications by Sensus, a third party aggregator of information.

Figure 12:
Wall mounted VaultGard and Qualitrol data boxes. Information communicated via cellular through Sensus
In St. Petersburg, network designs are limited to spot network vaults which are located in buildings (see Figure 4-44). Building vaults are built and maintained by the customer and must conform to Duke Energy Florida’s design and maintenance requirements.
Building designs vary, but in general include a separate (from the transformer) primary disconnect switch, transformers, and protectors. Duke Energy Florida does not utilize a collector bus; rather, secondary cables are typically run on cable racks and trays. Duke Energy Florida will terminate its secondary cables at a junction terminal provided by the customer (see Figure 13).

Figure 13:
St. Petersburg, spot network vault, primary disconnects

Figure 14:
Spot network vault, customer interface
Duke Energy Florida has standardized on the CM52 for its spot network 277/480V spots. These protectors are equipped with various safety features, including:
-
External disconnects, which are used to separate the protector from the secondary collector bus. Note that the disconnects can only be opened with keys which can only be accessed when the NP handle is in the open position because of an interlock system (see Figure 15).
-
Wall-mounted ARMS (Arc Flash Reduction Maintenance System) modules, which enable a worker entering the vault to change the protection settings in the protector to reduce the fault clearing time and thus the arc energy in the event of a fault.
-
A submersible Stacklight, which is an annunciator system that indicates network protector status through a series of different colored lights.

Figure 15:
Spot network vault and NP handle disconnect
7.4.23.7 - Duke Energy Ohio
Design
Vault-Manhole Design
(Vault Design)
People
Network design, including vault design, is performed by a Network Project Engineer and two Designers who are part of the Distribution Design organization. This organization is focused on all distribution design work for Duke’s Ohio and Kentucky utilities, including network design.
Theses resources work closely with one another and with the Planning Engineer focused on the network to design modifications to the network.
Process
Duke Energy Ohio’s designers (CPC’s) work closely with the customer to design building vaults. Much of the ultimate design tends to be dictated by the customer. Duke is considering developing a more standard vault design that they can provide to customers, although the knowledge it will be difficult to enforce customer compliance with the standard. (For example, a customer may not be willing to, or be able to provide the physical space required by the Duke standard)
See Design - New Service Design for more information
Technology
Collector Bus
Duke Energy Ohio designs and fabricates the collector bus is used in vaults. These buses are made of copper flat stock for both the collector central bus itself and for the “services” into the customer’s switchgear.
The secondary collector bus, energized from the network protectors, is designed with a fuse panel for each large load fed off the bus. Network protector type fuses (sand type) are used. Duke has six basic fuses that they maintain for the fuse panels.
The collector bus design tends to be custom, as customer requirements dictate the final design. Duke Energy Ohio does have some basic standards, but they deviate from them frequently as the older standards are based on underground vaults and much of the work in the past 10 years has been in overhead vaults. In general, Duke has increased spacing requirements because of larger equipment size.

Figure 1:
Secondary cables from network protectors energizing collector bus

Figure 3:
Copper flat stock from central collector bus to fusing

Figure 4:
Fuses between collector bus and customer load

Figure 5:
Copper flat stock services from fuses to customer load (taped)

Figure 6:
Secondary collector bus in a submersible vault (Note the wall mounted protectors in this older vault. )
Fire Protection
Duke Energy Ohio designs its vaults with a fire protection system. This system is designed to open up the network protectors in the vault in the event of a fire. Historically Duke had used a Fenwall fire protection system. This system is inspected yearly as part of the fault inspection.
Duke is in the process of installing a new fire protection system as part of their rehabilitation efforts in the network.
Duke Energy Ohio uses arc proof tape within its network.

Figure 7:
Fire wire installed on collector bus

Figure 8:
Fire protection system control box
Salt Contamination
Duke has had problems with equipment deterioration due to salt contamination. In their transformer design, they install a protective shield over the transformer primary termination to protect the terminations from salt and other contaminants. In selected vaults, they will place a fiberglass barrier over top of the network protector.
Their transformer specification includes paint specifications that take this potential for salt contamination into account.


Figure 9 and 10:
Protective Barriers


Figure 11 and 12:
Protective Barriers
Duke is not using cathodic protection in the network. They noted that their network vaults are very dry.
Sump Pumps
Duke, Cincinnati vaults are designed with drains that are tied into the storm sewer system. Most of their vaults are dry; consequently, they do not use sump pumps. Note - Duke Indiana, in their Terre Haute network, does use sump pumps in their vault design.
7.4.23.9 - ESB Networks
Design
Vault Design
(MV Substation Building)
People
The ESB Networks Asset Investment group is responsible for establishing specifications for its MV substation vaults. Within this group, there is a Specification Manager who is responsible for establishing the specifications for MV substation building construction..
Process
In most cases, the indoor substation building vault is built by the customer to meet the specifications established by ESB Networks. After completion of building the vault, the customer is required to complete a “Certificate of Completion for MV Substation,” indicating that the design meets ESB Networks’ specifications. An ESB Networks representative performs a formal final inspection and acceptance of the completed substation building room before installing the electricity connection.
Technology
ESB Networks’ standard vault design for a MV substation is an indoor room design. Virtually all of the 2040 MV substation vaults located in Dublin are of this aboveground, indoor room design. ESB Networks has almost no submersible distribution equipment on their system.
Located within the vault is a standardized MV “packaged substation” consisting of an SF6 gas insulated ring main unit, the MV transformer (in Dublin, typically a 10-kVA primary to a 430-V secondary), and the secondary bus and protection that feed the secondary “mains” that supply the LV system in downtown Dublin.
The current design of the primary switch is an SF6 gas insulated ring main unit device, with and “in” switch, an “out” switch, and a fused, switched tap leading to the transformer (kkt). The company describes these units as “maintenance free,” and obtains them from a supplier through a lease arrangement. ESB Networks does have older oil insulated devices installed on its system as well.
ESB Networks’ design is to loop its 10-kV MV feeders in and out of these switches, designing normally open tie points between feeders. This provides them the ability to sectionalize to isolate outage sections and to feed each MV transformer from either direction.
ESB Networks’ standard primary switchgear (ring main unit) is a “load make,” but not a “load break” device. The switch is designed with an anti-reflex handle that prevents an operator from inadvertently and reflexively opening the switch if the operator happens to close into a fault, as the device cannot break load. If the operator does close into a fault, ESB Networks relies on the tripping of the breaker that sources the 10-kV feeder.
The primary cable that runs from the primary switchgear to the transformer is laid in a cable tray (duct), which is easily accessible by removable duct covers either made of wooden blocks, or a glass reinforced polyester material.
Standard transformer sizes are 200, 400 and 630 kVA, with the 630-kVA unit being the most prevalent. Most customers in Dublin are served from the secondary system but Dublin does have about 170 customers that take primary service at 10 kV. ESB Networks’ standard transformer is a dual-voltage unit, as most of its service territory outside of Dublin is served at 20 kV, while the feeders supply downtown Dublin Park at 10 kV. ESB Networks describes these transformers as sealed units that do not require routine oil testing.
Secondary mains emanate from a secondary cabinet mounted adjacent to the transformer. The secondary mains are fused. The ESB Networks specification calls for the substation room structure, including the floor, walls and ceiling, to have a four-hour fire-rating.
The reinforced steel that is incorporated into the substation floor is also grounded. (If reinforcing steel is not incorporated in the substation floor, the customer must install a copper mesh below the floor.) The substation ground system is isolated from the customer side grounding system.
The standard substation doors are hot-dip galvanized steel doors that include vertical louvers that allow for maximum ventilation while permitting no access to foreign bodies. Note that the doors do not have a certified fire-rating because they open onto a low fire risk, outside location. The standard door design includes access hatches for the access of temporary generator cables into the station if required, and for the customer to install a smoke detector (see Figure 1).
Each room contains an oil containment vessel, in case of a transformer oil leak.
ESB Networks has not installed any remote monitoring in these MV stations (see Figure 2).

Figure 1:
Steel doors

Figure 2:
Transformer and secondary gear
7.4.23.10 - Georgia Power
Design
Vault Design
People
Network standards, including standards for vault designs, are the responsibility of the Principal Engineers at Network Underground that report directly to the Network Underground Manager.
Organizationally, the Network Underground group is a separate entity, led by the Network Underground Manager, and consisting of engineering, construction, maintenance and operations resources responsible for the network underground infrastructure, including the development of standards for network equipment.
Network design is performed by the Network Underground Engineering group, led by a manager, and comprised of Engineers (Electrical and Civil) and Technicians concerned with the planning, design, and any service issues associated with the network. The Engineers are four-year degreed positions, while Technicians have a combination of years of experience and formal education, including two-year and four-year degrees. Engineers are not represented by a collective bargaining agreement.
In addition to the engineers within the Network Underground Engineering group, the Network Underground group has two Principal Engineers who report to the Network UG Manager. These Principal Engineers also deal with issues of network design, and are responsible for the development and maintenance of standards for network equipment, including vault standards. Standards are available in both an online and printed book format. The standards are divided into two main sections: civil construction and network specifications and design.
Process
Georgia Power’s standard vault design for a submersible vault is a poured in place design. Submersible vaults are accessible through manholes and through grating, depending on location. Vaults typically have a rectangular opening on top that is large enough to move a transformer through, with two hatch covers with a center support than can be removed (See Figure 1).

Figure 1:
Vault Entry through manhole access. Note the removable hatches beyond the manhole for installing / removing the transformer
Vault access is through manhole covers, using permanently mounted ladders. In some cases, the access ladder will bring you to the top of the transformer, with another permanently mounted ladder to bring you to the ground. Some vaults have ladder extensions (“Ladder Up”) to facilitate vault entry. For manhole (not vault) entry, fiberglass sectional ladders (side rails are fiberglass, rungs are aluminum) are dropped into the manhole (See Figure 2).

Figure 2:
View from inside the transformer vault. Note permanently mounted ladder to the top of the transformer (right side), and the permanently mounted ladder on the wall for access to the vault floor (left side)
Submersible vaults / manholes have bay forms built into the corners to take the bend out of the cable in the manhole. Therefore, the cables can maintain their bending radius and still be close to the wall. Typical duct sections come in various formations, 6 inches duct in a 2xX configuration.
Georgia Power uses both pre-cast and poured in place manholes, with pre-cast being the standard for most. The precast manhole includes a one inch sleeve for future driving of a ground rod in the manhole.
For a customer vault in a new building, the customer is provided with a copy of Georgia Power vault requirements, and prepares a vault design per those requirements. The final vault design must be approved by Georgia Power. For a customer-premise vault, Georgia Power brings the duct line to the edge of the property, where it meets the street; the customer builds the duct line from the street into the building, and they build the vault. It is not uncommon for an engineer from Georgia Power to make site visits prior to and during customer vault construction to make certain the vault meets the company’s standards and will accommodate the transformers and equipment needed. Typical vaults including customer-based vaults for spot networks often contain multiple transformers. Georgia Power standards call for ample room in the vaults for future expansion and to provide adequate ventilation.
The vault standards for customer buildings do not call for fans, as Georgia Power does not want customers to rely on them in case of any failure. Instead, vaults are designed with ample space for open ventilation. Georgia Power does all cable racking, not the customer (See Figure 3.).

Figure 3:
Spot Network Vault
(See Attachment C for a typical drawing indication the duct line terminus to a customer property.)
A notable practice in cable racking in manholes is the use of the Georgia Power Peachtree racking system (See Figure 4). This system calls for consistent racking approach that consists of primary cables racked on the bottom, with secondary cable pairs racked above. Cables are clearly marked and numbered, and this approach facilitates future expansion out of the manhole. Georgia Power has found this is a tremendous benefit in standardizing design, streamlining maintenance, and providing greater worker safety.

Figure 4:
Excerpt from GA Power cable racking diagram showing Peachtree racking
Network Underground design engineers have standardized on a secondary collector bus with 2000 MCM copper, at 600V that is fully insulated with EPR and a full jacket (See Figure 5 and Figure 6). In some cases engineers may use double buses, such as two A, two B, two C depending on the load and customer needs. Vault construction must accommodate this. Services are connected to the bus through a down drop which is connected to the bus with disconnectable tee lugs.

Figure 5:
Insulated collector bus

Figure 6:
Collector bus material cross section
Technology
Georgia Power has been using SCADA control and monitoring for approximately 15 years in its vaults and substations. Although they do not monitor vault temperature, they can control and monitor network protector status in near real-time. Network vault designs include a specification for where and how to place SCADA line(s), with fiber optic cable into the Operations Center network as the preferred method. Vaults do not include fire alarm systems.
Network civil and electrical engineers often use the online Georgia Power network standards book to design vaults and provide customers with reference designs, including detailed model blueprints that specify the location of duct lines, bay forms, racks, etc.
The Network Underground group has begun a small pilot project employing the Eaton Vault Guard system for monitoring and controlling network protectors, but at the date of this immersion report has not recommended them as a standard for the network.
7.4.23.11 - HECO - The Hawaiian Electric Company
Design
Vault-Manhole Design
People
Civil and Structural Design is performed by the Civil / Structural Division within the Engineering department. The Civil / Structural Division is comprised of a principal engineer, 2 lead engineers, 6 engineers, 2 drafting technicians, 2 project clerks, and 5 surveyors.
The Civil / Structural Division assists the Technical Services Division with the development of standards for underground enclosures.
Process
HECO’s definitions of a “Vault” and of a “Manhole” conform to the NESC definitions.
From the NESC, a Vault is a structurally solid enclosure, including all sides, top, and bottom, above or below ground where entry is limited to personnel qualified to install, maintain, operate, or inspect the equipment or cable enclosed. The enclosure may have openings for ventilation, personnel access, cable entrance, and other openings required
for operation of equipment in the vault. In general, a “Vault” at HECO is an enclosure that contains a transformer, and is ventilated and kept dry. Vaults can be located in the street or in buildings. Customer Vaults inside buildings may contain customer switchgear.
From the NESC, a Manhole is a subsurface enclosure that personnel may enter used for the purpose of installing, operating, and maintaining submersible equipment and cable.
Some HECO network vaults are designed with water level alarms that are tied to the HECO SCADA, In general, however, HECO has very little SCADA in their network facilities.
Technology
Most HECO vaults are pre-cast. They do use poured in place enclosures at selected locations.
7.4.23.12 - National Grid
Design
Vault-Manhole Design
People
Network design at National Grid, including vault design, is performed by the network designer. This designer, a Designer C, performs all larger and more complicated network designs, including vault designs for both grid and spot network vaults. This individual has a two-year degree, a requirement for the position. This designer also performs non – network UG designs. This designer works very closely with the field engineer, part of Distribution Planning, assigned to the underground department to support the Albany network. This individual also works closely with account executives who interface with major customers in planning and designing spot network vaults.
Organizationally, the Designer C is part of the Distribution Design organization, led by a manager, and part of the Engineering organization at National Grid. This organization is structured centrally, with resources assigned to and in some cases physically located at the regional locations. The two designers who support the Albany network are both physically located at the NYE building, in Albany.
The designer is represented by a collective bargaining agreement.
National Grid has up to date standards and material specifications for network equipment, including the network vault. Network standards are the responsibility of the Distribution Standards department, part of Distribution Engineering Services. Distribution Engineering Services is part of the Engineering organization, which is part of the Asset Management organization at National Grid. Within the Standards group, National Grid has two engineers that focus on underground standards.
Process
National Grid has 251 vaults that house transformers and network protectors.
A typical network vault is located beneath the sidewalk. For a spot network, the vault is provided by and owned by the building owner and typically located beneath the sidewalk in front of the building. Customer owned vaults may be placed in private right of way or within the City of Albany’s right of way – in these cases the customer is responsible for obtaining rights of way. For National Grid owned vaults, National Grid typically obtains an easement to place their vaults within the City’s right of way.
National Grid’s vaults and manholes are pre-cast, with two standard sizes (present standard): 8 x 20 x 11 for transformers up to 1000 kVA and 10 x 22 x 12 for larger units.
Spot network vaults are designed with removable concrete panels and with ventilated openings (gratings) on either end for cooling. Vaults have two entrances, one on either side of the vault. Openings are lockable with piston assisted lifting. Entrances may be designed with vented covers, or solid covers.
For spot network vaults, National Grid provides the customer with specifications for the vault including the size, layout, placement of pulling eyes, ventilation requirements, sump pump requirement, lighting, grounding, auxiliary power, etc. The typical spot vault installation includes secondary cable trays leading to conduits that feed from the vault to an adjacent vault or equipment room owned by the customer. National Grid secondaries will terminate on customer equipment.
National Grid ties all of its vault equipment to ground, including the switch handle on the transformer primary ground switch. National Grid standards call for the vault ground to be kept separate from the building ground. For customer services, National Grid runs full sized insulated neutrals into the customer building connecting to the neutral bus. It is the customer’s responsibility to ground the neutral bus on their end.
National Grid utilizes sump pumps in many of its network transformer vaults. Most are in automatic operation. All sump pumps have an oil sensing unit which will shut off the pump in the event of oil in the vault. In addition, filter baskets are installed around the sump pumps to trap oil and debris before getting to the sump pumps.
National Grid’s standard design for a network unit calls for it to be placed on hot dipped galvanized I-beams within the vault. National Grid uses anodes to provide corrosion protection.
Spot network vaults are equipped with a ground fault protection system designed to trip (open) all of the network protectors in the vault in the event of a ground fault. The customer is required to buy, install, and wire the National Grid approved ground fault protection system. Ground fault protection system equipment is installed in the customer’s electric room. A current transformer required to monitor neutral currents is installed in National Grid’s transformer vault.
National Grid seals all duct entrances with fire sealant. National Grid uses fire proof tape on cables.
Technology

Figure 1:
Anode, transformer base

Figure 2:
Primary switch handle, grounded

Figure 2:
CT for ground fault protection system

Figure 3:
Wiring from NP to the customer’s equipment room for the ground fault protection system


Figure 4 and 5:
Spot network secondary cables – feeding from protector to customers equipment room
7.4.23.13 - PG&E
Design
Vault-Manhole Design
People
Network standards, including the standard design configuration of a network vault, are the responsibility of the Manager – Distribution Networks. PG&E has assigned one individual as the asset manager for network equipment, including all components of the network unit. This asset manager is responsible for network
The Civil Engineering group, within the Substation Engineering Department, performs civil designs such as vaults.
Most civil construction work at PG&E is performed by civil construction resources from the PG&E Gas Division or by external contractors. PG&E network resources will perform minor civil repairs.
equipment design standards, developing life cycle strategies for network equipment, and making capital and maintenance investment decisions for network equipment.
The development of the standards for the vault enclosure itself (civil design aspects) is the responsibility of the Civil Engineering group, part of the Substation Engineering Department at PG&E. Vault designs are also developed by this group using internal PG&E resources. Note that civil construction work is performed by resources from PG&E’s gas department.
PG&E has developed and maintains up-to-date standards that describe the network vault design (for both poured in place and pre-cast designs). Note that in the downtown network area, most vaults are poured in place. Precast vaults are most common on the rest of the PG&E system.
Process
PG&E uses both pre-cast and “poured-in-place” manholes. In their congested downtown area, most are poured in place. The rest of the system uses primarily pre-cast units. PG&E has detailed standards that describe their underground electric vault requirements.
PG&E has 771 vaults that house transformers and network protectors.
A typical vault for a spot network is provided by the building owner [1] . This type of fault is often an underground vault located beneath the sidewalk in front of the building, and placed so as to be on private property. The “lift out” hatches are solid, not vented. In Oakland, PG&E uses removable sections in vaults housing smaller sized transformers.

Figure 1:
Vault roof, solid “lift out” hatch
Vaults are designed with two manhole entrances, one on either side of the fault. One entrance uses a solid cover while the other uses a vented cover. The vented cover is used on the end of the vault where the ventilation fan is located. Note that PG&E is installing solid covers that have the ability to vent combustible gases (Swivel Loc) in place of the vented covers in areas of high foot traffic. (See Manhole Cover Replacement Program.) Solid covers prevent additional water and debris going into the hole and clogging the sump pump. These covers also prevent people from throwing debris into the hole that could create a biohazard. Finally, solid covers raise the ambient temperature in the vault, reducing water accumulation. (PG&E network transformers are under loaded, and thus run cool and do not contribute to water evaporation.)

Figure 2:
Vault ventilation fan

Figure 3:
Sump pump and ventilation fan
For spot network vaults, PG&E provides the customer with specifications for the vault including the size, layout, placement of pulling eyes, ventilation requirements, sump pump requirement, lighting, grounding, auxiliary power, etc. The customer will also supply either a collector bus, or bus stubs for terminating secondary cables. The typical vault installation includes secondary cable trays terminating on customer supplied bus stubs. However, for 120/208V spot network locations, a secondary collector bus is sometimes required because of the number of cables.

Figure 4:
Secondary cable trays

Figure 5:
Secondary cables – customer bus stubs
PG&E’s standard calls for the vault ground to be separate from the building ground.
For fire protection and isolation, PG&E’s vault layout calls for no more than two transformers in any one enclosure without separation by firewall. Most PG&E spot network locations utilize three transformers. Consequently most vault designs include a firewall, with two units in one enclosure and the remaining unit in the other. PG&E monitors and alarms the vault temperature. They do not use smoke detection.
PG&E’s vault ventilation requirements call for a ventilation fan to be installed in each vault. These fans are thermostatically controlled.
PG&E requires a sump pump to be installed in each vault. Most pumps drain into the storm sewer. Note that PG&E is not requiring that its sump pumps be equipped with an automatic shutoff system in the presence of oil. However, the sump pumps are equipped with a sleeve that enables the crews to easily detect a sheen indicating the presence of oil in the water.
PG&E vaults are equipped with remote monitoring, and PG&E is in the process of upgrading the level of monitoring. The existing system uses “snap” switches to monitor things such as vault temperature. For example, when a given temperature is reached, the switch “snaps” closed, sending a temperature alarm. The new monitoring system (“Vault Gard” by Eaton ) will monitor and deliver actual temperature readings in addition to alarms.

Figure 6:
Remote monitoring (Note CT’s on NP secondary)
Some of the items that planned to be monitored by the upgraded system include:
-
Two water level indicators. One at one foot and one at three feet in each vault
-
Temperature reading at the roof line
-
AC voltage
-
DC battery voltage
-
NP status
-
Oil level
-
Voltage
-
Current
-
Wave forms
-
Open and close - control of protector
-
Oil temp and pressure on all oil chambers
-
NP tank pressure
Technology

Figure 7:
Temperature probe
[1]Per Electric Rule 16 of the PG&E Tariff.
7.4.23.14 - Portland General Electric
Design
Vault-Manhole Design
People
A number of departments are involved in manhole and vault designs for the network, both for PGE owned facilities and in overseeing customer-owned facilities built to PGE specifications. The network includes many customer vaults, making it important to liaise with customers/contractors during the design process and ensure that all vaults fulfill regulations and PGE specifications.
PGE may use external contractors to fulfill the civil designs for vaults and manholes.
Distribution/Network Engineers: Three Distribution Engineers cover the underground network and work with customers to design customer-owned facilities to PGE specifications. The Distribution Engineers are not based in the Portland Service Center (PSC) or CORE group. The Eastern District Central Supervisor, who reports to the Manager of Distribution and T&D Standards, oversees them. The underground Distribution Engineers are qualified electrical engineers. When needed, PGE hires civil engineers to perform certain planning tasks.
Network engineering develops and maintains the standards for the network, including vault standards, which are forwarded to the Standards Department for inclusion in company standards. Distribution Engineers assume responsibility as they have experience with network equipment.
Standards Department: The Manager of Distribution Engineering and T&D Standards oversees the Standards Department. The group recently underwent reorganization. It now employs one technical writer and four standards engineers.
Service & Design at PSC: Service & Design’s role is to work with new customers or existing customers with new projects, making it responsible for new connections, new buildings, and remodeling. The supervisor for Service & Design’s wider responsibility includes the downtown network. The supervisor reports to the Service & Design Manager, who is a peer of the Distribution Engineering and T&D Standards manager. Both of these positions report to the General Manager of Engineering & Design and directly to the vice president.
The Supervisor of Service & Design at PSC and its group undertakes capital work if initiated by the customer. The “Mapper/Designer” reports to the Supervisor of Service & Design at PSC and provides the computer-aided design (CAD), geographic information system (GIS), and design service.A Field Inspectormeets with contractors. Two inspectors work for the Service & Design organization, and one specializes in the network.
Service & Design Project Managers (SDPM): Because external projects drive much of the planning on PGE systems, the utility employs SDPMs. SDPMs have a defined role and work almost exclusively on externally-driven projects, such as customer service requests. They also liaise with new customers when designing services. At present, two SDPMs cover the network. SDPMs oversee projects from first contact with the customer to the final completion. They coordinate and manage construction designs and customer connections to ensure full compliance.
Ideally, a SDPM has an associate degree or a combination of electrical engineering experience and appropriate education. SDPMs should have proven project management skills and understand PGE and industry standards and practices. They should also have knowledge of the National Electrical Safety Code (NESC) and National Electrical Code (NEC), as well as the ability to use or learn the relevant information technology (IT) systems. PGE prefers to have a selection of SDPMs with a diverse range of experience and backgrounds, so the position does not necessarily require a four-year engineering degree. The managers can be degreed engineers, electricians, service coordinators, and/or designers [1].
PGE assigns SDPMs work on both CORE and non-CORE projects to assure that expertise is distributed and maintained across departmental and regional boundaries [1].The Project Managers are separate from Distribution Engineering and T&D Standards.
Key Customer Manager (KCM): PGE has nine KCMs reporting to Manager of the Business Group. Generally, they are geographically distributed, with three on the west side, one downtown, one in Salem, three on the east side, and one acting as a rover. KCMs liaise with large customers and communicate their needs. For large customers, the Major Accounts Department may also liaise with customers about the project.
Contract Services and Inspection (CS&I): At PGE, the CS&I department supervises contract management. Five Construction Managers work in the CS&I group, inspecting any work on PGE-owned infrastructure. Field Construction Coordinators (FCC) inspect facilities built by customers. When constructing facilities and vaults to house PGE equipment, customers can choose from two third-party vault contractors with certifications from PGE. For larger projects, PGE may outsource inspections to external experts, such as POWER Engineers, Inc.
Process
Manholes: PGE uses solid manhole covers in the network. The manhole covers are 32 in. (81 cm) in diameter and have venting holes. Note that city regulations restrict the use of manhole covers in sidewalks. At the time of the immersion, PGE was testing manhole lid retention systems for use in its network.

Figure 1:
PGE solid manhole cover

Figure 2:
Network vault entrance on sidewalk
PGE is investigating the use of extensions on underground ladders to make it easier to get in and out of a vault/manhole. This could take the form of a temporary extension that can slip on to the existing ladder to extend it when PGE is working on a vault/manhole. A challenge they face is that existing mounted ladders are of different styles, with some ladders over 40 years old. They are considering standardizing the ladder’s design and designing an extension that would fit onto this ladder.

Figure 3:
PGE manhole with permanently mounted ladder
Vault Construction Standards: PGE’s Network Engineers are working with the Standards Department to formalize vault construction standards for network vaults. At present, PGE performs some of the designs on a case by case basis, with the designer, inspector, and customer discussing what is required and establishing the ultimate design. PGE noted that on the radial system, more Class A vaults are being constructed, so they are focusing on developing a more robust standards for these Class A vaults before formalizing standards for new network vaults.
See Attachment for Class A vault construction standard

Figure 4:
Grounding details for Class A vaults
Developing Work Packages
PGE uses ArcFM as its current design product to create a materials list. The company hands over a “package” to the customer, inspector, and contractor. For each new vault, a package of the relevant information needed for vault construction includes:
- Vault detail and butterfly drawing
- A conduit plan/map
- An electrical drawing
- Standard construction specification
- Notes (i.e., anything special for the construction) Most of the materials used for network construction already have man-hours details attached, so when an operator selects an asset, the system calculates the man hours/labor needed for installation. The information is available in Maximo and allows the operator to compare the estimated and actual labor costs.
Any projects over $75,000 enter a funding project approval process and require approval after entry in the Maximo asset management software, which is linked to ArcFM. In ArcFM, designers create the design, add the materials/assets needed, and perform the mapping. Once approved, they send it to Maximo and it can be viewed in a tabular format. One problem unique to the network is developing standardized compatible units (CUs) or macro units (MUs) for assets, because each work situation can vary. Accordingly, the design department adds additional labor units to develop an estimate for network jobs that reflect situational requirements.
Particularly for spot networks, some of the materials must be ordered well in advance because they have very long lead times for delivery. The Distribution Engineers have good coordination with their storerooms/material management to order and procure equipment and components.
The SDPM also assists in ensuring that job sites have temporary power during the construction period, which is usually fitted to a radial feed.
PGE Maps/Drawings [2]
Vault Detail (also called Butterfly Map): PGE produces a detailed drawing of the vault, incorporating the detail associated with each of the vault walls, including duct arrangements (see below). Note that these detailed drawings do not show cable joints or cable mole locations.

Figure 5:
Vault construction drawing – 'Butterfly Map'
Conduit Plan: For a vault, the conduit plan may warrant its own sheet and plan if it is particularly complex. The city requires permits for major construction projects, so for any construction on the network, a separate conduit plan is created and serves as a permit map.
Crew Electrical Map: Designers produce another sheet for the crews containing an electrical map, which has proven useful for the crews.
While the design indicates details such as duct position availability, ultimately the crew selects which conduit to choose for a new feeder implementation. These and other as-built changes are noted so that they can be recorded in the permanent records (e.g., a GIS).
Mapping is performed in ArcFM GIS. When a field job is completed, it comes back to Service & Design to develop the “as-built” map. Once everything has been setup in the design draft version on the GIS, the final post is entered on the GIS. The electrical drawings and conduit plans are held on the GIS, while vault details are standalone. The GIS map shows the locations of secondary moles within the system.
Following the “as-built” finalization, the GIS Department sees the work order in Maximo and the design draft in ArcFM. The department performs some quality assurance/quality control (QA/QC) to ensure electrical connectivity in the plan/design and that the required attributes, such as operating voltage, are in the system. (The department also runs a reconciliation process to determine that nothing was missed due to other builds in the area.) This process ensures that the GIS contains the latest design.
PGE is starting to take pictures/images of vaults that can be included as part of the package.
PGE creates the design package and vault details for new construction. However, once the crew has visited an existing vault or location and finds discrepancies between the recorded and actual vault details, a corrected drawing is sent to mapping and design.
Vault Specifications: Most new PGE vaults are precast, and the majority of vaults on the network are larger than those used in a radial system, at 10 x 24 ft (3 x 7.6 m). All vaults need to meet the “Class A Vault” standard. Customer vaults are built to PGE specifications and integral to the building structure, though they are not usually precast. Spot network vaults are customer-owned and can be above or below grade. Very few vaults are above grade, although all must be accessible from the street. Vaults in buildings typically have two entrances, one from the street and the other through the building. If the building does not have a basement, then there are two entrances from the street to the vault.
All vault equipment is submersible, though the network has a few older installations with spot networks on the roof.
According to Class A vault design specifications:
- Vaults with a minimum fire resistance of three hours should house all PGE transformers unless a smoke detection system is installed
- PGE should control vault access and crews should have access 24 hours per day
- Hatch doors in the sidewalk should have 30 ft (9.1 m) of vertical clearance to allow for equipment removal and installation
- Vault walls and ceilings should be painted with at least two coats of non-toxic, waterproof masonry paint
- Vaults should only contain equipment related to electrical service
- The customer should include emergency lighting and 120 V electrical sockets inside the vault according to PGE/NEC specifications [3].
The city prohibits manholes in the sidewalks and prefers lift-outs and non-skid vault doors. The vault doors have hinges and shock absorbers.
The customer is not required to cool the vaults with air conditioning but is required to provide ventilation ducts. Some vaults include sprinkler systems in the vault depending on the building’s fire marshal. Temperature probes can tie in with this protection.

Figure 6:
Vault Ventilation"
PGE uses sump pumps in all equipment vaults and an oil minder on the pumps to detect oil in the water.

Figure 7:
Oil minder control unit

Figure 8:
Vault sump pump
Vault Grounding: The butterfly maps show vault grounding requirements, which are used for discussions with customers and communicating vault design requirements. (Note that the distribution engineering department is working with designers to update these maps to include the specifications for cable racking.) When grounding a customer vault, the customer should provide an equipment grounding electrode, which consists of a 5/8 in. (1.6 cm) diameter rebar of at least 20 ft (6.1 m) in length, cast into the wall, and no less than 24 in. (61 cm) from the top or bottom of the vault. Concrete must completely encase the concrete, and pre-manufactured brass ground tap inserts with a steel rod connect to the grounding rebar at three points [4].
Vault Electrical Equipment: Network primary feeds connect to the transformer via a 200A straight Energy Services Network Association (ESNA) style connection. Straight connectors are used because PGE has historically brought the primary in from the ceiling. Straight connectors can also minimize the cable bend. PGE uses EPR cables to connect to the transformers. Where PGE may have installed PILC cable, it will transition to EPR to make the transformer connection.

Figure 9:
Transformer primary connections

Figure 10:
Primary cable joints in vault
For secondary connections, PGE uses Burndy Mole Connectors, which are engineered connectors that provide for multiple connections at a single junction point.
In approximately 16 locations, especially where the facilities are older and the vault is not big enough to fit a three-phase transformer, designers banked single-phase transformers together with a separate primary switch and wall-mounted network protector to comprise the network unit.
Ladder Extension: PGE wants to extend underground ladders above ground level to make it easier to get in and out of a vault/manhole. This could take the form of a temporary extension that can slip onto the existing ladder to extend it when PGE works on a vault/manhole. A challenge in finalizing a ladder standard is that the current ladders are of different designs and vintages. One possible solution is to first standardize all the ladders and then specify a device that would fit onto these new ladders.
Customer-Owned Vaults: Customers who accept PGE service need to install a vault where it is not possible to install a pad-mounted or pole-top transformer, and in locations to be served from network infrastructure. A structural engineer must submit final construction plans to the PGE Project Manager for final approval.
People involved include the following:
- A contractor representing the customer
- A PGE inspector who ensures compliance with PGE standards and specifications
- A SDPM or distribution engineer
All conduits and vaults conform to the NEC, PGE’s Design and Construction Standards, City of Portland’s Bureau of Transportation (PBOT) regulations, and/or Oregon Department of Transportation (ODOT) regulations depending on jurisdiction for public highways and right of way.
Permission for access on private and public lands and roads is the responsibility of the contractor. The contractor complies with all street opening permits issued by PBOT and keeps a copy onsite. The contractor is responsible for the final execution of the work, and PGE has the final decision on whether materials, workmanship, equipment, and interpretation of the specifications are acceptable.
If any changes to plans are needed, the contractor should seek approval before the changes. After work completion, the contractor provides as-built drawings with conduit depths, conduit configuration (if altered), length of conduit installed or modified, the location and depth of other utility infrastructure crossing the conduit route, and the depth of the vaults installed.
Because most vaults are customized and unique, PGE designs the vault and conduit arrangement, or may suggest a prefabricated vault that will suit utility and customer needs. A 6 in. (1.8 cm) bed of compacted sand or gravel should smooth the base, and the excavation should leave a 6 in. (1.8 cm) gap around the walls of the vault for backfilling.
All vaults, covers, and doors should be flush and in alignment with curb and property line. Manhole covers should be set on riser rings to match the grade, and these rings will be grouted using approved vinyl, non-shrinking, waterproof grout with elastomeric coating. Vault doors set in the sidewalk should be slip-resistant, and adjustable lids should ensure that vault access doors meet the finished sidewalk grade. Any door access frame drains should be routed to the curb, and access doors in pedestrian areas should be SlipNOT® steel plate and made from Grade 3, hot-dipped galvanized metal. All door designs must meet the Americans with Disabilities Act (ADA) requirements for level surfaces and should conform to the American Association of State Highway and Transportation Officials’ (AASHTO) HS20 loading criteria.

Figure 11:
Vault access doors
All transformer vaults require venting to remove excess heat created by submersible equipment. PGE will provide the venting requirements, and the vent piping should be installed and offset to maximize air flow. PGE supplies vent materials at the contractor’s expense. The installation requires core drilling and non-shrinking grout or concrete for larger vents over 10 in. (3 cm).Transformer vaults require a sump pump that should not connect to sewers in order to prevent leaking transformer oil from spreading. All seams and penetration points should be treated with a PGE-approved sealant to reduce water ingress.
Concrete used for vaults should conform to the American Society for Testing Materials (ASTM) C-150, Type II specifications. PBOT regulations specify a 28-day minimum compressive strength of 3000 psi (20,684 kPa).
A sprinkler system will be installed if recommended by the fire marshal and is intended to extinguish fires, not protect electrical equipment. It must not spill water if the sprinkler head is accidentally opened, and the system should have a control switch near the entrance for operation by PGE crews. Sprinkler heads should not be installed over the customer bus or transformer.
Post-Construction Auditing: PGE inspects and approves all customer equipment before electrical equipment is installed and service connected. The inspector is typically provided with the following:
- A plan and elevation and section views of the vault showing all conduit penetrations, vent openings, access doors, and required hardware.
- Ventilation design drawings
- A collector bus cut sheet (if applicable)
- A drawing showing the path of Ufer (concrete-encased electrode) ground connections
- The PGE inspector will check the following:
- Locations of pulling eyes
- Locations of grounding inserts and the continuous #5 rebar loop
- Metal equipment bonding
- Continuous 250 MCM Ufer ground connection
- Locations of ceiling anchors
- Conduit penetrations (both primary and secondary)
A PGE representative will also inspect the following before installing PGE equipment:
- 36 x 78 in. (11 x 24 cm) main door with crash bar and PGE lock
- three-way light switches at vault entry points
- Access ladder
- Lighting
- Sump and grate
- Receptacles
- Fire suppression system shutoff valve (if applicable)
- Interior paint
- Removable sill across man door [5,6]
Technology
PGE uses ArcFM GIS software for designing network layouts and creating a package with details for relevant personnel. ArcFM builds upon ESRI’s ArcGIS and allows designers to produce an electrical map for construction crews. The system holds electrical drawings and conduit plans, although it does not store vault construction details.
The ArcFM is used with Maximo for Utilities 7.5, which creates work orders that linked to the circuit designs held in ArcFM.
- Northwest Public Power Association. “Service & Design Project Manager Level II/III.” NPPA.com. https://www.nwppa.org/job/service-design-project-manager-level-iiiii/ (accessed November 28, 2017).
- Portland General Electric, VT3802 - Butterfly – 712, internal document.
- Portland General Electric, Customer Owned Class A Vaults, internal document.
- Portland General Electric, Class A Vault Grounding Details Draft, internal document.
- Portland General Electric, Customer Owned Class A Vaults Draft, internal document.
- Portland General Electric, LD51030m Portland Core & Waterfront Districts Underground Core Standards, internal document.
7.4.23.15 - SCL - Seattle City Light
Design
Vault-Manhole Design
People
The design of the network vaults and manholes is performed by the Network Design Department, which is part of Energy Delivery Engineering. The Network Design Department performs all planning and design of SCL’s networks.
The Network Design Department is made up of eight “System” engineers, who do all of the design for the network, and eight “Services” engineers, who interface with the customers, gather load information, coordinate construction activity, etc. The individuals in this group are four-year degreed engineers. Some have their PE licenses.
The engineers at SCL are represented by a collective bargaining agreement (IBEW, Local 17).
Process
SCL installs multiple network transformers with network protectors in the same vault to supply a spot network load. Depending on the size of the load, SCL may install two separate vault locations in the building. See Attachment C for an SCL schematic and photograph of a typical spot network vault installation.
SCL’s grounding practice in building vaults is to tie the system ground in with the building steel / grounding system.
SCL runs a separate low-voltage secondary neutral (in addition to the tape shield) through each vault tied in with the substation ground. This neutral is necessary for two reasons: to maintain ground connectivity to maintain the same potential from one vault to another, and to carry the neutral currents experienced with system imbalances.
Technology
Fire Protection
SCL uses both fire protection heat sensors and temperature sensors in vault design.
The fire protection heat sensors are designed to open all the network protectors in the vault when the heat sensor registers 225 ˚ F. SCL has installed fire protection heat sensors in 95% of its building vaults. These sensors are not utilized in “street” vaults.
The temperature sensors, part of the DigitalGrid (Hazeltine) system, send an alarm to the dispatcher at 40 ˚ C – well before the network protector trip threshold is reached. SCL currently has completed installation of these sensors in about 20% of their vaults. They plan to install these sensors in all of their network vaults (both in building vaults and in “street” vaults).
Cable Cooling System
SCL has designed and installed a novel chilled-water heat-removal system to increase the ampacity of cables at a certain location that was identified as a thermal bottleneck due to the number of adjacent network primary feeders, depth of burial, and other factors.
They have been successful in increasing the ampacity of these cables by 40% through the installation of this water-cooling system. See Attachment D for a detailed description of the project
7.4.23.16 - References
EPRI Underground Distribution Systems Reference Book (Bronze Book)
7.4.23.17 - Survey Results
Survey Results
Design
Vault Manhole Design
Survey Questions taken from 2018 survey results - Manhole Event Preparedness and Response
Question 6 : Do you require a firewall between two pieces of equipment in one vault?


Question 9 : Please indicate where you use vented vault and manhole covers to prevent accumulation of gases. (Not including vented gratings for transformer cooling)


Question 10 : If you apply vented covers selectively, what criteria do you use to select locations?


Question 11 : Are you using manhole cover restraints in parts of your system?


Question 12 : If yes, what criteria do you use to select locations at which to apply a cover restraint?


Question 13 : Are you using arc proof tape in your network designs?


Question 14 : Do you use high flash point (less flammable) fluids in the fluid filled tanks of network equipment?


Survey Questions taken from 2015 survey results - Design
Question 51 : Do you require a firewall between two pieces of equipment in one vault? (example, between two network transformers) (check all that apply)


Question 57 : Have you incorporated skid free vault and manhole covers into your civil designs?


Question 58 : If so, are you retrofitting older existing covers with skid free ones?


Question 62 : Are you using manhole cover restraints in parts of your system?


Question 78 : Do you have a sump pump and discharge system inside your street vaults?

Survey Questions taken from 2012 survey results - Design
Question 4.3 : Does your network utilize vaults located

Question 4.4 : What type of design are you using for new civil structures such as manholes and vaults?

Question 4.6 : If your network utilizes subsurface vaults, do you use automatic sump pumps to clear water accumulation?

Question 4.7 : If Yes, does your standard design call for oil sensors on sump pumps in vaults that house oil containing equipment?

Question 4.8 : If yes, do these sensors function to prevent the pumping of oil into the street?

Question 4.9 : Do you require a firewall between two pieces of equipment in one vault? (example, between two network transformers)

Question 4.10 : In designing your network vault, what ground resistance do you require from the ground system inside the vault?

Question 4.15 : Have you incorporated skid free vault and manhole covers into your civil designs?

Question 4.16 : If so, are you retrofitting older existing covers?

Question 4.17 : Are you using manhole cover restraints in parts of your system?

Survey Questions taken from 2009 survey results - Design
Question 4.4 : Does your network utilize vaults located

Question 4.5 : What type of design are you using for new civil structures such as manholes and vaults?

Question 4.6 : If your network utilizes subsurface vaults, do you use automatic sump pumps to clear water accumulation?

Question 4.7 : If Yes, does your standard design call for oil sensors on sump pumps in vaults that house oil containing equipment?

Question 4.8 : If yes, do these sensors function to prevent the pumping of oil into the street?

Question 4.9 : Do you require a firewall between two pieces of equipment in one vault? (example, between two network transformers)

7.4.24 - Vault Design – Remote Trip Panel
7.4.24.1 - CenterPoint Energy
Design
Vault Design-Remote Trip Panel
People
CenterPoint designs each vault with a remote trip panel that enables an operator to operate breakers located in the vault remotely, from outside the vault. CenterPoint has a fabrication group that builds the panel boxes for the remote tripping units.
Process
Remote trip panel boxes are located outside of the vault, typically just outside the vault access doors[1]. They enable an operator to operate breakers within the vault, such as primary disconnects feeding the vault transformer, remotely from outside the vault.

Figure 1:
Picture of a remote panel box located outside the Vault (Door entrance)
CenterPoint also locates remote trip panels just below the outside opening in a surface access. These remote panels are tethered so that a worker who is entering a vault from the street level can pull the remote control box outside the hole to operate the breaker.

Figure 2:
Picture of remote control box mounted below vault entrance at street level Note the tether enabling the operator to pull the box up out of the hole
Technology

Figure 3:
Picture of the inside of a control box
[1] Note that all transformer vaults have minimum two entrances.
7.5 - Maintenance
7.5.1 - Cable Testing - Diagnostics
7.5.1.1 - AEP - Ohio
Maintenance
Cable Testing - Diagnostics
People
The performance of cable testing and diagnostics at AEP Ohio is the responsibility of the field crews on site, who are Network Mechanics. Testing and diagnostics are performed by Network Mechanics and Network Crew Supervisors on-site. In the case of its extensive secondary cable replacement program (see Cable Replacement), AEP Ohio and its contractors have performed extensive inspection and assessment of secondary cables in the AEP Ohio network.
Process
AEP Ohio does not perform routine diagnostic testing of network cables. AEP Ohio performs a 45-minute AC VLF and tan delta withstand test (not a proof test) on network cables before restoring a repaired cable. The company does not perform this test on healthy cables that are taken out of service so as not to damage or accelerate breakdown of the cable. AEP Ohio is also working with NEETRAC to better understand and apply cable diagnostic techniques.
If a Network Mechanic or Network Crew Supervisor discovers a splice failure, a splice analysis is conducted at the site. Further analysis can be performed by the Network Engineers. The engineers may send failed joints to an outside source, such as the manufacturer or external laboratory.
Technology
All trucks assigned to Network Mechanics have on-board computers, and network crews can log into the AEP underground network (UGN) intranet for guidance, process and procedures, including links to diagnostic guides.
7.5.1.2 - Ameren Missouri
Maintenance
Cable Testing - Diagnostics
People
Ameren Missouri has not historically performed routine diagnostic testing of network cables other than fault location testing and, on rare instances, proof testing after cable repair where the situation suggests that there may be remaining trouble with the outaged feeder.
Distribution Service Testers perform cable testing for fault location using a DC Hi pot test.
At the time of the practices immersion, Ameren Missouri’s Underground Revitalization Department was developing a criterion for replacement of cables in the urban underground system. This criterion will provide for the testing, replacement, maintenance and improved utilization of cable systems within downtown St. Louis, and will include plans for non-jacketed and jacketed PILC cable, cloth covered secondary cable, and 15 kV solid dielectric cables. The strategy will also include guidelines for 15 kV bolted separable splices.
Ameren Missouri has joined the Cable Diagnostic Focused Initiative (CDFI)[1] , and has recently performed some cable diagnostic tests working with the CDFI to evaluate test methods.
Technology
Note that Ameren Missouri uses a reduced-diameter cable, which is subject to stringent specifications, and is thus produced through a high quality manufacturing process to meet those specifications. Ameren Missouri believes that they are receiving a higher quality cable and noted that they have never had a true cable failure due to a manufacturer flaw in the cable itself.
[1]CDFI is an initiative led by NEETRAC and supported by the US Department of Energy and utilities such as Ameren Missouri to understand how to effectively use the various diagnostic technologies to establish the condition of medium voltage underground cable circuits.
7.5.1.3 - CEI - The Illuminating Company
Maintenance
Cable Testing - Diagnostics
People
Cable Testing is performed by the UG Electricians within the Underground Network Cable Services Section. Testing is performed by a crew that includes more experienced Underground Electrician Leaders.
Process
Ideally, CEI would like to perform proactive cable diagnostic tests on one fifth of their system per year – about 240 circuits / year. However, resource constraints have limited them to proactively testing about 40 circuits per year using Very Low Frequency AC Hipot Testing (VLF Testing). Tests are performed on both all lead and lead – EPR hybrid circuits. The VLF test is a withstand test, revealing defects in the cable insulation. CEI has chosen VLF as a withstand test, because it does not cause insulation damage as does DC Hipot testing. In 2008, their testing revealed one failure at a cable end disconnect (no cable failures). See Attachment - J for a sample form for recording test results.
CEI also performs diagnostic testing after a cable repair, prior to re-energizing a circuit or circuit section. This testing is either a Megger test (DC insulation test) at a minimum, or preferably, a VLF test. CEI will opt for a low voltage (5kV) megger test in cases where they have older oil switches on the circuit, fearing that higher voltage testing methods, such as VLF, could damage or further shorten the life of these older devices.
Cable diagnostic testing is also used in fault location, including DC Hi Pot Testing and cable “thumping”.
The corporate Distribution Planning and Protection group, together with corporate Asset Management and Design Standards, is leading a “Predictive Cable Failure Initiative” aimed at developing and implementing a more formal cable diagnostics plan at FirstEnergy. The group has analyzed cable performance and has identified eight key factors that can be used to assess cable failure risk. They have researched various cable diagnostic alternatives, such as VLF testing, DC Hi pot testing, and VLF Tan Delta testing, and have documented the costs and benefits of various testing alternatives. They have laid out what a full cable testing program would look like, including an estimate of costs and system impacts. The group is in the process of developing a final recommendation.
Technology
CEI has specialized trucks that are equipped with cable diagnostic equipment, including DC hi pot testers, and VLF testers.

Figure 1:
Fault Location Truck

Figure 2:
Fault Location Truck (Inside View)

Figure 3:
DC Tester – 110V

Figure 4:
VLF Tester
7.5.1.4 - CenterPoint Energy
Maintenance
Cable Testing - Diagnostics
People
Cable diagnostic testing is performed by the Relay group within Major Underground. The Relay group is comprised of Network Testers, a bargaining unit position at CenterPoint. Network Testers report to a Crew Leader, a non bargaining unit position at CenterPoint. The Relay group is lead by an Operations Manager.
CenterPoint does not have dedicated cable diagnostic crews. All Network Testers are trained in performing cable diagnostics. Crews perform diagnostic testing without the involvement of a CenterPoint engineer.
Process
CenterPoint is not performing preventive diagnostic cable testing on circuits that have not experienced a fault. They are presently considering implementing some sort of proactive cable diagnostic testing, but have not yet decided on an approach. At one time, they would proactively take healthy circuits out of service and conduct VLF testing. However they found that this approach did not yield productive results.
CenterPoint uses Very Low Frequency AC hipot testing (VLF) testing to diagnose remaining cable condition after a fault. CenterPoint has been utilizing VLF testing longer than any utility in the nation.
The VLF test is a withstand test, revealing defects in the cable insulation by breaking down water and electrical trees in the insulation. When CenterPoint first began VLF testing, they were conducting a one hour test. They noticed that most failures revealed themselves in the first 15 minutes of the test, or in the final minutes of the test. They believe that the hour test was breaking down insulation in cable sections that still had significant remaining life. Consequently, they cut the duration of the VLF test to 15 minutes, and report that they have seen no increase in repeat failures of cables that tested OK with the 15 minute test over their experience of cables that tested OK with the one hour test; that is, the 15 minute test is effective for them.
CenterPoint performs VLF testing after locating a cable failure to “proof” the remaining existing cable sections before making the repairs and re-energizing the cable[1] . They will VLF XLPE and EPR cables. If, during the VLF testing, they expose a failed section of the remaining cable, they will replace or repair it. (One CenterPoint employee estimated that the VLF test reveals additional bad cable sections in the remaining cables in about 15 -20% of the tests conducted)[2] . CenterPoint has found this approach – testing remaining cable sections after a fault - to significantly reduce their experience of repeat cable failures.
After making the repairs, and installing new cable sections, CenterPoint does not test the repaired and replaced infrastructure before re-energizing.
Cable diagnostics are also used in fault location, including DC Hi Pot Testing and cable “thumping”, and in some cases, Time Domain Reflectometry (TDR) testing. (not used in networks systems). See Fault Location.
CenterPoint does not perform cable diagnostic testing on new cables being put into service, as their cable procurement quality control process includes tests of the cable. See Cable Quality Control.
Technology
CenterPoint has specialized trailers that are equipped with cable locating and diagnostic equipment, including thumper, TDR, and VLF testers. Network Testers will hook the trailer on their trucks and take it to the job site. CenterPoint is using test units by Cable Dynamics and by Centrex

Figure 1:
Cable Testing Van - External

Figure 2:
Cable Testing Van - External, generator


Figure 3 and 4:
Cable Testing Van - Internal


Figure 5 and 6:
Cable Testing Van - Internal
[1] An exception would be certain very old cable that, through experience, they know has remaining life, but whose life would likely shortened by high voltage testing methods, such as the VLF test. Note that their repeat failure rate in this type of cable is only about 5%.
[2] Note that if their VLF test results reveal three different failure locations on a cable section, CenterPoint will replace the entire feeder section. This standard is particularly applicable to the distribution in their outlying areas.
7.5.1.5 - Con Edison - Consolidated Edison
Maintenance
Cable Testing - Diagnostics
People
Cable diagnostic testing is performed by the Field Operating Department (FOD) (Also called the Field Operating Bureau). The Field Operating Department is part of Electric Distribution, and has responsibility for the emergency crews (the crews using the red emergency trucks), as well as the following accountabilities:
-
Fault locating (distribution and transmission)
-
High-tension switching (entering customer high-tension vaults and operating devices)
-
Feeder identification
-
Hi-pot testing
Cable Testing Laboratory
Con Edison has its own cable Testing Laboratory , which has been in operation since the 1970s. This laboratory has over 100,000 cable and accessory specimens. Sometimes the lab sends specimens to outside labs to obtain independent analysis and opinions.
Con Edison invests in keeping its laboratory staff current on the latest thinking in cable testing. They are active in industry groups. They invest in rotating new people into the cable department, including engineers from Con Ed’s Gold program (a mentoring program for high potential engineers and business professionals).
Process
Con Edison has historically performed regular Hi-pot testing of its network feeders (13.8 and 27 kV). Hi-pot testing is the application of a specific voltage ( High Potential) on its network cables for a specific period of time to expose/bring to fruition incipient faults in the distribution system. Con Edison has a clear procedure that documents its approach to regular Hi-pot testing.
NOTE that Con Edison is transitioning to the use of VLF AC Hi Pot withstand testing.
When Con Edison performs Hi-pot testing, the utility tests the feeders with all three phases together. Because of the length of Con Edison’s feeders (the largest feeder has more than 20 circuit miles), and the need to test all the phases together, crews use a very large test set developed by HDW, and mounted on a specially equipped truck.
Note that Hi-pot testing at Con Edison is always preceded by an Ammeter Clear Test, which is the application of low-voltage, 60-cycle, AC signal to a feeder to indicate the presence (or absence) of short circuits or grounds on the feeder conductors or on transformer secondaries.
Hi-pot testing is performed at Con Edison for two main reasons:
- A routine test to ensure that feeder insulation meets acceptable limits before the feeder is put into service. This applies to both new feeders about to be put into service, and to failed feeders that have been repaired and are about to be returned to service.
- Scheduled tests performed annually (Annual Testing Program) on selected feeders for the purpose of revealing incipient faults that need to be restored to the proper insulation level.
For the routine tests, the type and frequency of test required vary with the condition that caused the feeder outage. New feeders are tested before being put into service. In general, feeders that automatically trip are required to be tested depending on the historic reliability and criticality of the network they supply. Feeders that are manually opened may not need to be Hi-pot tested before re-energizing depending on the rationale for taking the feeder out of service. Con Edison’s written procedure fully describes the required testing type and frequency of the different cable types and scenarios.
For the scheduled feeders tested as part of the Annual Testing Program, Distribution Engineering develops a list of feeders that should be Hi-pot tested by the Customer Service Regions between October 1 and June 1 of the following year. This work is scheduled to be finished before the summer peak loading period. Con Edison tests about 50 circuits a year as part of this program.
Distribution Engineering selects the feeders to be tested as part of the annual Hi-pot program by considering three different factors: the Feeder Failure Index, OA History Factor, and Network Design Factor. Each of these factors is weighed equally in determining the feeders to be tested.
The Feeder Failure Index is derived by considering the failure rates of various components on the feeders, such a cables and joints during sustained high heating periods.
The OA History Factor is the number of total Open Autos (feeder lockouts), including dig-ins, from June 1 to August 31 of the two previous years.
The Network Design Factor is the total of two components, the Shift Factor and the Delta Factor. The Shift Factor is an indication of the importance of a feeder to the network, in terms of the load it can pick up (load shifted to it) during an emergency. The Delta Factor is a measure of how uniformly the load is distributed in the network.
Cable Failure Analysis
Con Edison’s goal is to perform a failure analysis on every cable and splice failure that occurs. The utility is able to perform an actual analysis on 80 – 90% of the problems that occur; the remainder represent problems that are destroyed or inaccessible.
In addition to testing cable that failed, the utility tries to expand testing to look at the condition of adjacent cable sections that did not fail. In the case of a splice failure, crews replace all three splices and perform diagnoses on the unfailed splices to aid in drawing conclusions about the cause of the failure.
A big challenge for Con Edison is failures that occur in transition joints (between PILC and non-PILC conductors). These transition joints are commonly referred to as “stop joints.” The failures they encounter typically occur on the paper side of the joint. The utility has implemented a replacement program to install cold shrink joints to replace them. They have had good success with the cold shrink joints.
Technology
Con Edison is presently evaluating the use of partial discharge testing as a future tool for performing cable diagnostics, and as a replacement for the potentially destructive DC Hi-pot test. In the past, Con Edison has taken periodic partial discharge measurements, but found that the readings varied greatly, causing them to think that something else was going on. The utility believes that, by monitoring partial discharge in “real time,” they can ascertain patterns and draw conclusions about cable condition. Con Edison has a spec in place with KEMA to install a partial discharge system for testing and evaluation.
The Field Operating Department is part of Electric Distribution, and has responsibility for the emergency crews (the crews using the red emergency trucks), as well as the following accountabilities:
7.5.1.6 - Duke Energy Florida
Maintenance
Cable Testing - Diagnostics
People
The Asset Managers within the PQR&I group at Duke Energy Florida determine when and how cable should be tested. Job Site Managers and Contractors perform this work for Duke Energy Florida. Contractors are involved in above-ground inspections and testing only. All underground work is performed by Duke Energy Florida craft personnel.
Cable Testing and diagnostic programs are determined by Asset Managers within the Power Quality, Reliability and Integrity (PQR&I) group. PQR&I has responsibility for all Asset Management at Duke Energy Florida. The asset managers work with the PQR&I Governance group, which supports different local operating jurisdictions.
Within PQR&I, a particular asset manager, an Engineering Technologist II, manages underground primary cable assets, including the cable testing program.
Note that this Asset Manager, responsible for cable assets, works closely with two other Asset Managers within the PQR&I group, one focusing on switchgear, and another on all other network equipment. All three act as a Network Asset Management team, with complete communication and collaboration. Even though asset responsibility has been divided up, all three members have the capability of stepping in to help in any area in case of vacations, leave, etc.
The PQR&I Governance organization works with the Asset Managers to shift funds between areas (switchgear, cable, and equipment, for example) as asset need dictates. If funds are underutilized in one area, they can be reallocated to another area in need.
Duke Energy Florida is utilizing the services of a cable diagnostic testing contractor to conduct routine cable diagnostic testing to determine the integrity of its primary cables. The contractor performs partial discharge testing, which they perform in different stages.
Duke Energy Florida is utilizing a contractor to perform their cable replacements in Clearwater and St. Petersburg. The contractor crews are overseen by two Network Specialists who have been designated to provide oversight and coordination to the contractor crew. The contractor performs all aspects of the work, including cable pulling and spicing. The contractor will obtain and hold clearances, though the work of executing the switching to obtain the clearance is performed by Duke Energy employees.
Duke Energy Florida is not performing cable diagnostic testing, other than fault locating, on the three primary feeders supplying the Clearwater network.
Process
Led by the Asset Manager responsible for primary cable systems, Duke Energy Florida conducts routine cable diagnostic testing to determine the integrity of its primary cables, utilizing the services of a cable diagnostic testing company. Cable testing is age-based – with cables selected for testing that are 25 years or older, or that are suspect based on performance. (For example, a college experienced two major outages despite having cable that was only 10-14 years old. Engineers had difficulty pinpointing the cause of the outages, and ordered integrity testing of the cable based on performance).
Duke Energy Florida tests 80 segments per month over a nine-month period per year. The diagnostic testing performed by the contractor is not feasible in all situations, depending on factors such as manhole placement, circuit configuration, circuit condition, or feeder operation. Feasibility is determined by field inspections to ensure that the pre-test conditions can be met, and that cable sections can be safely and efficiently isolated for testing. Duke Energy Florida crews will de-energize and isolate the cable so that the contractor can apply their testing equipment. The testing consists of a checklist of over 170 different aspects of cable health and industry comparisons, and the contractor will recommend cable sections for repair or replacement.
Cable replacement decisions are driven by diagnostic test results. Depending on test results, the PQR&I group will determine whether a cable has integrity and remaining life or needs replacement. If replacements need to be made, the other asset managers who deal with circuit components are consulted to identify equipment replacement needs on the identified circuits.
Duke Energy also performs routine cable replacements that are based on cable age and performance history, rather than on diagnostic testing results. This is the case in St. Petersburg, where older cables are being replaced based on age and performance history, as these cables were not appropriate candidates for diagnostic testing (because of significant branching of cable sections.) Note that the Integrity Engineer within PQR&I tracks cable outages even if customers are not affected. The PQR&I organization has decided that piece-meal repair or replacement of small sections of cable not an efficient way to rehab aging cable systems as this approach generates many small, and ultimately more expensive jobs. Rather, Asset Management seeks to replace who sections of cables systems identified for replacement by age, performance history or diagnostic test results.
As a result of the testing program and of routine cable replacements, approximately 1.5 million feet of cable has been replaced since the inception of the program. At the time of the practices immersion, Duke Energy Florida had not tested the three feeders supplying the Clearwater network.
Note that at Duke Energy Florida, the costs of the cable diagnostic testing program, including any expenses to de-energize, switch, or otherwise prepare the cable for testing, as well as the costs of any cable replacement based on testing results are capitalized based on a FERC agreement that requires that all cables that are aged and are candidates for testing are tested and / or replaced by 2019. The costs of the diagnostic testing are warrantied, such that if the testing deems a cable to be of satisfactory and then it fails, the testing company will perform an investigation to identify the cause of the cable failure.
Asset Management is in the process of incorporating cable testing prior to energization of new cables into their program. The company believes this commissioning testing to be a good quality control check that can forestall outages.
Secondary cable is not currently a part of the Duke Energy Florida cable testing program. The company has seen no need for testing secondary network cable in the St. Petersburg/Clearwater network at the time of this study.
Technology
Duke Energy Florida uses contractor cable testing that includes a checklist of over 170 cable conditions. The specific approach to diagnostics is proprietary, but utilizes offline partial discharge testing.
7.5.1.7 - Duke Energy Ohio
Maintenance
Cable Testing - Diagnostics
People
Duke Energy has a strong focus on performing cable diagnostic testing. They have been proactively performing cable diagnostic testing, including the use of VLF withstand and VLF Tan Delta testing, since 2007. Duke is a member of the Cable Diagnostic Focused Initiative (CDFI), and is working closely with NEETRAC[1] on refining their cable diagnostic approach. Duke shares their testing results with NEETRAC.
Dana UG field crews perform the cable diagnostic tests for Duke Energy, Cincinnati. The Dana UG group has identified two crew leaders who routinely perform the testing and have thus become experts. When there is a question or something unusual, these crew leaders will reach out to the Project Engineer supporting the network operation.
Crews typically test two circuits per day – they schedule the testing for days in the middle of the week so that if they have issues they can repair them during the week.
When they first started the routine diagnostic testing, there was some trepidation among the work force. People are now believing in the diagnostic testing, as they have seen cables with bad test results undergo repair, and then look good upon a re test.
Duke has seen a sharp decrease (36-40%) in the number of power cable failures since implementing their diagnostic testing program. Why they can’t be sure that this decrease is due solely to the implementation of diagnostic testing, they believe that the testing program has been a significant contributor to the decrease.
Process
Duke performs cable diagnostic testing on from 50 – 80 circuits per year. They select “high risk” circuits for testing based on age, customer count, span lengths, customer criticality, and a “push” from a customer representative.
Note that the testing is focused primarily on non network 15kV feeders. Duke has not yet implemented proactive diagnostic testing of network feeders unless there is some question about the feeder, such as frequent outages in a given period of time. The reason network feeders are not tested is because of the number of branches on these feeders, making it difficult to identify the location of the problem area identified by testing. Moreover, the circuit to be tested must be opened, cleared and tagged before performing diagnostic testing. For network feeders, this can in some cases require a full day to perform switching to clear the feeder, a day to perform the testing, and a full day to restore the feeder. Duke is considering adding 600 A sectionalizing points on network feeders to be able to break the feeders up to perform testing.
To clear a feeder for diagnostic testing, Duke will submit an outage request, indicating the time frame, type of outage requested, etc. This request would first flow through the Planning group to identify anything else that may be happening on the feeder. The request then goes to a “Processor” who will write the switching procedures. Note that most of Duke’s system is looped enabling customers to be picked up by adjacent feeders.
Finally the request will go to the Trouble Desk. Mobile Operators will do any switching in substations, while field crews will perform any switching out on the line. All switching is completed and the line cleared before the DANA crews come out to do the testing.
Duke issues a report each morning that shows circuits that are out of service for testing (and other reasons).
Duke uses a multipronged approach to cable testing, using Time Domain Reflectometry (TDR), Very Low Frequency (VLF) Tan Delta (a dielectric loss test), and VLF AC withstand testing.
Duke will perform a VLF AC Tan Delta testing to get a general idea of the health of a particular cable. They perform the test in a stepped manner, using four steps held for three minutes. This test provides a measure of total cable system loss (power in versus, versus power used).
Duke also performs AC VLF withstand testing to identify any imminent cable failures and force them to failure. Duke normally uses a 15 minute test, but may hold for 30 minutes depending on the tan delta readings, or if the readings haven’t stabilized. The crew will stop the test if they identify any abnormalities. Also, the crew may stop short of performing the withstand test, if it is critical not to push a given feeder to failure for operating reasons. Depending on their findings, Duke may involve NEETRAC in the decision making.
Duke will use TDR to help identify the location of problem(s) that may be identified through their testing. This may trigger additional inspection activity do determine the overall condition of the feeder, and may trigger the feeder for replacement.
In addition to scheduled diagnostic testing, Duke will perform a VLF Tan delta test before putting a feeder back in service that was taken out for other reasons, such as to replace equipment, or to make repairs to a damaged feeder.
All data from the testing is kept in a spreadsheet.
Duke is also performing cable diagnostic testing as part of their process for accepting new cable. They are presently performing a DC hi pot on new cables, and performing an AC Tan delta test to establish a baseline. They are in the process of moving away from DC high pot test and moving to an AC VLF high pot test.
Technology
Duke uses specialized vehicles, such as cable testing trucks to aid them in performing cable diagnostic testing. They are in the process of obtaining a specialized truck with the Tan delta equipment.
[1]NEETRAC, the National Electric Energy Testing, Research & Applications Center, is a research center in the School of Electrical and Computer Engineering at the Georgia Institute of Technology.
7.5.1.8 - Energex
Maintenance
Cable Testing - Diagnostics
Process
Energex does not perform routine cable testing or diagnostics of their 11 KV cable system. However, cable is tested in the field before commissioning. New cable is tested by the manufacturer and batch sample tested in-house at Energex before it is moved to its supply stock.
Energex has not found it necessary to perform routine cable tests as its CBD underground network has been highly reliable. The majority of cable failures are from “dig ins” at construction sites where proper caution was not taken to locate the buried electric power conduits. Energex has the view that unless there is a known problem on its 11 kV system, it is acceptable to “run to failure,” which has not been often.
Note that Energex does perform routine diagnostic testing of its 33 kV sub transmission cable system.
7.5.1.9 - ESB Networks
Maintenance
Cable Testing - Diagnostics
People
Cable diagnostics at ESB Networks are performed by Network Technicians, the journey worker position. The Network Technician is a multi-faceted position, performing both line work, such as building pole lines, and electrical work, such as making connections at a transformer. Network Technicians work on all voltages from LV through transmission voltages (110 kV). Note that ESB Networks created the Network Technician position in the 1990s by combining a former Line Worker position and Electrician position.
Work specialization for Network Technicians is by assignment. In Dublin, where the majority of the distribution infrastructure is underground, Network Technicians work mainly as cable jointers, installing underground cables and accessories. ESB Networks rotates Network Technician work assignments as business needs require.
The Training and Asset Management groups work closely with Network Technicians working as cable jointers to ensure that they understand the science of cable joints and have an appreciation for the importance to long-term joint reliability of performing the proper steps associated with cable joint preparation.
Process
ESB Networks has no formalized routine cable diagnostic testing policies for its 10-20 kV systems. Cables are tested in the field only if there is a problem, or suspected problem.
Note: The utility requested cost recovery for a program of proactive cable diagnostics from regulators, but the regulatory panel was against it due to cost. As a result, ESB Networks uses its “front line” Network Technicians in the field as its last line of cable inspection and diagnostics, with inspections of cables taking place at the job site.
7.5.1.10 - Georgia Power
Maintenance
Cable Testing - Diagnostics
People
Cable fleet management in the urban underground networks supplying metropolitan area customers in Georgia is the responsibility of the Network Engineering group within Network Underground. Organizationally, the Network Underground group is a separate entity responsible for all network infrastructures, reporting to the Network UG manager. The network engineering group is led by a manager and is comprised of four-year and two-year degreed engineers focused on electrical and civil design and feeder level planning.
Network standards, including standards for cable, are the responsibility of the Standards Group within the Network Underground group. The standards group is comprised of two principal engineers who work in the Network Underground group. One of these engineers reports to the Network UG Engineering group, and the other, directly to the Network UG Manager.
Cable Testing is performed by Network Test Engineers, part of the Network Operations and Reliability group.
Process
The Georgia Power Network Underground group has not historically performed routine diagnostic testing of network cables other than fault location testing and, on rare instances, proof testing after cable repair where the situation suggests that there may be remaining trouble with the feeder.
Network Test Engineers perform cable testing for fault location using a DC Hi pot test and through data received at its Network Operations Center, which collects near real-time data on network service through its extensive SCADA system.
If Network Test Engineers discover a splice failure, a splice analysis is conducted at the Network Test Center, typically by a senior or other principal engineer; the testers tear apart the failed joint and determine whether it was workmanship, a training issue, or what other factors caused the joint to fail. They perform the forensic analysis at the Network Underground facility. On occasion, the engineers may send failed joints to an outside source, such as National Electric Energy Testing Research and Applications Center (NEETRAC).
Technology
At the time of the practices immersion, Georgia Power was investigation the use of tan delta testing (dissipation factor) for network cables. This technique may offer benefits as a periodic qualitative check of cable condition.
7.5.1.11 - HECO - The Hawaiian Electric Company
Maintenance
Cable Testing - Diagnostics
People
Cable Testing is performed by the Cable Splicers within the C&M Underground Group. The Underground Group at HECO is part of the Construction and Maintenance organization. The group is comprised of two UG supervisors, fifteen Cable Splicers, 2 Utility Mechanics, and 2 Utility Assistants.
The HECO cable testing methodology is developed by the Technical Services Division within the Engineering Department.
Process
HECO uses Very Low Frequency AC Hi Pot withstand testing (VLF Testing). They have chosen VLF as a withstand test, because it does not cause healthy insulation damage as does DC Hi pot testing. VLF testing will identify unhealthy insulation, identifying and breaking down weaknesses so that they can be located by traditional methods such as cable thumping.
HECO is not performing cyclical, proactive cable withstand / diagnostic testing. Rather, HECO’s approach is “targeted” in that they perform proactive VLF withstand testing on cable sections that have had a history of failure (either cable failure or failures in separable connectors). They perform a one half hour test on each phase.
HECO has considered implementing a more comprehensive application of VLF testing, testing some percentage of their total cable plant each year, but has hesitated based on concerns that the VLF test could break down the insulation in cable sections that may actually have significant life left in the cable. This issue is currently under investigation and consideration at HECO.


Figure 1 and 2:
Applying VLF Test Leads

Figure 3:
Applying VLF Test Leads

Figure 4:
VLF Test Kit
HECO also performs VLF diagnostic testing after finding a fault to “prove out” the remaining cable prior to re-energizing a circuit or circuit section.
Technology
HECO has specialized trucks that are equipped with cable diagnostic equipment, including DC hi pot testers, and VLF testers.
7.5.1.12 - National Grid
Maintenance
Cable Testing - Diagnostics
People
National Grid performs routine proactive VLF cable diagnostic withstand and tan delta testing of underground feeders. However, at the time of the practices immersion, they were considering, but had not yet applied this testing (routinely applied withstand and tan delta testing) to network feeders.
National Grid has prepared an Electric Operating Procedure (EOP) that defines when and what type of test is to be applied. For example, new cables are acceptance tested to assure the cable is suitable for service and to provide a benchmark for comparison of results from future testing.
VLF withstand testing is a dielectric withstand test that involves the application of a very low frequency AC voltage to the cable.
Tan Delta (dissipation factor) testing gives an indication of cable health, compared to previous or theoretical results. Regular testing can provide trending data and assist with identification and proactive replacement of cables in poor condition prior to service interruption from cable failure.
National Grid is also investigating the use of partial discharge testing, which can detect electrical trees, tracking and cable voids. However, the length of their system and its hybrid composition present challenges for using PD testing on network feeders. National Grid does not have a trained engineer or dedicated crew for regular use of PD testing equipment.
Process
The National Grid EOP provides recommendations for testing developed by Distribution Engineering Services. However, the final determination as to when to test a cable is the responsibility of the operating divisions.
National Grid may perform four types of tests:
Acceptance Test: A field test made after a new cable system installation, including terminations and joints, but before the cable system is placed in normal service.
Diagnostic (Withstand) Test: A test conducted during the operating life of a cable to determine and locate degradation that may cause cable and accessory failure. National Grid is using a 60 minute VLF AC test.
Installation Test: A test conducted after cable installation, but before jointing (splicing) or terminating where a problem is suspected with the cable (such as damage from cable pulling, for example).
Pick Up Test: A test applied to a cable circuit which has been repaired or modified, intended to locate gross problems which will most likely cause immediate failure of the circuit. National Grid uses VLF AC testing for 5 minutes for the Pick Up test.
Technology
National Grid’s newer VLF and Tan Delta testing equipment is from HV Diagnostics, and they have four (4) sets in operation, and two (2) sets in storage awaiting new vehicles. The equipment is modular, semi-portable (the largest piece is 300 lbs), and simple to operate with a menu driven system. Tan Delta analysis requires a laptop, and the system uses blue-tooth communication from HV unit to laptop so that no cables are required
National Grid also has an HV Diagnostics Partial Discharge unit. The unit uses the same VLF power supply that is already in operation with the other HV units. National Grid currently has one test set, which is not yet in operation.

Figure 1:
VLF Test Set

Figure 2:
Tan Delta Test Set
7.5.1.13 - PG&E
Maintenance
Cable Testing - Diagnostics
People
PG&E performs routine proactive cable diagnostic testing of underground feeders. For network feeders, the application of proactive diagnostic testing is relatively recent, beginning in 2010. PG&E performed diagnostic testing (VLF) of network feeders during the summer of 2010, and then suspended the testing in September to evaluate its efficacy. Based on this evaluation, they will recommence with proactive VLF testing of network cables in 2011. Note that PG&E performs VLF testing of non-network cables as well.
VLF testing is performed by the Applied Technology Services (ATS) group. This group employs technicians trained and equipped to perform VLF Hi Pot and VLF Tan Delta testing. The ATS group works closely with cable splicers to apply and perform the tests.
The selection of feeders to test is based on historic reliability performance data supplied by the network planning engineers.
Process
PG&E performs very low-frequency (VLF) AC withstand and tan delta testing of underground feeders. They do not use a routine cyclical approach; rather, they decide which feeders to test on a case-by-case basis based on reliability performance. The five worst performing network circuits were chosen for testing in 2010[1] .
PG&E performs a VLF AC Tan Delta testing to get a general idea of the health of a particular cable. This test provides a measure of total cable system loss (power in versus, versus power used). PG&E also perform an AC VLF withstand test to identify any imminent cable failures and force them to failure. They conduct a one half hour withstand test, testing each phase at two times the voltage.
VLF testing is performed by the Applied Technology Services (ATS) group. This group employs technicians trained and equipped to perform VLF Hi Pot and VLF Tan Delta testing. Failed cable sections identified by the testing are troubleshot by field crews and replaced.
Because network feeders at PG&E are designed with sectionalizing switches, PG&E is able to narrow down the location of the breakdown revealed by the VLF withstand test to a cable section.
During the immersion, EPRI researchers were able to observe the performance of a VLF hi pot test on a network feeder to fail and locate the failure point. In this particular case, PG&E had earlier performed a proactive VLF withstand test on a network feeder, and the test revealed some breakdown of the installation one of the phases. The VLF withstand test was applied to circuit at the substation, and indicated a breakdown somewhere on the feeder. Because network feeders at PG&E are designed with sectionalizing points, PG&E was able to sectionalize the circuit and then retest from the substation. This second test revealed no breakdown of the cable insulation from the station to the first sectionalizing point, indicating that the problem with the cable was located further down the line (beyond the sectionalizing point).

Figure 1:
VLF Test Set connected at Sectionalizing Switch

Figure 2:
VLF Test Set connected at Sectionalizing Switch
In this case, the original VLF testing was performed by the ATS group, while the testing to find the fault was performed by cable crews, and supervised by the ATS group.
When PG&E removes a feeder from service to perform VLF testing, the M&C group will take advantage of this outage to perform other planned or corrective maintenance.
Note that PG&E is presently evaluating the merits of cable diagnostic testing for network feeders. They expressed some concern that the destructive nature of the breakdown test could force cables with significant remaining life to failure. After testing network cables during the summer of 2010, they suspended testing to evaluate the implications of the testing.
Technology
PG&E uses a specialized vehicle (minivan) equipped with cable diagnostic equipment, including a VLF test set, tan delta device and TDR kit. See Photographs below.

Figure 3:
Specially equipped cable diagnostic minivan. Note ramp for loading / unloading VLF Test set

Figure 4:
VLF Test set on a cart

Figure 5:
Tan Delta device located in specially equipped cable diagnostic minivan

Figure 6:
Hi Pot testing device located on back of truck
[1]Network feeders selected for testing are taken out of service for the purpose of testing. PG&E has no standard that requires a cable diagnostic test prior to reenergizing an outaged feeder.
7.5.1.14 - Portland General Electric
Maintenance
Cable Testing - Diagnostics
People
For the CORE, cable testing and diagnostics are largely the responsibility of the Special Tester position, who is a journeyman lineman with additional training and technical skills. The Special Testers support the network department, with one individual embedded within the CORE group.
As part of its work, including performing cable diagnostic testing, the Special Tester usually partners with cable splicers, working as part of a crew. The “special testing” crew includes the Special Tester, a crew foreman (a cable splicer), a lineman/cable splicer, and a topman. The topman stays outside the hole and watches the manhole/vault entrance to ensure no accidents.
In addition to performing cable testing, such as direct current (DC) high potential (hipot) testing, the Special Tester crew will also perform NP testing and respond to power quality issues.
Process
PGE has experienced good reliability with its network cable fleet, having very few cable issues. It presently performs any routine diagnostic cable testing on network cables, although it has performed some diagnostic testing on primary network cables crossing the river in the past.
PGE does routinely not test new cables upon receipt from the manufacture. Before commissioning new cable or returning a de-energized primary circuit to service, crews perform a DC hipot verification test. In general, PGE policies advise against leaving cables de-energized for long periods of time. If the cable has been de-energized for several weeks, the cable failed and was repaired, or modifications were made to the cable, such as replacing a section. Then, crews perform a circuit verification test, which includes a DC hipot test. When replacing a T-body or major component, PGE also performs a DC hipot test.
PGE performs very low frequency (VLF) testing on the getaway cables at substations but does not record any tan delta measurements.
PGE does perform routine visual inspection of cables during vault and manhole inspections, looking for evidence of deterioration and adding fire resistance (wrap) when necessary. PGE does tong secondary cables to identify blown limiters as part of their maintenance.
Special Testers also perform infrared testing of some cable joints/bends on the system as part of their vault inspection program. According to standards, differences in temperature between 5 and 18oF (-15 and -8oC) are graded as medium with no corrective action needed, but the issue is recorded and re-inspected during the next inspection cycle. In practice, if inspectors find a difference in temperature between joints in a cable of over 10oF (-12oC), then they deal with it by repairing or replacing the joint within two weeks. Where the difference is between 20 and 28oF (-7 and -2oC), inspectors deal with the problem immediately.

Figure 1:
Infrared(IR) thermography

Figure 2:
Infrared thermography
To locate faults, crews use a DC hipot thumper and all special testing crews carry the equipment in their truck. When they receive clearance on a feeder, they switch the transformers and network protectors to the open position. At the substation, they ground the cable for safety, unground it, and connect the DC hipot equipment to each phase at the cable termination one at a time. Once they have isolated the problematic phase, crews use a hand-held impulse detector in conjunction with the thumper to detect the pulse. Testers go from manhole to manhole until they locate the fault.
7.5.1.15 - SCL - Seattle City Light
Maintenance
Cable Testing - Diagnostics
People
Organization
SCL has an Energy Delivery Field Operations department that includes a network Electrical Services group (Area Field Operations — Network) group, and a network Civil Services group. The Electrical Services group is made of 84 total people including the supervision and a five person cable-locate crew. This group performs all construction, maintenance, and operation of the network System, including cable diagnostic testing.
Cable Splicer Position
The Cable Splicer position at SCL is a generalist position. Cable splicers perform all electrical
aspects of network construction, operations, and maintenance, including perfroming cable diagnostic testing.
All electrical employees who work in the network are either crew chiefs, journeyman cable splicers, or apprentices in the mode of progression, working their way toward the journeyman level.
Cathodic protection inspections and testing for transmission cables are performed by network crews. Testing results are forwarded to Generation Engineering.
Technology
SCL uses DC Hi-pot proof testing (putting a high-voltage DC signal on the cable) when testing cable prior to energizing that cable. 15-kV cable is limited to 26 kV DC, and 26-kV cable is limited to 47 kV DC. SCL performs this test before energizing a new cable or prior to re-energizing an existing cable. Proof testing is conducted as part of feeder maintenance.
SCL crews do not have confidence in VLF (very low frequency) testing. The crews noted that there are many “Y” splices in their system that could confound VLF testing.
7.5.1.16 - Practices Comparison
Practices Comparison
Maintenance
Cable Diagnostic Testing

2015 Survey Results


Older Survey Results


7.5.1.17 - References
EPRI Unde rground Distribution Systems Reference Book (Bronze Book)
7.5.1.18 - Survey Results
Survey Results
Maintenance
Cable Testing and Diagnostics
Survey Questions taken from 2019 survey results - Practices Inspection survey
Question 16 : In what applications will you perform network primary cable diagnostic testing?


Question 18 : If you are performing periodic primary cable withstand testing, what is the frequency of the testing?
None of the companies that reported withstanding testing provided a response.

Question 20 : Please indicate / describe what testing techniques you use. Check all that apply


Survey Questions taken from 2018 survey results - Asset Management survey
Question 10 : If you perform periodic network primary cable diagnostic testing, please indicate / describe what testing techniques you use.


Question 11 : Are you using information from cable diagnostic testing to influence investment decisions, such as when to replace cable?


Question 12 : Do you perform cable limiter continuity checks (amp checks) as part of your preventive maintenance program?


Survey Questions taken from 2015 survey results - Design
Question 81 : In what applications will you perform the network primary cable diagnostic testing? (Check all that apply)


Question 82 : If you are performing periodic primary network cable withstand testing, what is the frequency of the testing?

Question 84 : Please indicate / describe what testing techniques you use.


Question 85 : Please indicate if your company performs the following activities on routine basis and at what frequency.

Survey Questions taken from 2012 survey results - Maintenance
Question 6.5 : In what applications will you perform cable diagnostic testing?


Question 6.6 : If you are performing periodic primary network cable withstand testing, what is the frequency of the testing?

Question 6.7 : If yes, please indicate / describe what testing techniques you use.


Question 6.13 : Do you regularly perform Primary cable and splice / connection infrared inspections?

Question 6.14 : If yes, what is the frequency of Infrared testing?

Question 6.15 : Do you regularly perform secondary cable and splice / connection infrared inspections?

Question 6.16 : If yes, what is the frequency of secondary infrared testing?

Question 6.17 : Do you regularly perform Secondary / Grid cable testing?

Question 6.18 : If yes, what is the frequency of secondary cable / grid testing?

Survey Questions taken from 2009 survey results - Maintenance
Question 6.7 : Do you regularly perform primary cable diagnostic testing?

Question 6.9 : In what applications will you perform cable diagnostic testing? (this question is 6.5 in the 2012 survey)


Question 6.10 : If yes, please indicate / describe what testing techniques you use. (this question is 6.7 in the 2012 survey)


Question 6.17 : Do you regularly perform Primary cable and splice / connection infrared inspections? (this question is 6.13 in the 2012 survey)

Question 6.18 : If yes, what is the frequency of Infrared testing? (this question is 6.14 in the 2012 survey)

Question 6.19 : Do you regularly perform secondary cable and splice / connection infrared inspections? (this question is 6.15 in the 2012 survey)

Question 6.20 : If yes, what is the frequency of secondary infrared testing? (this question is 6.16 in the 2012 survey)

Question 6.21 : Do you regularly perform Secondary / Grid cable testing? (this question is 6.17 in the 2012 survey)

Question 6.22 : If yes, what is the frequency of secondary cable / grid testing? (this question is 6.18 in the 2012 survey)

7.5.2 - Civil Maintenance
7.5.2.1 - AEP - Ohio
Maintenance
Civil Maintenance
People
Civil maintenance is coordinated by a Network Engineer within the Network Engineering group, and is typically performed by a contractor. AEP Ohio has a strong working relationship with its civil contractor, as the contractor employs a civil engineer with many years of experience working with AEP Ohio and thus has familiarity with its system.
All civil maintenance is driven by findings from inspections (see Vault and Manhole Inspection), which include an assessment of the condition of the civil infrastructure. Findings that require civil construction repairs are forwarded to the Network Engineering group, who will coordinate with the contractor to schedule repairs.
Process
When any crew member finds a civil maintenance problem, it is recorded and sometimes photographed. This information is sent to Network Engineering, which prioritizes civil maintenance projects and prepares work orders to engage the civil engineering contractor.
For new manholes and vaults, AEP Ohio is using precast structures – civil designs, plan, and profile drawings for these structures are also prepared by the contractor. For repairs, designs can involve poured in-place structures, and combination structures, where the bottom part of the structure is poured, and the middle and top of the structure are pre-cast.
Technology
Civil condition findings from inspection are also recorded in the AEP online NEED (Network Enclosure and Equipment Database) for tracking network assets and their conditions. Note that the NEED database was originally developed to track serialized assets, but has been expanded to support AEP in tracking non-serialized condition findings, civil condition, and operational conditions. The system is used to schedule orders to address corrective maintenance issues according to priority.
7.5.2.2 - Ameren Missouri
Maintenance
Civil Maintenance
People
Vault and Manhole inspections include an inspection of the civil condition of enclosure. Manhole inspections are performed by contractors. Network vault inspections are performed by Distribution Service Testers within the Service Test group.
Organizationally, the Service Test group is part of Distribution Operations, led by a manager. Within Distribution Operations, there is a Reliability Support Services group led by superintendent. Reporting to the Superintendent Reliability Support Services are both the Service Test group led by a supervisor and the Distribution Operating group, also led by a supervisor.
The Service Test group is made up of Service Testers and Distribution Service Testers. It is the Distribution Service Testers who perform vault inspections, as well as network protector maintenance and calibration, and transformer maintenance including oil testing.
Ameren Missouri has a Civil and Structural Design group, part of Energy Delivery Technical Services. The group is responsible for developing civil designs and standards for civil construction and repair, including deciding the best approach for making repairs to civil infrastructure, such as manholes and vaults.
Ameren Missouri has developed a Structural Inspection Training Manual for Vaults, a guideline that guides Distribution Service Testers in performing visual inspections of vault structures. See . .
Ameren Missouri uses contractors for making civil repairs to existing infrastructure. Repairs can range from epoxy injection to fill cracks, to replacing deteriorated vault roofs.
Process
Vault / Manhole inspections include an inspection of the civil condition of enclosure.
The visual inspection includes:
-
Visually inspect and photograph the vault and note the following structural and electrical information:
-
Grating sits flush and is not worn or deformed
-
Safety cage opens properly and sits well when opened
-
Inspect the ceiling for any cracking, bulging and water leaks. Capture the total amount of cracks and describe the widest and longest crack
-
-
Inspect the walls for any cracking, bulging, water leaks or if any of the wall is missing. Capture the total amount of cracks and describe the widest and longest crack
-
The type of floor material, its finish, how it drains and any cracking.
-
Visually inspect the bus bars for rust or cracks and check to see that the supports are secured to the ceiling.
-
Note if the wall is painted and the condition of the epoxy paint.
-
Visually inspect that the cable supports are secured to the wall.
-
Inspect the network monitoring equipment for proper operation.
-
Note any excessive debris on the floor that could be due to collapsing walls or ceiling or if it is debris from public.
-
Record the type of lighting in the vault and replace any burnt out bulbs.
During the inspection of manholes and vaults, the inspectors (either contractors for manholes or Dist Service Testers for vaults) take photographs of the interior and record this information on computers.
Ameren Missouri has a well defined manhole inspection / repair process for performing manhole inspections that includes guidance for inspectors for action based on inspection findings. Structural findings are forwarded to the Civil and Structural Design group within Energy Delivery Technical Services for analysis, scheduling and repair.
Technology
Findings are recorded by the contractor on tough books into a Circuit and Device Inspection System (CDIS). The contractor provides a report that summarizes the findings. The CDIS utilizes an algorithm that assigns a “structural score” and an “electrical score” based on the inspection findings and weightings for various findings developed by Ameren Missouri. The scores are used to prioritize remediation. CDIS is also used to produce reports that summarize inspection findings and a dashboard that monitors inspection progress.
Sample photographs of manhole / vault deterioration:

Figure 1:
Cracked Roof

Figure 2:
Ceiling falling into conductors
7.5.2.3 - CEI - The Illuminating Company
Maintenance
Civil Maintenance
People
Civil maintenance at CEI is performed by contractors. CEI typically retains the services of five different contractors to perform civil work (construction and maintenance).
Process
The Underground Network Services group has one supervisor who runs the contractor crews who perform civil maintenance.
7.5.2.4 - CenterPoint Energy
Maintenance
Civil Maintenance
People
Civil maintenance at CenterPoint is performed by contractors.
Major Underground has one supervisor who runs the contractor crews. This individual works closely with the Lead Engineering Specialist of the Feeders group within the Major Underground Engineering organization.
Process
Civil maintenance at CenterPoint is performed by contractors. For example, CenterPoint has hired a contractor to rebuild deteriorated vault roofs they have identified during inspection.
Note that certain civil work near energized facilities, such as chipping concrete around energized conductors, is performed by CenterPoint crews – not the contractor.
CenterPoint has entered into a longer term relationship with their civil contractor – a 2 year term, with an option to continue for a third year. They have created an alliance relationship, which invests both parties in the other’s success. The parties will meet periodically to review performance, profits, and to establish future benchmarks.
Note that this contractor also performs non civil work on CenterPoint’s behalf. The terms of the alliance apply to all of the contractor’s work.
7.5.2.5 - Con Edison - Consolidated Edison
Maintenance
Civil Maintenance
People
Construction Group
Con Edison’s service territory consists of four regions: Manhattan, Brooklyn/Queens, Staten Island, and Bronx/Westchester. The Manhattan Region is made up of three districts, including one headquartered at the W 28th St. Work Out Center. The term Work Out Center refers to a main office facility to which field construction and maintenance resources report. To provide a perspective on the size of a workout center, about 300 people work at the W 28th Street Work Out Center, and they can field about 125 crews.
The construction department consists of several group, including the Subsurface construction (SSC) group. The SSC deals with vaults, conduit ducts, and other civil work. Much of this work is contracted.
7.5.2.6 - Duke Energy Florida
Maintenance
Civil Maintenance
People
Vault and manhole inspections are performed by craft workers, Network Specialists and Electrician Apprentices, within the Network Group, part of the Construction and Maintenance Organization. The Network Group is led by a supervisor, and consists of ten craft workers, five Electric Apprentices and five Network Specialists (the journey worker position).
Duke Energy Florida’s construction and maintenance organization is divided into regions, with both Clearwater and St. Petersburg falling within their South Coastal Region. The Construction and Maintenance organization for the South Coastal Region is led by a General Manager.
The Network Group is organized functionally, and has responsibility for construction, maintaining and operating all urban underground infrastructure (ducted manhole systems), both network and non-network, in both Clearwater and St. Petersburg see Figures 1 and 2).

Figure 1:
Old vault roof and grating

Figure 2:
New vault roof and grating
Most civil work is performed by contractors. Duke Energy Florida will utilize ad hoc contractors for smaller work, and may enter into larger turnkey contracts for major civil work.
Network work crews at Duke Energy Florida perform duct line inspections when necessary in Clearwater and St. Petersburg.
Process
Vault and manhole inspections include an assessment and recording of civil conditions including the conditions of grates, covers and doors, ladders, ring bus, cable racks and supports, duct shoes, and transformer support beams. Duke Energy Florida does not routinely inspect and maintain duct lines. Duct lines are inspected only when necessary or observed conditions warrant.
Information from the inspection is recorded on an inspection form, including an assessment of the priority or severity of the finding. See Attachment I . Information from the inspection is entered into a computer system, and the hard copy form is maintained in a file. Duke Energy Florida has a “Further Work Ticket Process” which is initiated to pursue remediation for corrective maintenance items identified by inspection. The repair schedule is dictated by the priority of the finding. All but minor civil repairs are outsourced to a contractor.
Technology
Duke Energy Florida has much Orangeburg duct in the ground. They also have creosote paper duct in concrete duct bank. Duke Energy Florida crews will mandrill a duct if necessary.
Crews do have access to a duct camera, if needed. However, this type of inspection is rarely performed.
7.5.2.7 - Duke Energy Ohio
Maintenance
Civil Maintenance
People
Civil maintenance at Duke Energy Ohio is performed by both contractors and Duke field crews. Duke crews will perform most civil maintenance near energized facilities. Most civil maintenance, however, is performed by contractors.
The Dana Avenue Underground group has one supervisor, a T&D Construction Coordinator, who runs the civil contractor crews.
Process
Duke performs vault inspections occur 4 times a year, and manhole inspections every six years. These field inspections include identifying any structural or other potential civil deficiencies.
Duke will revisit the suspect manholes with either an in house civil expert or an external civil contractor to assess the civil condition and structural integrity of the manhole to identify high priority candidates for rebuild. (See Manhole and Vault Rehabilitation.
Other inspection findings are scheduled for repair using civil maintenance contractors.
7.5.2.8 - Energex
Maintenance
Civil Maintenance
People
Energex primarily sub-contracts civil maintenance to third-party contractors it has worked with for years and are certified, supervised, and work inspected by Energex.
Process
Civil maintenance that is subcontracted includes vegetation management, vault cleaning and repairs (where necessary), pole clearing, pit construction, and some substation and customer premises-based construction.
7.5.2.10 - Georgia Power
Maintenance
Civil Maintenance
People
Civil maintenance is led by a by the Network Underground Engineering staff and its Standards Group. This group develops design standards for manholes, vaults, substations, duct lines, etc. The group is also involved in deciding the best approach for making repairs to civil infrastructure, such as manholes and vaults.
Routine inspections and maintenance of civil structures are handled by the Network Operations and Reliability group. Major initiatives such as replacements of brick roofs on manholes are handled by special assignment of engineers, construction crews, and contractor crews. The group often out-sources large civil maintenance projects to its preferred contractors, but all work must adhere to company standards, and is supervised by Georgia Power engineers.
Two examples of civil maintenance work performed at Georgia Power are the replacement of deteriorating brick vaults and the upgrading of manholes from standard, solid manhole covers to SWIVELOC manhole designs in select, high-traffic areas of downtown Atlanta (See Figure 1). The group is also contemplating moving to traffic-bearing vault grates in downtown areas (See Figure 2).

Figure 1:
Old Brick and Beam ceiling

Figure 2:
SWIVELOC manhole installation
All maintenance is driven by inspections (see Vault and Manhole Inspection in this report), which include an assessment of the condition of civil infrastructure. Findings that require civil remedies are forward to the supervising civil engineer.
Process
When an inspector finds a civil maintenance problem, he logs it into the Network Underground Access system used to record inspection findings, and a work order is generated to affect a repair. Information from the Access database is also passed to GIS, which can be accessed by civil repair crews. The information contained in GIS includes work order information. The civil maintenance crew must then schedule a date and time for repair, including notification to the city at least four hours prior to the civil work if there will be lane or sidewalk blockages involved. Using DistView in combination with GIS, the crew can find the repair location quickly.
Technology
Through the GIS system, the Maintenance Supervisor can call up work orders on computer in his truck, but all work orders are also issued on paper so that crews can take the paper orders into the manhole or vault.
7.5.2.11 - HECO - The Hawaiian Electric Company
Maintenance
Civil Maintenance
People
Civil maintenance at HECO is performed by contractors.
Process
The C&M Underground group has one supervisor who runs the contractor crews who perform civil maintenance.
7.5.2.12 - National Grid
Maintenance
Civil Maintenance
People
The National Grid network field resources (network crews) are part of the group responsible for the underground system in eastern New York, called Underground Lines East. This group is led by a Manager, and includes a group focused on civil aspects of the underground system and a group focused on the electrical aspects. The Underground Lines group is responsible for both the network and non – network infrastructure in eastern NY, including the Albany network.
The Civil Group is comprised of Mechanics, Laborers, and Equipment Operators, and is led by a supervisor. This group includes a machine shop located in Albany. This group will perform minor civil projects, including maintenance and repairs. Much of the larger civil construction and maintenance work at National Grid is performed by external contractors.
Civil designs, if required, are performed by the Distribution Design group, part of the Engineering organization.
Process
National Grid performs vault inspections annually. These field inspections include identifying any structural or other potential civil deficiencies that may require maintenance (See Vault Inspection for more information on civil items included in inspections.)
Technology
All duct lines in the network at National Grid are concrete encased, including primary, secondary and fiber ducts
National Grid’s construction standards call for pre-cast manholes and vaults. Standard vault size is dictated by size of the network unit. , National Grid has detailed standards that describe their underground electric vault requirements.
7.5.2.13 - PG&E
Maintenance
Civil Maintenance
People
Civil maintenance at PG&E is performed by civil resources who are part of the Gas Department.
PG&E has a Civil Engineering group, part of the Substation Engineering Department, responsible for vault design.
Process
PG&E performs vault inspections annually as part of their network transformer maintenance, and manhole inspections every three years. These field inspections include identifying any structural or other potential civil deficiencies.
7.5.2.14 - Portland General Electric
Maintenance
Civil Maintenance
People
On the network, civil maintenance is generally outsourced to external contractors. During normal vault inspections, crews from the CORE group look for any structural problems in vaults and manholes.
The CORE group, led by an Underground Core Field Operations Supervisor, focuses specifically on the underground CORE, including both radial and network underground infrastructure in downtown Portland.
The typical underground crew consists of three people: two journeymen and a non-journeyman helper. The foreman, who is a qualified cable splicer, is one of the working journeymen on the crew. The two journeymen typically perform the work inside the manhole or vault while the helper, typically a non-journeyman classification, usually stays above ground, carrying material and watching the barricades and street for potential hazards.
Historically, work crews have been assigned a variety of work types depending on needs, ranging from new construction to maintenance and operation of the system. Due to the large number of new construction projects underway in Portland, and to assure that the demand for resources to support that construction does not erode the focus on maintenance, the CORE group is considering creating a dedicated maintenance crew that will maintain a focus on network infrastructure inspection and maintenance.
To liaise with customers concerning civil maintenance issues, key customer managers (KCMs) organize vault inspections and maintenance.
Process
Inspections of the civil infrastructure are performed in conjunction with manhole and vault inspections.
PGE’s network has 1300 manholes/vaults. Of these, 529 are vault structures, with 280 vaults containing equipment.
For vaults that contain equipment, such as network transformers or network protectors, the frequency of inspection dovetails the performance of equipment maintenance, as a vault inspection accompanies the maintenance of equipment. For example, 480 V network protectors are maintained annually, so inspection of the vaults that house 480 V protectors are also performed annually.
For general-purpose structures, including vaults, manholes, and handholes that do not contain equipment, PGE attempts to inspect all underground enclosures annually, though manpower availability determines the exact cycle. At the start of every year, general work orders for inspection of manholes are created in Maximo for a particular geographical area, with each work order covering the manholes in a one- or two-block area. A crew receives these work orders and is expected to perform inspections of the general-purpose enclosures when it does not have any customer work. If there is little customer work on the network, inspections can be completed for all non-equipment manholes and vaults within a calendar year.
PGE employees, not contractors, perform all inspections of general-purpose structures, including both an electrical and civil (structural) review. Inspections include a visual inspection to identify leaks, assess vault cleanliness, etc., and may include the use of infrared (IR) thermography at the discretion of the inspection crew. Crews may take photographs during vault inspections, but this process has not been formalized. Any damaged ducts are inspected with a duct camera in an as-needed basis rather than as part of the regular inspection.
If vaults/manholes need civil or structural repairs, PGE uses an external Level III contractor. The company has a two-year contract with the outside contractors to undertake this type of work. For large, complex repairs, a structural engineer will be used.
Customer Vaults: The spot network vaults are customer-owned, and the key customer group coordinates with the customer on the repair of infrastructure issues identified during inspections. It relays the findings to the customer and ensures that action is taken to correct the issue.
Technology
Maximo: PGE uses the Maximo for Utilities 7.5 system to manage inspection reports and store details about any maintenance needed.

Figure 1:
Use of radio-based distribution voltmeters
7.5.2.15 - SCL - Seattle City Light
Maintenance
Civil Maintenance
People
Organization
SCL has an Energy Delivery Field Operations department that includes a network Electrical Services group (Area Field Operations — Network) group, and a network Civil Services group. The Electrical Services group is made of 84 total people including the supervision and a five person cable-locate crew. (Note: this cable-locate crew does underground locating for the whole company). This group performs all construction, maintenance, and operation of the network system.
The Civil Services group consists of approximately 36 employees. In addition, SCL contracts approximately 25% of their civil construction work associated with their network system as well.
Process
Civil crew representatives participate in SCL’s bi-weekly crew coordination meetings. (See Construction - Project Management - Bi-weekly Crew Coordination Meeting)
SCL hired a consulting firm to audit their manholes to identify needed civil repairs. They currently have a $2.5 million budget to perform manhole civil repair. This work has been prioritized and is being spread over 40 years.
7.5.3 - Elevated Voltage Testing (Stray Voltage)
7.5.3.1 - Con Edison - Consolidated Edison
Maintenance
Elevated Voltage Testing(Stray Voltage)
Process
Con Edison performs annual elevated voltage (stray voltage) testing. This is performed in accordance with New York statewide standards to ensure the public safety of electric systems. The safety standards include requirements to annually test all publicly accessible transmission and distribution facilities for stray voltage and inspect all electric facilities at least once every five years. To ensure compliance with the safety standards, the Commission established strict record keeping, certification and reporting requirements, and rate adjustments for failure to achieve specific performance targets for the testing and inspection programs.
7.5.3.2 - National Grid
Maintenance
Elevated Voltage Testing(Stray Voltage)
People
National Grid has engaged 25 contractors to perform elevated voltage (stray voltage) testing on their distribution system in New York State. This testing is being performed on their entire distribution system on all facilities from ground level to eight feet above ground level, including the testing of manhole covers.
The program conforms to a New York State mandate to test for stray voltage in cities with populations over 500,000. National Grid is performing elevated voltage testing in Albany.
Process
National Grid performs annual elevated voltage (stray voltage) testing in New York State. This testing includes manhole covers.
Technology
Contractors utilize a handheld directional E- field tester to identify stray voltages.
National Grid does not bond vault grates and manhole covers to the grounding system. Ladders are bonded to the grounding system.
7.5.3.3 - Energex
Maintenance
Elevated Voltage Testing(Stray Voltage)
* Energex is not performing any stray voltage testing on the pit cover.
7.5.4 - Failure Analysis
7.5.4.1 - AEP - Ohio
Maintenance
Failure Analysis
People
Component and cable failures are first analyzed by Network Mechanics and Network Crew Supervisors and then turned over to the AEP Ohio Network Engineers. If engineers determine that the failure is due to sub-standard equipment or if the company’s standards were not met, then they will work with suppliers and crew supervisors to remedy the situation.
Important findings from these equipment failures are shared with the company-wide Network Standards Committee, which is comprised of representatives of all the AEP operating companies with network grids (see Network Standards).
Process
Engineers will review failed components and may perform a forensic analysis. Network Engineers may turn the failed equipment over to the manufacturer, commission an analysis at AEP’s Dolan laboratory, or send it to an outside, third-party analysis group, such as NEETRAC.
7.5.4.2 - Ameren Missouri
Maintenance
Failure Analysis
People
Ameren Missouri Standards Group engineers perform failure analysis on underground components such as cable and splices. They usually do the analysis in house, but may enlist the services of the manufacturer or external labs in some cases.
The Standards Group has implemented a formalized Unsatisfactory Performance Report (UPR) Process used by the field force to report problems with distribution materials. The process includes:
- Claimant completes UPR form and submits to Supervisor of Standards - with sample of defective equipment if possible;
- Supervisor enters in UPR database and assigns to Standards engineer;
- Engineer reviews report and sample and determines response based on knowledge of item or report from manufacturer after submittal to manufacturer for analysis;
- Engineer response to claimant and forwards to secretary;
- Secretary distributes to distribution list and posts on Standards website
See Attachment B for a sample of the UPR form.
Process
Standards engineers will review failed components and perform a forensic analysis. When they do the dissection of a component, they attempt to involve the crew who installed that component if possible. This is so that the crew who installed the component can see the problem first hand as the engineers sees it.
If the analysis reveals a repetitive workmanship issue, the standards engineers will develop and deliver a training session to resolve the workmanship issue.
Technology
Analysis of failed underground equipment is performed by the Standards Group, Underground Engineering and the Underground Construction departments.
7.5.4.3 - CEI - The Illuminating Company
Maintenance
Failure Analysis
People
Failure analysis on failed cables, splices, connectors, and equipment is performed at the FirstEnergy Beta Laboratory (See “ BETA Lab” - Testing Laboratory). Field crews make the determination as to what equipment is sent to the lab, and what equipment is not based on their experience. For example, if the cause of a splice failure is obvious to the crew, such as a water damage due to an improperly prepared splice, and they believe there to be little if any incremental learning to be gained by sending the failed splice to the Lab for a forensic analysis, then the crew will not send it forward.
Process
When a PILC cable fault occurs in a manhole that is filled with water, field crews may perform a test of the paper to ascertain whether or not the paper is dry. The field crew will boil mineral oil and drop a few strands of paper into if it see if it bubbles, indicating the presence of water in the paper. Note – if the manhole is dry, the field crew may not perform this test. This same test may also be performed at FirstEnergy’s Beta Lab as part of a post failure forensic analysis.
Failures that are determined to be sent to the Beta Lab are bagged, tagged and send to the Lab.
After analysis, the Beta Lab will send a failure analysis report back to the UG department. See Attachment - Y.
7.5.4.4 - CenterPoint Energy
Maintenance
Failure Analysis
(Splice)
People
CenterPoint Training and Major Underground management resources perform analysis of failed splices.
Process
CenterPoint performs an analysis on each splice failure to understand what caused the failure. This analysis is performed in house, by CenterPoint Training and Major Underground management resources.
Normally, if CenterPoint experiences a splice failure within the first 2 years of its life, the failure is due to a workmanship issue.
Technology
CenterPoint uses hand taped splices. CenterPoint has experienced very few splice failures. (See Splicing )
7.5.4.5 - Con Edison - Consolidated Edison
Maintenance
Failure Analysis
People
Distribution Engineering Equipment Analysis Center (DEEAC)
Con Edison has recently launched a new team dedicated to the analysis of electric distribution equipment. The mission of the Distribution Engineering Equipment Analysis Center (DEEAC) is to optimize the performance of distribution equipment through a system safety approach that utilizes data trending and incident analysis. To support this mission, the team is focused on enhancing the safe operation of distribution equipment while also improving overall system reliability by proactively mitigating operational risk. These goals will be achieved through targeted forensic analysis, data characterization of all field-returned equipment, and quality assurance of distribution equipment. Con Edison is dedicated to supporting the mission of DEEAC with a shared focus on continuously improving system safety.
Process
Cable Failure Analysis
Con Edison’s goal is to perform a failure analysis on every cable and splice failure that occurs. The utility is able to perform an actual analysis on 80 – 90% of the problems that occur; the remainder represent problems that are destroyed or inaccessible.
In addition to testing cable that failed, the utility tries to expand testing to look at the condition of adjacent cable sections that did not fail. In the case of a splice failure, crews replace all three splices and perform diagnoses on the unfailed splices to aid in drawing conclusions about the cause of the failure.
A big challenge for Con Edison is failures that occur in transition joints (between PILC and non-PILC conductors). These transition joints are commonly referred to as “stop joints.” The failures they encounter typically occur on the paper side of the joint. The utility has implemented a replacement program to install cold shrink joints to replace them. They have had good success with the cold shrink joints.
Transformer Failure Analysis
Con Edison performs a root cause analysis of all network transformer removals including units that failed in service, units that were removed because of failed dissolved-gas-in-oil-analysis (DGOA), units that were removed because of failed oil temperature, pressure, or level indications from the RMS system, and units that failed during testing.
Removed units are sent to Con Edison’s Distribution Engineering Equipment Analysis Center (DEEAC), where they are taken apart for a thorough root cause analysis. Analysis includes detailed physical inspections and review of oil test results. Common findings include excess corrosion due to tank holes or porosity, primary bushing failures due to installation defects or mechanical strain, secondary bushing leaks due to manufacturer defects or loose flex straps, evidence of partial discharge from DGOA results or from physical evidence such as carbon deposits, and evidence of arcing, again from test results or physical evidence.
Con Edison keeps detailed statistics on transformer failure performance, including the number of removed units by failure category (failed in service, failed during testing, etc.), and statistics about the causes of those failures (corrosion, insulation failure, manufacturer defect, etc.). Con Edison’s largest single cause of transformer failure is corrosion.
By understanding the root cause of transformer failures, Con Edison has increased the number of units removed based on inspection findings, monitored information, and testing results. This has resulted in a significant decrease in the number of transformers that fail in service. For example, transformer-in-service failures went from being the cause of 9% of network feeder lockouts (Open Autos or OA’s in Con Edison’s lexicon) in 2005, to being the cause of only 4% of network feeder lockouts in 2007.
7.5.4.6 - Duke Energy Florida
Maintenance
Failure Analysis
People
Failed equipment identified by field crews is sent to the Standards group for analysis via an informal process. Within Standards, there is a component engineer who may perform forensic analysis on failed equipment to understand failure causes. Performance of the forensic analysis within Duke Energy Florida is dependent on the complexity of the failure and the backlog of work for the component engineer. If Duke Energy is not able to perform the failure analysis, Standards will engage external laboratories to assist with failed component analyses.
Process
While the process or reporting and performing analysis of failed components is informal, Duke Energy Florida does have formal process to communicate findings within the company. For material deficiencies, Duke Energy Florida will issue a Material Advisory to first line supervision to share with direct report field crews. The Material Advisory is a bulletin that describes the material deficiency and any appropriate action(s) for the component.
For events that are related to work methods, Duke Energy has a “Good Catch” reporting process, where work method issues are reported through an electronic mechanism, Plantview. After the “Good Catch” is captured in Plantview and an investigation is performed, findings are shared in the weekly safety communication, “Connection.” The Network Group provided the most “Good Catches” at Duke Energy Florida in 2015, which were identified as work methods issues that were corrected before any network problems resulted.
Technology
Duke Energy Florida has an extensive electronic system for reporting events, Near Misses, Good Catches and recording Events and event details through its PlantView system. PlantView is described in the Safety section of this report.
7.5.4.7 - Duke Energy Ohio
Maintenance
Failure Analysis
Process
When Duke Energy Ohio experiences a splice failure, or cable section failure, they will save the failed section or component, bag it, tag it, and involve the Standards department (Charlotte) in developing next steps.
In some cases they will send it to an external laboratory for forensic analysis. However, Duke Energy does not perform forensic analysis on all failed components.
Technology
Duke Energy Ohio has a laboratory testing facility at Queensgate, in Cincinnati. However, this laboratory does not perform forensic analysis on failed cables or failed cable splices.
Duke Energy Ohio utilizes external laboratories to perform forensic analysis on failed cable and cable splices.
7.5.4.8 - Energex
Maintenance
Failure Analysis
People
Energex has a Network Performance and Maintenance group, responsible for implementing the maintenance and policy standards, and for monitoring the performance of the system. Any failed equipment identified which has been in service greater than two years is sent to this group for evaluation.
The group is comprised of engineers who perform forensic analysis in failed equipment to determine root causes, such as cutting open and analyzing a failed joint. Note that failed equipment which has been in service less than two years is sent directly to the Standards group, as early failures could be indicative of a product issue, rather than a workmanship / aging / or other issue.
Some issues are referred to the Procurement group, especially if workers in the field feel there may be a quality problem with a part or piece of equipment. Procurement then liaises with the vendor to determine if there is a part/equipment quality control problem.
Process
The Network Performance and Maintenance group liaises with the Standards group as necessary. Any workmanship issues are normally shared with the OAC for investigation.
7.5.4.9 - ESB Networks
Maintenance
Failure Analysis
(Cable Forensics/Analysis)
People
ESB Networks has a forensic lab for analyzing failed cables and joints located within the ESB Networks training center in Portloaise. The failure analysis is performed by both the training coordinator within the training facility responsible for UG cables and the Asset Manager for cables and his team.
Process
ESB Networks performs analyses on all failed joints, other than situations already identified, such as cable dig-ins. About 70 percent of all failed joints for any cause end up being analyzed. It is notable that ESB Networks analyzes all failed transition joints. Results of the analysis are summarized in a report, and significant findings are communicated to the field force through bulletins know as Technical Notifications, or TNs.
A noteworthy practice at ESB Networks is interaction among the training coordinator for cables, the asset manager for cables, and the field force (Jointers). This interaction has resulted in close working relationships and good two way communication between the Jointers, engineering and training. As a result of this close relationship, the Jointers do not hesitate to bring information about problems with joints back to “the office.” Trainers noted that they try to help the Jointer understand the science of joint preparation so that the jointers have a better appreciation for the importance of the steps associated with the preparation (see Figures 1 and 2).

Figure 1:
Cable Forensic Analysis

Figure 2:
Joint preparation using ESB Networks specific cut back template
The Training and Asset Management groups have a close working relationship and share the process of performing forensic analysis and preparing summaries. As an example of the effectiveness of these working relationships, the Training and Asset Management groups worked with a manufacturer to include ESB Networks-specific instructions in its cable splice kits. Much of the feedback to customize these instructions came directly from feedback from a field Jointer.
7.5.4.10 - Georgia Power
Maintenance
Failure Analysis
People
Component and cable failures are first analyzed by job supervisors and then turned over to principal engineers in the Network Underground group. If engineers, based on the evaluation of the job site supervisor and their own evaluation, determine that the failure is due to sub-standard equipment or if the company’s standards were not met, then they will work with suppliers and with GPC supervisors and trainers as needed.
Process
Engineers will review failed components and perform a forensic analysis. When they dissect a component, they attempt to involve the crew who installed that component to gain additional information and for the education of the crew. If the analysis reveals a repetitive workmanship issue, the engineer may mandate a training session to resolve any workmanship issues.
Most forensic analysis is performed in-house. In the event a cause cannot be determined, the Network Underground engineers may turn the failed equipment over to the manufacturer or send it to an outside, third-party analysis group, such as NEETRAC (See Figure 1).

Figure 1:
Failed joint
Technology
The Georgia Power Network Underground group has an extensive testing facility at its Atlanta headquarters where failed components, splices, cables and other equipment can be thoroughly examined.
Test Engineers and senior network underground engineers use the facility. The center utilizes the Network Standards that contains specifications on cables, splices, racking, and duct line, vaults, transformers, and virtually every component within the network underground system. The document is kept up-to-date by the Standards Group and is available online and in printed form.
7.5.4.11 - HECO - The Hawaiian Electric Company
Maintenance
Failure Analysis
(600 Amp “T” Body Failure Root Cause Analysis)
People
HECO has experienced failures with 600A “T” body assemblies in their underground system, particularly in water holes, and has embarked upon an extensive effort to identify the root causes and remediate identified issues.
The Technical Services Division within the Engineering Division performs root cause analysis on recurring equipment failures. This group has two engineers that focus on underground asset standards, practices and performance.
Process
HECO has performed forensic analysis on failed T bodies by sending failed samples to external labs, such as NEETRAC or the manufacturer, or CTL, for analysis. Also, through their collaboration with other utilities through EPRI, they have identified utility peer groups to compare and contrast practices associated with T body installations. For example, HECO has compared and contrasted splice practices with Con Edison.
An example contrasting practice is that ConEdison is using a pre -
molded mechanical Y splice rather than a 600 A T body, used by HECO, to
tap a network transformer from a main feeder run. On this Y splice,
ConEdison uses a shear bolt connection, mastic sealant and a heat shrink
sleeve on their flat strapped concentric neutral EPR cable. ConEdison
has a low failure rate with these splices, even in water holes.
Post failure analysis has revealed that at least some of the failures HECO has experienced appear to be a result of installation workmanship issues. For example, in some cases, Cable Splicers may have over tightened the splice inserts (beyond the required torque) resulting in a cracking of the insert itself. Other failures may have been the result of moisture entry into the splice body due to inadequate sealing / taping of the splice.
See pictures below for example failed splice components.

Figure 1:
Example of failed splice components
HECO has taken steps to assure that splice failures due to workmanship issues are reduced. They have re trained the Cable Splicers in proper splicing techniques, have issued splicing guidelines, and have assured that the field crews have adequate tools, such as spanner wrenches for properly torquing the splice inserts.
Technology
HECO has taken steps to assure that splice failures due to workmanship issues are reduced, including issuing proper tools for preparing splices, and training Cable Splicers on proper techniques. (See Separable Connector Installation for a brief description and photographs of a HECO 600 A T body installation.)
7.5.4.12 - National Grid
Maintenance
Failure Analysis
Process
National Grid does perform failure analysis of selected failed components. The person identifying the equipment defect initiates the failure analysis process by completing a Defective Equipment Report form and submitting it to the Standards Department. Information about failed equipment is also provided through the Work Methods representatives.
National Grid has an Electric Operations procedure, EOP UG009, which tracks splice and other equipment failures. In addition, a splice form is required to be filled out by the splicing crew for splices made in conventional duct and manhole systems (not URD). These forms are given to a clerk for database entry.
Engineers within the Standards Department decide which failures are to be analyzed and the method of analysis. This is an informal process administered by standards engineers.
Standards engineers maintain a file of selected received failure reports, and use them to make recommendations for working methods, material uses, project upgrades, standards, and other relevant areas. Engineers also conduct on-site examinations of failures, and collect materials to be sent to one of two National Grid testing laboratories, located in Syracuse NY, and Worcester, Mass. The laboratory analyzes failed equipment and materials, including items such as splices, fire damaged cables or equipment, and insulation (e.g. for water presence). External services are also used by National Grid as required for certain analyses. For example, National Grid may send a failed component to the manufacturer for analysis.
Process
Failures are inspected in the field by standards engineers or on site engineering crews. Field reports and material samples are provided to Standards for a complete analysis at either an internal or external laboratory.
Standards Engineering prepares a failure report describing all of the pertinent details of an incident, including the date, time, location, and equipment involved. The sequence of events is reconstructed, along with a damage report. The goal is to identify the root cause and make recommendations to mitigate the problem in the future. In particular, these reports identify issues with materials, workmanship and construction, standards compliance, and other relevant factors. These can include poor practices by field personnel or cases where company or regulatory standards were likely not followed.
Analysis reports include the following major sections: i) Event Description, ii) Description of Failed Equipment (and any reference material, if needed), iii) Failure Examination / Material Dissection, and iv) Analysis and Conclusions.
i) Event Description
- A discussion of the specifics of the event, including the time since installation, is determined. The detailed breakdown of the sequence of events is presented, along with details of working personnel involved in both the event itself and any inspections conducted subsequently.
ii) Description of Failed Equipment
- The equipment description includes the specific component(s) received for analysis (for example, a splice adapter with two segments of cut cable still attached), the equipment manufacturer and model number, the nature of the damage, age and catalogue numbers if appropriate, and references to instruction and operations manuals.
iii) Failure Analysis and Material Dissection
- A Material Dissection or Failure Analysis goes into detail describing the conditions of the materials and projected reasons for the failure. For example, if instructions for a cable splice were not followed properly, or if other materials appear to have been used incorrectly, this will be discussed. Photographs are taken as needed to document and support the analysis. Indicators such as arc tracks, spots of electrical discharge, and etching can be identified along with a determination of how they were formed. Components in the vicinity of the assumed failure can be tested to see if and how they contributed to the failure. For example, a segment of cable connected to a failed dead break elbow can be tested for insulation failure or treeing.
iv) Analysis and Conclusions
- The goal of the engineering analysis is to identify the reason for the failure, corrective measures that could or should be taken, and any other recommendations that would be useful. If the problem was caused by improper installation, the workmanship issues are identified and reported with a suggestion that they be corrected. If installation has been done properly but an equipment failure was the cause of the problem, a review of that equipment may be suggested. In some cases the engineering analysts recommend that the equipment no longer be used for a particular purpose.
See Attachment C for a sample Failure Analysis Report.
Mitigating or extenuating conditions are important and are discussed in these reports, along with suggestions to avoid future failures. For example, in a fire analysis report from 2009, it was found that the involved 4.16 kV cables were not fire wrapped in the vicinity of the failure. In this case, the failure occurred at the mouth of a duct, where the cables where not wrapped because of proximity to adjacent cable. National Grid initiated a dialogue with suppliers of fire-proofing materials to investigate the development of a new material such as a sealant that can be used as an alternative to fire wrap at duct mouth installations.
Technology
National Grid maintains equipment for performing failure analysis in its internal laboratories.
National Grid also utilizes the services of external laboratories as required.
7.5.4.13 - PG&E
Maintenance
Failure Analysis
Process
Historically, PG&E has used external laboratories to perform failure analysis. At the time of the EPRI practices immersion, PG&E was implementing a laboratory testing facility at their Livermore facility to perform forensic analysis on failed equipment such as cables and splices.
PG&E has a position called Senior Distribution Specialist, assigned to the underground, within the Electric Distribution Standards and Strategy group. This specialist is a subject matter expert, and acts as an interface between the Standards Department and field resources. (See Senior Distribution Specialist for more information). Specialists act as the “eyes and ears” of the Standards Department, and meet with standards engineers every two months to address issues.
The Electric Distribution Standards and Strategy group works closely with the Material Problem Report (MPR) process, a formal process used to report problems with components. This process is also supported by a separate group at PG&E that is responsible for the overall MPR process.
Process
When PG&E experiences a splice failure, or cable section failure, the field crew may save the failed section or component, bag it, tag it, and prepare a Material Problem Report (MPR), which will involve the cable experts within in Standards Department in developing next steps. The crew will make this decision depending on the situation. For example if a very old splice has failed, the crew may decide not to submit the splice for lab analysis.
The Material Problem Report process is a formal method for field employees to communicate material problems to management. When an employee encounters a problem with a piece of equipment, they will complete an electronic MPR form. (A lineman who may not have access to a computer during the day would complete the MPR form of computer returns to the opposite end of the day or ask a clerk to enter the information on his behalf).
For problems with underground equipment, the MPR forms will typically flow to the Senior Distribution Specialist, Underground. The MPR form will ultimately be routed to the individual in the company who is responsible for resolving the problem. The process itself is formal, and includes a requirement to respond to the individual who submitted the form in a prescribed number of days.
For example if the MPR were turned in for a failed splice, this would find its way to the cable standards engineer who deals with splices. This engineer may recommend forensic analysis, which could be performed at an external laboratory, or at PG&E’s Livermore facility, currently being developed.
PG&E noted that they don’t often see MPR forms on major network equipment. Typically when they do, these reports are related to equipment that applies to both network and not network underground such a transition joint.
Technology
PG&E is implementing a laboratory testing facility at their Livermore facility to be able to perform forensic analysis on failed equipment such as cables and splices. PG&E also uses and will continue to use external laboratories to perform failed component analyses.
7.5.4.14 - Portland General Electric
Maintenance
Failure Analysis
People
PGE has a documented process for reporting failed equipment called the Material Failure Reporting Procedure. The procedure defines roles for those involved in the process, including line crews, storeroom personnel, standards engineers, Distribution Engineers, and supply chain personnel.
Standards engineers coordinate failure analyses with a PGE Special Tester, a PGE lab technician, the manufacturer, a third-party tester, or a combination of these parties.
PGE CORE has a Special Tester position, who is a journeyman lineman with additional training and technical skills. The tester is an expert on network protectors within the organization and also works to resolve equipment problems. The Special Testers support the network department, and one individual is embedded with the network CORE group.
Although PGE has its own testing lab, it is no longer fully staffed and most failed components are tested externally by external laboratories and manufacturers. One major example is cable failures, which are sent to a third-party testing facility.
Process
PGE has a process for reporting equipment failures and prioritizing repairs. Its overarching philosophy for the network is to make immediate repairs. When urgent attention is needed for a manhole/vault, a repair and maintenance crew is dispatched as soon as possible.
For forensic analysis of failed components, PGE follows a material failure reporting process, fully documented in the Material Failure Reporting Procedure. The document includes the specific actions that an employee must take when encountering a faulty piece of material/equipment, and also lays out the forensic analysis process. The Standards Department periodically provides training to field line operations on the reporting process. See Construction – Equipment Failure Reporting for more information about this process.
Third-party laboratories or the manufacturer perform most of the analysis of failed components. Where possible, PGE seeks a refund or replacement for materials and components under warranty.
Once the failure analysis is completed, the resolution is shared with Distribution Engineers, line crews, and safety representatives. A TechNote article, Material News Alert, or other method communicates summaries of the findings, and the material failure is recorded in a Material Failure Database.
7.5.4.15 - SCL - Seattle City Light
Maintenance
Failure Analysis
Process
SCL is currently developing a process for following up on poly splice failures with a laboratory analysis.
Technology
SCL uses various types of splices including lead splices, heat-shrink splices, and cold-shrink splices. The majority of splices they use (80%) are heat-shrink, hand-taped splices. Less than 8% of their splices are lead. SCL prefers the heat-shrink splice to the cold-shrink splice, because they have had a low failure rate with heat-shrink splices.
Most of the splice failures they do experience are with poly splices. They have had very little failure of their lead splices.
7.5.4.16 - Survey Results
Survey Results
Maintenance
Failure Analysis (Cable, Transformers)
Survey Questions taken from 2018 survey results - Asset Management survey
Question 20 : Do you track cable and equipment failures?


Question 21 : If you track equipment failures, which of the following do you track?


Question 25 : Please describe your failure investigation process. Include a description, if applicable, of what drives corrective actions.

Survey Questions taken from 2012 survey results - Maintenance
Question 6.32 : Are you currently implementing replacement programs for any of your network equipment?

Question 6.33 : If Yes, Please indicate which equipment is being replaced.

Survey Questions taken from 2009 survey results - Maintenance
Question 6.38 : Are you currently implementing replacement programs for any of your network equipment?

Question 6.39 : If Yes, Please indicate which equipment is being replaced.


7.5.5 - Hot Phasing
7.5.5.1 - CEI - The Illuminating Company
Maintenance
Hot Phasing
People
“Hot phasing” is the process of bringing two hot cables together and use a phasing set to determine the proper phasing (match the phasing).
Hot phasing is performed by the UG Electricians of the Underground Network Services Department.
Process
Hot phasing is used often used where CEI is going to install a splice and is unable to change the phasing (roll phases) at the source. This is often the case when the cable originates from a 5kV oil switch where the phase rotation is set and cannot be changed. Also, the CEI has no standard phasing convention for their 5kV system. This requires the UG electrician to determine the proper phase order to prepare the splice.
After the faulty cable section has been removed, the three conductors that will make up each end of the splice are spread apart, and the cable stripped to the insulation (jacket, neutral, and semicon removed. CEI will then energize the conductors on one side of the splice in order to utilize the Hot Phasing Identifier tool.
The device utilizes CT’s that are placed on each leg of the cable attached to leads that connect to a phasing set situated above the ground on a dielectric blanket.

Figure 1:
PILC Cables with phasing set leads attached (yellow)

Figure 2:
EPRI cables with phasing set lead attached (black)

Figure 3:
Phasing Set on Dielectric Blanket

Figure 4:
Phasing Set
Each lead running from the phasing set to the conductor leg has a phase marker placed on it that is slid down to mark the conductor phase after it is determined.

Figure 5:
Phase marker – slid down black cable to identify correct leg

Figure 6:
Phase markers
Technology
A Phasing Identification set is a tool used to determining the phasing of the legs of a feeder. CEI utilizes a remote phasing set, with leads running from the unit positioned outside of the manhole, down to the individual conductor legs.


Figure 7 and 8:
Phase Identifier
7.5.6 - Manhole Inspection - Maintenance
7.5.6.1 - AEP - Ohio
Maintenance
Manhole Inspection - Maintenance
People
Manhole inspections are performed on a four-year cycle, as well as in conjunction with the inspection of network equipment (normally, on a one-year cycle). Inspections may be performed by Network Mechanics, Network Crew Supervisors, and contractors. Contractors are used to make civil repairs identified through inspection.
Process
Manhole inspections include a visual inspection, cleaning of the vault, and tonging secondary cables to assure cable limiter continuity. More specifically, inspections include:
-
Clean manhole and drains.
-
Check for spalling or deterioration of concrete.
-
Check condition of manhole cover.
-
Check for contact voltage on manhole and ring before and after entering.
-
Inspect cable, racks and ties (tag as needed).
-
Inspect primary cables for any abnormalities (swelled or leaking splices, cracks, cuts, burns, etc.).
-
Check limiters.
-
Take load readings on mains larger than 350 and services larger than 4/0
-
Check manhole identification number (replace numbers as needed).
-
Check fireproofing on all cables and splices.
-
Check condition of ground connections.
-
Check termination insulation and waterproofing.
Inspectors record conditions and note any required follow-up activities. See Attachment D for a copy of the manhole inspection form. Note that manholes are also inspected as part of the regularly scheduled network protector and transformer inspection schedule (yearly). Repairs of corrective maintenance issues identified are performed based on a prioritization of the findings.
Most deteriorated manhole structures are repaired by replacing the manhole top. Some are repaired by pouring the bottom section according to specifications, then using precast middle and top sections. These civil repairs are performed by a contractor.
Technology
Crews use a modified bread truck for inspections, which includes vacuum equipment for pumping out any water in manholes. A practice of note is the organized and well-equipped features of these trucks. AEP Ohio has configured and modified these trucks to their own specifications (see Figures 1 and 2).

Figure 1:
AEP Ohio 'bread' truck with easy-access, low tailgate

Figure 2:
AEP Ohio 'bread' truck – interior view
Crews have computers in every truck. Printed and online forms are available. Conditions of the manhole are captured in the AEP NEED (Network Enclosure and Equipment Database). When information is entered into NEED, repair or replacement priorities are noted.
AEP Ohio performs an inspection using infrared thermography (IR) every time a worker enters a vault (see Figures 3 and 4). This inspection is being performed as a manhole entry safety practice and has been in place for about five years. IR cameras are used to identify hot spots in the vault, with inspectors “shooting” joints, crabs, and cables. The rule of thumb for action is if a spot on a joint, for example, shows a difference of 40 degrees C or more, then crews will replace the joint. AEP Ohio employees noted that early on, they identified and rectified problems, but that now, they rarely encounter hot spots.

Figure 3:
AEP Ohio Network Mechanic using infrared camera

Figure 4:
Infrared camera
7.5.6.2 - Ameren Missouri
Maintenance
Manhole Inspection - Maintenance
People
Ameren Missouri inspects manholes on a four year cycle, comporting with a Missouri PSC requirement. Inspections are performed by two person contractor inspection crews.
A supervisor within Ameren Missouri’s Resource Management group is responsible for oversight of the contractors performing the manhole inspections.
Ameren Missouri has developed and delivered a training manual for the contractor that guides the manhole inspection process. This document includes instructions for addressing emergency situations, work area and personal protection, and for conducting a visual inspection of the manhole including the lid & ring, ceiling, walls and floor of the manholes. (See Attachment G)
Process
Ameren Missouri provides plat maps associated with the manholes to be inspected in a given year to the contractor at the beginning of the year. The contractor inspectors utilize the plat maps to establish their inspection routes and locate manholes. They divide the territory into sections and distribute the work among their inspectors. In general, the contractor attempts to get to the older manholes where they expect a higher number of problems earlier in the year so that they can identify those problems as early as possible.
The contractor will send one person out in advance to scout the hole to be inspected to find its location, and to assure that it is at street level. In some cases where manholes may be paved over, the contractor may use ground penetrating radar to locate the manholes.
The manhole inspections are performed by two man inspection crews using a video camera that is lowered into the manhole. (In cases where water must be pumped out of the manhole, they will use a three man crew). Inspectors use the video camera to perform a visual inspection without having to enter the manhole. The visual inspection is performed by looking at hand held monitors. At the time of the practices immersion, Ameren Missouri was considering adding the performance of infrared inspections to their manhole inspection program.
Ameren Missouri has a well defined manhole inspection / repair process for performing manhole inspections that includes guidance for inspectors for action based on inspection findings. For example, non emergency electrical issues identified by inspection are forwarded to the UG Construction department who creates a corrective maintenance order (DOJM Job) that is scheduled for repair. Structural findings are forwarded to the Civil and Structural Design group within Energy Delivery Technical Services for scheduling and repair. See Attachment E for a flow diagram of the Ameren Missouri Manhole Inspection / Repair Process.
Findings are recorded by the contractor on tough books into a Circuit and Device Inspection System (CDIS). The contractor provides a report that summarizes the findings. The CDIS utilizes an algorithm that assigns a “structural score” and an “electrical score” based on the inspection findings and weightings for various findings developed by Ameren Missouri. The scores are used to prioritize remediation.
CDIS is also used to produce reports that summarize inspection findings and a dashboard that monitors inspection progress. See Attachment F and Attachment H for a sample of the Ameren Missouri project dashboard for the manhole inspection program, and a sample of the inspection finding report provided by the contractor.
Technology
Information from inspections of network manholes vaults and service compartments (adjacent manholes with bus work) is recorded on laptops (tough books).
Ameren Missouri includes the taking and recording of photographs of manhole and vault infrastructure as part of its inspection programs.
The contractor vehicle is a half ton survey truck with a camper shell and a 100 foot cable for the camera.
The contractor who is performing a manhole inspection utilizes a camera that is attached to a tripod positioned above the hole and is lowered into the hole from the top. The visual inspection of the infrastructure within the manhole is performed by using this camera.
Distribution service testers who are performing vault inspections take photographs while in the vault.

Figure 1:
Contractor Vehicle and Camera Tripod

Figure 2:
Camera Tripod
7.5.6.3 - CEI - The Illuminating Company
Maintenance
Manhole Inspection - Maintenance
People
CEI has one Underground Network Services Center responsible for performing preventive maintenance and inspections of the underground, including the networked secondary and non network ducted conduit systems. The service center is comprised of Underground Electricians who inspect and maintain the underground system.
Process
Manholes are inspected and maintained on a five year cycle. This includes both network and non-network manholes. CEI develops a schedule that indicates the number of units to be inspected and maintained each month.
The manhole inspection is comprehensive, including inspecting and recording the “as found” and “as left” condition of the manhole itself and all equipment contained therein. This includes:
-
Manhole condition, including cable racks and arms, ladders, etc.
-
Cable bonding and splice condition
-
Cleaning and debris removal
-
Oil switch condition
Inspectors are to take amperage readings of secondaries on the load side of cable limiters to assure cable limiter continuity. In practice, this is sometimes done, and sometimes overlooked.
Non urgent corrective maintenance actions that are identified during inspection are put into a folder to be performed the next time a particular feeder is out of service. This is consistent with the approach used by many utilities.
Technology
Manhole inspection results are recorded manually on the manhole inspection sheet. See Attachment L
Note: Manhole inspections do not include the infrared thermography. Inspectors will take temperature readings with a temperature “gun” only if something is suspected to be running hot.
7.5.6.4 - CenterPoint Energy
Maintenance
Manhole Inspection - Maintenance
People
Distribution Manhole Inspections are performed by the Cable group within Major Underground. The Major Underground organization includes Key Accounts, Engineering and Design resources, Support Services, and the field force responsible for all construction, operations and maintenance activities. The field force is divided into two main groups, the Relay group and the Cable group.
Both the Relay group and Cable group perform maintenance and inspection activities. The Relay group focuses on most of the non cable equipment inspection and maintenance, including performing vault equipment inspections, network protector testing, and other inspections and maintenance on devices with relays or motor operators. The Cable group focuses on manhole inspections that include inspections of cable, cable accessories and major equipment.
The Cable group is comprised of Cable Splicers. These field resources report to Crew Leaders, a non bargaining unit position at CenterPoint. The Cable group is led by two Operations Managers.
CenterPoint does not have dedicated maintenance crews. Rather, maintenance and inspection work is assigned to crews based on work priorities and resource availability.
Process
The Cable Splicers within the Cable group perform manhole inspections on either a 1, 5, or 10 year cycle, depending on the manhole priority. At locations where there are dedicated UG circuits (meaning three phase circuits that are entirely underground), the manhole inspection frequency is yearly.
Manhole inspections include a visual and infrared inspection. At some locations, the Cable Splicers will take load readings.
CenterPoint is using an inspection checklist to guide inspectors through the various items included in the inspection. This same checklist, entitled MUDG Functional Location Inspection Sheet is used to record findings from all inspection types. An inspection sheet is completed for every location inspected.
Inspection findings that require follow up corrective maintenance are noted and recorded by the Crew Leaders who schedule this work for completion. If the solutions to the findings require the involvement of other groups, the Crew Leaders will solicit their help. For example, corrective maintenance activities that require a customer outage will require the assistance of the Key Accounts group to coordinate with the customer to schedule the outage.
The inspection sheets are filed by work center (each manhole location is considered a work center), so that CenterPoint has a record of the historic findings.
Technology
Manhole inspection results are recorded manually on the MUDG Functional Location Inspection Sheet See Attachment I.
Manhole inspections include the performance of infrared thermography.
7.5.6.5 - Con Edison - Consolidated Edison
Maintenance
Manhole Inspection - Maintenance
People
Field Engineering Group
Con Edison has a field engineering group consisting of 40 individuals who perform a variety of quality-assurance-related tasks including:
-
Inspections/manhole inspections
-
Post-construction inspections to determine to adherence to specifications
-
Safety inspections
-
Critical manhole inspections, performed in any manhole on the immediate block of a substation, and inspected on a three-year cycle
-
Regular manhole/vault inspections, scheduled every five years
-
Infrared inspections of transformers/network protectors/substations
-
Infrared is a four-year cycle for 277/480-V installations.
-
Infrared is not programmatic, but is performed randomly, or by exception at 120/208 V. Infrared inspections are performed more frequently at sensitive customer locations such as hospitals and museums.
-
Substation infrared is annual.
-
Use strategically placed site glasses to obtain infrared views of some locations.
-
Use outside contractor to perform infrared training.
-
-
Cable and Joint failure analysis specimen retrieval and tracking
-
Fill-in work, special requests
-
Check out erroneous readings monitored through the RMS system
-
Map verification; that is, comparing what is on the mapping system to what is in the field
-
Random spot checks, focused on workmanship
-
Random equipment checks
- For example, the Field Engineering group performs random monthly spot checks of primary splice packs to be sure that the kit is complete.
-
Respond to voltage complaints
Note: This group does not routinely inspect design versus build, or as-built versus mapped.
The department is made up primarily of Splicers. People are chosen for jobs in the department by seniority.
Process
Inspection and Maintenance
Con Edison performs periodic maintenance and inspection of network distribution equipment, including network feeders, transformers, network protectors, grounding transformers, shut and series reactors, step-down transformers, sump pumps and oil minder systems, remote monitoring system (RMS) equipment, and vaults, gratings, and related structures.
Con Edison’s approach to performing an inspection is to inspect all the equipment and structures associated with a particular vault ID at a location regardless of category or classification, and even if the particular equipment associated with a particular vault ID resides within different compartments (for example, a transformer and network protector may be located in separate physical compartments even though they both share the same vault ID). This type of inspection is referred to as a CINDE Inspection, based on the name of their maintenance management system (Computerized Inspection of Network Distribution Equipment).
Con Edison performs inspections energized; crews do not take a feeder outage to perform inspections, perform pressure drop testing, or take transformer oil samples. Con Edison does not routinely exercise feeder breakers.
In an effort to more efficiently use their resources, and when nonpriority conditions allow, Con Edison takes advantage of situations where they have to enter a vault or manhole for a reason other than a scheduled inspection, and perform a nonscheduled inspection while they are in the vault. When the record of this nonscheduled inspection is recorded in CINDE, the system “resets the clock” for the next inspection date.
Network equipment at 208 V is generally inspected on a 5-year cycle. 460-V facilities, sensitive customers, facilities in flood areas, and other more critical locations are inspected more frequently, often annually. Con Edison establishes network equipment inspection cycles depending on two factors: the inspection category and the inspection classification .
The inspection category refers to the type of inspection, and includes a Visual Inspection, a 120/208-V Test Box Inspection, and a 460-V Test Box Inspection. The Visual Inspection includes activities beyond visually assessing condition and recording information, such as pressure drop testing and taking transformer oil samples. The test Box inspections involve specialized testing of network protectors with the network relay installed. Note that all of the elements of a Visual Inspection are performed along with the Test Box Inspections.
The inspection classification refers to characteristics of the inspection site that dictate the inspection cycle. For example, a “Routine” 208-V vault is visually inspected on a 5-year cycle, while a 208-V vault located in a “tidal” area would be visually inspected annually. Con Edison considers the following classifications in determining inspection cycles:
-
Routine
-
Back-feed: banks installed on a feeder involved in a back-feed incident
-
Candidate for Replacement: commonly due to corrosion damage
-
Essential Services: critical customers
-
Flooded Bank: nonsubmersible equipment that has experienced high water levels
-
208-V Isolated Bank: units that require more frequent inspection than distributed secondary grid units
-
Remote Monitoring System(RMS), Non RMS, Unit Not Reporting (UNR): Con Edison varies inspection cycles based on the level of remote monitoring installed
-
Tidal, Water, and Storm Locations
Note that Con Edison requires employees to perform at least a quick visual inspection (QVI) anytime an individual enters a network enclosure, even if the reason for entering an enclosure does not warrant a CINDE Inspection. This type of inspection (QVI) differs from the CINDE inspection category of Visual Inspection described above, in that it is not a full, accredited inspection.
“Cut and Rack” Manholes
In the course of performing work, such as reinforcing secondary networks, or responding to a burnout, Con Edison crews periodically encounter manholes where they identify a need to reconfigure the facilities in the manhole to improve their safety, operability, and long-term reliability. These facilities are reconfigured by cutting and re-racking facilities within the manhole, referred to as a “Cut and Rack.”
This practice is noteworthy in that it demonstrates Con Edison’s ongoing commitment to investing in infrastructure to improve operations, reliability, and worker safety.
Technology
Inspection and Maintenance Software
Con Edison uses legacy maintenance management software called CINDE, which is an acronym for Computerized Inspection of Network Distribution Equipment. CINDE is a system that records inspection data and initiates inspections based on predetermined cycles. These cycles depend on the category of inspection (for example, a visual inspection versus a “Test Box” inspection) and various predetermined classifications of inspections (for example, a “Routine” 208-V vault is visually inspected on a 5-year cycle, while a 208-V vault located in a tidal area is visually inspected annually).
Con Edison inspectors record inspection data on hand-held devices (Tough Books). The utility requires that the inspection data be downloaded into the CINDE – Mainsaver system (Mainsaver is the part of the CINDE system used to record data) within three days following the inspection. Inspection data that is entered into the CINDE system includes:
-
Equipment serial numbers
-
As-found and abnormal conditions, such as transformer oil level, state of corrosion, and water in the vault
-
Defective equipment or structures
-
Repairs or change-outs undertaken
-
As-left condition, such as transformer pressure and liquid level, and pressure of housing
The CINDE – Mainsaver system is also used by Con Edison to prioritize follow-up work, or outstanding defects to be corrected that are identified through inspection or other visits to network enclosures. The Electric Operations Region is responsible for prioritizing follow-up work by considering the location of the work with respect to risk to public safety, reliability impact, the type of installation, age of the outstanding defect, and the efficient use of resources.
7.5.6.6 - Duke Energy Florida
Maintenance
Manhole Inspection - Maintenance
People
Manhole inspections are performed by craft workers, Network Specialists and Electrician Apprentices, within the Network Group, part of the Construction and Maintenance Organization. The Network Group is led by a supervisor, and consists of ten craft workers, five Electric Apprentices and five Network Specialists (the journey worker position).
Duke Energy Florida’s construction and maintenance organization is divided into regions, with both Clearwater and St. Petersburg falling within their South Coastal Region. The Construction and Maintenance organization for the South Coastal Region is led by a General Manager.
The Network Group is organized functionally, and has responsibility for construction, maintaining and operating all urban underground infrastructure (ducted manhole systems), both network and non-network, in both Clearwater and St. Petersburg.
Process
Manholes are inspected on a five-year cycle in both Clearwater and St. Petersburg. Duke Energy Florida employees noted that because of the small size of the network infrastructure in Clearwater, they do enter manholes rather frequently for various reasons – often more frequently than the five-year inspection cycle.
Manhole entry procedures, detailed in the Manhole Entry section of this report, include the establishment of work area protection, the obtaining of a “Hot line” clearance which changes the instantaneous trip setting of substation relay to a fast trip (6 cycles, rather than the normal 30 cycles), continuous air monitoring, installation of a rescue apparatus over the manhole opening, and tethered workers.
Duke Energy Florida has high confidence in their manhole drawings. The drawings, which are maintained by the Network Group, are available to field crews on-line, and can be printed from truck mounted printers. The Manhole Drawings contain detailed information about the manhole configuration, including dimensions and components. See Attachment E.
The manhole inspections include a visual inspection of all electrical facilities and assessment of the condition of the civil infrastructure. Inspections include mapping updates to assure that the maps are accurate. Inspections also include load checks to ensure cable limiter continuity. The inspection scope is detailed on Attachment H.
Information from the inspection is recorded on an inspection form, including an assessment of the priority or severity of the finding. See Attachment H . Information from the inspection is entered into a computer system, and the hard copy form is maintained in a file. Duke Energy Florida has a “Further Work Ticket Process” which is initiated to pursue remediation for corrective maintenance items identified by inspection. The repair schedule is dictated by the priority of the finding.
Technology
Duke Energy Florida is investigating the application of self -ventilating manhole systems, though hadn’t installed any at the time of the practices immersion. Duke Energy Florida has begun a manhole lid retrofit program with 40 installations of East Jordan technology scheduled for 2016.
Duke Energy Florida is not performing infrared inspections as part of their manhole inspections. However, they have recently implemented a policy to perform an IR inspection as part of the manhole entry process in advance of performing work in the manhole.
7.5.6.7 - Duke Energy Ohio
Maintenance
Manhole Inspection - Maintenance
People
Duke Energy Cincinnati has implemented a manhole inspection program on a six year cycle. The inspections are performed by Dana Avenue field crews, who record findings on either an Excel form or a lap top computer.
In practice, Duke Energy Ohio is able to inspect about 250 manholes per year. They are currently working to expand that number to 400 manholes per year.[1]
Duke Energy Ohio does not vary its inspection cycle based on an assessment of the manhole criticality (high risk holes versus low risk holes).
Process
Crews utilize Cable and Conduit (C&C) maps as part of the inspection and compare the information shown on the map with what they encounter in the manhole. The maps do not always accurately reflect what’s in the field. Also, inspections occasionally reveal additional manholes not shown on the maps. (This is particularly true in the suburban areas.) Correction and update of the C&C maps is one of the outcomes of the manhole inspection.
Manhole inspections include a visual inspection of the manhole looking for evidence of network burnouts, racking issues, roof issues, grading issues, leaks, swollen splices, etc. Note that thermal readings are not presently being done as part of a routine manhole inspection.
Crews utilize a checklist, which is an Excel form (either paper or on a lap top). Crews also utilize a digital camera, taking pictures of any issue identified during inspection. This enables Duke to review and discuss the findings of the inspection to recommend remediation.
As inspection crews identify potential structural issues, they will normally revisit the manhole accompanied by a civil contractor who can recommend remediation. On occasion, safety professionals are included in the inspection to help prioritize the repairs based on safety. Should structural repairs be required, this may initiate a capital rebuild of the manhole.
Duke’s most commonly encountered findings include roof issues, racks off the wall, and leaking splices.
Electrical repairs are prioritized by the crews and Dana Avenue supervision in conjunction with the Network Engineer. Duke does not have a written guide for prioritizing repairs. Rather, repair priority is driven by the experience of Dana Avenue personnel. In general, any deformation of a splice (swollen or bulging, for example) is treated as a priority.
Structural issues with manhole roofs are a high priority, with Duke rebuilding about 25 manholes per year. Maintenance issues identified in these holes will be addressed as part of the manhole rebuild.
Repair schedules are driven by priority and are often customer driven. Work in downtown Cincinnati must be scheduled between 9 and 3:30 to comply with City requirements.
Technology
Duke Cincinnati has 3418 manholes on their system.
Manhole Inspection Sheets are presently created in Excel. See Attachment F for a copy of the manhole inspection sheet. Duke will shortly be implementing an Emax system, which will make inspection forms available on line.
Inspection findings are recorded by crews either onto the forms or directly into the Excel form using lap top computers. Inspection findings are recorded in Excel and kept in a manual file by the Network Engineer.
Duke is planning to expand its manhole testing to include the use of an infrared camera to identify hotspots.
[1] Having a total of 3418 manholes, Duke will ultimately need to inspect approximately 570 manholes per year to adhere to a six year cycle.
7.5.6.8 - Energex
Maintenance
Manhole Inspection - Maintenance
Energex is not performing routine pit (manhole) inspections.
7.5.6.9 - ESB Networks
Maintenance
Manhole Inspection - Maintenance
7.5.6.10 - Georgia Power
Maintenance
Manhole Inspection - Maintenance
People
Depending on availability, manhole inspections are performed by Senior Duct Line Mechanics or Senior Cable Splicers and a supervisor, who report to the Maintenance supervisor, within Network Operations and Reliability. Although the Georgia Power Network Underground group does not have specific crews assigned to manhole inspections, the Maintenance group will pull available crew members to maintain its inspection schedule for manholes.
Process
Manholes are inspected on a six-year cycle throughout the state of Georgia. Prior to inspections, the supervisor uses an Access database program to generate a blank form already populated with some specifics about the configuration of the particular manhole or vault to be inspected if a crew has filled out the information during construction or during a previous inspection. The printed inspection form does not have previous findings pre populated, assuring that the field crews must perform and record an updated inspection. Appropriate crews and maintenance trucks are dispatched to the field (See Figure 1 and Figure 2). Once completed, the form is populated into the Access system. Forms are retained in hard copy for seven years.

Figure 1:
Typical truck used by inspection and maintenance crews

Figure 2:
Truck used for manhole cleaning
The inspection form has a well-organized checklist of items that must be inspected, including sections that deal with:
-
Initial inspection of overall condition (water in the hole, cleanliness)
-
Structural Inspection, including inspection of the manhole cover, neck, floor and wall condition, racking, ducts, etc.
-
Electrical equipment inspection of secondary / street mains
-
Electrical equipment inspection of primary facilities including cable and splice condition.
(See Attachment A )
Nearly 20 percent of all inspections occur outside the Atlanta metro area in other regions where Georgia Power has network underground installations. In the Savannah network, designed with cable limiters, inspectors routinely tong the secondary cables to check for cable limiter continuity.
If work needs to be performed, the supervisor of the crew determines whether the maintenance can be performed on-the-spot; otherwise, a maintenance work order is sent in by the supervisor, including notes and a prioritization of the maintenance. It is up to the supervisor to determine how critical the maintenance or repair is, and the inspection form reflects the priority, as well as direct communication with the appropriate workgroup within the Network Underground.
Georgia Power’s Operation and Test procedure for Manhole and Vault Maintenance specifies three levels of priority for inspection times. The procedure does not specific time frames for completion of corrective maintenance.
Priority # 1 - the most urgent, and requires immediate attention
Priority # 2- needs attention very soon
Priority # 3- needs attention when it can be scheduled
Technology
When a supervisor enters inspection information into the Access database, and the inspector(s) indicates that something needs repair, the system will create a maintenance order automatically. Inspectors only need to fill in what is required, such as a structural repair or manhole cleaning. The inspector receives a monthly report of the pending corrective maintenance jobs.
Where possible, the inspection information can also be entered into the DistView software system. With DistView, inspectors can log onto the company intranet with a wireless laptop and enter data about inspections into pre-determined fields and also add notes as findings are top-of-mind at the site and time of the inspection.
Georgia Power does not perform an infrared inspection as part of its routine manhole inspection. However, infrared thermography is performed at high profile locations.
Georgia Power does not routinely take and record photographs of inspection findings.
Georgia Power is piloting the use of secondary cable load monitoring in selected manhole locations in Savannah.
7.5.6.11 - HECO - The Hawaiian Electric Company
Maintenance
Manhole Inspection - Maintenance
People
HECO Substation resources perform maintenance and inspection of network equipment.
HECO currently is not performing any programmatic inspection and maintenance of their non-network underground facilities.
Process
Network system preventive maintenance and inspection programs include:
| Program | Cycle or other Trigger |
| Manhole Inspection, including amp readings of molimiters. | Annual[1] |
| Network Vault Inspection | 2-3 years – inspected during transformer and NP maintenance |
| Network Transformer Maintenance (Includes Oil Sampling and Pressure Testing) | 2-3 years |
| Network Protector Maintenance | 2-3 years |
Non urgent corrective maintenance actions that are identified during inspection are put into a folder to be performed the next time a particular feeder is out of service. This is consistent with the approach used by many utilities.
[1] HECO’s desired schedule is to perform these inspections and take amp readings annually. In practice, they have not adhered to this schedule.
7.5.6.12 - National Grid
Maintenance
Manhole Inspection - Maintenance
People
Network manhole inspections in Albany are performed by the UG field resources (network crews) that are part of Underground Lines East. This group is led by a Manager, and includes a group focused on civil aspects of the underground system and a group focused on the electrical aspects. The Underground Lines group is responsible for both the network and non – network infrastructure in eastern NY, including the Albany network.
The Electrical Group, comprised of Cable Splicers, Maintenance Mechanics, is led by three supervisors. Maintenance Mechanics perform network vault inspections and maintenance of network equipment contained in the vaults such as transformers and network protectors. Cable Splicers work with cable and cable accessory installation and maintenance, including cable pulling and splice preparation. Cable Splicers are also responsible for performing manhole inspections.
In addition, National Grid has a company-wide Inspections Department, led by a manager, responsible for completing regulatory required inspection programs. This group consists of supervisors assigned to the National Grid regions, and a union workforce to perform routine inspections. Note, however, that network manhole inspections within Albany are performed by two- person Cable Splicer crews from Underground Lines East.
National Grid does not use dedicated full time maintenance crews; rather, they schedule maintenance as a work assignment along with other work types.
Process
Regulatory mandates in the State of New York require National Grid to inspect their distribution plant on a five-year cycle. Network manholes comport with this requirement, and are thus inspected on a five year cycle. (Note that network vaults are inspected annually.)
Manhole inspections include a visual inspection of the both the civil and electric condition of the manhole. All separable connections are checked with an infrared thermometer. Inspectors also confirm the use of fireproof tape on cables, a standard at National Grid.
National Grid is also performing elevated (stray) voltage testing using hand held E-field directional testers of all manhole locations on an annual basis. National Grid is using contractors to accomplish this testing. (Stray voltage testing is mandatory in New York in cities with populations over 500,000; National Grid is performing this testing in Albany)
National Grid has developed an Electrical Operating Procedure (EOP) which provides guidelines for prioritizing issues identified during inspection for repair. This EOP provides guidance to the inspectors as to how to categorize certain findings. The inspector is free to “upgrade” the severity of the finding based on his field assessment. For example, the guidelines may indicate that a leaking joint should be a “Level 2”. The inspector may elect to upgrade to a “Level 1” based on field conditions.
Various turnaround times for repair are specified depending on the categorization.
Level 1: Emergency - must be made safe within 7 days.
Level 2: One year
Level 3: Three year
Level 4: Information purposes only
These levels were developed by asset and engineering groups based on past history and basic knowledge. Note that except for emergencies (Level 1), inspections are not repaired immediately but are reported so that the inspection process can stay on task.
Inspection information is entered directly into a hand held device using Computapole software. A work order to perform follow up corrective maintenance can be generated by the interface between Computapole and National Grid’s STORMS work management software (See Technology, below).
Technology
Crews use handheld devices (Symbol Units, part of Motorola) to record inspection information. This unit has the required inspection information built into it, and a mapping feature. It also contains the most up-to-date system data and previous inspection results. Appropriate codes for the inspection are entered directly into the unit and returned to the supervisor for entry into the computer database. These codes alert GIS of changes in the field.
Computapole is a mobile utilities software platform that runs on handheld devices and is customized to meet National Grid’s specific needs. Computapole is used for inspections and mapping functions on handheld devices. Once information is entered in the Computapole system, work is managed by an interface with STORMS (below) to create work requests.
Severn Trent Operational Resource Management System (STORMS) is National Grid’s work management system. The work management system includes tools to initiate, design, estimate, assign, schedule, report time/vehicle use, and close distribution work. Computapole sends inspection information to STORMS to create work requests as needed.
Inspectors do not take photographs of condition issues identified during inspection.
National Grid Underground does not routinely use duct line cameras. In specific incidents in the past (blocked ducts or stuck cables), the Underground Department has had the National Grid Gas Department or contractors use duct line cameras. .
7.5.6.13 - PG&E
Maintenance
Manhole Inspection - Maintenance
People
PG&E has implemented a manhole inspection program on a three year cycle. The inspections are performed by UG inspectors who are part of the Compliance Department, within the M&C Electric network organization. The Compliance Department performs and reports on regulatory required inspections and patrols (CPUC GO 165) of distribution infrastructure.
The UG Inspector position is typically filled with former journeyman cable splicers.
PG&E has good documentation of the procedures for performing underground equipment inspections contained within their Electric Distribution Preventive Maintenance Manual.
Process
UG Inspectors utilize Route Sheets and Duct Maps when performing inspections. Inspectors also utilize an underground inspection job aid form that lists the types of abnormal conditions that must be recorded. Manhole inspections include a visual inspection of the manhole looking for evidence of network burnouts, racking issues, roof issues, grading issues, leaks, swollen splices, etc.
PG&E performs infrared inspections as part of the manhole inspections. They have established guidelines for assisting inspectors in determining the corrective maintenance priority based on the measured temperatures and temperature differentials.
Corrective maintenance items result in the creation of an EC Tag (or EC Notification[1] ), which must be prioritized and scheduled for repair by the M&C Electric network group. Lower priority EC notifications may be grouped by feeder, and competed during a scheduled feeder outage.
Technology
Inspectors will take photographs of condition issues identified during inspection, including thermal images revealed through IR testing, and save them as part of the EC notification. Note that PG&E does not use duct line cameras.
[1] The EC Notification is an SAP created blanket order for performing corrective maintenance.
7.5.6.14 - Portland General Electric
People
Manhole inspections on the network are the responsibility of CORE group. The CORE group, which is a part of the Portland Service Center (PSC), focuses specifically on the underground CORE, including both radial and network underground infrastructure in downtown Portland. Its responsibility includes inspection and maintenance of the network infrastructure, including manholes. An Underground Core Field Operations Supervisor leads the CORE group. This supervisor reports to the Response & Restoration Area Line Manager (ALM).
The typical underground crew consists of three people: two journeymen and a non-journeyman helper. The foreman, who is a qualified cable splicer, is one of the working journeymen on the crew. The two journeymen typically perform the work inside the manhole or vault while the helper, typically a non-journeyman classification, usually stays above ground, carrying material and watching the barricades and street for potential hazards.
Process
PGE attempts an annual inspection for general-purpose structures such as manholes, though manpower availability determines the exact cycle. At the start of every year, general work orders for inspection of manholes are created in Maximo for a particular geographical area, with each work order covering the manholes in a one- or two- block area. A crew receives these work orders and is expected to perform inspections when lacking customer work. If there is little customer work on the network, inspections can be completed for all non-equipment manholes and vaults within a calendar year.
PGE employees, not contractors, perform all inspections of manholes, including both an electrical and civil (structural) review. Inspections also include a visual inspection to identify leaks, assess vault cleanliness, etc., and may include the use of infrared (IR) thermography at the discretion of the inspection crew. As part of the inspection, crews clean the manhole.
PGE does not perform routine, periodic inspections of duct lines. If a crew notices damaged ducts during vault inspections, they may be inspected with a duct camera.
Crews may take load readings on the secondary system to try to identify open limiters when inspecting vaults. Because some of the secondary feeders are difficult to access, this continuity testing is restricted to accessible secondary feeders.
PGE does not use a formal inspection sheet for manhole inspections, although a crew completes a Field Action Report if it finds issues for follow-up corrective action. If no action is needed, crews do not fill out any paperwork and the completion of the inspection is noted in Maximo.
If a crew is able to repair a problem without the need for engineering or design services, such as replacing a damaged ladder, they will do so while it is there. The CORE keeps limited documentation of these informal fixes as part of its “fix-it-when-you-find-it” approach. For repairs that are not done right away, the Field Action Report prioritizes them based on urgency. Electrical issues receive a “1,” the highest priority. A lid that is shattered or needs to replacement receives a “2” priority. Priority “3” work is rarely undertaken because the crew tends to repair such small issues at the site. The priorities guide the urgency of the repair but are not accompanied by specific deadlines for accomplishment. They try to be as expedient and efficient as possible, scheduling work as soon as circuits are available.
Engineering generally responds to electrical problems and Service & Design Project Managers (SDPMs) handle the other tasks, including coordination with external contractors for civil repairs.
Technology
Maximo: PGE uses the Maximo for Utilities 7.5 system to manage inspection reports and store details about any maintenance needed.
7.5.6.15 - SCL - Seattle City Light
Maintenance
Manhole Inspection - Maintenance
People
SCL has an Energy Delivery Field Operations department that includes a network Electrical Services group (Area Field Operations – Network) group, and a network Civil Services group.
The Electrical Services group is made of 84 total people including the supervision and a five-person cable-locate crew. (Note: this cable-locate crew does underground locating for the whole company). This group performs all construction, maintenance, and operation of the network system.
The Civil Services group consists of approximately 36 employees. In addition, SCL contracts approximately 25% of their civil construction work associated with their network system as well.
Cable Splicer Position
The Cable Splicer position at SCL is a generalist position. Cable Splicers perform all electrical aspects of network construction, operations, and maintenance. All electrical employees who work in the network are either Crew Chiefs, journeyman Cable Splicers, or apprentices in the mode of progression, working their way towards the journeyman level.
Crew Makeup
A network crew is normally made up of one Crew Chief, one or two Cable Splicers, and one apprentice. The type of work to be done and SCL work rules will dictate the appropriate crew makeup. For example, performing switching in a vault requires at least two journeyman-level employees to be in the vault. These and other work rules and safety practices are spelled out in the Washington State Safety Standards for Electrical Workers, Chapter 296-45 WAC.
Process
Network Feeder Maintenance – Manhole Drill
SCL’s goal is to accomplish maintenance on their feeders every four years. They budget specific dollars each year to accomplish this maintenance. They attempt to tie this maintenance in with capital work when practical, so that they can take advantage of feeder outages to accomplish both the capital (system reinforcement) and maintenance activities. See Maintenance - Network Vault Inspection / Maintenance - Network Feeder Maintenance
Before taking a feeder out for maintenance, SCL performs a “manhole drill.” The manhole drill involves an inspection crew, usually made up of two journeyman Cable Splicers (or one working crew chief and one journeyman) and one apprentice going into each manhole on the feeder planned to be maintained, and performing an inspection. If inspectors identify a problem in the manhole that can be fixed on the spot, they do it. If the fix cannot be fixed on the spot, or must be engineered, they notify the Network Electrical Crew Coordinator, who creates a trouble ticket or urgent maintenance slip to complete the work as part of the feeder maintenance. If the inspection crew discovers a civil problem, they notify the civil crews of the need for a repair.
All post-inspection corrections are scheduled to be performed in conjunction with the feeder maintenance.
During the manhole drill, the crews perform heat gun readings in each manhole to identify any problems. Crews also look for problems on adjacent feeders in the same hole, and may postpone performing the feeder maintenance until addressing any identified problems on the adjacent feeders (in other words, address problems on adjacent feeders before moving to an n-0 condition). Heat gun checks are performed both at the front end, before the maintenance is accomplished, and at the back end, after maintenance is complete.
SCL does not perform cable limiter continuity checks as part of the manhole drill unless there is a specific problem, outage, etc. that they are following up on. These checks are usually performed as part of the troubleshooting of a problem.
All of the corrective work identified during the inspections are planned to be completed during the feeder maintenance, so that by the time the feeder is put back into service, all of the maintenance items and deficiencies will have been completed and corrected.
Civil Maintenance
SCL hired a consulting firm to audit their manholes to identify needed civil repairs. They currently have a $2.5 million budget to perform manhole civil repair. This work has been prioritized and is being spread over 40 years.
7.5.6.16 - Survey Results
Survey Results
Maintenance
Manhole Inspection and Maintenance
Survey Questions taken from 2019 survey results - Inspection Practices survey
Question 7 : Please indicate if your company performs the following Inspection activities on a routine basis and at what frequency.


Survey Questions taken from 2018 survey results - Asset Management survey
Question 8 : Please indicate if your company performs the following activities on a routine basis and at what frequency.

Question 9 : Do you have any maintenance programs where the maintenance frequency or approach is dependent, at least in part, on a risk or condition assessment of the assets to be maintained (For example, a higher risk vault inspected more frequently than a lower risk vault)?


Survey Questions taken from 2015 survey results - Maintenance
Question 85 : Please indicate if your company performs the following activities on a routine basis and at what frequency.


Question 94 : Are you using infrared (iR) technology as part of your manhole and vault assessment process?


Question 95 : If you use iR technology, what technologies do you use?


Question 96 : If you perform iR testing, which activities do you perform ir testing?


Question 97 : If yes, which equipment are you using iR on?


Question 99 : Are you using cameras as part of your manhole inspections?


Survey Questions taken from 2012 survey results - Maintenance
Question 6.10 : Do you regularly perform Manhole inspections?

Question 6.11 : If yes, what is the frequency of the Manhole inspections?


Question 6.30 : Are you using cameras as part of your manhole inspections?


Question 6.34 : Do your crews utilize tablets or laptop computers for maintenance


Question 6.35 : Is your record keeping done electronically or manually?


Survey Questions taken from 2009 survey results - Maintenance
Question 6.15 : Do you regularly perform Manhole inspections?

Question 6.16 : If yes, what is the frequency of the Manhole inspections?

7.5.7 - Network Protector Maintenance
7.5.7.1 - AEP - Ohio
Maintenance
Network Protector Maintenance
People
Network Mechanics perform network protector inspections on a one-year cycle and perform full network protector maintenance on a four-year cycle.
Process
Network protector annual inspections are an “open door” check, primarily to test for moisture. Inspectors do not de-energize or rack out the protector (see Figure 1). After inspection and closing the door, inspectors will apply 3 lbs of pressure to confirm the door seal. Specifically, this inspection involves:
-
Check for moisture and oil in the case
-
Check for loose parts in the bottom of the case
-
Inspect control wiring
-
Perform a visual inspection
-
Check for odor
-
Compare the relay status with contact position
-
Verify counter operation
-
Record counter readings
-
Check the door gasket
-
Pressure test the enclosure
-
Check the interlock type on CM52 protectors. Any early version interlocks should be scheduled for upgrade
-
Conduct both a mechanical and relay calibration check utilizing a NP test set.

Figure 1:
AEP engineer inspecting a network protector
Also, for CMD protectors, AEP is checking the contact pressure one month after a unit is placed in service. In addition, AEP Ohio performs annual trip (or drop) checks of each circuit to assure that protectors open as required. This test involves:
-
Check all single contingency spot networks as normal (so no customers are outaged by the execution of the test)
-
Open the circuit breaker
-
Confirm potential light out or use other means to confirm that the circuit is de-energized
-
Record the time opening interval (less than 10 seconds)
-
Close the circuit breaker
-
Check that all protectors are closed
-
Record counter readings
-
Check, clean, and lube mechanism.
-
Inspect control wiring (visual and odor)
-
Check for broken strands.
-
Check for loose parts in the bottom of the case.
-
Check for moisture and oil in the case.
-
Check insulator end caps – CM22
-
Check the mechanism close roller for free movement – CM22
-
Check the air damper breather hole – large CM22
-
Check the insulator bar for cracks/checks – GE, CM22
-
Check/lube finger clusters – CMD
-
-
Check nuts, bolts, screws, and connections for tightness.
-
Check internal fuses (rock test)
-
Check, clean, and align contacts.
-
Check arcing contacts – replace if worn
-
Check and set contact pressure – CMD
-
-
Measure the contact resistance with a DLRO meter. 25 micro-ohm all models and sizes
-
Check, clean, arc chutes
-
Check and clean phase barriers. Replace if broken.
-
Check the motor contacts and brushes
-
Check and clean motor control contacts.
-
Check/clean the motor brake (two-wire motor) CM22
-
Check and clean auxiliary switch contacts.
-
Check for Z bracket stop – CMD (install if missing, 1989 and earlier)
-
Check auxiliary switch timing – CM22, MG8/9
-
-
Check the type of CMD trip circuit.
-
Replace cap if necessary (1996 – 2002)
-
Replace the DTA if it is an older black unit with CTA.
-
Check the capacitor charge – two trips minimum.
-
-
Check anti-close circuit operation – CMD, CM52
-
Remove relays for cleaning and calibration
-
Replace electromechanical relays.
-
Check the minimum voltage trip and close – Mechanical test
-
Reinstall relays and calibrate/program (see protector maintenance test sheet).
-
Megger motor with 500-V megger.
-
After disconnecting ground connections and motor leads, megger upper and lower protector bus with 1000-V megger (phase-to-phase and phase-to-ground) – CM22, MG8/9, MG14, and CMR8.
-
Check the door gasket – pressure test enclosure.
-
Check automatic close/open operation.
-
Check CMD/CM52 interlocks.
-
Check the CM52 handle adjustment (trip form wire alignment).
-
Check counter operation and record readings.
-
Document follow-up work needed.
Technology
AEP Ohio is standardizing on Eaton CM52 network protectors, although older protectors are still in the field. Inspections and maintenance documentation is recorded on NP Inspection and NP maintenance forms (see Attachment F and Attachment G).
Crews have computers in every truck. Printed and online forms for network protector maintenance are available. Conditions and scheduled maintenance performed are then captured in the AEP NEED (Network Enclosure and Equipment Database). Network crews can also log into the AEP UGN (Underground Network) intranet for guidance, process, and procedures, including links to learning/diagnostic guides.
7.5.7.2 - Ameren Missouri
Maintenance
Network Protector Maintenance
People
The majority of the maintenance and inspection programs associated with network equipment, including network protector maintenance, are performed by resources within the Service Test group.
Organizationally, the Service Test group is part of Distribution Operations, led by a manager. Within Distribution Operations, there is a Reliability Support Services group led by superintendent. Reporting to the Superintendent Reliability Support Services are both the Service Test group led by a supervisor and the Distribution Operating group, also led by a supervisor.
The Service Test group is made up of Service Testers and Distribution Service Testers. It is the Distribution Service Testers who perform periodic network protector maintenance and calibration, as well vault maintenance and transformer maintenance including oil testing. The Service Testers perform low-voltage work only, such as voltage complaints, RF interference complaints, and testing and maintaining batteries.
Recently, Ameren Missouri has formed the “Underground Revitalization Department,” a team of engineers (all 4-yr degreed) focused on researching, evaluating, and developing plans for performing capital improvements to and revitalizing downtown St. Louis, including the network. As part of this group’s role, they are examining Ameren Missouri’s practices for inspecting and maintaining network infrastructure, and developing recommendations for optimal approaches. They have developed a draft document which details strategies for inspection and maintenance of network units, cable systems, vaults, manholes, indoor rooms and customer switchgear. In addition, they have developed a criteria used to evaluate and prioritize replacement of network transformers and protectors. These criteria are based on key considerations such as the transformer’s age, location, physical condition, loading, history with similar transformers styles, and oil quality. (See Network Transformer Replacement Criteria for more information) for more information)
Ameren Missouri has a repair shop that rehabilitates older network units and receives, assembles and tests new units. This repair shop, part of Supply Services, is located in Ameren Missouri’s Dorsett facility. This group mounts the network protector onto the transformer and performs protector testing on new units to assure the protector trips as expected.
Process
Ameren Missouri performs network protector maintenance and calibration on a two - year cycle.
Ameren Missouri performs network protector maintenance with the primary feeder energized. Note that at the time of the immersion, Ameren Missouri was revisiting their approach to maintaining 480V protectors in light of changing arc flash requirements.
The network protector maintenance includes the following steps, excerpted from the Ameren Missouri Distribution Service Man training manual and Maintenance and Inspection guideline developed by Ameren Missouri’s Downtown St. Louis Underground Revitalization group.
-
Verify nameplate data of protector and compare to inspection sheet. Note any discrepancies.
-
Use an infrared thermometer or infrared camera to measure temperatures of secondary side bushings. If there are any anomalies, or the readings seem high, call a Supervisor. Record readings on the inspection form.
-
Use ammeter to record current running through secondary side cables. Take phase-to-ground voltage readings and record all readings (current and voltage) on the inspection form.
-
Check and record the protector’s switch position as either “open” or “closed.”
-
The normal position of a protector should be “closed.” If switch is open, perform phase check as described above before manually closing the switch.
-
Check and record the position of the operating handle as either “automatic,” “open,” or “closed.” Protectors will normally be found in the “automatic” position.
-
Check operation of protector by moving operating handle to the “open” position. Place the handle back to “automatic” to make sure the protector recloses.
-
Move the protector handle back to “open” and lock it in that position. Take readings to make sure the protector is indeed open.
-
Use the sight glass to inspect the physical condition of the protector’s interior. If there are signs of damage or scorching, leave the vault immediately and call a Supervisor.
-
Open / Remove the protector door by removing the retaining bolts. OPEN / REMOVE THE DOOR SLOWLY AND CAREFULLY.
-
Make a quick visual inspection of the protector interior, making note of any component that looks damaged or scorched.
-
Record the operation counter number as found.
-
Inspect and remove the fuses and THEN the transformer links. FUSES MUST BE REMOVED FIRST.
-
Replace the “close” and “open” bulbs as needed.
-
Rack out (slide) the protector and perform the following tasks:
- Inspect fuses and transformer links for wear, melting and structural integrity.
- Inspect motor and brake for oil leakage and water and then clean the brake.
- Check for play of motor/shaft operation.
- Remove arc chutes (also called “arc quenchers”) and clean main and arcing contacts and arc chutes. If the arc chutes are asbestos, be careful to clean them in such a way that does not create friable material. If there is a lot of carbon build-up on the chutes, they should be replaced.
- Check and clean motor control device contacts.
- Check tightness of screw connections and tighten as needed.
- Check physical condition of wiring and barriers.
- Lubricate any moving parts with light oil.
- Remove and replace any broken components.
- Check for any leaks coming in from the transformer.
- Refer to manufacturer’s instructions and manuals for more detailed procedures, calibrations and adjustments.
-
Examine the relay and relay tag. The relays should be changed every two years and sent back to System Relay Services for testing and calibration.
-
Perform the Variac tests. The Variac tests apply voltage to the relays in order to determine if they are functioning correctly.
-
Rack in (slide) the protector and reinstall mounting bolts, links, and fuses (in that order).
-
Check transformer and network voltages with protector open.
-
Record the operation counter number and remount the door.
-
Add 3 lbs of Nitrogen and monitor for 30 minutes. Leave at 1.5 lbs. Record results on the inspection form.
Maintenance information is captured and recorded on a Network Transformer Inspection form, which is used to record information from both the network transformer and network protector inspection and maintenance. (See Attachment J) for a copy of the Network Transformer Inspection form.
Ameren Missouri has a remote monitoring system in place that provides network protector status. Ameren Missouri does not perform routine operational tests (drop tests).
Ameren Missouri Service Test department resources noted that they believe their system to be well maintained and that they do not have problems with false protector trips or protectors hanging up.
Technology
Ameren Missouri has about 265 network protectors on their system. Their current standard is for the network protector to be throat mounted to the transformer secondary. Standard network protector sizes are 1875, 2000, 2250, 2825, and 3000 amp units.
Ameren Missouri uses protectors from both Eaton and Richards. At the time of the practices immersion, Ameren Missouri was in the process of moving to the CM52 network protector. This decision was based on an analysis performed by Ameren Missouri, and driven by certain attributes of the CM52, including the dead front design, modular replacement, and remote racking capability, which enables them to rack the breaker of the bus with the NP door closed.
Ameren Missouri uses the ETI electronic relay as part of its remote monitoring system. Using this system, they are monitoring various points including voltage by phase, amps by phase, protector status, transformer oil top temp and water level in the vault. The monitoring points are aggregated at a box mounted on the vault wall that communicates via wireless.
From the remote monitoring system, the Service Test supervisor, as well as a predetermined group of other recipients, receives a computer system generated Email that indicates when a network protector has opened. So, when a feeder locks out for example, the supervisor would immediately be notified by the system through an email indicating that the protectors on the feeder have opened. In addition, the department supervisor receives a report each morning that indicates which feeders were out the night before.

Figure 1:
Network Protector

Figure 2:
Network Protector site glass
7.5.7.3 - CEI - The Illuminating Company
Maintenance
Network Protector Maintenance
(Relay Maintenance)
People
CEI has one Underground Network Services Center responsible for performing preventive maintenance and inspections of the underground, including the networked secondary and non network ducted conduit systems. The service center is comprised of Underground Electricians who inspect and maintain the underground system. Underground electricians perform the network protector inspections, including the network relay maintenance.
Process
Network protector maintenance is scheduled for a 6 year cycle. The inspection includes an external and internal inspection, as well as contact resistance tests, Megger tests, and relay calibration and functional tests using a test kit.
CEI will de-energize the primary feeder when working on the network protector. The Underground Electrician will also open the disconnect switch on the transformer primary before performing Network protector maintenance in a given vault.
CEI acknowledged that in practice, because the network is lightly loaded, they will sometimes subordinate performing this inspection in a certain year to performing network protector trip testing, and maintenance of manholes with older facilities more likely to fail.
Technology
Network protector inspection data is recorded manually on the vault inspection form, See Attachment - N , and on the Network Protector Inspection Form, (See Attachment O. Information about network protectors is kept in a manual file within the Underground Network Services department. . Information about network protectors is kept in a manual file within the Underground Network Services department.
Electricians perform relay calibration and functional tests (trip / close settings) by applying a network protector test kit to the protector.
7.5.7.4 - CenterPoint Energy
Maintenance
Network Protector Maintenance
People
Network Protector Maintenance is performed by Network Testers of the Relay group within Major Underground. The Major Underground organization includes Key Accounts, Engineering and Design resources, Support Services, and the field force responsible for all construction, operations and maintenance activities. The field force is divided into two main groups, the Relay group and the Cable group.
Both the Relay group and Cable group perform maintenance and inspection activities. The Relay group focuses on most of the non cable equipment inspection and maintenance, including performing vault equipment inspections, network protector testing, and other inspections and maintenance on devices with relays or motor operators. The Cable group focuses on inspections of cable, cable accessories and major equipment.
The Relay group is comprised of Network Testers. These field resources report to Crew Leaders, a non bargaining unit position at CenterPoint. The Relay group is led by an Operations Manager.
CenterPoint does not have dedicated maintenance crews. Rather, maintenance and inspection work is assigned to crews based on work priorities and resource availability.
Process
Network protector maintenance is performed on a 5 year cycle. The maintenance includes an external and internal inspection of network protectors, as well as contact resistance tests, relay calibration and functional tests using a test kit. In addition, as part of this testing, Network Testers will perform cable limiter continuity tests of the cable limiters that supply the street grid.
CenterPoint does not de-energize the primary feeder when working on the network protector. Also, they do not remove the network protector fuses which are located external to the Network Protector cabinet on the CMD type protector used at CenterPoint.
When racking out a network protector breaker, Network Testers wear personal protective equipment. At 480V, this includes FR clothing, hard hat, safety glasses, a face shield, a Kevlar jacket, and appropriate rubber goods protection, such as 600V gloves.
CenterPoint does not perform network protector drop tests. This is in part because CenterPoint serves radial customers from network feeders; consequently, de-energizing feeders for the purpose of testing the protectors would result in customer outages. Also, CenterPoint has remote monitoring of network protector status.
Technology
About ten years ago, CenterPoint embarked on a network rehabilitation effort that included replacing all of their network protectors with new units. They chose to replace their older units with CMD style network protectors. They believe that the dead-front, draw-out, spring-closed breaker mechanism and the externally mounted fuses make this is a safer design than some other network protector styles. They noted that the CMD units are larger than some other styles.
All CenterPoint network protectors are equipped with communication enabled relays. (MPCV relays). This technology enables them to remotely monitor current, voltage and status, as well as remotely operate the units. However, CenterPoint has not yet implemented the remote control (operation) of these devices, because to do so, would require them to re-examine and revise their clearance procedures to assure continued safe system operation.
CenterPoint is using an inspection checklist to guide inspectors through the various items included in the Network Protector Test. Network Protector inspection data is recorded manually on this same checklist, entitled MUDG Functional Location Inspection Sheet (See Attachment I ). An inspection sheet is completed for every location inspected. ). An inspection sheet is completed for every location inspected.
Network Testers perform relay calibration and functional tests (trip / close settings) by applying a network protector test kit to the protector.
7.5.7.5 - Con Edison - Consolidated Edison
Maintenance
Network Protector Maintenance
People
I&A Mechanics within the Construction Group maintain network equipment, including transformers and network protectors.
Construction Group
Con Edison’s service territory consists of four regions: Manhattan, Brooklyn/Queens, Staten Island, and Bronx/Westchester. The Manhattan Region is made up of three districts, including one headquartered at the W 28th St. Work Out Center. The term Work Out Center refers to a main office facility to which field construction and maintenance resources report. To provide a perspective on the size of a workout center, about 300 people work at the W 28th Street Work Out Center, and they can field about 125 crews.
The construction department consists of several groups:
-
Underground group
- The underground group is made up of splicers, who splice cable of all voltages.
-
I&A group (includes a services group)
- The I&A group installs and maintains network equipment, including transformers and network protectors. Within I&A in Manhattan, there is a services group dedicated to connecting customers to the distribution network. In other locations, the services group sits in a different part of the organization. This group does the splicing on the secondary system and deals with customer connection issues.
-
Subsurface construction (SSC) group
- The SSC deals with vaults, conduit ducts, and other civil work. Much of this work is contracted.
-
Cable group
- The cable group pulls in new cable and retires cable.
Field Engineering Group
Con Edison has a field engineering group consisting of 40 individuals who perform a variety of quality-assurance-related tasks including performing infrared inspections of network protectors. See Manhole Inspection and Maintenance - Field Engineering Group
Process
Network Protector Inspection
Network Protectors are inspected on various cycles depending on the inspection classification, as part of the CINDE Visual Inspection and Test Box Inspections.
Inspection and Maintenance
Con Edison performs periodic maintenance and inspection of network distribution equipment, including network feeders, transformers, network protectors, grounding transformers, shut and series reactors, step-down transformers, sump pumps and oil minder systems, remote monitoring system (RMS) equipment, and vaults, gratings, and related structures.
Con Edison’s approach to performing an inspection is to inspect all the equipment and structures associated with a particular vault ID at a location regardless of category or classification, and even if the particular equipment associated with a particular vault ID resides within different compartments (for example, a transformer and network protector may be located in separate physical compartments even though they both share the same vault ID). This type of inspection is referred to as a CINDE Inspection, based on the name of their maintenance management system (Computerized Inspection of Network Distribution Equipment).
Con Edison performs inspections energized; crews do not take a feeder outage to perform inspections, perform pressure drop testing, or take transformer oil samples. Con Edison does not routinely exercise feeder breakers.
In an effort to more efficiently use their resources, and when nonpriority conditions allow, Con Edison takes advantage of situations where they have to enter a vault or manhole for a reason other than a scheduled inspection, and perform a nonscheduled inspection while they are in the vault. When the record of this nonscheduled inspection is recorded in CINDE, the system “resets the clock” for the next inspection date.
Network equipment at 208 V is generally inspected on a 5-year cycle. 460-V facilities, sensitive customers, facilities in flood areas, and other more critical locations are inspected more frequently, often annually. Con Edison establishes network equipment inspection cycles depending on two factors: the inspection category and the inspection classification .
The inspection category refers to the type of inspection, and includes a Visual Inspection, a 120/208-V Test Box Inspection, and a 460-V Test Box Inspection. The Visual Inspection includes activities beyond visually assessing condition and recording information, such as pressure drop testing and taking transformer oil samples.
The test Box inspections involve specialized testing of network protectors with the network relay installed. Note that all of the elements of a Visual Inspection are performed along with the Test Box Inspections.
-
Routine test box inspection of 208 V with RMS — not performed cyclically, inspection driven by other factors.
-
Routine test box inspection of 208 V without RMS — 6 year cycle.
-
Routine test box inspection of 460 V with RMS — 4.5 year cycle.
-
Routine test box inspection of 460 V without RMS — 18 months.
-
Non-routine inspections performed more frequently depending on vault classification based on vault location, nature of customer, and equipment type, age, and condition. Non-routine inspection locations are predefined.
Note that Con Edison does not perform routine network protector drop tests.
The inspection classification refers to characteristics of the inspection site that dictate the inspection cycle. For example, a “Routine” 208-V vault is visually inspected on a 5-year cycle, while a 208-V vault located in a “tidal” area would be visually inspected annually. Con Edison considers the following classifications in determining inspection cycles:
-
Routine
-
Back-feed: banks installed on a feeder involved in a back-feed incident
-
Candidate for Replacement: commonly due to corrosion damage
-
Essential Services: critical customers
-
Flooded Bank: nonsubmersible equipment that has experienced high water levels
-
208-V Isolated Bank: units that require more frequent inspection than distributed secondary grid units
-
Remote Monitoring System(RMS), Non RMS, Unit Not Reporting (UNR): Con Edison varies inspection cycles based on the level of remote monitoring installed
-
Tidal, Water, and Storm Locations
Note that Con Edison requires employees to perform at least a quick visual inspection (QVI) anytime an individual enters a network enclosure, even if the reason for entering an enclosure does not warrant a CINDE Inspection. This type of inspection (QVI) differs from the CINDE inspection category of Visual Inspection described above, in that it is not a full, accredited inspection.
Technology
Inspection and Maintenance Software
Con Edison uses legacy maintenance management software called CINDE, which is an acronym for Computerized Inspection of Network Distribution Equipment. CINDE is a system that records inspection data and initiates inspections based on predetermined cycles. These cycles depend on the category of inspection (for example, a visual inspection versus a “Test Box” inspection) and various predetermined classifications of inspections (for example, a “Routine” 208-V vault is visually inspected on a 5-year cycle, while a 208-V vault located in a tidal area is visually inspected annually).
Con Edison inspectors record inspection data on hand-held devices (Tough Books). The utility requires that the inspection data be downloaded into the CINDE – Mainsaver system (Mainsaver is the part of the CINDE system used to record data) within three days following the inspection. Inspection data that is entered into the CINDE system includes:
-
Equipment serial numbers
-
As-found and abnormal conditions, such as transformer oil level, state of corrosion, and water in the vault
-
Defective equipment or structures
-
Repairs or change-outs undertaken
-
As-left condition, such as transformer pressure and liquid level, and pressure of housing
The CINDE – Mainsaver system is also used by Con Edison to prioritize follow-up work, or outstanding defects to be corrected that are identified through inspection or other visits to network enclosures. The Electric Operations Region is responsible for prioritizing follow-up work by considering the location of the work with respect to risk to public safety, reliability impact, the type of installation, age of the outstanding defect, and the efficient use of resources.
Trucks
Con Edison provides its employees with the specialized tools and equipment that they need to do their jobs, including trucks outfitted for the different types of work that they perform. Employees stated that they believed Con Edison provides them with good quality trucks, appointed with the equipment they need to perform their work. People demonstrated a sense of pride in their trucks and associated equipment.
Con Edison’s network resources use specially equipped box trucks. Each department truck is outfitted to meet the needs of that group, including multiple storage bins for housing the onboard equipment. For example, I&A mechanics use a box truck equipped with the specialized equipment they need to perform their job duties, such as network protector test kit, outriggers, and a hydraulic boom with a winch for lifting equipment.
7.5.7.6 - Duke Energy Florida
Maintenance
Network Protector Maintenance
People
Maintenance of network protectors are performed by craft workers, Network Specialists and Electrician Apprentices, within the Network Group, part of the Construction and Maintenance Organization. The Network Group is led by a supervisor, and consists of ten craft workers, five Electric Apprentices and five Network Specialists (the journey worker position).
Duke Energy Florida’s construction and maintenance organization is divided into regions, with both Clearwater and St. Petersburg falling within their South Coastal Region. The Construction and Maintenance organization for the South Coastal Region is led by a General Manager.
The Network Group is organized functionally, and has responsibility for construction, maintaining and operating all urban underground infrastructure (ducted manhole systems), both network and non-network, in both Clearwater and St. Petersburg. Resources are assigned to either Clearwater or St. Petersburg based on work needs. Being a small group of resources, Duke Energy Florida rotates work assignments to assure that Network Specials are “jacks of all trades”. However, even with this rotation, the work of network protector maintenance is typically done by Clearwater resources, in part because of their maintenance approach as described below, and in part because the test kit itself is located in Clearwater. Duke Energy Florida has recognized the need to provide St. Petersburg employees with on the job training to assure that protector maintenance expertise is incorporated throughout the team.
Process
Duke Energy Florida has a unique approach to maintaining network protectors. Rather than maintaining the protectors in the field, they replace the network protector with a new or refurbished unit. The removed protector is taken into the shop and is tested, maintained and refurbished if necessary in the repair shop. The maintained unit would then be used to replace another network protector. The work done “on the bench” is the same as the kind of maintenance that is performed by many companies in the field (see Figures 1 and 2). Units are taken apart and inspected for obvious damage and wear, they assure that the protector opens and closes properly both electrically and mechanically, the unit is cleaned, the relay settings are checked, and the unit is Megger tested.

Figure 1:
CM22 Network Protector, maintained and ready for replacement

Figure 2:
CM22 on the bench to be maintained
Duke Energy Florida keeps just a few spare units in stock.
In Clearwater, Duke Energy Florida replaces all network protectors every two years, during load check (vault) inspections, prior to the summer peak demand period. It takes approximately one month to perform all the network protector replacements in Clearwater. Part of the rationale for the two-year replacement cycle is the significant number of network protector operations they experience, as they supply their network feeders from different substation busses and have historically comingled network and non - network loads on portions of their distribution system, leading to issues such as protector cycling and pumping. The only exception to the two-year replacement cycle would be units with an unusually high number of operations.
When Duke Energy Florida performs the network protector replacements, they do not de – energize the transformer. They remove the blocks on the bottom side of the protector, between the protector and the transformer secondary, and they remove the network protector fuses, isolating the protector from both secondary sources.
In St. Petersburg, Duke Energy Florida does not replace network protectors on a two-year cycle, as they do in Clearwater. Rather, at their spot network locations, they inspect the network protectors (17 in total) annually during vault inspections, including load checks, and make maintenance decisions based on inspection findings. They recently completed a detailed inspection of all the network protectors on St. Petersburg and replaced units found to be in need.
At the Clearwater supply and maintenance facility, Network Specialists test, maintain and rehabilitate network protectors and NP relays. They also acceptance test new protectors as they arrive from the manufacturers. Duke Energy Florida underground experts feel this acceptance testing of new equipment is critical and noted that they had two new network protectors fail their acceptance testing in recent years.
Duke Energy Florida is in the process of replacing the electromechanical protector relays with microprocessor based protector relays. Once all protectors have been upgraded, they plan to implement a new maintenance program. The group is looking at peer practices, industry best practices, and internal processes to create the new network protector maintenance program.
Duke Energy Florida does not perform drop tests. They do have a remote monitoring system implemented which remotely communicates protector status.
During vault inspections, Duke Energy Florida performs load checks.
Technology
The CM 22 is the standard protector at 125/216 (typically, a 1600A unit).
The CM 52 is their standard at 277/480.
Duke Energy Florida is in the process of replacing the electromechanical protector relays with microprocessor based protector relays.
Duke Energy Florida has a network protector kit at their test shop in their Clearwater supply and maintenance facility. All protector testing, maintenance and rehab is performed at this facility. They do plan to procure an additional test kit for the St. Petersburg office.
7.5.7.7 - Duke Energy Ohio
Maintenance
Network Protector Maintenance
People
Duke Energy performs weekly network protector drop tests to assure the protectors are operating properly.
The drop tests are performed every week, on a Tuesday, Wednesday and Thursday evening, by Mobile Operators working night shift.
The Mobile Operator position at Duke is one whose role includes operating devices in a substation. For example, this position will perform feeder clearances at night, including performing switching, isolation, and tagging in the substation, in advance of work to be done the next day. Mobile Operators also coordinate with crews doing switching out on overhead and underground circuits.
Performing network protector drop tests each week is part of the Mobile Operators’ normal routine, and a long standing practice at Duke, Cincinnati.
Process
Duke Energy performs weekly network protector drop tests on all network protectors to assure they are operating properly (See Attachment H for a description of the test procedure and schedule). Duke has 28 total network feeders and 400 network protectors.
The mobile operator will open the breaker on a primary feeder supplying the network. Duke is using voltage potential indicator lights to monitor any back feed on the system that could be caused by a network protector not opening properly. The test exercises the network protector breakers, and helps to identify any network protectors that are hung up.

Figure 1:
Network circuit panel
If they find a potential indicator light lit, they notify the Supervisor – Construction and Maintenance in the Network group who would mobilize crews to respond.
Note that weekly tests will be cancelled by the Control Center if Duke is already operating in a first contingency situation (another network feeder is already out of service). Duke does not perform the tests on holidays.
Note that Duke is not performing formal periodic network protector testing and maintenance beyond the weekly drop tests. They will utilize a network protector test set when changing network protector relays, but do not apply the test set as part of a formal maintenance program.
Technology
As Duke Energy applies remote monitoring to network protectors so that they can remotely know the status of every protector, they acknowledge that they may have to revisit their weekly test approach. However, they believe in the value of regularly exercising the breaker, and their field crews feel safer that there is some routine validation that the network protectors open and close properly.
7.5.7.8 - Georgia Power
Maintenance
Network Protector Maintenance
People
The Georgia Power Network Underground group has two full-time Test Technicians responsible for Network Protector Testing and Maintenance who report to the Network UG Reliability Manager of the Network Operations and Reliability Group. The Network Operations and Reliability group is also responsible for remotely monitoring and operation the network system.
The Operations and Reliability Group is part of the Network Underground group at Georgia Power, a centralized organization responsible for all design, construction, maintenance and operation of the network infrastructure for the company. The Network Operations and Reliability Group works closely with the Network Standards Group to determine the best means of implementing network protectors for remote monitoring and maintenance on the network underground system, statewide.
The Test Technicians, recruited from the ranks of Senior Cable Splicers, are responsible for the five-year inspection and maintenance cycle for the network protector fleet, about 2000 units, and maintain between 300-400 protectors a year, on average. Test Technicians receive on the job training (OJT) from more senior technicians, and may take evening classes and/or network protector vendor training classes before becoming Test Technicians. Georgia Power recruits the Test Technicians by identifying Senior Cable Splicers who are interested in the work, and may assign on the job training where the cable splicer is partnered with a Test technician in the field, or may fill a spot when a Test Technician is on vacation. The Test Technician is a non-bargaining, non-exempt position.
All Test Technicians are responsible for identifying, troubleshooting and resolving problems with network protectors. Within the group of Test Technicians, some people may gravitate to setting up and maintaining the wireless and fiber optic network connections to the Georgia Power SCADA system from the network protector, while others may work more closely on the electronics of the network protectors themselves. Georgia Power does a good job of fitting the right people with the proper skill-sets to particular jobs. The organization does its best to pass down positions to personnel based on interest, skills, and OJT experiences.
Process
Test Technicians work in two person teams to perform NP maintenance. They perform a visual inspection of the network protector, the condition of its external fuse, and the area surrounding the network unit (see Figure 1 through Figure 3). The Test Technicians properly de-energizes the protector, and then attaches a test kit to the network protector to calibrate and test the units, typically a two-hour procedure. It is the standard for Georgia Power to mount network protectors on the transformer tank (though Georgia Power does have a few old wall mounted units still in service).
As a part of its SCADA modernization program, the crew will replace any network protector electromechanical relaying with solid state components. The group also upgrades any network protector that does not have external fuses by adding external current limiting fuses, mounted on top of the protector, outside the case.

Figure 1:
Test Technician performing network protector maintenance


Figure 2 and 3:
Test technician using test kit located in specialized van above the vault
One notable practice is a change in the procedure for racking out a network protector as a function of the arc flash rule changes. The Standards group has implemented steps that reduce the potential arc energy that workers could be exposed to during network protector maintenance. In the past, crews would go out to work with the protector energized, and then open the protector. In this situation, when a crew removed the protector fuses, there would still be energized conductors above on the secondary side and an unprotected zone between the transformer secondary and the bottom of the protector.
In the new maintenance procedure for performing protector maintenance, the Test Technician crew will take the primary feeder out of service, thus de-energizing the transformer supplying the protector. In addition, on the unit on which they are performing maintenance, they will open the network transformer primary switch so that the transformer cannot contribute fault current if a fault occurs inside the protector. For this reason, the crew will typically schedule protector maintenance when the primary feeder may be out of service for other maintenance. If the primary feeder must be put back in service, they’ll still have the transformer switch open, and the protector isolated from the primary. Thus the protector is energized only from the secondary bus, through current-limiting fuses.
Georgia power has developed a guideline that a field crew can use to estimate the incident arc energy that is available in the vault to assure that they are using appropriate personal protective equipment and procedures. The guideline includes a table that provides the incident arc flash energy based in the vault type, number of energized transformers, size of the transformers, and presence of current limiting fusing.
(See Attachment G for the guideline for arc flash exposure in a 480V spot network vault).
The Standards Group has done calculations that show in most of the GPC vaults, even at 480 V, a worker can be protected by a level 2 fire retardant (FR) clothing system by disconnecting the protector from the secondary bus work, and separating the protector from the transformer as previously described.
Test Technician and Cable Splicer crewmembers are expected to refer to the Georgia Power Network Protector Arc Flash Guideline Table before any network protector maintenance.
In 480V network protector locations, Georgia Power places external current limiting fuses on the cables leaving the protector and supplying the secondary collector bus. These fuses are effective in limiting the current during a fault. However, these fuses have a current range, so there must be enough of a fault current for the fuses to operate. Where vaults have less fault current available, then the current limiting fuse might not be effective. Therefore, the largest vaults, with the greatest potential arc energy do not pose the greatest risk to workers, because in those vaults the current limiting fuse would act very quickly, in less than half a cycle, and extinguish the arc with the worker(s) not exposed to any long-duration event. In the smaller vaults, with one or two smaller transformers and where the available arc energy is too low for the current limiting fuse to work effectively, workers might be required to don a flash suit or use other incremental fire or arc-flash protection.
When they are putting a network protector back in service, Georgia Power does not perform any sort of a “fuse test” in the protector, such as placing a low amperage fuse in the protector so that if there is a problem, the fuse will open. They don’t like the idea of exposing a worker to that condition. Their process is to close the network protector remotely - if there is a problem on the system, the worker would be out of the hole. Note that they are examining other options for safely closing protectors such as a device (by EDM) that uses timing to check for proper phasing.
Technology
Georgia Power uses both Richards and Eaton network protectors. Engineers have standardized on submersible protectors with a dual 208 V or 480 V rating. They deploy mainly Eaton CM 22 and Richards 313 and 314s. Engineering has bought and installed a few CM 52s for trial, but are concerned with stored energy in the unit spring. Once that issue is resolved, Georgia Power may move to this model or some other model.
Some older protectors have internal fuses, but Georgia Power is moving to protectors with outside fuse boxes mounted on the top of the protectors (See Figure 4 and Figure 5.).

Figure 4:
New network protectors. Note outside fuse boxes on top of the protectors

Figure 5:
Current limiting fuse used on protector cables
All network protectors are connected to the Network Operations center by a SCADA system, ESCA (Alstom). This is the same SCADA system used for substation control and their distribution automation system (See Figure 6 and Figure 7.). The system communicates by DSL, radio frequency, or a fiber network connection to the network operations center where protectors are monitored by the Network Operations staff. Remote monitoring has been in place at Georgia Power for 15 years.

Figure 6:
View of inside of SCADA control box mounted on vault wall

Figure 7:
Information displayed in network control room SCADA
The Network Operations center typically monitors the following information from the network protectors:
-
Current
-
Voltage
-
Protector Open or Closed
-
Fluid in the vault
-
Fluid in the protector
7.5.7.9 - HECO - The Hawaiian Electric Company
Maintenance
Network Protector Maintenance
People
Note that the Underground group does not install or maintain network equipment such as network transformers or network protectors. Network equipment construction and maintenance is the responsibility of the Substation group at HECO. The Substation group is part of the Technical Services Division of the System Operations Department.
Process
Network system preventive maintenance and inspection programs include:
| Program | Cycle or other Trigger |
| Manhole Inspection, including amp readings of molimiters. | Annual |
| Network Vault Inspection | 2-3 years – inspected during transformer and NP maintenance |
| Network Transformer Maintenance (Includes Oil Sampling and Pressure Testing) | 2 -3 years |
| Network Protector Maintenance | 2-3 years |
Non urgent corrective maintenance actions that are identified during inspection are put into a folder to be performed the next time a particular feeder is out of service. This is consistent with the approach used by many utilities.
7.5.7.10 - National Grid
Maintenance
Network Protector Maintenance
People
Network protector inspection and maintenance in Albany is performed by the UG field resources (network crews) who are part of Underground Lines East. This group is led by a Manager, and includes a group focused on civil aspects of the underground system and a group focused on the electrical aspects. The Underground Lines group is responsible for both the network and non – network infrastructure in eastern NY, including the Albany network.
The Electrical Group, comprised of Cable Splicers and Maintenance Mechanics, and is led by three supervisors. Maintenance Mechanics perform inspection and maintenance of network equipment such as transformers and network protectors.
In addition, National Grid has a company-wide Inspections Department, led by a manager, responsible for completing regulatory required inspection programs. This group consists of supervisors assigned to regions, and a union workforce to perform routine inspections. Note, however, that network protector inspections and maintenance in Albany are performed by Underground Lines East maintenance mechanics
Process
National Grid performs network protector Visual and Operational (V&O) inspections annually as part of an annual network vault inspection. National Grid has a well documented procedure that describes the annual V&O inspection (See Attachment A ). Inspections include a visual inspection of the protector condition and performing activities such as monitoring loading and the number of counts on the protectors, checking the cabinet and protector bushing for temperature issues using an infrared thermometer, verifying operating handle position, inspecting the cabinet for moisture and water, door gasket deterioration, and paint and rusting issues, and monitoring secondary current on all 3 phases with a clamp-on ammeter.
National Grid has developed an Electrical Operating Procedure (EOP) which provides guidelines for prioritizing issues identified during inspection for repair. Various turnaround times for repair are specified depending on the categorization.
Level 1: Emergency - must be made safe within seven days.
Level 2: One year
Level 3: Three year
Level 4: Information purposes only
These levels were developed by asset and engineering groups based on past history and basic knowledge. Except for emergencies, inspections are not repaired immediately but are reported so that the inspection process can stay in task. Inspection information is entered directly into a mobile device using Computapole software, and a work order can be generated by the interface between Computapole and National Grid’s STORMS work management software (See Technology, below).
National Grid performs network protector diagnostic tests on a five-year cycle. The only exception to this is in vaults with CMD style protectors
- a diagnostic test is performed on these network protectors on a two-year cycle. National Grid has a well-documented procedure that describes the activities associated with the diagnostic inspection. For these inspections, the protector is racked out and the racking mechanism lubricated. Fuses are checked for signs of overheating or damage. Other parts and contacts are also checked for signs of pitting, corrosion, heat, carbon deposits, cracking, or other damage. The operating mechanism is checked and lubricated. Insulation resistance is checked with a Mega-ohm meter. Operational tests are performed with the network test set according to test set directions.
Maintenance crews carry a bottle of pressurized nitrogen and a regulator to test the protector compartment. The compartment is pressurized to 3 PSI, and it should not drop more than 2 PSI in 24 hours.
National Grid Albany performs network protector maintenance and diagnostic testing on the 120/208V system with the primary feeder energized. At 277/480V spot locations, National Grid (in NYE, a local practice) performs network protector maintenance with the primary feeder de-energized. Note that National Grid procedures do not require the primary feeder to be de-energized to perform network protector maintenance. However, NY east, as a local practice, does de-energize the network transformer (and therefore the exposed bus work in the protector case) when doing maintenance on 277/480V protectors. A clearance is issued from the Regional Operator with the limits being the primary switch on the transformer and the protector fuse openings.
National Grid performs a routine operational test (drop test) annually. They de-energize each network feeder and use potential lights at the station to identify any back feed from hung up protectors.
For a checklists associated with the V&O inspection and maintenance of network protectors, (See Attachment B).
Technology
Crews use handheld devices (PDAs) to record inspection information. This unit has the required inspection information built into it as well as a mapping feature. It also contains the most up-to-date system data and previous inspection results. Appropriate codes for the inspection are entered directly into the unit and returned to the supervisor for entry into the computer database. These codes alert GIS of changes in the field.
Computapole is a mobile utilities software platform that runs on handheld devices and is customized to meet National Grid’s specific needs. Computapole is used for inspections and mapping functions on handheld PDAs. Once information is entered in the Computapole system, work is managed by an interface with STORMS (below) to create work requests.
Severn Trent Operational Resource Management System (STORMS) is National Grid’s work management system. The work management system includes tools to initiate, design, estimate, assign, schedule, report time/vehicle use, and close distribution work. Computapole sends inspection information to STORMS to create work requests as needed.
Test equipment includes a network protector test set, a Mega-ohm meter, and a fused jumper lead with Busman CC KTK-R-2 200KA interrupting fuse used to test for grounds before replacing NP fuses.

Figure 1:
NP Test Set

Figure 2:
NP Relay


Figure 3 and 4:
NP Maintenance
7.5.7.11 - PG&E
Maintenance
Network Protector Maintenance
People
The Maintenance & Construction crews operating in San Francisco and Oakland are responsible for performing network protector (NP) maintenance. These crews are made up of Cable Splicers who perform the actual NP maintenance.
In the San Francisco network, this work is performed on the night shift by the Night Cable Splicers. In Oakland, day shift Cable Splicers perform the protector maintenance.
Process
PG&E performs network protector testing on a three year cycle. They adopted the 3-year cycle after performing an extensive study that included:
- Industry benchmarking (EPRI, AEIC)
- Evaluations and analysis undertaken by 3rd party consultants
- Manufacturers recommended guidelines
The 3-year cycle replaced a former 1 year cycle program that was deemed overly conservative from their analysis.
In addition, any network protectors that show unusual operations, are particularly critical, or have exceeded 200 operations before the 3-year cycle is completed, are inspected, and maintained out of cycle, as conditions warrant.
PG&E performs network protector maintenance with the primary feeder de-energized.
The program calls for
- Cleaning and internal inspection of Network Protector
- Relay testing & setting (with test kit)
- External inspection of Network Protector, including pressure testing.
Maintenance information is captured and recorded on a maintenance form. See Attachment I for a copy of the Network Protector Maintenance checklist .
If, during maintenance, the crew identifies a corrective maintenance issue with the network protector that cannot be immediately repaired, a follow up notification tag (called an EC notification) is created and a priority is assigned to the corrective maintenance by the crew.
PG&E does not perform routine operational tests (drop tests) to assure the protectors are operating properly. However, they de-energize each network feeder at least once per year for their transformer maintenance, providing them an opportunity to assess protector operation.
Maintenance information is captured and recorded on a maintenance form.
For a detailed list of the work procedures related to the installation, maintenance and repair of Network Protectors see Attachment J.
Technology
PG&E uses a variety of NP types from both Richards Mfg and Eaton, including CM52, GE Style, Westinghouse Style and CMD protectors. .
PG&E has remote monitoring at all of their network protectors. This monitoring provides voltage, current and status indication. They are currently in the process of implementing more advanced remote monitoring and control, using the Eaton MPCV relays.

Figure 1:
CT’s on top of NP
Argon Research – Network Protectors
PG&E, in collaboration with EPRI, is researching the use of Argon gas instead of Nitrogen inside network protector cases. Argon provides some positive attributes such as;
-
Non-reactive – may help to extend life of internal components
-
Good thermal stability – Used for manufacturing and welding applications.
-
Inexpensive – 3rd most common element in the atmosphere.
-
Doesn’t mix well with other gases – heavy – provides for method of easily evacuating gases from Network Protectors.
The research and testing is on-going effort, and to-date has shown some very positive results. PG&E hopes to publish the results of its research in the coming year.
7.5.7.12 - Portland General Electric
Maintenance
Network Protector Maintenance
People
On the network, inspecting and maintaining network protectors is largely the responsibility of the Special Tester. The Special Tester is a journeyman lineman with additional training and technical skills, including specific training of network protectors. PGE has embedded one Special Tester within the CORE group. This individual has received specialized training in network protectors from the manufacturer, Eaton, and serves as the CORE group expert on network protectors.
The Special Tester usually partners with cable splicers, working as part of a crew. The “special testing crew” includes the Special Tester, a crew foreman (a cable splicer), a lineman/cable splicer, and a topman, a non-journeyman helper. For NP testing, the topman sits in the truck with the equipment controls and watches the manhole/vault entrance for potential hazards.
In addition to NP testing and settings, the Special Tester focuses on power quality issues, including customer complaints about voltage.
Network Protector Crew: The CORE group has recently created a dedicated crew that deals with network protectors, as well as performs other construction work. This crew is comprised of cable splicers who receive formal training and attend conferences to gain experience with network protectors. This crew includes a foreman (a working journeyman), a journeyman (who rotates every three months to assure a breadth of expertise in the department), and a Special Tester. A non-journeyman helper may supplement the crew as required.
Reliability Technicians: Reliability Technicians perform infrared (IR) thermography inspections on primary systems and network protectors as part of the Quality and Reliability Program (QRP), a reliability improvement program targeted at key infrastructure. PGE has three IR specialists, who mainly focus on the transmission system but also work on high priority distribution systems. Organizationally, the Reliability Technicians belong to the same group as the Special Testers and report to the Testing Supervisor.
Process
PGE has approximately 230 network protectors on the system, with half included in the 480 V spot networks, and half in the 120/208 V area grid systems.
Network protectors are maintained annually for 480 V protectors at spot network locations, and every two years for the 216 V protectors supplying the area networks. As part of the network protector testing, crews also undertake a general vault inspection, including an inspection of other equipment in the vault and civil condition. This includes inspection of the network transformer, checking and recording transformer information (oil sampling and testing is performed as part of a separate program), and performing a general IR inspection of the vault.
NP Test Crew Procedure: When testing network protectors, three crew members work in the vault: the Special Tester, the crew foreman, and a journeyman. The helper usually operates the test kit, located in the truck outside the vault.
PGE performs network protector testing with the primary feeder energized. The basic steps include the following:
- Set the protector to the open position
- Vent the network protector (because it is filled with nitrogen)
- Open the door of the protector
- Rack the breaker out
- Apply the test kit. The crew follows a test protocol passed down from others, with very little written down.
The test procedure verifies that the NP operates as expected under various conditions, including tripping on back feed, and closing based on a predetermined voltage differential between the network side and the transformer side. If the NP does not perform as expected, the crew checks that the relay settings are correct and troubleshoots the various components.
Crews re-pressurize the units once they are closed with nitrogen at 2-3 psi (14 to 21 kPa) to ensure no leaks around the enclosure.
PGE does not perform periodic drop testing, which involves opening the feeder to verify that all the network protectors will open. However, it periodically takes a circuit out for transformer maintenance and utilizes the remote monitoring system to verify that protectors are opening as expected.
In particular, with vaults that have very tight spacing between conductors or other characteristics that could create hazards, PGE requests a shutdown order and takes the feeder out of service before entering the vault.
Monitoring Network Protectors: PGE has installed a remote monitoring system in its network. This system utilizes information provided by the Eaton MCPV relay in the protector. All field workers have access to this system.
The remote monitoring system is a separate system from the energy management system (EMS) used by dispatchers. This monitoring system is known internally as the “blue wire” system[1] and resides on the “Pi” system (OSIsoft). PGE developed Pi front-end screens.
Network protector monitoring includes the voltage, all three-phase currents on the transformer and bus side of the unit, the power factor, the temperature, and the position of the contact breaker (open or closed). Part of the feeder clearance process involves checking the monitored values. If after opening a feeder breaker, the remote monitoring system indicates that one of the protectors is still closed, a crew goes out to the vault to troubleshoot.
The monitoring system is only used for monitoring, not remote control. The monitoring system is reliable, though PGE has experienced some communications issues with the Pi system.
Network Protector IR Program: The Special Tester is performing a targeted IR inspection of the network protectors as part of the QRP, a target reliability program aimed at key infrastructure.
Network Protector Quality Assurance: Crews bring new protectors to the warehouse where they are tested based on initial settings. This is an initial quality assurance check to ensure no issues when the unit is installed. In addition, the Special Tester also checks the equipment before it enters service.
Technology
All in-service PGE network protectors are either CMD or CM52 units from Eaton. These are both dead front units. The current standard is the CM52, used in both 125/216 and 277/480 volt Y connected secondary network systems at PGE [1].
The CM52 includes an air circuit breaker with an operation mechanism, network relays, and control equipment. The network protector door includes a window that allows crews to see the internal hardware [2].
The PGE protector installation includes externally-mounted, silver-sand fuses to interrupt fault currents if the networker fails to trip.
PGE is not using remote racking technology or arc flash reduction technologies.
Remote Monitoring: PGE utilizes the Eaton Mint II system with a PowerNet server platform interface. The optic fiber to the Mint II monitors is set in an H&L Fiber Loop configuration. The H&L Instruments system converts the fiber communications to the protocol used on the NPs, and vice versa. PGE is considering the use of the Eaton VaultGard system to harden the system, using the looped fiber optic communications already installed throughout the downtown area. The reason for looking at VaultGard is that it is a web-based protocol with integrated software that allows a higher degree of control.
Most of the information is sent to an OSIsoft Pi system. Pi allows engineers to view the load flows at each network protector. The Pi system can collect large volumes of data from multiple sources and helps users view, analyze, and share information [3]. OSI Pi is a real-time data historian application that can record and store information data from a number of systems, as well as compress the data for easy storage in the database. PGE uses this system to operate the Blue Wire system used to monitor network protectors.
At present, PGE only uses the system for monitoring and not for control.
Network Protector Inspection and Maintenance: All critical network protector spares are either stored on the network truck or in easily accessible locations. A plan exists to replace the truck with a flat-bed version fitted with a gantry crane for lifting, and a bread truck for the other equipment and for testing.
Personal Protective Equipment: PGE requires workers to don a 40-calorie suit and facemask when opening 480 V protectors.
[4]Field crews call this “blue wire” because the twisted pair wires feeding into each protector are blue. Information from the protectors is converted to and communicated on PGEs looped fiber system.
- Eaton. “CM52.” Eaton.com. http://www.eaton.com/Eaton/ProductsServices/Electrical/ProductsandServices/ElectricalDistribution/SpecialtyPowerDistributionSystems/SecondaryNetworkSolutions/CM52Protectors/CM52/index.htm (accessed November 28, 2017).
- Instructions for the Eaton Type CM52 Network Protectors 800 to 4500 Amperes. Eaton, Moon Township, PA: 2010. http://www.eaton.com/ecm/groups/public/@pub/@electrical/documents/content/ib52-01-te.pdf (accessed November 28, 2017).
- The PI System. OSIsoft, San Leandro, CA: 2015, https://www.osisoft.com, (accessed November 28, 2017).
- Portland General Electric. “Quick Facts.”PortlandGeneral.com. https://www.portlandgeneral.com/our-company/pge-at-a-glance/quick-facts (accessed November 28, 2017).
7.5.7.13 - SCL - Seattle City Light
Maintenance
Network Protector Maintenance
People
Certain Cable Splicers are assigned to focus on network protector construction, operations, and maintenance, and thus become experts in these areas. These individuals are selected for this focus based on their interest level and mechanical aptitude. They retain their Cable Splicer position.
Process
Network protector maintenance is performed on a four-year cycle and is performed independently of the feeder maintenance. Network protector trip / close settings are tested using a network protector test kit.
Primary feeders remain energized during this maintenance. SCL maintains a network protector by simply opening the protector and removing the fuses. They leave the primary switch closed (energized), such that the source side of the protector remains energized. Note that they do not necessarily tag it, nor is a clearance required from the dispatcher in order to maintain a network protector. See Attachment J.
Operations Practices — Vault / Network Fires
SCL’s current design standard calls for fire protection heat sensors and temperature sensors in their vaults. The heat sensors are designed to open all the network protectors in the vault when the heat sensor registers 225°F. The temperature sensors send an alarm to the dispatcher at 40°C. (SCL utilizes temperature sensors in about 20% of their network transformer locations. They are actively adding locations, with a goal of 100% coverage.)
SCL does not have a written procedure for responding to a vault fire. Although their operators do have the authority to drop load in an emergency, they do not have a protocol to guide them as to whether or when they should drop load in response to a fire. Note that because of the “sub-network” design, with each secondary network completely separated from the other, a complete network outage due to a fire would be limited to the customers served by that one sub-network, with the other networks unaffected.
7.5.7.14 - Practices Comparison
Practices Comparison
Maintenance
Network Protector Maintenance

2015 Survey Results


7.5.7.15 - References
EPRI Underground Distribution Systems Reference Book (Bronze Book)
Excerpts from Chapter 9: Network Operations and Maintenance
Chapter Section 9.3.8: Test Procedures and Schedules
Chapter Section 9.3.9: Network Protector Inspection and Maintenance
7.5.7.16 - Survey Results
Survey Results
Maintenance
Network Protector Maintenance
Survey Questions taken from 2019 survey results - Inspection Practices survey
Question 25 : Please indicate if your company performs the following Maintenance activities on a routine basis and at what frequency.


Survey Questions taken from 2018 survey results - Asset Management survey
Question 8 : Please indicate if your company performs the following activities on a routine basis and at what frequency.

Survey Questions taken from 2015 survey results - Maintenance and Operations
Question 85 : Please indicate if your company performs the following activities on a routine basis and at what frequency.


Question 93 : When you perform network protector maintenance, please indicate which of the following you do. (check all that apply)


Question 98 : Does your network protector maintenance include conducting periodic “drop tests”, whereby a primary feeder is opened, and measurements are taken for backfeed voltage to assure that the network protectors function correctly (automatically open)?


Question 99 : Are you using cameras as part of your manhole inspections?


Question 113 : For 480 V network protectors, do you de-energize the network transformer before removing the network protector fuses?


Question 114 : For 208 V network protectors, do you de-energize the network transformer before removing the network protector fuses.


Survey Questions taken from 2012 survey results - Maintenance and Operations
Question 6.25 : Do you regularly perform Network protector maintenance and testing?

Question 6.26 : If yes, what is the frequency of testing?


Question 6.27 : When you perform Network Protector maintenance, please indicate which of the following you do.


Question 6.29 : Does your NP maintenance include conducting periodic “drop tests”, whereby a primary feeder is opened, and measurements are taken for back feed voltage to assure that the network protectors function correctly (automatically open)?


Question 7.13 : For 480 V network protectors, do you de-energize the primary before removing the network protector fuses?


Question 7.14 : For 208 V network protectors, do you de-energize the primary before removing the network protector fuses.


Survey Questions taken from 2009 survey results - Maintenance
Question 6.32 : Do you regularly perform Network protector maintenance and testing?

Question 6.33 : If yes, what is the frequency of testing?

Question 6.34 : When you perform Network Protector maintenance, please indicate which of the following you do.

Question 6.35 : Does your NP maintenance include conducting periodic “drop tests”, whereby a primary feeder is opened, and measurements are taken for back feed voltage to assure that the network protectors function correctly (automatically open)?

7.5.8 - Network Protector Operational Test
7.5.8.1 - AEP - Ohio
Maintenance
Network Protector Operation Test
Process
AEP Ohio performs annual trip (or drop) checks of each circuit to assure that protectors open as required. This test involves:
-
Check all single contingency spot networks as normal (so no customers are outaged by the execution of the test)
-
Open the circuit breaker
-
Confirm potential light out or use other means to confirm that the circuit is de-energized
-
Record the time opening interval (less than 10 seconds)
-
Close the circuit breaker
-
Check that all protectors are closed
-
Record counter readings
Results of trip checks are recorded on an on line form.
Technology
AEP does have a remote monitoring system installed and can ascertain protector status remotely.
7.5.8.2 - Ameren Missouri
Maintenance
Network Protector Operational Test
Process
Ameren Missouri does not perform network protector drop tests. See Network Protector Maintenance.
7.5.8.3 - CEI - The Illuminating Company
Maintenance
Network Protector Operational Test
People
CEI has one Underground Network Services Center responsible for performing preventive maintenance and inspections of the underground, including the networked secondary and non network ducted conduit systems. Underground Electricians perform the network protector operational test, working with the Dispatcher to take the feeder out of service.
Process
Network protector operational tests are performed annually, to assure the protectors are operating properly.
A primary feeder supplying the networked is opened manually by a crew or switchman at the station. An underground crew would visit each vault that houses a network protector fed by that feeder to assure that the protector opened properly to prevent feedback from the meshed secondary network on to the primary. Note that CEI is not using neon indicators at the station or other monitoring to sense backflow on the primary due to a faulty protector.
When the feeder is re-energized, the crew would revisit each protector vault to assure that the protector has closed properly.
Technology
Information about network protectors is kept in a manual file within the Underground Network Services department.
7.5.8.4 - CenterPoint Energy
Maintenance
Network Protector Operational Test
Process
CenterPoint does not perform network protector drop tests. See Network Protector Maintenance.
7.5.8.5 - Con Edison - Consolidated Edison
Maintenance
Network Protector Operational Test
People
Installation and Apparatus (I & A) Group (includes a services group) The I&A group installs and maintains network equipment, including transformers and network protectors. Within I&A, in Manhattan, there is a services group dedicated to connecting customers to the distribution network. In other locations, the services group may sit in a different part of the organization. This group does the splicing on the secondary system and deals with customer connection issues.
Process
Con Edison does not perform routine network protector drop testing. See Network Protector Maintenance
Technology
I&A mechanics use a box truck equipped with the specialized equipment they need to perform their job duties, such as network protector test kit, outriggers, and a hydraulic boom with a winch for lifting equipment.
7.5.8.6 - Duke Energy Florida
Maintenance
Network Protector Operation Test
Process
Duke Energy Florida does not perform drop tests. They do have a remote monitoring system implemented which remotely communicates protector status.
7.5.8.7 - Duke Energy Ohio
Maintenance
Network Protector Operational Test
People
Duke Energy performs weekly network protector drop tests to assure the protectors are operating properly.
The drop tests are performed every week, on a Tuesday, Wednesday and Thursday evening, by Mobile Operators working night shift.
The Mobile Operator position at Duke is one whose role includes operating devices in a substation. For example, this position will perform feeder clearances at night, including performing switching, isolation, and tagging in the substation, in advance of work to be done the next day. Mobile Operators also coordinate with crews doing switching out on overhead and underground circuits.
Performing network protector drop tests each week is part of the Mobile Operators’ normal routine, and a long standing practice at Duke, Cincinnati.
Process
Duke Energy performs weekly network protector drop tests on all network protectors to assure they are operating properly (See Attachment H for a description of the test procedure and schedule). Duke has 28 total network feeders and 400 network protectors.
The mobile operator will open the breaker on a primary feeder supplying the network. Duke is using voltage potential indicator lights to monitor any back feed on the system that could be caused by a network protector not opening properly. The test exercises the network protector breakers, and helps to identify any network protectors that are hung up.

Figure 1:
Network circuit panel - note circuit potential lights
If they find a potential indicator light lit, they notify the Supervisor – Construction and Maintenance in the Network group who would mobilize crews to respond.
Note that weekly tests will be cancelled by the Control Center if Duke is already operating in a first contingency situation (another network feeder is already out of service). Duke does not perform the tests on holidays.
Note that Duke is not performing formal periodic network protector testing and maintenance beyond the weekly drop tests. They will utilize a network protector test set when changing network protector relays, but do not apply the test set as part of a formal maintenance program.
Technology
As Duke Energy applies remote monitoring to network protectors so that they can remotely know the status of every protector, they acknowledge that they may have to revisit their weekly test approach. However, they believe in the value of regularly exercising the breaker, and their field crews feel safer that there is some routine validation that the network protectors open and close properly.
7.5.8.8 - Georgia Power
Maintenance
Network Protector Operational Test
Georgia Power does not perform routine operational (drop) testing, as they have a remote monitoring system installed and can thus, ascertain protector status remotely. See Remote Monitoring - SCADA
7.5.8.9 - National Grid
Maintenance
Network Protector Operational Test
Process
National Grid performs a routine operational test (drop test) annually. They de-energize each network feeder and use potential lights at the station to identify any back feed from hung up protectors.
7.5.8.10 - PG&E
Maintenance
Network Protector Operational Test
Process
PG&E does not perform routine operational tests (drop tests) to assure the protectors are operating properly. However, they de-energize each network feeder at least once per year for their transformer maintenance, providing them an opportunity to assess protector operation.
7.5.8.11 - Portland General Electric
Maintenance
Network Protector Operational Test
People
System Control Center (SCC): The SCC is usually referred to as Load Dispatch, and operators are known as load dispatchers, who are managed by the Transmission and Distribution (T&D) Dispatch Manager. The SCC has two distribution control regions, and dispatchers are assigned geographically. From Monday to Friday, two dispatchers cover each of the two PGE regions.
One of the regions and therefore one of the dispatch desks includes downtown Portland and the CORE network. Dispatchers rotate between the two desks so that all dispatchers gain experience working with the network. The SCC employs eight dispatchers total who rotate between the desks on 12-hour shifts. Dispatchers are salaried employees (non-bargaining).
PGE employs load dispatchers from a range of backgrounds. Some are electrical engineers, some are ex-lineman, and others are SCADA technicians or truck drivers. This approach provides a diverse range of experience. PGE does not have a formal training program for load dispatchers. Training is primarily “on the job.” The load dispatcher position is not considered entry level, so PGE prefers to hire people with prior experience and qualifications.
Load dispatchers perform switching according to checked and verified plans drawn up by engineers. Dispatchers then communicate with crews to carry out the switching in the field.
Load dispatchers have SCADA installed on network feeder breakers. At one of its two network substations, a feeder lockout results in an alarm and page being sent to a preset distribution list, including the Distribution Engineers and CORE group supervisor. If a breaker locks out on a network feeder, the dispatcher calls both the duty engineer and the duty general foreman (DGF) in the CORE underground group. The DGF assembles the appropriate crew to respond to the alarm, isolate the fault, and resolve the issue.
Dispatching has alarms on the feeder breaker and some loading alarms based on predetermined thresholds for feeder loading.
Though PGE has a remote monitoring system installed at each network protector location, this system is not connected to the dispatch SCADA. PGE does not bring alarms or other information from this monitoring system back to the dispatch center. Dispatchers can call up the network monitoring system on custom screens developed in Pi (OSIsoft).
Note that at one point, PGE patched the NP monitoring to the SCC. However, PGE had so many alarms—mostly from normal operation, such as protectors opening under light load conditions—that it decided to keep the alarming of the network information separate from the dispatchers. Accordingly, PGE’s approach to network equipment is proactive, as individual alarms are not presented in real time through either alarms or pages. Rather, Distribution Engineers check the network monitoring system daily for any issues. In addition, the network monitoring system is checked regularly by the Special Tester and Network Foremen for issues. Dispatchers can also access the remote monitoring system as required.
Load dispatchers know a range of systems, including Maximo, ARM Scheduler, and ArcFM. They should understand the PGE-IBEW work rules and related Oregon Public Utility Commission (OPUC) regulations. Line dispatchers must have an associated degree or 1-3 years of experience in a related field.
Training at the SCC: There is no formal SCC network training. All dispatcher training of the network system is on the job. A company called SOS Computer Training Specialists makes computer-based training for the North American Electric Reliability Corporation (NERC) system operators, including one module that relates to secondary networks and feeders. This training is optional.
Process
Energy Management System (EMS): On the underground system, the SCC uses the network protector to gather the majority of information concerning the secondary system, although there is no remote control of the system at this stage. The remote monitoring system on the protectors is a separate system from the EMS used by dispatchers. The remote monitoring system is known internally as the “blue wire” system.[1] Load dispatchers have access to this system, which resides on the “Pi” system (OSIsoft). They can select any network and see all the flows on each NP, as well as determine whether they are open or closed. PGE developed Pi front-end screens.
If the dispatch center is executing a shut-down order and sees that a protector still shows as closed on the monitoring system when it should be open, the SCC contacts the individual listed on the shut-down order to let them know that a particular protector still shows as closed. That individual will send a crew to the location to check on the network protector status.
Monitoring Reliability: PGE’s Outage Management System (OMS) tracks and logs outages, and is integrated with the Customer Information System (CIS), GRID (an electronic map-based connectivity system), outage histories, and interactive voice response (IVR). All of this information is collated and a monthly evaluation ensures accurate data. This verified data is used to calculate System Average Interruption Duration Index (SAIDI), System Average Interruption Frequency Index (SAIFI), and other data presented in PGE’s Annual Reliability Report.
Momentary outages (MAIFIe) are logged and recorded at substations equipped with SCADA and MV90, a system that collects data at meters. Of PGE’s 146 distribution substations, 59% are fitted with SCADA, and 35% with MV90. The remaining 5% of substations with neither system will have readings taken monthly [1].
Planned Outages: Planned outages follow a structured process, which can take up to a week to organize. For a planned outage, the Network Engineering Department creates a shut-down order document requesting the feeder outage that the dispatcher must complete. Load Dispatch receives a three-day lead time for planned shutdowns.
The remote monitoring system on the network protectors is a separate system from the EMS that the dispatchers use. This monitoring system is known internally as the “blue wire” system. Load dispatchers have access to this system, which resides on the “Pi” system (by OSIsoft). They can select any network and see all the flows on each NP, as well as whether they are open or closed. PGE developed Pi front-end screens. The system is not being utilized to remotely operate equipment.
At one of the substations supplying the network, four transformers supply the multiple substation busses supplying the network. This station has a load follower scheme, a master/slave configuration so that every bus follows the master to maintain consistent voltage at the bus. In the event of a bus section outage, Dispatch will lock the regulation so that it does not try to regulate but maintains voltage, as it has had some historic problems with current flow.
Grounding and Switching: PGE grounds feeders at the substation using either CORE group employees or substation operators. Feeders are only grounded at the substation, and PGE’s practice on the network is not to set up a tighter zone of grounding. The SCC relies on the CORE group to isolate faults and provide recommendations about what switches need to be opened. SCC still authorizes the switching but works closely with the crew to make sure that it understands exactly what process and order to follow.
Network Shutdown: At present, PGE has no formal guidelines governing dictated conditions that would warrant a network shutdown.
Power Restoration: To restore power, there is a simultaneous close capability, which closes all four network feeder breakers at the same time and is operated remotely via the SCADA. The SCC calls the general foreman before closing any breaker to ensure that crews are not working in any the vaults on that feeder. The foreman confirms with the crews whether it is safe to close.
Fault Location and Analysis: If a feeder breaker opens for a network feeder due to a fault rather than planned work, the SCC calls the duty general foreman in the network group. The SCC leaves it up to the general foreman to determine whether the issue can wait until the following day or needs to be dealt with immediately. Single feeder losses are often left for the following day unless the outage occurs in a period of heavy loading, or other conditions exist that would raise the risk of operating in a N-1 condition.
Smoking Manholes: If a smoking manhole is reported, the SCC calls the duty general foreman. In this situation, the load dispatcher may elect to dump the network, which has been done in the past. The load dispatcher normally confers with distribution engineering to make that decision.
Accident Response: During an accident, the procedures dictate that the crew should call the SCC with the relevant information. In addition, the crew or SCC contacts emergency services. The SCC completes an online form that is distributed to approximately 150 people automatically, and calls out the safety coordinator responsible for the network. In addition, PGE has a Crisis Response Team that responds to situations of employee injury. Representatives of this team travel to the hospital with the injured employee and notify the family. Using this team removes the burden from the SCC. This protocol was implemented approximately 10 years ago.
Drills: PGE conducts system-wide outage restoration drills once a year, prior to the fall storm season. In the past, this included some scenarios that involved the CORE network system. For example, a recent drill was substation-centric. The tested scenarios simulated the outage of one of the stations supplying the network.
PGE also conducts annual earthquake drills, which are tabletop exercises organized by the Business Continuity Group. These drills do not always involve the network depending on the scenario chosen.
PSC has no written guidelines specifically related to unforeseen events occurring on the network.
During an emergency,PGE follows the principals of the incident command system (ICS) at the management level.
Technology
Outage Management System (OMS)/Oracle NMS
The redundant design of the network prevents customers from experiencing outages in most conditions. The information that follows is a discussion of the OMS technology utilized at PGE, though this technology is rarely leveraged in a network application.
PGE migrated to an Oracle NMS outage management system, which is based on WebSphere technology [2]. Oracle NMS is a scalable distribution management system that manages data, predicts load, profiles outages, and supports automation and grid optimization. The system combines the Oracle Utilities Distribution Management and Oracle Utilities Outage Management systems in a single platform. The system supports outage response and the integration of distributed resources [3].
Oracle NMS blends SCADA function and geographic information system (GIS) models to combine as-built and as-operated views of the system. The application includes a number of advanced distribution management functions, including network status updates in real time, monitoring and control of field devices, switch planning and management, and load profiling. Oracle NMS can integrate with other SCADA and GIS systems, and it monitors network health using data from a number of systems. The NMS includes a simulation mode for training and supports switch planning and control.
Oracle NMS maintains a network model that handles the whole grid, includes every device, and integrates with existing systems using standards-based protocols such as Inter-Control Center Communications Protocol (ICCP), Common Information Model (CIM), and MultiSpeak-based web services. The system can also integrate with a range of GIS and Advanced Meter Infrastructure (AMI) systems [4].
PGE’s NMS/OMS integrates outage information and location, switching functions, and work management. The system allows operators to see present system status and other operational data, and a data model predicts outage locations [3]. During outage events, operators can manage outage calls, assign and manage crews, and use the Maximo database to locate assets in relation to customers without power. The OMS also integrates with the GIS and CIS, which allows outage information to be accessed by customers [5,2]. Other functions within the OMS include:
- Automatic Vehicle Location (AVL): As part of the new OMS, the AVL allows crew locations to be shown on the NMS map. This allows operators to dispatch the closest crew to an outage.
- Asset Resource Management (ARM): PGE can now route service work and design construction orders through Maximo to WebSphere, and from there to the ARM system. Crew information from laptops can be sent to the system for retrieval.
- Oracle Utilities Analytics (OUA): Using OUA, operators can view if a crew dispatch is successful, and the system allows crews to view any pending work orders in their feed.
- Safety functions: The OMS uses the AMI to improve safety during outages. The AMI pings meters to determine on/off status during an outage event, allowing operators to determine if outages can be cleared from the OMS and free crews for other restoration priorities. In addition, meters send a “last gasp” message to the AMI system when they are about to run out of power.
System Installation: The 2020 Vision/Next Wave projects used 40-50 fulltime employees to implement the systems and included partnerships with Oracle for product support, as well as Accenture for expert system integration understanding. The implementation included change management and embedded technical and information technology (IT) teams to ensure smooth implementation.
OSIsoft Pi
PGE has a remote monitoring system implemented that monitors information from the network protector relay. PGE’s looped fiber system communicates information from this system, which can be viewed on customer screens developed within the OSIsoft Pi system. This information is available to load dispatchers, engineers, and field crews. The Pi system can collect large volumes of data from multiple sources and helps users view, analyze, and share information [5,6].
[1] Field crews call this “blue wire” because the twisted pair wires feeding into each protector are blue. Information from the protectors is converted to and communicated on PGEs looped fiber system.
- Seven-Year Electric Service Reliability Statistics Summary 2007-2013. Oregon Public Utility Commission, Salem, OR: 2014. http://www.puc.state.or.us/safety/14reliab.pdf (accessed November 28, 2017).
- D. Handova, “PGE: Driving Customer Value With Network Management Systems.” EnergyCentral.com. http://www.energycentral.com/c/iu/pge-driving-customer-value-network-management-systems(accessed November 28, 2017).
- Modernize Distribution Performance All the Way to the Grid Edge. Oracle, Redwood Shores, CA: 2015. http://www.oracle.com/us/industries/utilities/network-management-system-br-2252635.pdf(accessed November 28, 2017).
- Modernize Grid Performance And Reliability With Oracle Utilities Network Management System. Oracle, Redwood Shores, CA: 2014. http://www.oracle.com/us/industries/utilities/046542.pdf(accessed November 28, 2017).
- Smart Grid Report. Portland General Electric, Portland, OR: 2017. http://edocs.puc.state.or.us/efdocs/HAQ/um1657haq16327.pdf (accessed November 28, 2017).
- Marquam Substation Project Quick Facts. Portland General Electric., Portland, OR: 2017. https://www.portlandgeneral.com/-/media/public/our-company/energy-strategy/documents/marquam-substation.pdf?la=en (accessed November 28, 2017).
- Portland General Electric. “Quick Facts.”PortlandGeneral.com. https://www.portlandgeneral.com/our-company/pge-at-a-glance/quick-facts (accessed November 28, 2017).
7.5.8.12 - SCL - Seattle City Light
Maintenance
Network Protector Operational Test
People
Certain Cable Splicers are assigned to focus on network protector construction, operations, and maintenance, and thus become experts in these areas. These individuals are selected for this focus based on their interest level and mechanical aptitude. They retain their Cable Splicer position.
Process
SCL does not perform routine network protector drop testing. See Network Protector Maintenance
Technology
Network Tools
SCL crews believe their tools to be of top quality. An example would be the network protector test kits (Richards) that the crews use to perform network protector maintenance.
7.5.8.13 - Survey Results
Survey Results
Maintenance
Network Protector Operational Test
Survey Questions taken from 2019 survey results - Inspection Practices survey
Question 22 : For your network system, do you perform a “Drop test”, where a network feeder is opened at the station and network protectors are tested to assure that they are functioning correctly (automatically open on backfeed)?


Survey Questions taken from 2015 survey results - Maintenance
Question 85 : Please indicate if your company performs the following activities on a routine basis and at what frequency.


Question 93 : When you perform network protector maintenance, please indicate which of the following you do. (check all that apply)


Question 98 : Does your network protector maintenance include conducting periodic “drop tests”, whereby a primary feeder is opened, and measurements are taken for backfeed voltage to assure that the network protectors function correctly (automatically open)?


Survey Questions taken from 2012 survey results - Maintenance
Question 6.25 : Do you regularly perform Network protector maintenance and testing?

Question 6.26 : If yes, what is the frequency of testing?


Question 6.27 : When you perform Network Protector maintenance, please indicate which of the following you do.


Question 6.28 : During your network Protector testing, do you know/record how fast the NP opens (in terms of cycles usually) when it sees a reverse power flow?


Question 6.29 : Does your NP maintenance include conducting periodic “drop tests”, whereby a primary feeder is opened, and measurements are taken for back feed voltage to assure that the network protectors function correctly (automatically open)?


Survey Questions taken from 2009 survey results - Maintenance
Question 6.32 : Do you regularly perform Network protector maintenance and testing?

Question 6.33 : If yes, what is the frequency of testing?

Question 6.34 : When you perform Network Protector maintenance, please indicate which of the following you do.

Question 6.35 : Does your NP maintenance include conducting periodic “drop tests”, whereby a primary feeder is opened, and measurements are taken for back feed voltage to assure that the network protectors function correctly (automatically open)?

7.5.9 - Network Transformer Maintenance
7.5.9.1 - AEP - Ohio
Maintenance
Network Transformer Maintenance
People
Network transformer inspection and maintenance is performed by the Network Mechanic position. Network transformers are inspected annually, and oil sampling and testing is performed on a three-year basis. Transformer maintenance activities are driven by findings from both the visual inspection and oil test results. Inspection and maintenance are scheduled by AEP Ohio network engineers. It is notable that all AEP operating companies conform to the same transformer inspections and maintenance approach.
Process
Maintenance crews, comprised of Network Mechanics, inspect all network transformers yearly, in conjunction with annual vault inspections. Inspection activities include:
-
Check for oil leaks of each fluid-filled tank (main tank, high voltage switch, and termination compartment), especially at the flanges, valves and other joints. Clean the valves if necessary.
-
Inspect and record the physical condition of the transformer/transformer support (rails). Minor rust spots can be “touched up.”
-
Record transformer temperature readings and oil level readings. If oil levels are low, maintenance crews will add oil.
-
Load readings are taken, normally before the summer load period.
-
Inspect the switchgear at the site.
-
Nameplate data on the transformer is captured, as well as its serial number and vault location.
Transformer temperature, pressure, and oil levels are provided by sensors. AEP Ohio is in the process of standardizing on generic gauges and sensors so that they can stock fewer transformer-specific parts.
At present, AEP Ohio has a mix of GE, Carte, and ABB transformers. The company had historically used a three-chamber design, with the termination chamber and high-voltage primary switch chamber integrated into the network unit. The company has moved to the use of a separate wall-mounted solid dielectric high-voltage vacuum switch (see Figure 1), along with a transformer unit with ESNA-style bushings.

Figure 1:
Network transformer – single tank design, for use with separately wall-mounted, high-voltage switch
On a three-year cycle, AEP Ohio performs oil sampling and testing of each network transformer compartment. The following tests are performed:
-
Perform a dielectric test using ASTM 1816 (filter if below 22 kV)
-
Check moisture content
-
Perform a dissolved gas in oil analysis (DGA).
- Note that DGA is performed after the first month of service, then annually unless trends are stable or if results are within acceptable levels. Then, the unit will move to the three-year cycle.
Overall transformer condition(s) is recorded and corrective maintenance actions identified are prioritized on the Transformer Inspection Form (see Attachment H ). Transformer maintenance activities are a function of the results of the oil testing (results of the DGA). Maintenance performed includes:
-
High Voltage (HV) Switch
-
Drain, inspect, and clean the HV switch compartment.
-
Inspect, clean, and adjust the HV switch.
-
Measure the contact resistance with a DLRO meter as follows:
-
With the switch in the closed position, measure all three-phase-cable-to-transformer contacts (50 micro-ohms is acceptable)
-
With the switch in the ground position, measure the resistance of all three phases from cable side of the switch to the transformer ground pad (1250 micro-ohms is acceptable)
-
Clean the contacts with “scotch bright” as necessary.
-
-
Check the compartment gasket and replace if necessary.
-
Refill with new oil and let set for 24 hours (settle time) before re-energizing.
-
-
High Voltage Cable Termination Compartment.
-
Drain, inspect, and clean the HV termination compartment.
-
Inspect cable stress relief. Install if necessary.
-
Check the compartment gasket and replace if necessary
-
Refill with new oil and let set for 24 hours (settle time) before re-energizing.
-
-
Transformer Main Tank.
-
Check and replace the throat gasket as needed.
-
Perform a Doble Test
- Disconnect the primary cables if possible to test through the cable termination compartment.
-
Perform a TTR Test
-
AEP Ohio has identified four conditions that describe transformer condition and drive maintenance. Each condition is based specifically on predefined levels of various dissolved gasses identified through testing, and comporting with IEEE guidelines:
-
Condition 1 – Indicates transformer operating satisfactorily.
-
Condition 2 – Indicates greater than normal combustible gas level. Action should be taken to establish a trend. Fault may be present.
-
Condition 3 – Indicates a high level of decomposition. Immediate action should be taken to establish a trend. Fault(s) are probably present.
-
Condition 4 – Indicates excessive decomposition. Continued operation could result in transformer failure. Proceed immediately and with caution. Consider removing from service.
At AEP Ohio, the decision to replace a network transformer is based on condition, not age.
Technology
Crews have computers in every truck. Printed and online forms for transformer maintenance are available. Conditions and scheduled maintenance performed are then captured in the AEP NEED (Network Enclosure and Equipment Database).
AEP uses sensors to monitor transformer temperature, pressure, and oil levels. These sensors are being tied in with the NP microprocessor-based relays and can be remotely monitored through its SCADA system.
The AEP Ohio Network Engineering Supervisor is considering installing advanced SCADA connected sensors in selected vaults (a group of 480-V units) for dissolved gas monitoring and rapid transformer pressure rise monitoring, and is developing a criterion for selecting locations. With the new SCADA system (see Remote Monitoring), AEP Ohio has the resources to pilot these sensors at the highest risk transformer vaults. The pilot installation will enable the company to gain knowledge and assess the sensor’s usefulness in other parts of the AEP system.
7.5.9.2 - Ameren Missouri
Maintenance
Network Transformer Maintenance
(Oil Testing)
People
The majority of the maintenance and inspection programs associated with network equipment, including network transformer maintenance, are performed by resources within the Service Test group.
Organizationally, the Service Test group is part of Distribution Operations, led by a manager. Within Distribution Operations, there is a Reliability Support Services group led by superintendent. Reporting to the Superintendent Reliability Support Services are both the Service Test group led by a supervisor and the Distribution Operating group, also led by a supervisor.
The Service Test group is made up of Service Testers and Distribution Service Testers. It is the Distribution Service Testers who perform periodic network transformer maintenance and oil sampling, as well vault maintenance and network protector maintenance and calibration. The Service Testers perform low-voltage work only, such as voltage complaints, RF interference complaints, and testing and maintaining batteries.
Recently, Ameren Missouri has formed the “Underground Revitalization Department,” a team of engineers (all 4-yr degreed) focused on researching, evaluating, and developing plans for performing capital improvements to and revitalizing downtown St. Louis, including the network. As part of this group’s role, they are examining Ameren Missouri’s practices for inspecting and maintaining network infrastructure, and developing recommendations for optimal approaches. They have developed a draft document which details strategies for inspection and maintenance of network units, cable systems, vaults, manholes, indoor rooms and customer switchgear. In addition, they have developed a criteria used to evaluate and prioritize replacement of network transformers and protectors. These criteria are based on key considerations such as the transformer’s age, location, physical condition, loading, history with similar transformers styles, and oil quality. (See Maintenance: Network Transformer Replacement Criteria for more information)
Ameren Missouri has a repair shop (Dorsett) that rehabilitates older network units and receives, assembles and tests new units. This group performs inspection and testing of new units including checking taps, and performing TTR tests.
Process
Ameren Missouri performs network transformer maintenance and oil sampling on a two year cycle. Ameren Missouri performs network transformer maintenance in conjunction with network vault inspection and network protector maintenance. This maintenance is performed with the primary feeder energized.
The network transformer maintenance includes inspection and maintenance of both the transformer and primary switch. The following steps are excerpted from the Ameren Missouri Distribution Service Man training manual and the Maintenance and Inspection guideline developed by Ameren Missouri’s Downtown St. Louis Underground Revitalization group.
Transformer Primary Switch
The Primary voltage switch is located on the opposite end of the network transformer from the protector and has to be inspected as part of the annual inspection. The primary switch can only be operated de-energized. It is interlocked such that it cannot be operated if the primary cable is energized.
The primary switch is inspected as follows:
- Inspect primary cables and associated components for signs of physical wear and damage.
- Make sure tags are clearly labeled and in good condition.
- Check for oil leaks and for “Non-PCB” label. If there is no label, contact a supervisor immediately.
- Check operating handle and mechanism.
- Check oil level and oil temperature. Record on inspection form. If the oil level is not below “low,” take a sample (50mL sample in the syringe and about a quarter full of a plastic quart bottle) . If the oil level is below “low,” write up a trouble ticket. Replace gauges if necessary.
- Add 3 lbs of Nitrogen and monitor for 30 minutes. Leave at 1.5 lbs. Record results on the inspection form.
Network Transformer
Network transformers are delta wye three-phase transformers designed for underground usage. In the St. Louis network system, the primary winding is 13.8 kV (13.2 units with taps to support 13.8) Secondary winding is 216 / 125 V (network grid units). These transformers are usually rated at 500 to 750 KVA.
- Check for oil leaks, especially at the flanges, valves and other joints. Clean the valves if necessary.
- Inspect the physical condition of the transformer. Make sure the top is clean and check for rust and the condition of the paint.
- Verify nameplate data on transformer and compare to inspection sheet. Note any discrepancies.
- Check for “Non-PCB” label. If there is no label, contact a supervisor immediately.
- Check oil level and oil temperature. Record on inspection form. If the oil level is not below “low,” take a sample (50mL sample in the syringe and about a quarter full of a plastic quart bottle). If oil is below “low,” write up a trouble ticket. Replace gauges if necessary.
- Obtain an oil sample for dissolved gas analysis. Submit the oil sample to the chemistry laboratory for analysis. Make sure that the oil temperature at the time the sample is taken is recorded on the form submitted to the chemistry laboratory.
- Add 3 lbs of Nitrogen and monitor for 30 minutes. Leave at 1.5 lbs. Record results on the inspection form.
The results of the inspections are recorded on the Network Transformer Inspection form. (See Attachment J). ).
The oil samples from the transformer tank and primary switch compartment are sent to the Ameren Missouri Chem laboratory. Ameren Missouri performs the following oil tests:
-
Dissolved Gas Analysis
-
Water Content
-
Acid content (TAN)
-
Interfacial Tension (IFT)
-
Dielectric testing
Ameren Missouri has a separate program for sampling oil from the transformer primary termination chamber, also on a 2 year cycle. These samples are drawn with the primary feeder de-energized.

Figure 1:
Oil Sampling kit
Technology
Ameren Missouri has 265 network units.
Information from the transformer inspections is updated in the Ameren Missouri’s Circuit and Device Inspection System (CDIS) by the Dist Service Testers.
The CDIS includes an algorithm that assigns a “structural score” and an “electrical score” based on the inspection findings and weightings for various findings developed by Ameren Missouri. The scores are used to prioritize remediation. See Transformer Replacement Criteria for more information.
CDIS is also used to produce reports that summarize inspection findings and a dashboard that monitors inspection progress.
Ameren Missouri uses the ETI electronic relay as part of its remote monitoring system. Using this system, they are monitoring various points including voltage by phase, amps by phase, protector status, transformer oil top temp and water level in the vault. The monitoring points are aggregated at a box mounted on the vault wall that communicates via wireless.

Figure 2:
Network Transformer

Figure 3:
Network Transformer
7.5.9.3 - CEI - The Illuminating Company
Maintenance
Network Transformer Maintenance
People
CEI has one Underground Network Services Center responsible for performing preventive maintenance and inspections of the underground, including the networked secondary and non network ducted conduit systems. The service center is comprised of Underground Electricians who inspect and maintain the underground system.
Process
Network transformers are inspected on a six month basis as part of the Network Vault Inspection / Maintenance.
CEI performs transformer maintenance on a two year cycle. This inspection includes a visual inspection and recording of information such a the presence of any oil leaks, tank corrosion, top cleanliness, as well as recording the oil temperature, oil level, and pressure. In addition, the inspector will take temperature readings at the transformer terminals using a heat gun, looking for hot spots.
Inspectors will also take oil samples – the samples are drawn with the transformer energized.
CEI will do an Oil Screen test, which includes a Neutralization Number (acidity), Color, and Visual Examination, a Dissolved Gas Analysis (DGA) test, and an Oil Dielectric breakdown test on the transformer oil. Laboratory analysis is performed “in house” at FirstEnergy’s Beta laboratory. (The Oil Dielectric test is performed on site, while the DGA and Oil screen are performed in the (BETA Lab. ).
Technology
Transformer inspection data is recorded manually on the vault inspection form. See Attachment N.
Transformer oil test results are kept manually in a file at CEI. (This is also true of test results performed on CEI transformers that are located in customer vaults – normally non-network installations.)
The fact that the unit has been inspected is recorded in SAP, but not the specific information. This information may ultimately go into the Cascade system presently being implemented by FirstEnergy.
7.5.9.4 - CenterPoint Energy
Maintenance
Network Transformer Maintenance
People
Network transformer maintenance is performed as part of vault inspection and maintenance at CenterPoint. Vault Inspections are performed by the Relay group within Major Underground. The Major Underground organization includes Key Accounts, Engineering and Design resources, Support Services, and the field force responsible for all construction, operations and maintenance activities. The field force is divided into two main groups, the Relay group and the Cable group.
Both the Relay group and Cable group perform maintenance and inspection activities. The Relay group focuses on most of the non cable equipment inspection and maintenance, including performing vault equipment inspections, network transformer inspections, network protector testing, and other inspections and maintenance on devices with relays or motor operators. The Cable group focuses on inspections of cable, cable accessories and major equipment.
The Relay group is comprised of Network Testers. These field resources report to Crew Leaders, a non bargaining unit position at CenterPoint. The Relay group is led by an Operations Manager.
CenterPoint does not have dedicated maintenance crews. Rather, maintenance and inspection work is assigned to crews based on work priorities and resource availability.
Process
The Relay group performs periodic vault inspections, with most inspections on an annual period. Some high priority locations are inspected two or three times per year. The inspections are performed without de-energizing the vaults.
Network vault inspections include a visual inspection of the network transformer for oil leaks, corrosion, etc. Inspectors will also record peak temperature from the transformer temperature gauge. CenterPoint does not test network transformer oil as part of their network vault inspections, unless there is an indication of a potential problem such as a high temperature reading.
CenterPoint is using an inspection checklist to guide inspectors through the various items included in the inspection. This same checklist, entitled MUDG Functional Location Inspection Sheet is used to record findings from all inspection types, including the network vault inspections. An inspection sheet is completed for every location inspected.
Inspection findings that require follow up corrective maintenance are noted and recorded by the Crew Leaders who schedule this work for completion. Non urgent corrective maintenance actions that are identified during inspection may be held to be performed the next time a particular feeder is out of service. This is consistent with the approach used by many utilities.
If the solutions to the findings require the involvement of other groups, the Crew Leaders will solicit their help. For example, corrective maintenance activities that require a customer outage will require the assistance of the Key Accounts group to coordinate with the customer to schedule the outage.
The inspection sheets are filed by work center (each vault is considered a work center), so that CenterPoint has a record of the historic findings.
Technology
Vault inspection results are recorded manually on the MUDG Functional Location Inspection Sheet, See Attachment I
Vault inspections include the performance of infrared thermography.
7.5.9.5 - Con Edison - Consolidated Edison
Maintenance
Network Transformer Maintenance
People
I&A Mechanics within the Construction Group maintain network equipment, including network transformers and network protectors.
Construction Group
Con Edison’s service territory consists of four regions: Manhattan, Brooklyn/Queens, Staten Island, and Bronx/Westchester. The Manhattan Region is made up of three districts, including one headquartered at the W 28th St. Work Out Center. The term Work Out Center refers to a main office facility to which field construction and maintenance resources report. To provide a perspective on the size of a workout center, about 300 people work at the W 28th Street Work Out Center, and they can field about 125 crews.
The construction department consists of several groups:
-
Underground group
- The underground group is made up of splicers, who splice cable of all voltages.
-
I&A group (includes a services group)
- The I&A group installs and maintains network equipment, including transformers and network protectors. Within I&A in Manhattan, there is a services group dedicated to connecting customers to the distribution network. In other locations, the services group sits in a different part of the organization. This group does the splicing on the secondary system and deals with customer connection issues.
-
Subsurface construction (SSC) group
- The SSC deals with vaults, conduit ducts, and other civil work. Much of this work is contracted.
-
Cable group
- The cable group pulls in new cable and retires cable.
Field Engineering Group
Con Edison has a field engineering group consisting of 40 individuals who perform a variety of quality-assurance-related tasks including performing infrared inspections of network transformers. See Manhole Inspection and Maintenance - Field Engineering Group
Process
Inspection and Maintenance
Con Edison performs periodic maintenance and inspection of network distribution equipment, including network feeders, transformers, network protectors, grounding transformers, shut and series reactors, step-down transformers, sump pumps and oil minder systems, remote monitoring system (RMS) equipment, and vaults, gratings, and related structures.
Con Edison’s approach to performing an inspection is to inspect all the equipment and structures associated with a particular vault ID at a location regardless of category or classification, and even if the particular equipment associated with a particular vault ID resides within different compartments (for example, a transformer and network protector may be located in separate physical compartments even though they both share the same vault ID). This type of inspection is referred to as a CINDE Inspection, based on the name of their maintenance management system (Computerized Inspection of Network Distribution Equipment).
Con Edison performs inspections energized; crews do not take a feeder outage to perform inspections, perform pressure drop testing, or take transformer oil samples. Con Edison does not routinely exercise feeder breakers.
In an effort to more efficiently use their resources, and when nonpriority conditions allow, Con Edison takes advantage of situations where they have to enter a vault or manhole for a reason other than a scheduled inspection, and perform a nonscheduled inspection while they are in the vault. When the record of this nonscheduled inspection is recorded in CINDE, the system “resets the clock” for the next inspection date.
Network equipment at 208 V is generally inspected on a 5-year cycle. 460-V facilities, sensitive customers, facilities in flood areas, and other more critical locations are inspected more frequently, often annually. Con Edison establishes network equipment inspection cycles depending on two factors: the inspection category and the inspection classification .
The inspection category refers to the type of inspection, and includes a Visual Inspection, a 120/208-V Test Box Inspection, and a 460-V Test Box Inspection. The Visual Inspection includes activities beyond visually assessing condition and recording information, such as pressure drop testing and taking transformer oil samples. The test Box inspections involve specialized testing of network protectors with the network relay installed. Note that all of the elements of a Visual Inspection are performed along with the Test Box Inspections.
The inspection classification refers to characteristics of the inspection site that dictate the inspection cycle. For example, a “Routine” 208-V vault is visually inspected on a 5-year cycle, while a 208-V vault located in a “tidal” area would be visually inspected annually. Con Edison considers the following classifications in determining inspection cycles:
-
Routine
-
Back-feed: banks installed on a feeder involved in a back-feed incident
-
Candidate for Replacement: commonly due to corrosion damage
-
Essential Services: critical customers
-
Flooded Bank: nonsubmersible equipment that has experienced high water levels
-
208-V Isolated Bank: units that require more frequent inspection than distributed secondary grid units
-
Remote Monitoring System(RMS), Non RMS, Unit Not Reporting (UNR): Con Edison varies inspection cycles based on the level of remote monitoring installed
-
Tidal, Water, and Storm Locations
Note that Con Edison requires employees to perform at least a quick visual inspection (QVI) anytime an individual enters a network enclosure, even if the reason for entering an enclosure does not warrant a CINDE Inspection. This type of inspection (QVI) differs from the CINDE inspection category of Visual Inspection described above, in that it is not a full, accredited inspection.
Transformer Inspection
Transformers are inspected on varying schedules, depending on the inspection classification, but typically no longer an interval than six years. Transformer inspections are performed as part of the CINDE visual inspection.
Transformer inspections include:
-
Visually inspecting for leaks
-
Measuring pressure
-
Reading oil temperatures and levels
-
Taking oil samples for dielectrics and dissolved gas analysis
-
Performing pressure drop testing
-
Assessing condition of anodes and replacing if necessary
-
Performing a corrosion assessment
-
Checking bus condition
-
Checking condition of gaps/limiters and connections
-
For 460-V units, inspect low-voltage bushing boots for debris and seal integrity
Con Edison performs approximately 8,000 inspections annually.
Transformer Failure Analysis
Con Edison performs a root cause analysis of all network transformer removals including units that failed in service, units that were removed because of failed dissolved-gas-in-oil-analysis (DGOA), units that were removed because of failed oil temperature, pressure, or level indications from the RMS system, and units that failed during testing. See Maintenance - Failure Analysis - Transformer Failure Analysis for more information.
7.5.9.6 - Duke Energy Florida
Maintenance
Network Transformer Maintenance
People
Network transformer maintenance is performed by craft workers, Network Specialists and Electrician Apprentices, within the Network Group, part of the Construction and Maintenance Organization. The Network Group is led by a supervisor, and consists of ten craft workers, five Electric Apprentices and five Network Specialists (the journey worker position).
Duke Energy Florida’s construction and maintenance organization is divided into regions, with both Clearwater and St. Petersburg falling within their South Coastal Region. The Construction and Maintenance organization for the South Coastal Region is led by a General Manager.
The Network Group is organized functionally, and has responsibility for construction, maintaining and operating all urban underground infrastructure (ducted manhole systems), both network and non - network, in both Clearwater and St. Petersburg. Resources are assigned to either Clearwater or St. Petersburg based on work needs. Being a small group of resources, Duke Energy Florida rotates work assignments to assure that Network Specials are “jacks-of-all -trades”.
Process
Duke Energy Florida utilizes network transformers, mostly 500 kVA units, to supply its Clearwater network grid, a small network supplied by three feeders through about twenty network transformers. Duke Energy Florida also utilizes network transformers, mostly 750 kVA units, to supply its eight spot network locations in St. Petersburg.
Network transformer inspection and maintenance is performed in conjunction with the vault inspection. The vault inspection cycle varies depending on location and on equipment housed in the vault. For vaults that are part of the Clearwater network and house the network unit, Duke Energy Florida inspects each vault three times per year. In St. Petersburg, the spot network vaults are inspected annually.
Transformer inspections include a visual condition inspection and recording of oil level and temperature. Vault inspections also include infrared thermography (IR) and recording of IR measurements.
Information from the inspection is recorded on an inspection form, including an assessment of the priority or severity of the finding. See Attachment I . Information from the inspection is entered into a computer system, and the hard copy form is maintained in a file. Duke Energy Florida has a “Further Work Ticket Process” which is initiated to pursue remediation for corrective maintenance items identified by inspection. The repair schedule is dictated by the priority of the finding. For example, a leaky transformer must be reported to the environmental group within 24 hours of discovery and repaired within 30 days.
Duke Energy Florida is not performing network transformer oil sampling and testing as part of their vault maintenance process. They are considering reinstating oil sampling and testing and are experimenting with transformer dissolved gas sensing tied in with their Qualitrol system at one location.
Technology
Duke Energy Florida uses submersible network transformers to supply network customers. Transformer sizes range from 500 to 1500 kVA wye-wye, with most units in Clearwater being 500kVA units, and most in St. Petersburg being 750 kVA units (see Figures 1 and 2). The transformer nameplate voltage rating is 12470 GRD.Y / 7200 - 208Y/120.

Figure 1:
Network transformer supplying the grid (below grade vault)

Figure 2:
Network transformers supplying a spot (building vault)
Duke Energy Florida specifies units that are designed to eject fluids to the floor in the event of a transformer tank rupture.
Duke Energy Florida monitors network transformer and vault information in Clearwater using a system by Qualitrol. Using the Qualitrol transformer sensor module, they monitor transformer oil level and temperature, as well as the Oil Minder system associated with the vault sump pump, which can detect the presence of oil in the water and cease pump operation. Duke Energy has recently teamed with Qualitrol to pilot an installation using a dissolved gas monitor at one transformer location. The monitor itself fits into the drain port of the transformer and is tied into the Qualitrol receiver. Their goal is to build an algorithm that considers transformer vintage, DGA results, etc., and uses that information to trigger replacement.
7.5.9.7 - Duke Energy Ohio
Maintenance
Network Transformer Maintenance
(Network Transformer Oil Testing)
People
Duke Energy Ohio performs an inspection and samples oil from network transformers on a four year cycle[1] . The extracting and testing of the oil sample is performed by Network Service persons.
The inspection includes a visual inspection of the unit and the recording of information such a the presence of any oil leaks, tank corrosion, as well as recording the oil temperature, oil level, and pressure. In addition, the inspector will take temperature readings at the transformer terminals using a heat gun, looking for hot spots.
Process
Duke Energy Ohio de-energizes the primary feeder before taking the transformer oil samples. They try to coordinate the feeder outage so that they can perform other corrective maintenance work while the feeder is out of service.
At the time of the EPRI immersion, Duke was performing only dielectric tests of the transformer oil samples from network transformers. Samples are taken of both terminal chamber oil and transformer tank oil. Two samples of each are tested. This testing is being performed by Dana Avenue Network Service persons.
Duke Energy Ohio is considering adding Dissolved Gas Analysis testing for network transformers, and performing both the dielectric and DGA testing at their Queensgate laboratory, where they perform substation transformer oil testing.
Technology
Information from inspection is stored in Duke Energy’s Emax system.
[1] Distinct program from the vault inspection program
7.5.9.8 - Energex
Maintenance
Network Transformer Maintenance
People
See Preventative Maintenance and Inspection
Process
Energex has trained operators (substation mechanics) who are focused on performing routine substation inspections (RSIs) in relay operated substations, both the 110-kV:11 kV substations, and the C/I substations (11 kV: low voltage) that are supplied by the three-feeder meshed system in the CBD. There is a periodic visual inspection, and then there is also cyclical maintenance performed by these resources. Energex has approximately 30 substation mechanics in a group who perform this work. Energex is moving to performing a visual “security” inspection on a six-month cycle (assuring that the station is secure), and a full inspection, including a visual inspection and taking readings, once every 18 months (see Table 6-1). The inspector records the information on a manual form. The information is then given to a clerk and entered into the system. At the time of the immersion, Energex was developing a tool for substation inspectors to enter information on-site into a tablet, but have not yet implemented this system-wide.
For non-relay operated substations, such as a transformer with a ring main unit, the inspections are performed by joint fitters who work in the hub locations. As the inspector identifies findings, he categorizes it, and records the information on a form. The information is entered into the Ellipse system on return to the office.
Technology
7.5.9.9 - ESB Networks
Maintenance
Network Transformer Maintenance
(Oil Testing)
People
See Preventative Maintenance and Inspection
Process
ESB Networks uses sealed transformers in the MV-LV system, and therefore does not test oil levels at transformers. (Note that ESB Networks does sample and test oil on the larger transformers.)
At older MV substations, ESB Networks Network does have installed indoor oil ring main units. They have implemented a capital replacement program to systematically identify and replace all older style oil filled switchgear in their medium voltage stations with SF6 units. Their goal is to have only two types of gear installed - Magnefix and SF6 – by 2015.
Switchgear SF6 gases are checked on a routine basis as part of their MV substation inspection program.
Technology
7.5.9.10 - Georgia Power
Maintenance
Network Transformer Maintenance
People
The Georgia Power Network Underground group has maintenance crews who are responsible for performing vault inspections, including performing network transformer testing and maintenance. A typical maintenance crew is comprised of a Senior Cable splicer, Cable Splicer and a WTO. The maintenance crews report to a Distribution Supervisor, who is part of the Network Operations and Reliability group. The Network Operations and Reliability group is responsible for maintenance and operation of the network system.
The Operations and Reliability Group is part of the Network Underground group at Georgia Power, a centralized organization responsible for all design, construction, maintenance and operation of the network infrastructure for the company.
Transformer inspections are performed as part of the vault inspection program, performed on a 5 year cycle. Note, the network protector maintenance program is a separate program from the vault inspection.
Process
Georgia Power reports very good reliability of its installed transformers. Georgia Power primarily uses 500 / 1000 / and 2000kVA transformers at 208 /480V, with 3000kVA units where they have 4KV secondary.
Maintenance crews inspect and maintain the transformers on a five-year cycle, including the following:
-
Check for oil leaks, especially at the flanges, valves and other joints. Clean the valves if necessary.
-
Inspect the physical condition of the transformer. Make sure the top is clean and check for rust and the condition of the paint. The condition of the network protector is noted as well, but Georgia Power has a separate network protector inspection and maintenance cycle, and this transformer inspection does not re-set the network protector inspection clock.
-
Record transformer temperature readings and oil level readings. If oil levels are low, maintenance crews will add oil.
-
Inspect the switchgear at the site.
-
Verify the nameplate data on transformer and compare it to the inspection sheet. Note any discrepancies.
Georgia Power does not normally take oil samples and perform oil testing on network transformers unless there are unusual circumstances. They noted that they used to take routine samples, and found that the process of sampling the oil was introducing moisture and contaminants and leading to additional failures. For example, they believe that the inadvertent mixing of silicone, historically used in the switch compartment, with mineral oil, historically used in the termination compartment, may have resulted in failures of some terminations of oil-filled PILC cable. Georgia Power engineers noted that if implementing a process to sample and test transformer oil, it must be a clean process, with appropriate tools to filter the oil and avoid introducing contaminants into the transformer. Georgia Power has had good performance of their transformer fleet, with few failures over the past ten years.
Technology
Georgia Power uses an access data base for tracking inspection findings and triggering maintenance orders. When inspection information is entered into the Access database indicating a finding needing repair, system will create a maintenance order automatically based on the priority of the finding. The inspector receives a monthly report of the pending corrective maintenance jobs.
7.5.9.11 - HECO - The Hawaiian Electric Company
Maintenance
Network Transformer Maintenance
People
At HECO, underground maintenance work is performed by both Cable Splicers from the Underground group, and Lineman from the Overhead C&M groups.
The Underground Group at HECO is part of the Construction and Maintenance Division. The group is comprised of two UG supervisors, fifteen Cable Splicers, 2 Utility Mechanics, and 2 Utility Assistants. The Cable Splicer is the journeyman position in the department.
Note that the Underground group does not install or maintain network equipment such as network transformers or network protectors. Network equipment construction and maintenance is the responsibility of the Substation group at HECO. The Substation group is part of the Technical Services Division of the System Operations Department.
The Overhead C&M groups at HECO also perform maintenance work with underground facilities (normally, URD facilities). The journeyman position in the Overhead groups is a lineman.
HECO has an organization focused on performing inspections. This group is part of the C&M Planning group within the UG C&M Division.
HECO also employs a position known as a Primary Trouble Man (PTM) who performs most of the switching and clearance operations on the system. The PTM, Cable Splicer and Lineman are all bargaining unit positions.
Process
Network system preventive maintenance and inspection programs include:
| Program | Cycle or other Trigger |
| Manhole Inspection, including amp readings of molimiters. | Annual |
| Network Vault Inspection | 2-3 years – inspected during transformer and NP maintenance |
| Network Transformer Maintenance (Includes Oil Sampling and Pressure Testing) | 2 -3 years |
| Network Protector Maintenance | 2-3 years |
Non urgent corrective maintenance actions that are identified during inspection are put into a folder to be performed the next time a particular feeder is out of service. This is consistent with the approach used by many utilities.
7.5.9.12 - National Grid
Maintenance
Network Transformer Maintenance
People
Network transformer inspection and maintenance in Albany is performed by the UG field resources (network crews) that are part of Underground Lines East. This group is lead by a Manager, and includes a group focused on civil aspects of the underground system and a group focused on the electrical aspects. The Underground lines group is responsible for both the network and non – network infrastructure in eastern NY, including the Albany network.
The Electrical Group, comprised of Cable Splicers and Maintenance Mechanics, is led by three supervisors. Maintenance Mechanics perform inspection and maintenance of network equipment such as transformers and network protectors.
In addition, National Grid has a company-wide Inspections Department, led by a manager, responsible for completing regulatory required inspection programs. This group consists of supervisors assigned to the National Grid regions, and a union workforce to perform routine inspections. Note, however, that network transformer inspections and maintenance in Albany are performed by Underground Lines East maintenance mechanics.
Process
National Grid performs network transformer Visual and Operational (V&O) inspections annually as part of an annual network vault inspection. National Grid has a well documented procedure that describes the annual V&O inspection (See Attachment A). Inspections include a visual inspection of the transformer condition and performing activities such checking primary bushings and connectors for surface contamination, cracked porcelain, tracking, damaged or overheating cable elbows, checking transformer oil level and temperature, and a general condition assessment for leaks, signs of overheating, rust, and other problems or indicators. Various components are checked for overheating with an infrared thermometer.
Note that historically, transformer oil has not been sampled except when there are other indications of problems. At the time of the practices immersion, National Grid was considering implementing a five year oil sampling program to perform DGA on each fluid filled compartment of network transformers.
National Grid also obtains loading data during vault inspections.
National Grid has developed an Electrical Operating Procedure (EOP) which provides guidelines for prioritizing issues identified during inspection for repair. Various turnaround times for repair are specified depending on the categorization.
Level 1: Emergency - must be made safe within seven days.
Level 2: One year
Level 3: Three year
Level 4: Information purposes only
These levels were developed by asset and engineering groups based on past history and basic knowledge. Except for emergencies, inspections are not repaired immediately but are reported so that the inspection process can stay on task. Inspection information is entered directly into a mobile device using Computapole software, and a work order can be generated by the interface between Computapole and National Grid’s STORMS work management software (see Technology, below).
Technology
Crews use handheld devices (PDAs) to record inspection information. This unit has the required inspection information built into it, and a mapping feature. It also contains the most up-to-date system data and previous inspection results. Appropriate codes for the inspection are entered directly into the unit and returned to the supervisor for entry into the computer database. These codes alert GIS of changes in the field.
Computapole is a mobile utilities software platform that runs on handheld devices and is customized to meet National Grid’s specific needs. Computapole is used for inspections and mapping functions on handheld PDAs. Once information is entered in the Computapole system, work is managed by an interface with STORMS (below) to create work requests.
Severn Trent Operational Resource Management System (STORMS) is National Grid’s work management system. The work management system includes tools to initiate, design, estimate, assign, schedule, report time/vehicle use, and close distribution work. Computapole sends inspection information to STORMS to create work requests as needed.
7.5.9.13 - PG&E
Maintenance
Network Transformer Maintenance
(Network Transformer Oil Testing)
People
PG&E’s Maintenance & Construction Department is responsible for the maintenance of the underground network system in San Francisco and Oakland. All routine maintenance is undertaken at night in San Francisco in order to minimize the traffic disruption and congestion that could result from crews parking on city streets. Routine maintenance in Oakland is performed during the day.
There are normally four 3-man maintenance crews on the night shift in San Francisco, and a single 3 – man maintenance crew on the day shift in Oakland. The typical crew complement includes a Journeyman and two Transmission & Distribution (T&D) Assistants. In addition, there are crew foremen who oversee the maintenance work.
Transformer maintenance and oil sampling is performed by the maintenance crews,
PG&E has a well documented procedure for maintaining network transformers. (See Attachment G .)
Process
PG&E’s maintains and performs oil sampling and analysis annually on every network transformer. PG&E has been performing annual transformer maintenance since 2007, as part of a strategy to minimize the probability of a severe event in the network. Prior to the implementation of this strategy, PG&E had maintained transformers on a five year cycle, and did not routinely sample oil.
Since 2007, PG&E has examined sampled oil from over 3800 chambers annually. (The majority of transformers on the network system are designed with 3 chambers – the primary termination chamber, the primary ground switch chamber, and the main transformer tank chamber).
Network transformer maintenance and oil sampling are performed with the feeder de-energized.
The annual network transformer maintenance process is comprised of the following major steps:
-
Job Preparation
-
External Inspection
-
Oil Sampling
-
Pressure Testing
-
Completion of the Network Transformer Maintenance checklist.
The Job preparation step involves assembling appropriate materials and following all required safety precautions associated with entering the vault, such as conducting a job site tailboard, and monitoring air quality.
The external inspection begins with an inspection of the vault conditions, including the manhole cover, access ladder, vault lights, ventilation fan, sump pump, and vault floor for debris and water. This is followed by an inspection of the network transformer to check for any leaks, corrosion, ground connection issues, ground switch issues, as well as recording the temperature, oil level, and pressure (if available) of the main tank and the ambient vault temperature. (See Attachment G for a more detail on the transformer maintenance procedure.)
Oil samples are taken from each oil-filled compartment in bottles and syringes. Crews are carefully trained to follow the correct procedure for drawing oil samples so as not to contaminate the samples. For routine maintenance, information about the oil samples is entered into the Network Transformer Maintenance Checklist (See Attachment H) and will accompany the oil samples when they are submitted to the testing lab. Finally, before conducting a pressure test, the chambers are refilled, if necessary, and securely sealed. ) and will accompany the oil samples when they are submitted to the testing lab. Finally, before conducting a pressure test, the chambers are refilled, if necessary, and securely sealed.

Figure 1:
Extracting an Oil Sample

Figure 2:
Oil Sampling
Pressure testing of the chambers is conducted to detect internal leaks between the chambers as well as external leaks. The crews allow for a 15 minute interval between pressurizing any chamber and pressurizing the next chamber to detect internal leaks. Once all three chambers are pressurized, the crews wait for an hour to verify whether there are any external leaks. After the one hour period, pressure is reduced on all three chambers to approximately 1-2 psig.

Figure 3:
Topping off a chamber

Figure 4:
Pressure testing
Throughout the performance of the network transformer maintenance, findings are recorded on the Network Transformer Maintenance Checklist. (For a detailed description of the work procedures and the checklist refer to attachment G and attachment H .)
(Note: If the oil is being replaced, PG&E follows a separate procedure. An internal inspection of the chamber in which the oil is being replaced is performed, including a visual inspection of the all bushings, flanges, gaskets and hardware connections. At the conclusion of the procedure, the crews will take an oil sample that will be used as a “baseline” for future evaluations and trending for the particular chamber in question.
Oil Testing Process
The oil samples are sent to an external laboratory for analysis. At the conclusion of the testing, the laboratory forwards the results via an electronic copy both to the PG&E asset owner, and a copy is sent and recorded in a centralized PG&E database. (See Attachment k for an example of laboratory report). for an example of laboratory report).
PG&E performs the following tests:
-
Dissolved gas analysis (DGA)
-
Moisture content
-
Dielectric test (using ASTM D1816)
-
Fluid analysis to determine the percentage of oil by type in the sample
The asset owner analyzes each of the test reports, and assesses what further action is necessary. Should further action be necessary, a request is communicated to the Maintenance and Construction Department for scheduling and resolution. PG&E assigns a priority code to each request. The oil within transformer units with a high priority code is scheduled for replacement within 30 days, or where necessary, the entire transformer is replaced.
Due to the importance of the oil sampling program PG&E has undertaken additional steps to align the organization with the program. This includes:
-
Beginning in 2010, PG&E will begin to test the oil samples at their research and development center in San Ramon. During the transition phase to the internal laboratory, PG&E will test both internally and in an outside laboratory. This parallel testing ensures the consistency of results and provides verification for the work undertaken by PG&E’s laboratories.
-
Last year, the asset owner instituted an added oil identification test to identify the percentages of oils of different types in any one chamber. Historically, some chambers may have been topped off with oils of different types. This has the potential to create micro-bubbling that can generate partial discharge and prematurely breakdown the units. This oil mix also impacts the trigger levels at which action should be taken.
-
PG&E has contracted with an external vendor to review and make recommendations for oil sampling “triggers”. These “triggers” are the critical thresholds at which actions should be taken when certain elevated levels of gases are present in the oil. Much of the current industry thinking on these levels is based on higher voltage substation transformers. PG&E intends to develop a set “triggers” for both gas and moisture levels for lower voltage network distribution transformers that takes into consideration the type of unit as well as the type of insulating fluid used.
Technology
PG&E presently uses a manual checklist to record transformer maintenance information. They are planning to implement the use of tablet computers, where crews will enter information directly. Information would later (end of the shift) be downloaded into the main asset database.
PG&E is also planning to utilize bar codes on all of the transformer oil chambers and the network protectors. These bar codes would be used on the oil sample bottles and syringes to identify the chamber from which the sample was drawn.
PG&E is using an oil analysis system called Delta X to record and analyze oil data.
Maintenance work orders are now generated manually from PG&E’s SAP system. At the time of the immersion, PG&E was installing a work management system. This system will be tied directly to SAP, and will generate maintenance orders automatically based on network equipment maintenance procedures.
7.5.9.14 - Portland General Electric
Maintenance
Network Transformer Maintenance
People
The underground crews and Special Tester working in the CORE group perform inspection and maintenance of network transformers. Transformer inspections are typically performed at the same time as network protector maintenance, annually for locations with 480 V protectors, and every two years at 208 V locations.
The craft workers assigned to the CORE group, which is a part of the Portland Service Center (PSC), focus specifically on the underground CORE, including both radial underground and network underground infrastructure in downtown Portland. Their responsibility includes operations and maintenance of the network infrastructure. An Underground Core Field Operations Supervisor leads the CORE group. This supervisor reports to the Response & Restoration Area Line Manager (ALM).
The Special Tester is a journeyman lineman with additional training and technical skills. Outside the network, Special Testers work with reclosers and their settings, and perform cable testing and cable fault location. Within the network, the Special Tester works closely with the network protectors, becoming the department expert with this equipment. PGE has embedded one Special Tester within the CORE group, who is involved in NP maintenance and in performing associated network transformer inspections.
The Special Tester usually partners with cable splicers, working as part of a crew. The “special testing” crew includes the Special Tester, a crew foreman (a cable splicer), a lineman/cable splicer, and a topman, a non-journeyman helper. The topman stays outside the hole and watches the manhole/vault entrance for potential hazards.
If crews find any significant electrical problems during inspection, they normally involve the Distribution Engineers.
Process
The typical transformer sizes on the grid network are 500 kVA or 750 KVA units. For spot networks, transformers sizes range can be 500, 750, 1000, or 1500 kVA. The spot network vaults are customer-owned and can be above or below grade, with very few above grade although all are accessible from the street as a requirement. All the equipment is submersible, and PGE uses EPR cables to the transformers. (Where lead primary cables exist, PGE uses transitions to EPR to tie into network transformers.) The network has a few older installations with spot networks on the roof. PGE has not had any catastrophic failures of transformers, attributing this in part to a lightly loaded system and the fact that it does not utilize road salts in Portland. PGE does not remotely monitor the network transformers in any way, although a system for remotely monitoring transformer temperatures is planned.

Figure 1:
Spot network transformer
PGE’s network has 280 vaults that contain network transformers. Transformer inspections are typically performed at the same time as network protector maintenance, annually for locations with 480 V protectors, and every two years at 208 V locations. The inspection involves a visual inspection, recording of information from the transformer such as top oil temperature, and performing an IR scan to identify any hot spots. PGE does not use a formal inspection sheet, although readings from the protector and transformer are recorded in index cards. A crew also completes a Field Action Report if it finds issues with the vault that need follow up. If no action is needed, crews do not fill out any paperwork but notes the inspection in Maximo.
PGE is actively replacing lead cable terminations at the network transformer with Energy Services Network Association (ESNA) style connections. Crews modify the transformer termination chambers using a new conversion kit on site. First, they establish clearance. After that, crews cut the plate off the termination chamber, place a new termination, weld it, rewire the transformer, and re-energize. Crews have performed 6-12 of these conversions.
Transformer Oil Inspections: In addition to the periodic visual inspections described above, PGE does routinely sample and test oil in the network transformers. The CORE crews take the samples from all fluid-filled chambers and an external laboratory performs the analysis. Crews de-energize the primary circuit at the feeder breaker before performing oil sampling. They are not taking a clearance, as this is not considered performing physical work on the system. They try to schedule the pulling of oil in conjunction with feeder outages that may be scheduled for other reasons.
Historically, they performed oil sampling and testing on a four-year cycle, but they believe that the frequency should be more often so that they can spot trends rather than react to individual high readings. They are in the process of accelerating the sampling period and have not yet decided on a timeframe.
The type of oil analysis performed on transformer samples includes oil analysis, dissolved gas analysis (DGA), power factor testing, and polychlorinated biphenyls (PCB). PGE has started using FR3 type oil (ester) on all equipment other than the network transformers, although the change has not yet been completed. PGE will consider changing its network transformer specifications to the use of flame retardant oil alternatives in the future.
When entering the vault to perform transformer oil sampling, crews also perform a vault inspection, including a visual inspection and the use of IR.
Infrared (IR): As part of their transformer inspection program, crews perform an IR inspection of the major components with a FLIR camera. The Special Tester has more sophisticated equipment, so if the crews identify an issue, they call the Special Tester to undertake a more in-depth assessment. Crews use a feeder testing form, known as the Feeder Inspection Form,” to document any anomalies. If they find an IR anomaly, they record the load to rule out overloading as the cause.
The Special Tester also performs IR inspections of network feeders on a four-year cycle as part of the Quality and Reliability Program (QRP), a reliability-focused initiative aimed at critical infrastructure. The IR is undertaken on every component and joint, and the inspector looks for anything that shows a high temperature. The inspection is performed on every manhole and vault with cable running through it, and an inspection sheet is completed even if everything is found to be within limits. If the tester finds something abnormal, the inspector takes a picture and creates a report. The issue will be fixed within a week, and all reporting is by exception, with reports passed to the network engineering group. Most of the issues identified through IR inspection on the network have been associated with the primary terminations on the transformer.
In order to be more efficient, vault IR inspections are scheduled for the same time as the network protector/transformer inspections.
Technology
Maximo: PGE uses the Maximo for Utilities 7.5 system to manage inspection reports and store details about any maintenance needed.
Esters: PGE recently started using synthetic ester oils in transformers because they have better thermal conductivity, higher flash point, and higher temperature stability. They are miscible (a homogeneous mixture), with mineral oils and retrofitting transformers, which during service could bring longer-term cost benefits. These include higher flash point temperatures, lower fire risks, and being biodegradable, bringing environmental benefits. In addition, asset lifetime could be extended because the cellulose paper used in transformers will deteriorate more slowly. PGE plans to extend the use of synthetic ester oils to their network transformer fleet.
Remote Monitoring: PGE is not remotely monitoring transformer information. A system for remotely monitoring transformer temperatures is planned.
7.5.9.15 - SCL - Seattle City Light
Maintenance
Network Transformer Maintenance
People
Field crews perform network transformer maintenance as part of their network feeder maintenance
Field Crews complete a Network Transformer and Vault Inspection form, See Attachment I , for each transformer or switch vault inspected.
Process
Network Feeder Maintenance
When the field crews are sent out on feeder maintenance, they are issued a “maintenance package” that may include:
-
copies of a feeder map from their NetGIS system
-
“cut sheet,” which is a written description of the equipment in the vault produced from NetGIS, SCL’s in-house Oracle database
-
job orders for the work to be performed
-
field copy of the clearance contract
-
any urgent maintenance slips documenting items for maintenance that had been previously identified, but not resolved
-
Network transformer and switch vault inspection forms
-
Oil test report form, for recording information associated with the oil tests of the transformer switch and terminal chambers
-
maintenance checklist
-
copy of the previous device maintenance reports, or for newer equipment, a copy of the device install card (this allows crews to identify and track any ongoing problems or repairs form prior maintenance)
-
insulating oil test report (during feeder maintenance, crews take main tank oil samples. These are tested by SCL’s in-house lab, and an oil test report is issued and returned to the maintenance crew before the feeder is reenergized)
-
Earthquake Anchors for Network transformer order form, used to replace older I-beam supports with earthquake rails
-
prior Hi-pot test reports
Feeder maintenance includes a general inspection of the condition of the vaults, as well as performing network transformer inspection and maintenance. The maintenance requirements are defined in the SCL Vault and Transformer Maintenance Manual. See Attachment H .
Crews complete a Network Transformer and Vault Inspection form for each transformer or switch vault inspected.
Crews perform tests on each network transformer during feeder maintenance. Crews take oil samples from the transformer and the primary switch chamber. SCL maintains its own oil testing laboratory. They perform an acid test, interfacial tension testing, and dielectric testing of the oil. They do not do dissolved gas analysis.
Air switches and SF 6 switches are visually inspected. A vacuum pressure test is performed on vacuum switches (only five of them are in the system).
Technology
Maintenance records are kept in an Oracle-based database developed by SCL. This database is tied in with NetGIS, their network records and mapping database. This allows SCL to access feeder maps, vault information, inspection and maintenance records, and photographs of the vaults.
7.5.9.16 - Practices Comparison
Practices Comparison
Maintenance
Transformer Oil Testing

7.5.9.17 - References
EPRI Underground Distribution Systems Reference Book (Bronze Book)
7.5.9.18 - Survey Results
Survey Results
Maintenance
Network Transformer Maintenance
Survey Questions taken from 2019 survey results - Inspection Practices survey
Question 25 : Please indicate if your company performs the following Maintenance activities on a routine basis and at what frequency.


Question 26 : If you perform distribution transformer oil sampling and testing (network and non-network), have you established trigger points for action based on oil sampling results?


Survey Questions taken from 2018 survey results - Asset Management survey
Question 8 : Please indicate if your company performs the following activities on a routine basis and at what frequency.

Survey Questions taken from 2015 survey results - Maintenance
Question 85 : Please indicate if your company performs the following activities on a routine basis and at what frequency.


Question 90 : If you perform equipment fluid sampling and testing, please indicate which of these tests are performed? (check all that apply)


Survey Questions taken from 2012 survey results - Maintenance
Question 6.20 : Do you perform Equipment Fluid sampling and testing (such as transformer oil) as part of your maintenance?

Question 6.21 : If yes, what is the frequency of sampling?


Question 6.22 : If yes, please indicate which tests you perform


Question 6.23 : Do you regularly perform pressure testing to identify leaks in the primary termination chamber, ground switch chamber, and/or transformer tank?

Question 6.24 : If yes, what is the frequency of testing?

Survey Questions taken from 2009 survey results - Maintenance
Question 6.26 : Do you perform Equipment Fluid sampling and testing (such as transformer oil) as part of your maintenance? (This question is 6.20 in the 2012 survey)

Question 6.27 : If yes, what is the frequency of sampling? (This question is 6.21 in the 2012 survey)
Question 6.28 : If yes, please indicate which tests you perform (This question is 6.22 in the 2012 survey)


Question 6.30 : Do you regularly perform pressure testing to identify leaks in the primary termination chamber, ground switch chamber, and/or transformer tank? (This question is 6.23 in the 2012 survey)

Question 6.31 : If yes, what is the frequency of testing? (This question is 6.24 in the 2012 survey)

7.5.10 - Network Transformer Replacement Criteria
7.5.10.1 - Ameren Missouri
Maintenance
Network Transformer Replacement Criteria
People
Ameren Missouri has formed the “Underground Revitalization Department,” a team of engineers (all 4-yr degreed) focused on researching, evaluating, and developing plans for performing capital improvements to and revitalizing downtown St. Louis, including the network. As part of this group’s role, they are examining Ameren Missouri’s practices for inspecting and maintaining network infrastructure, and developing recommendations for optimal approaches.
They have developed a draft criteria used to evaluate, manage, and prioritize replacement of network transformers and protectors within downtown St. Louis. These criteria are based on key considerations such as the transformer’s age, location, physical condition, loading, history with similar transformers styles, and oil quality. Note that at the time of the EPRI practices immersion these criteria were in draft form.
Process
As part of its transformer replacement criteria, Ameren Missouri has developed a Network Transformer Replacement Criteria Scorecard, used to score the relative severity of non-field repairable issues identified in Ameren Missouri’s biennial network transformer inspections.
Each time a network transformer is inspected, data from the inspection is recorded on a network transformer inspection form. This information is entered into the scorecard contained within a database.
Each transformer’s scorecard in the database is updated when any criteria change as identified through inspection or any other means. Note that this database also contains engineering data for the network transformer and protector, such as dimensions, serial numbers, etc.
The scorecard itself enables an Ameren Missouri asset manager to assign a score to each of 12 different categories based on inspection findings. Each category is weighted, and the scorecard provides guidance to the Ameren Missouri inspector or asset manager in assigning an appropriate score.
As an example, one of the categories to be considered on the scorecard is the transformer age. The scorecard provides guidance to the inspector in assigning an “age score" based on the transformer’s age by providing the following criteria:
| Score | Observation |
| 10 | If > 60 years or age is unknown |
| 9 | If 51 to 60 years old |
| 6 | If 41 to 50 years old |
| 3 | If 31 to 40 years old |
| 1 | If 21 to 30 years old |
| 0 | If = or < 20 years old |
The age score is weighted and combined with the other inspection scores to produce an aggregate score which is used to prioritize replacement of transformers.
The categories which are included in the scorecard, and are thus considered in determining an overall transformer score are:
-
DGA & Oil Quality Analysis Results (oil quality analyses include Total Acid Number (TAN), Interfacial Tension (IFT), oil dielectric, and water content).
-
Leaking
-
Primary switch problems
-
Located in high traffic area
-
Corrosion
-
Loading
-
Age
-
Protector Problems or Protector Technology Change
-
Lead-cable termination compartments
-
Exposed to high fault current
-
Non-Standard Voltage Taps
-
Oil Type
The Ameren Missouri criteria document and scorecard provides guidance for scoring each of these categories based on inspection findings.
Technology
Information from the transformer inspections performed by the Distribution Service Testers is updated in the Ameren Missouri’s Circuit and Device Inspection System (CDIS) by the Underground Engineering group. The CDIS includes an algorithm that assigns a “structural score” and an “electrical score” based on the inspection findings, scoring, and weightings for various findings developed by Ameren Missouri. The scores are used to prioritize remediation.
CDIS is also used to produce reports that summarize inspection findings and a dashboard that monitors inspection progress
See the Attachment for draft copy of the Ameren Missouri Network Transformer Replacement Criteria Scorecard[1] .
[1] from Ameren Missouri Transformer Replacement Criteria Draft , developed by the Downtown St. Louis Underground Revitalization Team.
7.5.10.2 - Duke Energy Florida
Maintenance
Network Transformer Replacement Criteria
People
Power Quality, Reliability and Integrity (PQR&I) has responsibility for all Asset Management at Duke Energy Florida. Within that department, network assets within Florida, including network transformers, are managed by three Asset Managers.
Process
Duke Energy Florida uses a Qualitrol transformer sensor module to monitor transformer oil level and temperature, as well as the Oil Minder system associated with the vault sump pump.
Duke Energy has recently teamed with Qualitrol to pilot an installation of a dissolved gas monitor at one transformer location. The monitor itself fits into the drain port of the transformer and is tied into the Qualitrol receiver. Their goal is to build an algorithm that considers transformer vintage, DGA results, etc., and uses that information to trigger replacement.
Technology
Duke Energy Florida monitors network transformer and vault information in Clearwater using a system by Qualitrol.
7.5.10.3 - Energex
Maintenance
Network Transformer Replacement Criteria
7.5.10.4 - ESB Networks
Maintenance
Transformer Replacement Criteria
People
Network design at ESB Networks, including transformer replacement criteria, is performed by planning engineers within the Network Investment groups – one responsible for planning network investments in the North, and the other for planning in the South.
Organizationally, the Network Investment groups, both north and south, are part of the Asset Investment organization. In addition to the Network Investment groups, the Asset Investment organization is also comprised of a Generation Investment group and a Specifications group, each led by a manager. The Asset Investment group is part of Asset Management.
Network design standards and transformer replacement criteria are developed jointly between the Asset Investment group and the Strategy Manager, which is part of the Finance and Regulation group within Asset Management.
Process
As a part of its five-year planning cycles, ESB Networks has multiple capital replacement programs to identify and replace aging transformers. It is also systematically modernizing and standardizing its systems. For example, it is in the process of replacing rural 10-kV transformers with 20-kV transformers as part of its conversion to 20kV.
Also, although most of Dublin’s transformers are pad-mounted or located in building vaults, it must still replace a few remaining submersible transformers in the Dublin area.
7.5.10.5 - Survey Results
Survey Results
Maintenance
Network Transformer Replacement Criteria
Survey Questions taken from 2018 survey results - Asset Management survey
Question 26 : Are you implementing targeted replacement programs for any of the following equipment?


Question 27 : If Yes, are any of your replacement programs Aged based, such as replacing all transformers >50 years old?


Question 28 : If Yes (to question 26), are any of your replacement programs Design based, such as replacing all high rise fluid filled transformers with dry type units, or replacing a certain type of cable?


7.5.11 - Network Vault Inspection - Maintenance
7.5.11.1 - AEP - Ohio
Maintenance
Network Vault Inspection - Maintenance
People
Vault inspections are performed on a one-year cycle and are normally combined with inspection of network equipment, which is also inspected on a one-year cycle. Inspections may be performed by Network Mechanics, Network Crew Supervisors, and contractors. Contractors are used to make civil repairs identified through inspection.
Process
All vaults are inspected on a yearly basis as part of the AEP Ohio electrical equipment inspection schedule. More specifically, inspections include:
| Clean and inspect | 1 year |
| Power wash as needed | As needed |
| Check ventilation fans | Between May and September |
| Check and pump water | After a major rain storm |
| Check for equipment oil leaks | 1 year |
| Take counter/oil level/temp readings | First month, then 1 year |
| Check limiters (current readings) | 1 year |
| Perform infrared inspection | 1 year – 20% of vaults |
(See Attachment E for a sample Vault Inspection Form.)
Technology
Crews use a modified bread truck for inspections, which includes equipment for pumping out any water in manholes. A practice of note is the organized and well-equipped features of these trucks. AEP Ohio has configured and modified these trucks to its own specifications (see Figures 1 and 2).

Figure 1:
AEP Ohio 'bread' truck with easy-access, low tailgate

Figure 2:
AEP Ohio 'bread' truck – interior view
Crews have computers in every truck. Printed and online forms are available. Conditions of the manhole are captured in the AEP NEED (Network Enclosure and Equipment Database). When information is entered into NEED, repair or replacement priorities are noted.
AEP Ohio performs an inspection using infrared thermography (IR) every time a worker enters a vault (see Figures 3 and 4). This inspection is being performed as a manhole entry safety practice, and has been in place for about five years. IR cameras are used to identify hot spots in the vault, with inspectors “shooting” joints, crabs, and cables. The rule of thumb for action is if a spot on a joint, for example, shows a difference of 40 degrees C or more, then crews will replace the joint. AEP Ohio employees noted that early on they identified and rectified problems, but that now, they rarely encounter hot spots.

Figure 3:
AEP Ohio Network Mechanic using infrared camera

Figure 4:
Infrared camera
7.5.11.2 - Ameren Missouri
Maintenance
Network Vault Inspection - Maintenance
People
The majority of the maintenance and inspection programs associated with network equipment, including vault inspections, are performed by resources within the Service Test group.
Organizationally, the Service Test group is part of Distribution Operations, led by a manager. Within Distribution Operations, there is a Reliability Support Services group led by superintendent. Reporting to the Superintendent Reliability Support Services are both the Service Test group led by a supervisor and the Distribution Operating group, also led by a supervisor.
The Service Test group is made up of Service Testers and Distribution Service Testers. It is the Distribution Service Testers who perform vault inspections, as well as network protector maintenance and calibration, and transformer maintenance including oil testing. The Service Testers perform low-voltage work only, such as voltage complaints, RF interference complaints, and testing and maintaining batteries.
Recently, Ameren Missouri has formed the “Underground Revitalization Department,” a team of engineers (all 4-yr degreed) focused on researching, evaluating, and developing plans for performing capital improvements to and revitalizing downtown St. Louis, including the network. As part of this group’s role, they are examining Ameren Missouri’s practices for inspecting and maintaining network infrastructure, and developing recommendations for optimal approaches. They have developed a draft document which details strategies for inspection and maintenance of network units, cable systems, vaults, manholes, indoor rooms and customer switchgear.
Process
The Missouri Public Service Commission (PSC) requires that a visual inspection of vaults in urban areas be performed on a four year cycle. Ameren Missouri prepares reports and issues reports to the PSC that document its performance of regulatory required inspection programs.
For network vaults, Ameren Missouri is exceeding this requirement, entering each vault annually to perform and record cable limiter continuity measurements, and entering each vault every two years to perform a detailed inspection in conjunction the performance of transformer and network protector maintenance.
Each spring, prior to the summer heating season, Distribution Service Testers (2 man crews) enter each network vault to conduct secondary cable load and voltage measurements in order to identify open limiters. Crews also record temperature readings. Information is recorded on an inspection form. Note that at the time of the practices immersion, Ameren Missouri was considering, but not performing infrared scans as part of this inspection.
Every two years, Distribution Service Test crews enter each network vault to perform a detailed visual inspection as well as perform network transformer and network protector maintenance.
The visual inspection includes the following steps:
-
Record the vault number, address/location.
-
Visually inspect and photograph the vault and note the following structural and electrical information:
-
Grating sits flush and is not worn or deformed
-
Safety cage opens properly and sits well when opened
-
Inspect the ceiling for any cracking, bulging and water leaks. Capture the total amount of cracks and describe the widest and longest crack
-
-
Inspect the walls for any cracking, bulging, water leaks or if any of the wall is missing. Capture the total amount of cracks and describe the widest and longest crack
-
The type of floor material, its finish, how it drains and any cracking.
-
Visually inspect the bus bars for rust or cracks and check to see that the supports are secured to the ceiling.
-
Note if the wall is painted and the condition of the epoxy paint.
-
Visually inspect that the cable supports are secured to the wall.
-
Inspect the network monitoring equipment for proper operation.
-
Note any excessive debris on the floor that could be due to collapsing walls or ceiling or if it is debris from public.
-
Record the type of lighting in the vault and replace any burnt out bulbs.
Ameren Missouri has developed a Structural Inspection Training Manual for Vaults, a guideline that guides Distribution Service Testers in performing visual inspections of vault structures. See Attachment I
When performing the biennial inspection of network vaults, Distribution Service Testers take photographs of the vault interior and record this information on computers.
The biennial inspection also includes transformer maintenance and oil sampling from the transformer and switch compartment tanks, and protector maintenance and calibration.
Ameren Missouri has a separate program for sampling the oil of the primary termination compartment on the network unit. These samples are taken with the primary feeder de-energized.
Indoor Rooms, which are building vaults supplied with non - network service types typically fed with dual feeds (preferred / reserve schemes), are inspected on a 4 yr cycle. These inspections include visual inspections of the transformers, switches and vault condition. The inspections also include heat gun checks to identify any hot spots.
Information from the indoor room inspections are recorded on inspection forms.
Ameren Missouri is not performing transformer oil testing of non-network transformers.
Technology
Inspection of Network Vaults and Service Compartments (adjacent manholes with bus work) is recorded on laptops or on paper forms by the Distribution Service Testers. Pictures and inspection findings recorded on manual forms are entered into both local databases and into the Circuit and Device Inspection System (CDIS) by the Service Test department. (This is the same software used by contractors to record information from Ameren Missouri’s manhole inspection program)
The CDIS includes an algorithm that assigns a “structural score” and an “electrical score” based on the inspection findings and weightings for various findings developed by Ameren Missouri. The scores are used to prioritize remediation.
CDIS is also used to produce reports that summarize inspection findings and a dashboard that monitors inspection progress.
Ameren Missouri has installed a remote monitoring system within their network vaults. This system uses ETI electronic metering in the network protector relay with monitoring points aggregated in a vault wall mounted box that communicates via wireless. Their monitoring includes voltage by phase, amps by phase, protector status, transformer oil top temperature, and water level in the vault. Note that Ameren Missouri is not using fire alarm systems within their network vaults.
Information from the vault can be accessed on the computer, provided by a third party service provider (Telemetric). The system also enables Ameren Missouri to request status by polling the protectors. Finally, the system provides the ability to look at historical readings for analysis.
At the time of the practices immersion, Ameren Missouri was piloting the use of an arc detection tool (the Exactor. 80 of their network manholes were surveyed with the tool. Ameren Missouri had previously used this technology on their overhead system. Initial findings showed three of the 80 locations with some level of arc emissions.

Figure 1:
Indoor Room transformer

Figure 2:
Indoor Room primary switch (S\&C Metal Enclosed Mini-Rupter Switch

Figure 3:
Typical Network Vault - Primary side

Figure 4:
Typical Network Vault - Secondary

Figure 5:
Wireless communication box for network monitoring system

Figure 6:
ETI Microprocessor NP Relay
7.5.11.3 - CEI - The Illuminating Company
Maintenance
Network Vault Inspection - Maintenance
People
CEI has one Underground Network Services Center responsible for performing preventive maintenance and inspections of the underground, including the networked secondary and non network ducted conduit systems. The service center is comprised of Underground Electricians who inspect and maintain the underground system.
Process
Network vaults are being inspected every six months. The inspection is similar to the manhole inspection in that it includes a visual inspection of the equipment contained with in the vault, such as cables, splices, moles, and sump pumps, as well as the condition of the vault itself.
The network transformer will be inspected for oil leaks, corrosion, etc.
Inspectors are to take amperage readings of secondaries on the load side of cable limiters to assure cable limiter continuity. In practice, this is sometimes done, and sometimes overlooked.
During the inspection, the vault will be cleaned of any debris.
Any urgent findings are immediately addressed. Non urgent corrective maintenance actions that are identified during inspection are put into a folder to be performed the next time a particular feeder is out of service.
Technology
Vault inspection / maintenance results are recorded manually on a Network Vault inspection/maintenance forms.
(See Attachment M) and Attachment N). ).
7.5.11.4 - CenterPoint Energy
Maintenance
Network Vault Inspection - Maintenance
People
Vault Inspections are performed by the Relay group within Major Underground. The Major Underground organization includes Key Accounts, Engineering and Design resources, Support Services, and the field force responsible for all construction, operations and maintenance activities. The field force is divided into two main groups, the Relay group and the Cable group.
Both the Relay group and Cable group perform maintenance and inspection activities. The Relay group focuses on most of the non cable equipment inspection and maintenance, including performing vault equipment inspections, network protector testing, and other inspections and maintenance on devices with relays or motor operators. The Cable group focuses on inspections of cable, cable accessories and major equipment.
The Relay group is comprised of Network Testers. These field resources report to Crew Leaders, a non bargaining unit position at CenterPoint. The Relay group is led by an Operations Manager.
CenterPoint does not have dedicated maintenance crews. Rather, maintenance and inspection work is assigned to crews based on work priorities and resource availability.
Process
The Relay group performs periodic vault inspections, with most inspections on an annual period. Some high priority locations are inspected two or three times per year. The inspections are performed without de-energizing the vaults.
The inspections include a visual inspection of the vault, infrared inspection of all connections including bus connections and cable connections, load measurements; and operating equipment that can be operated without interrupting customers, such as tripping and closing network protectors.
Network vault inspections will include a visual inspection of the network transformer for oil leaks, corrosion, etc. They will also record peak temperature from the transformer temperature gauge. CenterPoint does not test network transformer oil as part of their network vault inspections, unless there is an indication of a potential problem such as a high temperature reading.
During the inspection, the vault will be cleaned of any debris.
CenterPoint is using an inspection checklist to guide inspectors through the various items included in the inspection. This same checklist, entitled MUDG Functional Location Inspection Sheet is used to record findings from all inspection types, including the network vault inspections. An inspection sheet is completed for every location inspected.
Inspection findings that require follow up corrective maintenance are noted and recorded by the Crew Leaders who schedule this work for completion. Non urgent corrective maintenance actions that are identified during inspection may be held to be performed the next time a particular feeder is out of service. This is consistent with the approach used by many utilities.
If the solutions to the findings require the involvement of other groups, the Crew Leaders will solicit their help. For example, corrective maintenance activities that require a customer outage will require the assistance of the Key Accounts group to coordinate with the customer to schedule the outage.
The inspection sheets are filed by work center (each vault is considered a work center), so that CenterPoint has a record of the historic findings.
Technology
Vault inspection results are recorded manually on the MUDG Functional Location Inspection Sheet, See Attachment I .
Vault inspections include the performance of infrared thermography.
7.5.11.5 - Con Edison - Consolidated Edison
Maintenance
Network Vault Inspection - Maintenance
People
Field Engineering Group
Con Edison has a field engineering group consisting of 40 individuals who perform a variety of quality-assurance-related tasks including:
-
Inspections/manhole inspections
-
Post-construction inspections to determine to adherence to Specifications
-
Safety inspections
-
Critical manhole inspections, performed in any manhole on the immediate block of a substation, and inspected on a three-year cycle
-
Regular manhole/vault inspections, scheduled every five years
-
Infrared inspections of transformers/network protectors/substations
-
Infrared is a four-year cycle for 277/480-V installations.
-
Infrared is not programmatic, but is performed randomly, or by exception at 120/208 V. Infrared inspections are performed more frequently at sensitive customer locations such as hospitals and museums.
-
Substation infrared is annual.
-
Use strategically placed site glasses to obtain infrared views of some locations.
-
Use outside contractor to perform infrared training.
-
-
Cable and Joint failure analysis specimen retrieval and tracking
-
Fill-in work, special requests
-
Check out erroneous readings monitored through the RMS system
-
Map verification; that is, comparing what is on the mapping system to what is in the field
-
Random spot checks, focused on workmanship
-
Random equipment checks
- For example, the Field Engineering group performs random monthly spot checks of primary splice packs to be sure that the kit is complete.
-
Respond to voltage complaints
Note: This group does not routinely inspect design versus build, or as-built versus mapped.The department is made up primarily of Splicers. People are chosen for jobs in the department by seniority.
Process
Inspection and Maintenance
Con Edison performs periodic maintenance and inspection of network distribution equipment, including network feeders, transformers, network protectors, grounding transformers, shut and series reactors, step-down transformers, sump pumps and oil minder systems, remote monitoring system (RMS) equipment, and vaults, gratings, and related structures.
Con Edison’s approach to performing an inspection is to inspect all the equipment and structures associated with a particular vault ID at a location regardless of category or classification, and even if the particular equipment associated with a particular vault ID resides within different compartments (for example, a transformer and network protector may be located in separate physical compartments even though they both share the same vault ID). This type of inspection is referred to as a CINDE Inspection, based on the name of their maintenance management system (Computerized Inspection of Network Distribution Equipment).
Con Edison performs inspections energized; crews do not take a feeder outage to perform inspections, perform pressure drop testing, or take transformer oil samples. Con Edison does not routinely exercise feeder breakers.
In an effort to more efficiently use their resources, and when nonpriority conditions allow, Con Edison takes advantage of situations where they have to enter a vault or manhole for a reason other than a scheduled inspection, and perform a nonscheduled inspection while they are in the vault. When the record of this nonscheduled inspection is recorded in CINDE, the system “resets the clock” for the next inspection date.
Network equipment at 208 V is generally inspected on a 5-year cycle. 460-V facilities, sensitive customers, facilities in flood areas, and other more critical locations are inspected more frequently, often annually. Con Edison establishes network equipment inspection cycles depending on two factors: the inspection category and the inspection classification .
The inspection category refers to the type of inspection, and includes a Visual Inspection, a 120/208-V Test Box Inspection, and a 460-V Test Box Inspection. The Visual Inspection includes activities beyond visually assessing condition and recording information, such as pressure drop testing and taking transformer oil samples. The test Box inspections involve specialized testing of network protectors with the network relay installed. Note that all of the elements of a Visual Inspection are performed along with the Test Box Inspections.
The inspection classification refers to characteristics of the inspection site that dictate the inspection cycle. For example, a “Routine” 208-V vault is visually inspected on a 5-year cycle, while a 208-V vault located in a “tidal” area would be visually inspected annually. Con Edison considers the following classifications in determining inspection cycles:
-
Routine
-
Back-feed: banks installed on a feeder involved in a back-feed incident
-
Candidate for Replacement: commonly due to corrosion damage
-
Essential Services: critical customers
-
Flooded Bank: nonsubmersible equipment that has experienced high water levels
-
208-V Isolated Bank: units that require more frequent inspection than distributed secondary grid units
-
Remote Monitoring System(RMS), Non RMS, Unit Not Reporting (UNR): Con Edison varies inspection cycles based on the level of remote monitoring installed
-
Tidal, Water, and Storm Locations
Note that Con Edison requires employees to perform at least a quick visual inspection (QVI) anytime an individual enters a network enclosure, even if the reason for entering an enclosure does not warrant a CINDE Inspection. This type of inspection (QVI) differs from the CINDE inspection category of Visual Inspection described above, in that it is not a full, accredited inspection.
Technology
Inspection and Maintenance Software
Con Edison uses legacy maintenance management software called CINDE, which is an acronym for Computerized Inspection of Network Distribution Equipment. CINDE is a system that records inspection data and initiates inspections based on predetermined cycles. These cycles depend on the category of inspection (for example, a visual inspection versus a “Test Box” inspection) and various predetermined classifications of inspections (for example, a “Routine” 208-V vault is visually inspected on a 5-year cycle, while a 208-V vault located in a tidal area is visually inspected annually).
Con Edison inspectors record inspection data on hand-held devices (Tough Books). The utility requires that the inspection data be downloaded into the CINDE – Mainsaver system (Mainsaver is the part of the CINDE system used to record data) within three days following the inspection. Inspection data that is entered into the CINDE system includes:
-
Equipment serial numbers
-
As-found and abnormal conditions, such as transformer oil level, state of corrosion, and water in the vault
-
Defective equipment or structures
-
Repairs or change-outs undertaken
-
As-left condition, such as transformer pressure and liquid level, and pressure of housing
The CINDE – Mainsaver system is also used by Con Edison to prioritize follow-up work, or outstanding defects to be corrected that are identified through inspection or other visits to network enclosures. The Electric Operations Region is responsible for prioritizing follow-up work by considering the location of the work with respect to risk to public safety, reliability impact, the type of installation, age of the outstanding defect, and the efficient use of resources.
7.5.11.6 - Duke Energy Florida
Maintenance
Network Vault Inspection - Maintenance
People
Vault inspections are performed by craft workers, Network Specialists and Electrician Apprentices within the Network Group, part of the Construction and Maintenance Organization. The Network Group is led by a supervisor, and consists of ten craft workers, five Electric Apprentices and five Network Specialists (the journey worker position).
Duke Energy Florida’s construction and maintenance organization is divided into regions, with both Clearwater and St. Petersburg falling within their South Coastal Region. The Construction and Maintenance organization for the South Coastal Region is led by a General Manager.
The Network Group is organized functionally, and has responsibility for construction, maintaining and operating all urban underground infrastructure (ducted manhole systems), both network and non - network, in both Clearwater and St. Petersburg.
Process
The vault inspection cycle varies depending on location and on equipment housed in the vault. For vaults that are part of the Clearwater network and house the network unit, Duke Energy Florida inspects each vault three times per year. In St. Petersburg, the spot network vaults are inspected annually. For vaults that contain network feeder sectionalizing switches, or automatic transfer switches in Clearwater and St. Petersburg, the inspection frequency varies from annually to up to six times a year, based on the vault condition and criticality of the devices (for example, switchgear associated with hospitals are inspected and maintained from three to six times per year).
Vault inspections are comprehensive, and include vault cleaning, assessment of the civil infrastructure, visual inspection and recording of information from the network transformer and network protector including loading, and visual inspection of cables and other components. Vault inspections also include infrared thermography (IR) and recording of IR measurements. See Attachment I .
Information from the inspection is recorded on an inspection form, including an assessment of the priority or severity of the finding. See Attachment I . Information from the inspection is entered into a computer system, and the hard copy form is maintained in a file. Duke Energy Florida has a “Further Work Ticket Process” which is initiated to pursue remediation for corrective maintenance items identified by inspection. The repair schedule is dictated by the priority of the finding. For example, a leaky transformer must be reported to the environmental group within 24 hours of discovery and repaired within 30 days.
Technology
Duke Energy Florida is not performing network transformer oil sampling and testing as part of their vault maintenance process. They are considering re instating oil sampling and testing and are experimenting with transformer dissolved gas sensing tied in with their Qualitrol system at one location.
7.5.11.7 - Duke Energy Ohio
Maintenance
Network Vault Inspection - Maintenance
People
Duke Energy Ohio performs network vault inspections quarterly. The inspections are performed by Dana Avenue Network Service Person field crews.
Inspection findings are recorded on a vault inspection sheet.
Duke does not vary its inspection cycle based on an assessment of the Vault criticality (high risk holes versus low risk holes). However, Duke Energy Ohio will, at times, restrict its inspection to a review of the high-priority items within the vault.
Process
In advance of performing the vault inspection, Duke will provide the inspection crew a copy of the vault inspection sheet, which is a form pre-populated with certain information about the vault, its contents, and its condition. See Attachment G for a sample blank Vault Inspection Sheet.
The vault inspection includes an assessment of the general condition of the vault, recording of the readings from the gauges on the transformer, checking the protector readings, and counting the protector trips. The quarterly inspections do not include taking current or voltage readings, or obtaining transformer oil samples. Note that Duke Energy Ohio is sampling transformer oil as part of a separate, four year program.
Technology
Vault inspection forms and findings are maintained in an Excel file. This is an interim file, with inspection findings them being installed in the Emax system.
7.5.11.8 - Georgia Power
Maintenance
Network Vault Inspection - Maintenance
People
Vault Inspections may be performed by either Duct Line Mechanics or Cable Splicers who report to the Maintenance supervisor (a Distribution supervisor), within Network Operations and Reliability. Although the Georgia Power Network Underground group does not have specific crews assigned to vault inspections, the maintenance group will pull available crew members to maintain its inspection schedule for vaults. A typical maintenance crew is comprised of a Senior Cable splicer, Cable Splicer and a WTO. The maintenance crews report to a Distribution Supervisor, who is part of the Network Operations and Reliability group. The Network Operations and Reliability group is responsible maintenance and operation of the network system.
Process
All vaults are inspected on a five-year basis, throughout the state of Georgia. Prior to inspections, the supervisor uses an Access database program to generate a blank form already populated with some specifics about the configuration of the particular vault to be inspected, if a crew has populated the data base with information during construction or during a previous inspection. The printed inspection form does not have previous findings pre populated, assuring that the field crews must perform and record an updated inspection. Once completed, the form is populated into the Access system. Forms are retained in hard copy for seven years.
The inspection form has a well-defined checklist of items that must be inspected, including the following:
-
Inspection of the vault grates, where applicable.
-
Structural inspection of the roof slab, duct base, and duct lines.
-
Air Quality check to make certain there are no toxins or gas buildup.
-
Transformer inspection and maintenance (See Transformer Maintenance)
-
Electrical inspection, including any street mains / secondary cables. If cables are not tagged or tags are missing, the inspection crew tags them on the spot. Street mains are not tagged. Cable tags are placed on the primary cables and on customer services.
-
Network protector may be inspected as well, although a separate crew is responsible for protector inspection and maintenance, as part of a distinct maintenance program. (See Network Protector Maintenance)
-
Condition of cable splices is noted.
(See Attachment F)
A notable exception to the vault inspection frequency is the Atlanta airport, which is inspected yearly, along with other select high-priority sites. Nearly 20 percent of all inspections occur outside the Atlanta metro area in other regions where Georgia Power has network underground installations.
If the vault contains water, crews must pump out the water prior to entry. Most vaults have sump holes, and a portable pump can be dropped into the hole. Water is typically pumped through a special filter sock to trap any oil in the water before pumping it into the street. Georgia Power has very few vaults with permanent sump pump installations (See Figure 1.).

Figure 1:
Sump hole in vault
If work needs to be performed, the supervisor of the crew determines whether the maintenance can be performed on-the-spot; otherwise, a maintenance work order is sent in by the supervisor, including notes and a prioritization of the maintenance. It is up to the supervisor to determine how critical the maintenance or repair is, and the inspection form reflects the priority, as well as direct communication with the appropriate workgroup within Network Underground.
Georgia Power’s Operation and Test procedure for Manhole and Vault Maintenance specifies three levels of priority for inspection times. The procedure does not specify time frames for completion of corrective maintenance.
Priority # 1 - the most urgent, and requires immediate attention
Priority # 2- needs attention very soon
Priority # 3- needs attention when it can be scheduled
Technology
When a supervisor enters inspection information into the Access database, and the inspection indicates that something needs repair, the system will create a maintenance order automatically.
The inspector receives a monthly report of the pending corrective maintenance jobs.
Where possible, the inspection information can also be entered into the DistView software system. With DistView, inspectors can log onto the company intranet with a wireless laptop and enter data about inspections into pre-determined fields and also add notes as findings are top-of-mind at the site and time of the inspection.
Georgia Power does not perform an infrared inspection as part of its routine vault inspection. However, infrared thermography is performed at high profile locations. Georgia Power does not routinely take and record photographs of inspection findings.
7.5.11.9 - HECO - The Hawaiian Electric Company
Maintenance
Network Vault Inspection - Maintenance
People
HECO Substation resources perform maintenance and inspection of network equipment.
HECO currently is not performing any programmatic inspection and maintenance of their non-network underground facilities.
Process
Network system preventive maintenance and inspection programs include:
| Program | Cycle or other Trigger |
| Manhole Inspection, including amp readings of molimiters. | Annual[1] |
| Network Vault Inspection | 2-3 years – inspected during transformer and NP maintenance |
| Network Transformer Maintenance (Includes Oil Sampling and Pressure Testing) | 2 -3 years |
| Network Protector Maintenance | 2-3 years |
Non urgent corrective maintenance actions that are identified during inspection are put into a folder to be performed the next time a particular feeder is out of service. This is consistent with the approach used by many utilities.
[1] HECO’s desired schedule is to perform these inspections and take amp readings annually. In practice, they have not adhered to this schedule.
7.5.11.10 - National Grid
Maintenance
Network Vault Inspection - Maintenance
People
Network vault inspections in Albany are performed by the UG field resources (network crews) who are part of Underground Lines East. This group is led by a Manager, and includes a group focused on civil aspects of the underground system and a group focused on the electrical aspects. The Underground Lines group is responsible for both the network and non – network infrastructure in eastern NY, including the Albany network.
The Electrical Group, comprised of Cable Splicers and Maintenance Mechanics is led by three supervisors. Maintenance Mechanics perform network vault inspections and maintenance of network equipment contained in the vaults such as transformers and network protectors.
In addition, National Grid has a company-wide Inspections Department, led by a manager, responsible for completing regulatory required inspection programs. This group consists of supervisors assigned to the National Grid regions, and a union workforce to perform routine inspections. Note, however, that network vault inspections within Albany, as well as inspection and maintenance of network equipment contained within the vaults, is performed by two- person Maintenance Mechanic crews from Underground Lines East.
National Grid is not using dedicated full time maintenance crews; rather, they schedule maintenance as a work assignment along with other work types.
There are 251 network vaults within New York East.
Process
Regulatory mandates in the State of New York require National Grid to inspect their distribution plant on the five-year cycle. Network vaults however, because of their criticality, are inspected annually.
National Grid has a well documented procedure that describes the annual vault inspection, performed as part of the Visual and Operating inspection of the network transformer and protector (See Attachment A ). The inspection includes a visual inspection of the network unit, described more fully in the Network Protector Maintenance and Network Transformer Maintenance sections of this report, as well an inspection of the vault itself including items such as:
-
Lighting
-
Condition of Primary and Secondary Cables
-
Ground/Neutral Wires and Connections
-
Emergency Escape Hatch, if equipped.
-
Vault Roof
-
Blowers/Fans
-
Vent Stacks
-
Anode System
-
Structure
-
Gratings
-
Ladders
-
Water
-
Buss Work
-
Cleanliness
-
Sump pumps, including assuring that automatic sump pumps are equipped with a filter and an oil sensor that shuts off the pump in the presence of oil
All separable connections are checked with an infrared thermometer.
National Grid also obtains loading data during vault inspections.
National Grid also performs elevated (Stray) voltage testing using hand held E-field directional testers during the annual inspection. Stray voltage testing is mandatory in New York in cities with populations over 500,000; National Grid is performing this testing in Albany)
National Grid has developed an Electrical Operating Procedure (EOP) which provides guidelines for prioritizing issues identified during inspection for repair. This EOP provides guidance to the inspectors as to how to categorize certain findings. The inspector is free to “upgrade” the severity of the finding based on his field assessment. For example, the guidelines may indicate that a leaking joint should be a “Level 2”. The inspector may elect to upgrade to a “Level 1” based on field conditions.
Various turnaround times for repair are specified depending on the categorization.
Level 1: Emergency - must be made safe within 7 days.
Level 2: One year
Level 3: Three year
Level 4: Information purposes only
These levels were developed by asset and engineering groups based on past history and basic knowledge. Note that except for emergencies (Level 1), inspections are not repaired immediately but are reported so that the inspection process can stay on task. Inspection information is entered directly into a hand held device using Computapole software. A work order to perform follow up corrective maintenance can be generated by the interface between Computapole and National Grid’s STORMS work management software (see Technology, below).
For checklists associated with the V&O Inspections, see Attachment B .
Technology
Crews use handheld devices (Symbol Units, part of Motorola) to record inspection information. This unit has the required inspection information built into it, and a mapping feature. It also contains the most up-to-date system data and previous inspection results. Appropriate codes for the inspection are entered directly into the unit and returned to the supervisor for entry into the computer database. These codes alert GIS of changes in the field.
Computapole is a mobile utilities software platform that runs on handheld devices and is customized to meet National Grid’s specific needs. Computapole is used for inspections and mapping functions on handheld devices. Once information is entered in the Computapole system, work is managed by an interface with STORMS (below) to create work requests.
Severn Trent Operational Resource Management System (STORMS) is National Grid’s work management system. The work management system includes tools to initiate, design, estimate, assign, schedule, report time/vehicle use, and close distribution work. Computapole sends inspection information to STORMS to create work requests as needed.

Figure 1:
Network unit in vault

Figure 2:
Sump pump installation
7.5.11.11 - PG&E
Maintenance
Network Vault Inspection - Maintenance
People
PG&E’s Maintenance & Construction Electric Networks department is responsible for the maintenance of the underground network system in San Francisco and Oakland. All routine maintenance, including vault inspections, is undertaken at night in San Francisco in order to minimize the traffic disruption and congestion that could result from crews parking on city streets. Routine maintenance in Oakland is performed during the day.
There are normally four 3-man maintenance crews on the night shift in San Francisco, and a single 3 – man maintenance crew on the day shift in Oakland. The typical crew complement includes a journeyman and two Transmission & Distribution (T&D) Assistants. In addition, there are crew foremen who oversee the maintenance work.
Vault inspections, performed by the maintenance crews, are conducted in conjunction with the transformer maintenance and oil sampling program. See Transformer Maintenance / Oil Sampling.
PG&E has a well documented procedure for maintaining network transformers that includes vault inspection. ( See Attachment G.)
Process
PG&E inspects network vaults annually as part of the network transformer maintenance process. That process consists of the following major steps:
-
Job Preparation
-
External Inspection
-
Oil Sampling
-
Pressure Testing
-
Completion of the Network Transformer Maintenance Checklist.
The job preparation step involves assembling appropriate materials and following all required safety precautions associated with entering the vault, such as conducting a job site tailboard, and monitoring air quality.
Step two, external inspection, begins with an inspection of the vault conditions, including the manhole cover, access ladder, vault lights, ventilation fan, sump pump, and vault floor for debris, and water. This is followed by an inspection of the network transformer to check for any leaks, corrosion, ground connection issues, ground switch issues, as well as recording the temperature, oil level, and pressure (if available) of the main tank as well as the ambient vault temperature.
Information from the vault inspection is recorded on the Network Transformer Maintenance Checklist. (See Attachment H .)
Technology
PG&E presently uses a manual checklist ( Attachment H ) to record transformer maintenance information. They plan to implement the use of tablet computers, where crews will enter information directly. Information would be later (end of the shift) downloaded into the main asset database.
PG&E also plans to utilize bar codes on all of the transformer oil chambers and network protectors. These bar codes would be used on the oil sample bottles and syringes to identify the chamber from which the sample was drawn.
Maintenance work orders are now generated manually from PG&E’s SAP system. At the time of the immersion, PG&E was installing a work management system. This system will be tied directly to SAP, and will generate maintenance orders automatically based on network equipment maintenance procedures.

Figure 1:
Network unit with vault

Figure 2:
Vault ventilation fan and sump pump
7.5.11.12 - Portland General Electric
Maintenance
Network Vault Inspection - Maintenance
People
Crews working in the CORE group perform vault inspections in the network. The CORE group, part of the Portland Service Center (PSC), focuses specifically on the underground CORE, including both radial and network underground infrastructure in downtown Portland. Its responsibility includes inspection and maintenance of the network infrastructure, including vaults. An Underground Core Field Operations Supervisor leads the CORE group. This supervisor reports to the Response & Restoration Area Line Manager (ALM).
In general, the CORE group applies a philosophy of repairing issues when they arise. If crews find any significant electrical problems, they may engage Distribution Engineers for support. Civil issues usually outsource to external contractors for repair. Service & Design Project Managers (SDPMs) address structural problems in customer-owned facilities and coordinate with the customer to make the required repairs.
Crew
The craft workers assigned to the CORE group, which is a part of the PSC, focus specifically on the underground CORE, including operations and maintenance of the network infrastructure.
Currently, the following 16 people work in CORE:
- Four non-journeymen
- Eleven journeymen (e.g., assistant cable splicers, cable splicers, foremen)
- One Special Tester
Resources in the CORE include:
- Crew foreman: Crew foreman (a working, bargaining unit position), required to be a cable splicer
- Cable splicer: This is the journey worker position in the CORE.To become a cable splicer in CORE, an employee must spend one year in the CORE area as a cable splicer assistant.
- Cable splicer assistant: A person entering the CORE as a cable splicer assistant must be a journeyman lineman. All cable splicers start as assistant cable splicers for one year to learn the system and network. The typical underground crew consists of three people: two journeymen and a non-journeyman helper. The foreman, who is a qualified cable splicer, is one of the working journeymen on the crew. The two journeymen typically perform the work inside the manhole or vault while the helper, typically a non-journeyman classification, usually stays above ground, carrying material and watching the barricades and street for potential hazards.
Special Tester: PGE CORE has a Special Tester position, who is a journeyman lineman with additional training and technical skills. Outside the network, Special Testers work with reclosers and their settings, and perform cable testing and cable fault location. Within the network, the Special Tester works closely with the network protectors, becoming the department expert with this equipment. PGE has embedded one Special Tester within the CORE group. This individual receives specialized training in network protectors from the manufacturer, Eaton.
The Special Tester usually partners with cable splicers, working as part of a crew. The “special testing” crew includes the Special Tester, a crew foreman (a cable splicer), a lineman/cable splicer, and a topman, a non-journeyman helper. The topman stays outside the hole and watches the manhole/vault entrance for potential hazards.
In addition to NP testing and settings, the Special Tester focuses on power quality issues, including customer complaints about voltage.
Reliability Technicians: Reliability Technicians perform infrared (IR) thermography inspections on primary systems and network protectors as part of the Quality and Reliability Program (QRP), a reliability improvement program targeted at key infrastructure. PGE has three IR specialists, who mainly focus on the transmission system but also work on high-priority distribution systems. Organizationally the Reliability Technicians belong to the same group as the Special Testers and report to the Testing Supervisor.
Process
Vault Inspections
Inspection Frequency: PGE’s network has 1300 manholes/vaults. Of these, 529 are vaults, with 280 vaults containing transformers and network protectors.
For vaults that contain equipment, such as network transformers or network protectors, the frequency of inspection dovetails the performance of equipment maintenance, as a vault inspection accompanies the maintenance of equipment. For example, 480 V network protectors are maintained annually, so inspection of the vaults that house 480 V protectors is also performed annually. The crew performing the NP maintenance, which is typically comprised of a foreman, journeyman cable splicer, Special Tester, and non-journeyman helper, performs these inspections.
PGE attempts to inspect general-purpose structures annually, including vaults that do not contain equipment, but manpower availability determines the exact cycle. At the start of every year, general work orders for inspection of these vaults, as well as manholes, are created in Maximo for a particular geographical area. Each work order covers the manholes/vaults in a one- or two- block area. A crew receives these work orders and is expected to perform inspections of the general-purpose enclosures when it does not have any customer work. If there is little customer work on the network, inspections can be completed for all non-equipment vaults within a calendar year.
PGE employees, not contractors, perform all inspections of general-purpose structures, including both an electrical and civil (structural) review. Inspections also include a visual inspection to identify leaks, assess vault cleanliness, etc., and may include the use of IR thermography at the discretion of the inspection crew. All crew have been issued IR guns. If it identifies something amiss, it may bring in the Special Tester, who has a more sophisticated IR camera and has received special training in interpreting IR readings.
Crews may take load readings on the secondary system to try to identify open limiters when inspecting vaults. Because some of the secondary feeders are difficult to access, this continuity testing is restricted to accessible secondary feeders.
As part of the inspection, crews clean the vault. Crews clean vaults ahead of time if they know that they will visit a specific vault for maintenance work.
PGE does not use a formal inspection sheet for the inspections of general-purpose vaults, though a crew completes a Field Action Report if it finds issues with a manhole/vault to be repaired at a later date. The Field Action Report is records follow-up corrective action identified during inspection. If no action is needed, or if the crew can repair a problem without the need for engineering or design services, such as replacing a damaged ladder, it does not fill out any paperwork and notes completion of the inspection in Maximo.
The CORE utilizes a “fix-it-when-you-find-it” approach and keeps limited documentation of informal repairs. For repairs that are not done right away, the Field Action Report prioritizes repairs based on urgency. Electrical issues receive “1,” the highest priority. Structural issues, such as a broken lid, receive a “2” priority. Priority “3” work is rarely undertaken because a crew tends to repair such small issues while at the site. The priorities guide the urgency of the repair but are not accompanied by specific deadlines for accomplishment. They try to be as expedient and efficient as possible, scheduling work as soon as circuits are available. Engineering works closely with the CORE management to assure that these repairs are addressed. PGE notes that it has little backlog of electrical repairs, though it does have some backlog of structural repairs.
Engineering generally responds to electrical problems while SDPMs handle the other tasks, including coordination with external contractors. If vaults need civil or structural repairs, PGE uses an external Level III contractor. The company has a two-year contract with the outside contractors to undertake this type of work. For large, complex repairs, a structural engineer is used.
For vaults that contain equipment, vault inspections are performed in conjunction with the performance of equipment maintenance. For example, when a Special Tester performs protector maintenance, the crew also performs a visual inspection of the electrical facilities and structural condition, inspects the other components of the network unit, inspects other vault equipment, such as the sump pump, and performs an IR inspection of the entire vault.
Inspection of the vaults is annual for spot network vaults with 480 V protectors, and every two years for network vaults with 216 V protectors. Inspections are not formally documented, but readings obtained from the equipment are recorded on index cards. PGE is presently undertaking a project to convert the manual cards to an electronic format.
Crews may take load readings on the secondary system when inspecting vaults. Because some of the secondary feeders are difficult to access, this continuity testing is restricted to accessible secondary feeders.
Infrared (IR): As part of their vault inspections associated with equipment maintenance, crews perform IR inspections of the major components in the vault with regular FLIR cameras. The Special Tester has more sophisticated equipment, so if the crews identify an issue, they call the Special Tester to undertake a more in-depth assessment. Crews have started to undertake IR checks as part of manhole and vault entry, but this is informal and not part of the formal manhole entry requirements.
Crews document any anomalies using the Feeder Inspection Form. If they find an IR anomaly, they record the load to rule out overloading as the cause.
The Special Tester or Reliability Technician also performs IR inspections of network feeders on a four-year cycle, as part of a maintenance and inspection program separate from the vault inspections, and performed in conjunction with transformer and network protector maintenance. This program is part of the QRP, a heightened inspection program for key infrastructure, including the network. In order to do this, the inspector, either the Special Tester or Reliability Technician, partners with a crew, and at least a topman and a journeyman, because inspectors usually must enter the vaults.
The IR is undertaken on every component and primary joint, and the inspector looks for components that show a high temperature. Where resources permit, the inspector may also IR-test some secondary systems. If the inspector finds any abnormal conditions, the inspector takes a picture and creates a report. The issue will be fixed within a week, and all reporting is by exception, with reports passed to the Network Engineering Group. Most of the issues identified through IR inspection on the network have been associated with the primary terminations on the transformer.
In order to be more efficient, PGE attempts to schedule the QRP-driven vault IR inspections at the same time as network protector maintenance is being performed.
Technology
Maximo: PGE uses the Maximo for Utilities 7.5 system to manage inspection reports and store details about any maintenance needed.
7.5.11.13 - SCL - Seattle City Light
Maintenance
Network Vault Inspection - Maintenance
People
SCL has an Energy Delivery Field Operations department that includes a network Electrical Services group (Area Field Operations – Network) group, and a network Civil Services group.
The Electrical Services group is made of 84 total people including the supervision and a five-person cable-locate crew. (Note: this cable-locate crew does underground locating for the whole company). This group performs all construction, maintenance, and operation of the network system.
The Civil Services group consists of approximately 36 employees. In addition, SCL contracts approximately 25% of their civil construction work associated with their network system as well.
Cable Splicer Position
The Cable Splicer position at SCL is a generalist position. Cable Splicers perform all electrical aspects of network construction, operations, and maintenance. All electrical employees who work in the network are either Crew Chiefs, journeyman Cable Splicers, or apprentices in the mode of progression, working their way towards the journeyman level.
Crew Makeup
A network crew is normally made up of one Crew Chief, one or two Cable Splicers, and one apprentice. The type of work to be done and SCL work rules will dictate the appropriate crew makeup. For example, performing switching in a vault requires at least two journeyman-level employees to be in the vault. These and other work rules and safety practices are spelled out in the Washington State Safety Standards for Electrical Workers, Chapter 296-45 WAC.
Process
Preventive Maintenance and Inspection
SCL performs two main programmatic inspection and maintenance programs on network equipment:
-
Four-year maintenance cycle for network feeders. (Note: Network feeder maintenance includes transformer inspection and maintenance and manhole and vault inspection and maintenance.)
-
Four-year maintenance cycle for network protectors. (This program is completely independent of the feeder maintenance program.)
Network Feeder Maintenance
When the field crews are sent out on feeder maintenance, they are issued a “maintenance package” that may include:
-
copies of a feeder map from their NetGIS system
-
“cut sheet,” which is a written description of the equipment in the vault produced from NetGIS, SCL’s in-house Oracle database
-
job orders for the work to be performed
-
field copy of the clearance contract
-
any urgent maintenance slips documenting items for maintenance that had been previously identified, but not resolved
-
Network transformer and switch vault inspection forms
-
Oil test report form, for recording information associated with the oil tests of the transformer switch and terminal chambers
-
maintenance checklist
-
copy of the previous device maintenance reports, or for newer equipment, a copy of the device install card (this allows crews to identify and track any ongoing problems or repairs form prior maintenance)
-
insulating oil test report (during feeder maintenance, crews take main tank oil samples. These are tested by SCL’s in-house lab, and an oil test report is issued and returned to the maintenance crew before the feeder is reenergized)
-
Earthquake Anchors for Network transformer order form, used to replace older I-beam supports with earthquake rails
-
prior Hi-pot test reports
Feeder maintenance includes a general inspection of the condition of the vaults, as well as performing network transformer inspection and maintenance. The maintenance requirements are defined in the SCL Vault and Transformer Maintenance Manual. See Attachment H.
Crews complete a Network Transformer and Vault Inspection form, See Attachment I , for each transformer or switch vault inspected.
Crews perform tests on each network transformer during feeder maintenance. Crews take oil samples from the transformer and the primary switch chamber. SCL maintains its own oil testing laboratory. They perform an acid test, interfacial tension testing, and dielectric testing of the oil. They do not do dissolved gas analysis.
Air switches and SF 6 switches are visually inspected. A vacuum pressure test is performed on vacuum switches (only five of them are in the system).
Maintenance records are kept in an Oracle-based database developed by SCL. This database is tied in with NetGIS, their network records and mapping database. This allows SCL to access feeder maps, vault information, inspection and maintenance records, and photographs of the vaults.
Modified Maintenance Approach
While SCL’s goal is to maintain feeders on a four-year cycle, they have fallen behind on their maintenance because of the construction workload. To address this, they have implemented two types of feeder maintenance. The first type is the “full maintenance,” which means they do a full and complete inspection and maintenance during the scheduled feeder outage. The second type is an abbreviated version of maintenance called a “modified maintenance.” This type of inspection includes a thorough inspection of any transformer exposed to the elements, such as a subsurface vault, but a shorter maintenance on a transformer housed in a surface or other dry vault. Note: any feeder that has not been maintained within six years must have full maintenance performed.
Technology
Monitoring
SCL does not use distribution-level SCADA on their network, but they do have access to the remote monitoring system (DigitalGrid). They have a separate console for accessing this remote information, and alarms from this system are available at each dispatcher console.
The SCL Dispatchers have access to the NetGIS system through a network viewer. This viewer enables them to view the contents and configuration of each network vault.
7.5.12 - Non-Network Vault Inspection - Maintenance
7.5.12.1 - HECO - The Hawaiian Electric Company
Maintenance
Non-Network Vault Inspection- Maintenance
People
At HECO, underground maintenance work is performed by both Cable Splicers from the Underground group, and Lineman from the Overhead C&M groups.
The Underground Group at HECO is part of the Construction and Maintenance Division. The group is comprised of two UG supervisors, fifteen Cable Splicers, 2 Utility Mechanics, and 2 Utility Assistants. The Cable Splicer is the journeyman position in the department.
Note that the Underground group does not install or maintain network equipment such as network transformers or network protectors. Network equipment construction and maintenance is the responsibility of the Substation group at HECO. The Substation group is part of the Technical Services Division of the System Operations Department.
The Overhead C&M groups at HECO also perform maintenance work with underground facilities (normally, URD facilities). The journeyman position in the Overhead groups is a lineman.
HECO has an organization focused on performing inspections. This group is part of the C&M Planning group within the UG C&M Division.
HECO also employs a position known as a Primary Trouble Man (PTM) who performs most of the switching and clearance operations on the system. The PTM, Cable Splicer and Lineman are all bargaining unit positions.
Process
HECO is not performing programmatic inspection and maintenance of their non-network underground distribution system[1] other than at the substations. They do perform corrective maintenance as problems are identified. They also perform diagnostic testing aimed at areas where they have had reliability problems, and perform equipment replacements as needed.
Technology
HECO has a home developed Strategic Inspection and Maintenance System (SIMS) used to record inspection findings, including photographs, as well as the work performed to address those findings. The system is also used to prioritize any corrective maintenance work. (Note: Prioritization of underground findings is under development).
HECO is using a work management system called Ellipse, by Mincom.
[1] HECO is programmatically inspecting their 138 KV transmission system.
7.5.12.2 - CEI - The Illuminating Company
Maintenance
Non-Network Vault Inspection
(Maintenance (11kV))
People
CEI has one Underground Network Services Center responsible for performing preventive maintenance and inspections of the underground, including the networked secondary and non network ducted conduit systems. The service center is comprised of Underground Electricians who inspect and maintain the underground system.
Process
11kV vaults that house CEI transformers and equipment are inspected every six months. The inspection includes a visual inspection of the equipment contained with in the vault, such as cables, connectors, and transformers, as well as the condition of the vault itself.
11kV vault inspections also include batteries, disconnects, and throw over switches (manual or automatic). During the inspection, the vault will be cleaned of any debris.
Also, the inspector will take temperature readings at the transformer terminals.
And, during maintenance in a customer owner vault, CEI will check the vault ventilation system to assure it is functioning. If not, they will send a letter to the vault owner, requesting that the ventilation system be repaired.
Technology
Vault inspection / maintenance results are recorded manually on a Network Vault inspection/maintenance form.
(See Attachment M)
7.5.12.3 - CenterPoint Energy
Maintenance
Non-Network Vault Inspection- Maintenance
People
Vault Inspections (network and non-network) are performed by the Relay group within Major Underground. The Major Underground organization includes Key Accounts, Engineering and Design resources, Support Services, and the field force responsible for all construction, operations and maintenance activities. The field force is divided into two main groups, the Relay group and the Cable group.
Both the Relay group and Cable group perform maintenance and inspection activities. The Relay group focuses on most of the non cable equipment inspection and maintenance, including performing vault equipment inspections, network protector testing, and other inspections and maintenance on devices with relays or motor operators. The Cable group focuses on inspections of cable, cable accessories and major equipment.
The Relay group is comprised of Network Testers. These field resources report to Crew Leaders, a non bargaining unit position at CenterPoint. The Relay group is led by an Operations Manager.
CenterPoint does not have dedicated maintenance crews. Rather, maintenance and inspection work is assigned to crews based on work priorities and resource availability.
Process
The Relay group performs periodic vault inspections, with most inspections on an annual period. Some high priority locations are inspected two or three times per year. The inspections are performed without de-energizing the vaults.
The inspections include a visual inspection of the vault, infrared inspection of all connections including bus connections and cable connections, load measurements; and operating equipment that can be operated without interrupting customers, such as tripping and closing network protectors.
Network vault inspections will include a visual inspection of the network transformer for oil leaks, corrosion, etc. Inspectors will also record peak temperature from the transformer temperature gauge. CenterPoint does not test network transformer oil as part of their network vault inspections, unless there is an indication of a potential problem such as a high temperature reading.
During the inspection, the vault will be cleaned of any debris.
CenterPoint is using an inspection checklist to guide inspectors through the various items included in the inspection. This same checklist, entitled MUDG Functional Location Inspection Sheet is used to record findings from all inspection types, including the network vault inspections. An inspection sheet is completed for every location inspected.
Inspection findings that require follow up corrective maintenance are noted and recorded by the Crew Leaders who schedule this work for completion. Non urgent corrective maintenance actions that are identified during inspection may be held to be performed the next time a particular feeder is out of service. This is consistent with the approach used by many utilities.
If the solutions to the findings require the involvement of other groups, the Crew Leaders will solicit their help. For example, corrective maintenance activities that require a customer outage will require the assistance of the Key Accounts group to coordinate with the customer to schedule the outage.
The inspection sheets are filed by work center (each vault is considered a work center), so that CenterPoint has a record of the historic findings.
Technology
Vault inspection results are recorded manually on the MUDG Functional Location Inspection Sheet, See Attachment I .
Vault inspections include the performance of infrared thermography.
7.5.12.4 - Duke Energy Florida
Maintenance
Non-Network Vault Inspection - Maintenance
7.5.12.5 - Energex
Maintenance
Non-Network Vault Inspection- Maintenance
7.5.12.6 - ESB Networks
Maintenance
Non-Network Vault Inspection - Maintenance
7.5.13 - Oil Switch Maintenance - Replacement
7.5.13.1 - CEI - The Illuminating Company
Maintenance
Oil Switch Maintenance - Replacement
People
CEI has one Underground Network Services Center responsible for performing preventive maintenance and inspections of the underground, including the networked secondary and non network ducted conduit systems. Underground Electricians perform oil switch maintenance and replacement
Process
CEI’s non - network underground system operating at 5kV was designed with oil switches (many are older Phoenix switches) that can be used to sectionalize in no load conditions.
These switches are scheduled to be maintained on a 5 year cycle. The inspection is to include an assessment of the switch condition and performing any identified repairs.
The current policy is to replace the switches as the cable sections feeding through the switches are replaced. They devices are being replaced with an electrically operated vacuum switch.
At one time, CEI had embarked upon a proactive, systematic replacement of these devices because of the potential hazard created by the possible failure of the devices upon operation. However, CEI has implemented operational and technical changes to the method of operating these devices that minimize the risks associated with their operation, and has thus ceased the replacement program (see Operating a 5KV Underground Oil Switch).
Technology
Inspection information is to be gathered on a manual form and retained in the UG Network Services department. See Attachment P . In practice however, CEI is not performing these inspections.
Oil switches are not serialized. The Underground Network Services department maintains a data base of information on the oil switches, such as location, manufacturer, type, rating, remote controlled, etc. Some of this information is replicated in CEI’s GIS system.
7.5.13.2 - Duke Energy Florida
Maintenance
Oil Switch Maintenance - Replacement
Process
In Clearwater, Duke Energy Florida has designed its network feeders with primary sectionalizing switches. They have historically used three-way (feeder in, feeder out, and alternate feeder) oil switches that can be used to sectionalize, transfer loading from circuit to another, or tie feeders together. Devices can be opened, closed, or put in the ground position. The older devices are motor operated, and can be operated from outside of the vault or manhole using a tethered control box, or from SCADA. Part of the normal process for troubleshooting a network feeder is to sectionalize and restore service to the non-affected part of the network feeder.
Duke Energy Florida is in the process of replacing the oil filled sectionalizing devices (RA switches) used on the Clearwater network feeders with a new switch design that will involve solid dielectric vacuum switches. Drivers for this replacement effort include the fact that the devices are a 1980s vintage device and are near their end of life, and it is becoming more difficult to obtain parts. In addition, the replacement is part of an effort by the Duke Corporation to move away from oil or gas insulated switchgear. As Duke Energy Florida pursues a permanent replacement, they are seeking a device that provides a visible open.
The replacement solid dielectric vacuum devices, under design specification at the time of the practice immersion, are slightly larger than the oil filled devices and will be placed in sidewalk vaults. These devices, which do not have fault interruption capability, will be equipped with remote reporting faulted circuit indicators (FCIs) that communicate via SCADA to the DCC. The devices will provide a visible open through an interlinked system where the vacuum bottle must be open before you can open the visible break. The new devices will be placed on an angled stand so that the switch faces the vault exit and can be easily operated with a hot stick from outside the hole. The switches will also have the ability to be operated from above ground using a hand held pendant control that is hardwired to the switch. The decision to proactively replace the older oil gear with the new solid dielectric switches was collaborative, involving the component engineer within the PQR&I group, the Standards engineer and the Network Group.
In St. Petersburg, most of the infrastructure is supplied by a primary and reserve feeder loop scheme, with automated transfer switches (ATS). Outside the network, the primary and reserve looped feeder scheme is used in Clearwater as well. The ATSs are motor operated and most are tied in with SCADA and can be monitored and controlled from the DCC via a 900 MHz radio communications system. Many of the in service ATSs are oil-filled devices, with two oil-filled tanks with a bus tie between them. Duke Energy has prioritized ATSs with two oil-filled tanks located in building vaults for replacement. The replacement design utilizes two three phase solid dielectric vacuum switchers (MVS) looped together (jumpered from one to the other), with the transformers supplied radially off of the T bodies using load reducing 200 amp taps (see Figure 1).

Figure 1:
Solid dielectric design for a three-way 3 Φ switch utilizing Elastimold MVS switches. This switch can be used as the high side disconnect for a network transformer, with the 200 A interface on the back of the 600 A T bodies (left side) used to supply the transformer
Technology
Duke Energy Florida is in the process of replacing the oil filled sectionalizing devices (RA switches) used on the Clearwater network feeders with a new solid dielectric vacuum switch design. Drivers for this replacement effort include the fact that the in service devices are a 1980s vintage device and are near their end of life, and it is becoming more difficult to obtain parts. In addition, the replacement is part of an effort by the Duke Corporation to move away from oil or gas insulated switchgear. As Duke Energy Florida pursues a permanent replacement for the RA switch, they are seeking a device that provides a visible open (see Figures 2 through 5).

Figure 2:
Network Feeder primary sectionalizing switch (RA) switch

Figure 3:
Network Feeder primary sectionalizing switch (RA) switch

Figure 4:
Control Box for network feeder primary sectionalizing switch

Figure 5:
Example of an RA switch replacement considered by Duke Energy Florida. The switch depicted is a vacuum switch with the breaker under oil. Duke Energy Florida is planning to move to a solid dielectric vacuum switch
7.5.13.3 - PG&E
Maintenance
Oil Switch Maintenance - Replacement
Process
Within San Francisco, PG&E uses primary sectionalizing devices on network feeders (historically, the G&W T Ram). San Francisco’s experience is that when they open a network feeder, they often have network protectors that “hang up”; that is, do not open properly. Their primary feeder design with switches gives them the ability to isolate the section of the feeder where the bad protector is located, enabling them to complete their work on the fully de-energized section. This design also facilitates obtaining clearances and troubleshooting.
PG&E has been moving from using oil switches as network feeder sectionalizing switches to a solid dielectric switch. One driver for this change is a concern over the failure of the switch and the environmental and other hazards associated with oilfield gear. One challenge faced by PGE in the network application is that the fault duty in the network may exceed the rating of the dielectric switch. PG&E is currently working on ways to reduce the fault duty of their networks to be able to apply these devices.
7.5.13.4 - Survey Results
Survey Results
Maintenance
Oil Switch Maintenance - Replacement
Survey Questions taken from 2012 survey results - Maintenance
Question 6.32 : Are you currently implementing replacement programs for any of your network equipment?

Question 6.33 : If Yes, Please indicate which equipment is being replaced.


Survey Questions taken from 2009 survey results - Maintenance
Question 6.38 : Are you currently implementing replacement programs for any of your network equipment?

Question 6.39 : If Yes, Please indicate which equipment is being replaced.


7.5.14 - Organization
7.5.14.1 - AEP - Ohio
Maintenance
Organization
People
Maintenance and Operations activities at AEP Ohio are performed by Network Mechanics, which is a bargaining unit position responsible for performing all network field activities, including inspection, maintenance and operations activities. Network Mechanics are members of the union (IBEW) and are categorized as D, C, B, or A-level grades, with Network Mechanic “A” being the highest rank. Each position has certain work duties associated with it.
Organizationally, network field resources are centralized, with the field resources who work with the AEP Ohio networks reporting organizationally out of one network service center (Grandview). Most resources report physically out of this center, though several crews who work with the Canton networks physically report out of another center close to Canton. This service center is led by a Distribution System Supervisor and consists of Network Crew Supervisors, the front line leadership position, and the Network Mechanics. Organizationally, the network service center is part of Regional Operation, which reports ultimately to the Vice President of Distribution Regional Operations.
The Network Engineering group works closely with the field personnel at the service centers to develop and coordinate operations and maintenance activities. Network Engineering is led by the Network Engineering Supervisor and is organizationally part of the Distribution Services organization, which reports ultimately to the AEP Vice President of Customer Services, Marketing and Distribution Services. The AEP Network Engineering Supervisor and the distribution services organization – which report to the AEP Vice President of Customer Services, Marketing and Distribution Services – support all AEP networks throughout its operating companies, including Texas, Indiana, Michigan, Oklahoma, and other locations.
While the majority of the routine maintenance and inspection of network equipment is performed by AEP Ohio Network Mechanics, some work is performed by contractors.
Process
New Network Mechanics receive training in working with network systems through eight separate formal two-week long training courses spread over a four-year time period as they advance to the journey worker level. Some classes are led by a formal training supervisor, while other specialized courses are taught by Network Engineers or other experts. Training includes network operations and training activities. In addition to formal training, “on the job” training (OJT) is also an advancement requirement. Field employees are expected to develop a “jack-of-all-trades” skillset. To foster this job competency, roles and responsibilities are regularly rotated on the crews, giving employees the opportunity to experience and hone their skills in a variety of job situations and have ample hands-on experience with a number of tasks.
Training Center
A notable practice at AEP Ohio is its use of a dedicated network systems training center. This center, located within a broader training center that focuses on non-network systems as well, includes a number of demonstration workstations and a system monitoring station as a teaching aide (see Safety: Training Center).
7.5.14.2 - Ameren Missouri
Maintenance
Organization
People
Organizationally, Ameren Missouri field resources who construct, maintain, and operate the network infrastructure fall primarily within three groups, all part of Energy Delivery Distribution Services. One is the Underground Construction group, one is the Service Test group, and one is the Distribution Operating group.
Underground (UG) construction crews, consisting of resources who install cable and cable systems including civil construction, cable pulling and cable splicing, fall within an underground construction department that is organizationally part of the Underground Division, responsible for all underground infrastructure within a defined geographic territory that includes downtown St. Louis, and thus, the St. Louis network infrastructure. The Underground Construction department consists of Cable Splicers, Construction Mechanics, and System Utility Workers.
Cable Splicers and Construction Mechanics are journeymen positions. Cable Splicers perform work with the electrical infrastructure such as making up joints and terminations, including preparing lead splices. Construction Mechanics perform the civil aspects of the work. System Utility Workers serve as helpers to the other two positions, and perform duties such as cable pulling and manhole cleaning. Note that at the time of the practices immersion, Ameren Missouri was implementing a new position, called the System Journeyman, which combines the duties of Cable Splicers and Construction Mechanics. System Journeyman are responsible for performing cable work, civil construction, and operating network equipment..
The majority of the maintenance and operations of network equipment, such as network transformers and network protectors, are performed by resources within the Service Test group and Distribution Operating group. Organizationally, both the Service Test group and Distribution Operating group are part of Distribution Operations, led by a manager. Within Distribution Operations, there is a Reliability Support Services group led by superintendent. Reporting to the Superintendent, Reliability Support Services are both the Service Test group led by a supervisor and the Distribution Operating group, also led by a supervisor.
The Service Test group is made up of Service Testers and Distribution Service Testers. Service Testers perform low-voltage work only. They focus on things such as voltage complaints, RF interference complaints, and testing and maintaining batteries. Distribution Service Testers perform network protector maintenance, transformer maintenance including oil testing, and fault location. It is the Distribution Service Tester position who works routinely with network infrastructure.
The Distribution Operating group is made up of Traveling Operators, who perform switching on the system, including placing tags and obtaining clearances, and act as first responders and troubleshooters[1] for the network.
Process
Ameren Missouri has a mandatory mode of progression for Distribution Service Testers, with employees expected to reach the journeyman level in 22 weeks. The Distribution Service Tester program consists of formal training, testing and on the job training.
Distribution Service Test employees receive significant on-the-job training both as they advance to the journeyman level, and on an ongoing basis. The department manager rotates crews on four month assignments to assure that employees get exposure to various work types including network maintenance, capacitor maintenance, and fault location.
[1] Traveling operators will perform visual troubleshooting, looking for indications such as a smoking manhole. More technical troubleshooting in the network is performed by either Cable Splicers or Distribution Service Testers.
7.5.14.3 - CEI - The Illuminating Company
Maintenance
Organization
People
CEI has one Underground Network Services Center responsible for maintaining the underground, including the networked secondary and non network ducted conduit systems. The service center is comprised of Underground Electricians who maintain, construct, and operate the underground system.
The Underground Electrician family of jobs is represented by collective bargaining – UWUA Local 270.
Process
The Underground Network Services manager assigns at least one two – man crew around the clock (20 of 21 shifts) to perform maintenance work or trouble. (Only on Tuesday, day shift, is there no specific two man maintenance / trouble crews assigned) These crews are available to respond to trouble, and perform maintenance when there is no trouble.
CEI faces a similar challenge to many utilities, in that resources are often pulled from maintenance activities to perform other, more time imminent work. Also, CEI’s UG Network Services workforce staff level has been reduced by about 50% over the past five years due to attrition. In addition, the department includes newer resources that lack training, and cannot be assigned certain maintenance activities until they have gained sufficient expertise. These factors can and have resulted in slippages in adhering to the desired maintenance schedules.
Because FirstEnergy is comprised of distinct operating companies, such as the Illuminating Company, with different histories and whose construction and maintenance practices evolved separately, they are in the process of developing common preferred maintenance practices for underground ducted systems (network and non-network). The practices are being drafted by the corporate substation group, as the accountability for ducted systems in most FirstEnergy operating companies lies with the substation group. At CEI, because of the size of the ducted system infrastructure, the UG network Services Department stands independently from the Substation group.
Technology
FirstEnergy’s SAP system is used to establish maintenance plans for preventive maintenance activities.
7.5.14.4 - CenterPoint Energy
Maintenance
Organization
People
CenterPoint’s underground organization is centralized, with the resources that maintain and operate the major underground infrastructure reporting organizationally to one group - Major Underground. At CenterPoint, the term “major underground” is used to describe the three phase underground system that supplies the urban portions of the Houston metropolitan area using ducted manhole systems, and including the secondary network systems. It consists of mostly three phase facilities supplying commercial and industrial customers (with the exception of the network, which serves residential load as well). URD installations and single phase underground line extensions are not considered part of Major Underground, and are managed by other CenterPoint service centers.
The Major Underground organization, comprised of 208 total resources, includes Key Accounts, Engineering and Design resources, support services, and the field force responsible for all construction, operations and maintenance activities. In addition, where other departments have resources focused on supporting Major Underground, many of these groups have physically stationed resources, 36 in total, within Major Underground, reporting in a matrixed[1] manner.
Most Major Underground resources physically report to the same location, the Service Center – Underground Operations, located in Houston. In addition, a training facility and equipment yard for Major Underground are stationed at the Service Center.
Field resources are split into two high level groups, “Cable” and “Relay”. The Cable group is comprised of people in the Cable Splicer classification who do all cable work, including installation, maintenance, splicing and removal. The Relay group is comprised of people in the Network Tester classification, who work with testing and locating underground cable and equipment, including maintenance and inspection of transformers, switches and network protectors. This group does all system protection and relay panel work.
Field resources are further broken into groups of about 15, each reporting to a Crew Leader, a non-bargaining position at CenterPoint.
[1] The term “matrix” employee refers to an employ from another department having a dual reporting relationship, one a solid line to his supervisor, and the other a dotted line to the supervisor in the department to which he is assigned.
7.5.14.5 - Con Edison - Consolidated Edison
Maintenance
Organization
People
Operations Control Centers
Con Edison has one main System Operations Control Center, and Regional Control Centers, such as the Manhattan Control Center.
The System Operations Control Center is the main operating authority, responsible for operating the system and for the protection of the workers for the entire Con Edison system. The System Operations Control Center controls and operates Generation, Transmission, and Distribution.
Employees called District Operators (DO’s) report to the System Operations Control Center. District Operators work in shifts (several DO’s per shift), and provide 24-hour a day, 7 days a week, 52 weeks a year coverage. District Operators have exclusive operating authority and control of all distribution feeders, including circuit breakers within the substation, and all equipment and cable runs up to and including the points of termination in the field. District Operator operating authority includes issuance of approval for status change, application of protection, and issuance of work permits and test permits on distribution feeders. (Distribution feeders include all network feeders and all non-network “cable” feeders including aerial cable, and some open wire on 33 kV in Staten Island.)
Con Edison network workers (in the Work Out Centers or in the Field Operating Department [FOD]) don’t place and check their own protection; they rely on the District Operator. Con Edison has a methodical, tightly controlled clearance process, where the District Operator (DO) directs the activities to provide clearance on a feeder. If field personnel encounter a situation that doesn’t match what they expect to find, or if there is any lack of clarity in the clearance steps, the job stops immediately.
The Regional Control Centers interface between the System Operations Control Center and the Work Out Centers to get the work done. Following a strict protocol, after fault location, positive feeder identification and application of protection, the District Operator at the System Operations Control Center delegates the responsibility for work on cable or equipment to the “Feeder Control Representative” in a Regional Control Center. Again, following strict protocols, the Feeder Control Representative “signs on” each work crew at each work location and “signs them off” after they complete or partially complete their assigned work. When all work is completed and all workers are signed off, again following a strict protocol, the Feeder Control Representative reports the work completed and all sign-off’s to the District Operator, who then takes back full control of the distribution feeder, orders it tested, prepared for service, and finally orders it restored (cut in).
Overhead feeders (open wire, bare wire, tree or covered wire, and self-supporting wire) plus underground radial spurs fed from the overhead wire are under the control of the appropriate Regional Control Center. Strict but different protocols are followed for those feeders as well.
Field Operating Department (FOD) (Also called the Field Operating Bureau)
The Field Operating Department is part of Electric Distribution, and has responsibility for the emergency crews (the crews using the red emergency trucks), as well as the following accountabilities:
-
Fault locating (distribution and transmission)
-
High-tension switching (entering customer high-tension vaults and operating devices)
-
Feeder identification
-
Hi-pot testing
Fault Location Knowledge Retention
The biggest issue faced by the Fault Locating group is the loss of knowledge as experienced resources leave the department. Their biggest challenge is to find ways to retain people and knowledge.
Con Edison is currently rewriting the Field Operating Department (FOD) manual; however, this manual will provide a general overview, not specifics. Con Edison believes that much of performing fault location is based on experience and “feel.” Because each situation is different, fault-locating techniques are not skills that can be learned from books alone. Fault-locating skills must be developed through work experience.
Con Edison is bringing young employees into the department to learn. General Utility workers (GU’s) who enter the department must go through formal training, testing, OJT, and Field Operating Department (FOD) school. It takes 3-4 years to become a journeyman. Even after an employee becomes a journeyman Field Operator, Con Edison typically waits until that employee is more experienced before assigning certain duties, such as high-tension switching.
The performance of fault locating is a 24-hour-a-day, 7-day-a-week operation. Con Edison, on average, locates three faults a day. Their average time to locate a fault is two hours.
One of the challenges faced by many companies is that fault locating is shared with other duties. Consequently, it is difficult to develop experts and retain expertise. At Con Edison, the fault-locating group is a dedicated group, enabling them to become very proficient in fault-locating techniques. Con Edison has been called on by other utilities numerous times to aid in fault location.
Field Engineering Group
Con Edison has a field engineering group consisting of 40 individuals who perform a variety of quality-assurance-related tasks including:
-
Inspections/manhole inspections
-
Post-construction inspections to determine to adherence to Specifications
-
Safety inspections
-
Critical manhole inspections, performed in any manhole on the immediate block of a substation, and inspected on a three-year cycle
-
Regular manhole/vault inspections, scheduled every five years
-
Infrared inspections of transformers/network protectors/substations
-
Infrared is a four-year cycle for 277/480-V installations.
-
Infrared is not programmatic, but is performed randomly, or by exception at 120/208 V. Infrared inspections are performed more frequently at sensitive customer locations such as hospitals and museums.
-
Substation infrared is annual.
-
Use strategically placed site glasses to obtain infrared views of some locations.
-
Use outside contractor to perform infrared training.
-
-
Cable and Joint failure analysis specimen retrieval and tracking
-
Fill-in work, special requests
-
Check out erroneous readings monitored through the RMS system
-
Map verification; that is, comparing what is on the mapping system to what is in the field
-
Random spot checks, focused on workmanship
-
Random equipment checks
- For example, the Field Engineering group performs random monthly spot checks of primary splice packs to be sure that the kit is complete.
-
Respond to voltage complaints
Note: This group does not routinely inspect design versus build, or as-built versus mapped.
The department is made up primarily of Splicers. People are chosen for jobs in the department by seniority.
Cable Testing Laboratory
Con Edison has its own cable testing laboratory, which has been in operation since the 1970s. This laboratory has over 100,000 cable and accessory specimens. Sometimes the lab sends specimens to outside labs to obtain independent analysis and opinions.
Con Edison invests in keeping its laboratory staff current on the latest thinking in cable testing. They are active in industry groups. They invest in rotating new people into the cable department, including engineers from Con Ed’s Gold program (a mentoring program for high potential engineers and business professionals).
Distribution Engineering Equipment Analysis Center (DEEAC)
Con Edison has recently launched a new team dedicated to the analysis of electric distribution equipment. The mission of the Distribution Engineering Equipment Analysis Center (DEEAC) is to optimize the performance of distribution equipment through a system safety approach that utilizes data trending and incident analysis. To support this mission, the team is focused on enhancing the safe operation of distribution equipment while also improving overall system reliability by proactively mitigating operational risk. These goals will be achieved through targeted forensic analysis, data characterization of all field-returned equipment, and quality assurance of distribution equipment. Con Edison is dedicated to supporting the mission of DEEAC with a shared focus on continuously improving system safety.
7.5.14.6 - Duke Energy Florida
Maintenance
Organization
People
Organizationally, the Duke Energy Florida resources that inspect, maintain, and operate the urban underground and network infrastructure fall within the Network Group which is part of the Construction and Maintenance Organization. More broadly, Duke Energy Florida’s construction and maintenance organization is divided into regions, with both Clearwater and St. Petersburg falling within their South Coastal Region. The Construction and Maintenance organization for the South Coastal Region is led by a General Manager. The region consists of various Operation Centers, organized either geographically or functionally throughout the Region.
The Network Group is organized functionally, and has responsibility for construction, maintain and operating all urban underground infrastructure (ducted manhole systems), both network and non - network, in both Clearwater and St. Petersburg. The Network Group is led by a supervisor who reports to the Region General Manager. The group consists of ten craft workers, five Electric Apprentices and five Network Specialists (the journey worker position), all part of the Network Specialist job family.
The Network Specialist is a jack-of-all-trades, position, responsible for all facets of UG work, including cable pulling, splicing, and inspecting, maintaining and operating equipment such as cables, joints, network switches, transformers and network protectors. Network Specialists also work with the installation and maintenance of automation associated with the equipment they manage. For example, Duke Energy Florida recently completed a major project to add automation (remote monitoring and control) to field located primary distribution switches, such as automatic throw over switches (ATSs) that are commonly used to provide a primary and alternate feed to larger customers. It is the Network Specialist craft that installed the automation on the switches, and led an effort to troubleshoot and resolve an implementation issue associated with the design.
The Network Group at Duke Energy Florida has close ties with peers within Duke Energy sister companies throughout the country, and regularly shares information, lessons learned, and network standards with them.
Process
The 10 craft workers within the Network Group are responsible for maintenance and operation of all major underground (ducted manhole systems) infrastructure in both Clearwater and St. Pete. Three resources are assigned to Clearwater, and seven are assigned to St. Petersburg, but resources are moved freely to both areas based on work needs. Network Specialists, the journey worker craft position, may be designated to an oversight position, depending on work needs. For example, at the time of the practices immersion, a Network Specialist was designated to provide oversight to contractor crews.
As the two systems (Clearwater and St. Petersburg) have different designs, the approach used to maintain the two areas differs in some areas.
7.5.14.7 - Duke Energy Ohio
Maintenance
Organization
People
Duke Energy Ohio’s organization for maintaining and operating their network infrastructure is centralized, with the resources reporting to the Dana Avenue Construction and Maintenance facility. This organization, referred to as “Network Services” or the “Dana Avenue”, does all work associated with the Cincinnati network, as well as certain functions, such as fault location, for the entire division.
The Dana Avenue Construction and Maintenance organization[1] , led by Manager, is comprised of 59 total resources, including a Field Work Coordinator, Project Manager, T & D Construction Coordinators, and three Construction and Maintenance Supervisors, two of which lead field employees (46) focused on the network.
Duke Energy Ohio has two primary job families for underground field resources – Cable Splicers and Network Service Persons.
Cable Splicers do all cable work, including installation, testing, locating, maintenance, splicing and removal. Underground Service Persons work with non - cable underground equipment, including maintenance and inspection of transformers, switches and network protectors. This group also sets network protector relays based on settings determined by the Network Planning and Network Project engineers.
Note that in Duke’s Terre Haute network, network equipment maintenance is performed by substation maintenance mechanics who work on both substations and network systems.
[1]Official title of the organization is DD OH/KY – Joint Trench Operations. It is referred to as “Dana Avenue” or “Network Services”.
7.5.14.8 - Energex
Maintenance
Organization
People
Establishing network maintenance programs is the responsibility of the Network Maintenance and Performance group, led by a group manager, and part of Asset Management. This group works closely with the Standards group and with other Asset Management organizations to develop the maintenance and inspection plan.
7.5.14.9 - ESB Networks
Maintenance
Organization
People
Maintenance programs are developed and managed by the Asset Management group.
The development of maintenance and inspection programs is performed by engineers in close conjunction with a Strategy Manager who works as part of the Finance & Regulation group within Asset Management. This individual also works closely with the regulator, developing and submitting for approval a 5 year program of maintenance. The strategy works closely with the other groups in Asset Management to identify risks and prioritize programs.
The management of the execution of approved maintenance and inspection program is performed by the Program Management group, also part of Asset Management.
The execution of maintenance and inspection programs is performed by resources within Operations. ESB Networks has two operations centers, one north and one south.
Technology
ESB Networks manages its maintenance and inspection programs using the SAP system. Maintenance orders, or MOs. are assigned to a specific supervisor (by number) who has constant visibility of all MOs and their status.
7.5.14.10 - Georgia Power
Maintenance
Organization
People
Organizationally, the Georgia Power Network Underground field resources who construct, maintain, and operate the network infrastructure fall primarily within two groups that are part of the Network Underground group. One is the Network Construction group, and the other is the Network Operations and Reliability group.
Underground Construction crews, consisting of resources who install cable and cable systems including civil construction, cable pulling and cable splicing, fall within the Network Construction group, responsible for construction activities for all underground network infrastructure, and construction and maintenance activities for the ducted manhole system infrastructure throughout the state of Georgia. The Network Construction department is led by a manager, and consists of Cable Splicers, Duct Line Mechanics, Civil/Electrical Engineers, and field supervision.
The Network Construction group is responsible for civil maintenance activities, such as performing civil repairs and replacements including duct line rebuilds, and manhole construction and maintenance. In many cases, new construction is out-sourced to preferred contactors that have worked with Georgia Power over a number of years, thereby relieving construction crews for use in ongoing repair, inspections of infrastructure, and maintenance work.
Cable Splicers and Duct Line Mechanics are the journeymen positions. Cable Splicers perform work with the electrical infrastructure such as making up joints and terminations, including preparing lead splices. They also install transformers and network protectors and any other electrical equipment. Duct Line Mechanics perform the civil aspects of the work, such as duct line, substation vault, and manhole construction and repair. Winch Truck Operators also serve as helpers to the other two positions, and perform duties such as delivering supplies and manhole cleaning.
The majority of the routine maintenance and inspection of network equipment, such as network transformers and network protectors, are performed by resources within the Network Test group, part of the Network Operations and Reliability group. The Network Operations and Reliability group is led by a manager and consists of Test Engineers, Test Technicians, Cable Splicers and WTO’s and field supervision. The group consists of Test Engineers, Technicians, and maintenance crews who perform routine inspections of cable and cable systems, transformers, protectors, and other network infrastructure. There are two Test Technicians, drawn from the ranks of Cable Splicers, who perform routine inspections and maintenance of network protectors. The Test Technicians who perform NP testing are non-bargaining, non-exempt employees. Depending on the work activity, field crews may report to Distribution Supervisor, or to a Test Engineer.Maintenance Crews, comprised of Cable Splicers, do other maintenance work including connecting services, disconnecting splices, transformer testing, transformer oil sampling, working with secondary collector busses.
Network Operations is headed by Test Engineers within the Network Operations Center and report to the Network Operations and Reliability Group. The Test Engineer is a non-exempt, non-bargaining position responsible for system operations, including running the network control center, operating the system, and serving as first responders in the event of trouble on the network underground system. Some Test Engineers have 4 year degrees, while others have 2 year degrees. Network Operations collects and monitors network underground performance and operations through its centralized SCADA systems. Data is collected in near-real time. The group is responsible for reporting faults, re-routing network service when necessary, and de-energizing network segments during repairs, inspections, and/or maintenance.
Process
Both Cable Splicer and Duct Line Mechanic job groups assigned to Construction or Maintenance have a three-year job progression. Both require training, consisting of six-month modules, at the Georgia Power Network Underground training center taught by senior personnel. Each module has three weeks of classroom training and requires extensive on-the-job training (OJT).
As a part of formal training, Apprentices must pass a test at the end of each six-month module before proceeding to the next level. Apprentices have two opportunities to pass each test. Apprentices receive a salary increase as they pass each level. (See Job Progression )
Test Technicians perform network protector inspections and maintenance and are non-degreed personnel drawn from the ranks of Senior Cable Splicers. Two Test Technicians are responsible for an inspection of 200-300 network protectors per year. The Test Technicians learn the work through OJT with senior personnel and through network protector classes provided by the network protector manufacturers.
Test Engineers are responsible for all other aspects of the network underground electrical equipment testing, including transformers. Test Engineers direct the work of field crews in performing maintenance and testing activities.
Network Operations personnel are Test Engineers. Test Engineers must take network underground training if they do not have specific network experience; many are drawn from the ranks within the Network Underground group.
7.5.14.11 - HECO - The Hawaiian Electric Company
Maintenance
Organization
People
At HECO, underground maintenance work is performed by both Cable Splicers from the Underground group, and Lineman from the Overhead C&M groups.
The Underground Group at HECO is part of the Construction and Maintenance Division. The group is comprised of two UG supervisors, fifteen Cable Splicers, 2 Utility Mechanics, and 2 Utility Assistants. The Cable Splicer is the journeyman position in the department.
Note that the Underground group does not install or maintain network equipment such as network transformers or network protectors. Network equipment construction and maintenance is the responsibility of the Substation group at HECO. The Substation group is part of the Technical Services Division of the System Operations Department.
The Overhead C&M groups at HECO also perform maintenance work with underground facilities (normally, URD facilities). The journeyman position in the Overhead groups is a lineman.
HECO has an organization focused on performing inspections. This group is part of the C&M Planning group within the UG C&M Division.
HECO also employs a position known as a Primary Trouble Man (PTM) who performs most of the switching and clearance operations on the system. The PTM, Cable Splicer and Lineman are all bargaining unit positions.
Process
HECO is not performing programmatic maintenance of their non-network underground distribution system[1] other than at the substations. They do perform corrective maintenance as problems are identified. They also perform diagnostic testing aimed at areas where they have had reliability problems, and perform equipment replacements as needed.
HECO faces a similar challenge to many utilities, in that corrective maintenance issues that have been identified may not get repaired in a timely fashion as this work is often subordinated to other, more urgent work. This results in a backlog of corrective maintenance items to be worked. HECO does not have clear written guidelines that define the expected period in which these issues must be remedied.
Technology
HECO has a home developed Strategic Inspection and Maintenance System (SIMS) used to record inspection findings, including photographs, as well as the work performed to address those findings. The system is also used to prioritize any corrective maintenance work. (Note: Prioritization of underground findings is under development).
HECO is using a work management system called Ellipse, by Mincom.
[1] HECO is programmatically inspecting their 138 KV transmission system.
7.5.14.12 - National Grid
Maintenance
Organization
People
Maintaining and operating the Albany network system is the responsibility of Underground Lines East. This group is led by a manager, and includes field resources focused on civil aspects of the underground system and a field resources focused on the electrical aspects. The Underground Lines group is responsible for both the network and non – network infrastructure in eastern NY, including the Albany network. The total UG Electric East group has 29 field resources.
The Civil Group is comprised of Mechanics, Laborers, and Equipment Operators, and is led by a supervisor. This group includes a machine shop located in Albany. The group has 23 field resources.
The Electrical Group, comprised of Cable Splicers and Maintenance Mechanics, is led by three supervisors. Cable Splicers work with cable and cable accessory installation and maintenance, including cable pulling and splice preparation. Cable Splicers are also responsible for performing manhole inspections. Maintenance Mechanics perform network switching, fault location, minor vault maintenance, and inspection and maintenance of network vaults and equipment such as transformers and network protectors.
The Electrical Group field classifications are represented by a collective bargaining agreement. (Union IBEW in New York, multiple unions in NE). Advancement in union positions in UG East is through an automatic progression to a journeyman.
UG Lines East also includes resources such as Schedulers and Work Coordinators. These resources work closely with field supervisors to schedule and resource plan the work.
In addition, National Grid has a company-wide Inspections Department, led by a manager, responsible for completing regulatory required inspection programs. This group consists of supervisors assigned to the National Grid regions, and a union workforce to perform routine inspections. Note, however, that network inspections within Albany are performed by crews from Underground Lines East.
National Grid does not use dedicated full time maintenance crews; rather, they schedule maintenance as a work assignment along with other work types.
National Grid also has a Regional Control Center that operates the eastern New York distribution system. The system is operated in four geographic areas, including one that serves Albany. Each operating desk in the center is manned by regional operators, responsible for both load dispatch and trouble dispatch. The operator responsible for Albany operates both the radial and network systems.
Switching in the substation, including opening network feeder breakers and placing tags, is performed by a substation operator. Note that all network feeders in NY East can be operated remotely. Switching on the network system beyond the primary feeder breaker is typically performed by the underground crews, part of UG Lines East.
Troubleshooting and restoration of outages may involve multiple groups at National Grid.
Maintenance Mechanics within NY Underground East are responsible for troubleshooting network feeders, performing switching on the network (outside the substation), and and in performing fault location.
The National Grid Regional Control Center includes Regional Operators who provide switching orders to direct switching and tagging, and issue clearances, and Substation Operators who perform switching at the substations. Field switching is directed by the Regional Operators and performed by the Maintenance Mechanics within the UG group.
Restoration activities may involve the planning engineers, who may be consulted for guidance to reconfigure the system to restore service.
Process
Advancement in union positions in UG East is through an automatic progression to a journeyman, whereby employees must move through a program of formal training, on the job training (OJT) and testing and become a journeyman within a 42 month period. (See Crew Makeup / Job Progression)
Upon entry, a candidate becomes an “A” employee (Cable Splicer A or Maintenance Mechanic A) for 12 months. Then they move to “B” level for 24 months, and finally advance to a “C”, which is the journeyman level. Progression through the levels involves a combination of formal training and on-the-job training. Employees are expected to fully advance to the “C” level in 42 months.
For each step of the progression, the employee must pass the training school for that step and pass a review by a panel of his/her supervisors. Those that do not pass the formal testing for advancement the first time do get a second chance. If they fail a school or supervisory review, employees are allowed time to upgrade their knowledge and offered a second chance at the school or review. The progression is automatic in terms of time, but they must pass the schools and reviews and advance to the “C” level in 42 months. If an employee does not pass on the second try, he is given a time period to bid out to another department.
7.5.14.13 - PG&E
Maintenance
Organization
People
The PG&E network field resources (network crews) are part of the Maintenance and Construction - Electric Network organization. The group is led by a Superintendent, VP, who is responsible for the secondary network infrastructure in the Bay Area Region, including San Francisco and Oakland. Note that this individual’s responsibility includes radial distribution in San Francisco and Oakland as well.
Reporting to the superintendent, VP are three Distribution Supervisor positions who supervise the network field resources, two in San Francisco and one in Oakland. In addition, there is a distribution supervisor who leads the Network Protector Maintenance/ Repair shop, and a supervisor of the compliance group, responsible for quality compliance.
The field groups are comprised of cable splicers, a bargaining unit position (IBEW). Cable splicers perform both cable work, such as cable installation and splicing, and network equipment work, such as network protector and transformer maintenance. Advancement in the Cable Splicer job family is through an automatic mode of progression.
In San Francisco, PG&E network crews who perform preventive maintenance work the night shift[1] . The decision to work at night is driven by two main factors. First, regulations for working in San Francisco issued by the San Francisco Municipal Transportation Agency, prevent utilities from blocking traffic during the day. Second is that loading is lower at night, enables PG&E to clear feeders and maintain adequate capacity to meet loading. Note that in Oakland, PG&E performs network preventive maintenance with day shift crews.
In San Francisco, they typically run four 3- man crews in the evening to perform maintenance. A crew is normally made up of a journeyman cable splicer, who does most of the network protector maintenance work, and two helpers (usually Apprentice Cable Splicers).
PG&E also has three cable crew foremen on the night shift. The cable crew foreman is a working position, with one foreman typically taking clearances and installing grounds, and the others overseeing the crews.
PG&E also uses a position called a Cableman which is a troubleshooter for the underground system, part of PG&E’s Restoration group (not part of the M&C electric Network organization). There a six Cableman who work for the company. They work a rotating shift , and have 24/7 coverage.
PG&E has a General Construction group, also comprised of cable splicers, who work with both the radial and network cable infrastructure. Resources in this group are roving, and act as “internal contractors”, moving to where they are needed and supporting the Maintenance and Construction- Electric Network organization.
Process
PG&E has a 30 month automatic mode of progression whereby employees must move through a program of formal training, on the job training (OJT) and testing. The employee then becomes a journeyman within the 30 month period. (See Crew Makeup / Job Progression)
Employees enter the department as Apprentice Cable Splicers.
[1] Note that Cable Splicers are assigned during the day to work on San Francisco’s radial underground system. These crews can be redirected to address network issues that may arise during the day. However, all planned work on the network is performed at night.
7.5.14.14 - Portland General Electric
Maintenance
Organization
People
System Control Center (SCC): The SCC is usually referred to as Load Dispatch, and operators are known as load dispatchers, who are managed by the Transmission and Distribution (T&D) Dispatch Manager. The SCC has two distribution control regions, and Dispatchers are assigned geographically. From Monday to Friday, two dispatchers cover each of the two PGE regions.
One of the regions and therefore one of the dispatch desks includes downtown Portland and the CORE network. Dispatchers rotate between the two desks so that all dispatchers gain experience working with the network. The SCC employs eight dispatchers total who rotate between the desks on 12-hour shifts. Dispatchers are salaried employees (non-bargaining).
PGE employs load dispatchers from a range of backgrounds. Some are electrical engineers, some are ex-lineman, and others are SCADA technicians or truck drivers. This approach provides a diverse range of experience. PGE lacks a formal training program for load dispatchers. Training is primarily on the job. The load dispatcher position is not considered entry level, so PGE prefers to hire people with prior experience and qualifications.
Load dispatchers perform switching according to checked and verified plans drawn up by engineers. Dispatchers then communicate with crews to carry out the switching in the field.
Distribution/Network Engineers: Three Distribution Engineers cover the underground network and are responsible for supporting the maintenance and operation of the network, including working with dispatchers on operational issues and determining maintenance approaches for network equipment. The Distribution Engineers are not based in the Portland Service Center (PSC) or CORE group. The Eastern District Central Supervisor, who reports to the Manager of Distribution and T&D Standards, oversees them. The underground Distribution Engineers are qualified electrical engineers. When needed, PGE hires civil engineers to perform certain civil maintenance tasks.
Crews
The craft workers assigned to the CORE group, part of the PSC, focus specifically on the underground CORE which includes both radial underground and network underground infrastructure in downtown Portland. Their responsibility includes operations and maintenance of the network infrastructure. An Underground Core Field Operations Supervisor leads the CORE group. This supervisor reports to the Response & Restoration Area Line Manager (ALM).
Currently, the following 16 people working in CORE:
- Four non-journeymen
- Eleven journeymen (e.g., assistant cable splicers, cable splicers, foremen)
- One Special Tester
Resources in the CORE include the following:
- Crew foreman: Crew foreman (a working, bargaining unit position), required to be a cable splicer
- Cable splicer: This is the journey worker position in the CORE.To become a cable splicer in CORE, an employee must spend one year in the CORE area as a cable splicer assistant.
- Cable splicer assistant: A person entering the CORE as a cable splicer assistant must be a journeyman lineman. All cable splicers start as assistant cable splicers for one year to learn the system and network.
The Cable Splicer position is a “jack-of-all-trades” position with work including the following:
- Cable pulling
- Splicing
- Cable and network equipment maintenance
- Cleaning
- Pulling oil samples from transformers
The typical underground crew consists of three people: two journeymen and a non-journeyman helper. The foreman, who is a qualified cable splicer, is one of the working journeymen on the crew. The two journeymen typically perform the work inside the manhole or vault, while the helper usually stays above ground, carrying material and watching the barricades and street for potential hazards.
In addition, a crew may include an equipment operator to operate the cable puller, vacuum truck, or other equipment. Note that some work, such as backhoe work, is usually performed by external contractors.
Other Crews and Positions
Special Tester: PGE CORE has a Special Tester position, who is a journeyman lineman with additional training and technical skills. Outside the network, Special Testers work with reclosers and their settings, and perform cable testing and cable fault location. Within the network, the Special Tester works closely with the network protectors, becoming the department expert with this equipment. PGE has embedded one Special Tester within the CORE group. This individual receives specialized training in network protectors from the manufacturer, Eaton.
The Special Tester usually partners with cable splicers, working as part of a crew. The “special testing” crew includes the Special Tester, a crew foreman (a cable splicer), a lineman/cable splicer, and a topman. The topman stays outside the hole and watches the manhole/vault entrance to ensure no accidents.
In addition to NP testing and settings, the Special Tester focuses on power quality issues, including customer complaints about voltage.
Network Protector Crew: The CORE group has created a dedicated crew that deals with network protectors and performs other construction work. This crew is comprised of cable splicers who receive formal training and attend conferences to gain experience with network protectors. This crew includes a foreman, journeyman (who rotates every three months), and Special Tester.
PGE has approximately 230 network protectors on the system, with half included in the 480 V spot networks, and half in the 120/208 V area grid systems. Presently, it has three construction/maintenance crews and will add the dedicated crew protector crew.
Journeyman Locator: The CORE has a cable splicer/journeyman in charge of “locate” requests, and this role is never outsourced. The network had 1600 locates last year, and ideally the locator works with the Mapper to ensure accurate maps.
Infrared (IR) Tech: IR techs inspect primary systems and network protectors as part of the Quality and Reliability Program (QRP). PGE has three IR techs, who mainly focus on the transmission system. They also work on high-priority secondary systems.
None of the IR techs are dedicated solely to the CORE.
7.5.14.15 - SCL - Seattle City Light
Maintenance
Organization
People
SCL has an Energy Delivery Field Operations department that includes a network Electrical Services group (Area Field Operations – Network) group, and a network Civil Services group.
The Electrical Services group is made of 84 total people including the supervision and a five-person cable-locate crew. (Note: this cable-locate crew does underground locating for the whole company). This group performs all construction, maintenance, and operation of the network system.
The Civil Services group consists of approximately 36 employees. In addition, SCL contracts approximately 25% of their civil construction work associated with their network system as well.
Cable Splicer Position
The Cable Splicer position at SCL is a generalist position. Cable Splicers perform all electrical aspects of network construction, operations, and maintenance. All electrical employees who work in the network are either Crew Chiefs, journeyman Cable Splicers, or apprentices in the mode of progression, working their way towards the journeyman level.
Mode of Progression
SCL uses a three-year automatic mode of progression. This mode includes 8000 hours of On the Job Training (OJT) and testing. They have experienced a very low dropout rate from the program. This is in part because they administer a highly selective front end test and interview process to accept apprentices into the program. Also, a Cable Splicer position at SCL is a highly sought-after position.
Training
In addition to the training associated with the mode of progression, SCL provides network crews with opportunities for training including mandatory safety training for processes such as manhole entry and manhole rescue. SCL also periodically sends personnel to conferences and specialized training sessions such as the Cutler Hammer School, etc.
Crew Makeup
A network crew is normally made up of one Crew Chief, one or two Cable Splicers, and one apprentice. The type of work to be done and SCL work rules will dictate the appropriate crew makeup. For example, performing switching in a vault requires at least two journeyman-level employees to be in the vault. These and other work rules and safety practices are spelled out in the Washington State Safety Standards for Electrical Workers, Chapter 296-45 WAC.
Process
Network Protector Maintenance
Certain Cable Splicers are assigned to focus on network protector construction, operations, and maintenance, and thus become experts in these areas. These individuals are selected for this focus based on their interest level and mechanical aptitude. They retain their Cable Splicer position.
Manhole Drill
Before taking a feeder out for maintenance, SCL performs a manhole drill. The manhole drill involves an inspection crew, usually made up of two journeyman cable splicers (or one working crew chief and one journeyman) and one apprentice going into each manhole on the feeder planned to be maintained, and performing an inspection. If inspectors identify a problem in the manhole that can be fixed on the spot, they do it. If the fix cannot be fixed on the spot, or must be engineered, they notify the Network Electrical Crew Coordinator, who creates a trouble ticket or urgent maintenance slip to complete the work as part of the feeder maintenance. If the inspection crew discovers a civil problem, they notify the civil crews of the need for a repair.
7.5.14.16 - Survey Results
Survey Results
Maintenance
Organization
Survey Questions taken from 2012 survey results - Maintenance
Question 6.3 : Is network maintenance, inspection and testing performed by (Check One)?

Question 6.4 : If using contractors, what % of your total network maintenance work is contracted?

Survey Questions taken from 2009 survey results - Maintenance
Question 6.5 : Is network maintenance, inspection and testing performed by (Check One)? (This question is 6.3 in the 2012 survey)

Question 6.6 : If using contractors, what % of your total network maintenance work is contracted? (This question is 6.4 in the 2012 survey)

7.5.15 - Padmounted Transformer Inspection
7.5.15.1 - CenterPoint Energy
Maintenance
Padmounted Transformer Inspection
People
Inspections of three phase pad mounted transformers are performed by both the Relay group and Cable group within Major Underground. In general, transformer locations with associated auto switches, breakers or reclosers are performed by the Relay group. Transformer locations with manual switches or without switches are inspected by the Cable group.
The Major Underground organization includes Key Accounts, Engineering and Design resources, Support Services, and the field force responsible for all construction, operations and maintenance activities. The field force is divided into two main groups, the Relay group and the Cable group.
Both the Relay group and Cable group perform maintenance and inspection activities. The Relay group focuses on most of the non cable equipment inspection and maintenance, including performing vault equipment inspections, network protector testing, and other inspections and maintenance on devices with relays or motor operators. The Cable group focuses on inspections of cable, cable accessories and major equipment.
The Relay group is comprised of Network Testers. These field resources report to Crew Leaders, a non bargaining unit position at CenterPoint. The Relay group is led by an Operations Manager. The Cable group is comprised of Cable Splicers. These field resources report to Crew Leaders, a non bargaining unit position at CenterPoint. The Cable group is led by two Operations Managers.
CenterPoint does not have dedicated maintenance crews. Rather, maintenance and inspection work is assigned to crews based on work priorities and resource availability.
Process
Inspections of three phase padmounted transformers without associated switches or reclosing devices are performed on a five year cycle by Cable group. Inspections of units with associated switches and devices, conducted by the Relay group, are generally performed on a one year cycle, thought the inspection period varies based on the criticality of the location.
The three phase padmounted unit inspections include a visual inspection of the units, infrared inspection of all connections and potential stress points such as cable bends, and taking load and voltage measurements.
CenterPoint is using an inspection checklist to guide inspectors through the various items included in the inspection. This same checklist, entitled MUDG Functional Location Inspection Sheet is used to record findings from all inspection types, including the network vault inspections. An inspection sheet is completed for every location inspected.
Inspection findings that require follow up corrective maintenance are noted and recorded by the Crew Leaders who schedule this work for completion. Non urgent corrective maintenance actions that are identified during inspection may be held to be performed the next time a particular feeder is out of service. This is consistent with the approach used by many utilities.
If the solutions to the findings require the involvement of other groups, the Crew Leaders will solicit their help. For example, corrective maintenance activities that require a customer outage will require the assistance of the Key Accounts group to coordinate with the customer to schedule the outage.
The inspection sheets are filed by work center (each vault is considered a work center), so that CenterPoint has a record of the historic findings.
Technology
Three phase transformer inspection results are recorded manually on the MUDG Functional Location Inspection Sheet, See Attachment I
Transformer inspections include the performance of infrared thermography.
7.5.15.2 - Survey Results
Survey Questions taken from 2020 survey results - Commercial Distribution survey
Question 11 : Please indicate if your company performs the following Inspection activities on a routine basis and at what frequency.


7.5.16 - Pipe Cable System Maintenance
7.5.16.1 - CEI - The Illuminating Company
Maintenance
Pipe Cable Inspection Maintenance (138kV)
People
CEI has one Underground Network Services Center responsible for performing preventive maintenance and inspections of the underground, including the networked secondary and non network ducted conduit systems. Electricians within this group perform the 138 kV pipe cable system maintenance and cathodic protection maintenance.
Process
The 138kV pipe cable system supplies key substations, including the Hamilton sub which sources the network. CEI inspects and maintains this system, including the cathodic protection system on a 6 month cycle.
Technology
Information about the inspection and maintenance is recorded on manual forms. See Attachment R and Attachment S
7.5.16.2 - Duke Energy Ohio
Maintenance
Pipe Cable Inspection Maintenance (138kV)
People
Substation maintenance personnel are responsible for the maintenance and inspection of the pressurized oil system and terminations.
Network crews perform visual inspections of the 138kV pipe type cable route. They will periodically or incidentally drive the route, identifying situations that could potentially damage the system (a backhoe, for example).
Contractor resources are used to make required repairs to this system.
Process
Duke Energy Ohio hired an expert contractor to assess the condition of their 138 kV pipe cable system and recommend modifications an procedural changes. At the time of the EPRI immersion, Duke Energy Ohio was assessing the recommendations.
Technology
Duke Energy Ohio has two area substations that supply their Cincinnati network. The substations are physically located close together, and are supplied by parallel 138 kV pipe type cable feeders.
Information about the inspection and maintenance is recorded on manual forms.
7.5.16.3 - HECO - The Hawaiian Electric Company
Maintenance
Pipe Cable Inspection Maintenance (138kV)
Process
The 138kV pipe cable system supplies key substations. HECO inspects and maintains this system, including the cathodic protection system on a 6 month cycle.
Technology
Information about the inspection and maintenance is recorded on manual forms.
7.5.16.4 - SCL - Seattle City Light
Maintenance
High Pressure Fluid - Filled Cable System Maintenance
People
High-pressure fluid-filled cable inspections are performed by substation operators as part of the substation inspection program.
Cathodic protection inspections and testing for transmission cables are performed by network crews.
Process
Testing results are forwarded to Generation Engineering.
7.5.17 - Preventive Maintenance and Inspection
7.5.17.1 - AEP - Ohio
Maintenance
Preventative Maintenance and Inspection
People
Preventive maintenance and inspections of network equipment are conducted by Network Mechanics and Network Crew Supervisors on a regular basis. AEP Ohio uses a cyclical approach, with predefined inspection and maintenance frequencies for network components. Most network maintenance programs have been in place for about ten years.
AEP Ohio performs inspections of structures, such as vaults and manholes, and of equipment, such as network transformers and network protectors. Where possible, inspections are grouped so that the performance of a structure and equipment within that structure are performed together. AEP Ohio utilized contractors, particularly civil engineers, to inspect the civil conditions of vaults and manholes.
Process
AEP Ohio inspections and maintenance of network equipment are performed on a rigorous, regular schedule (see Table 1). Findings are recorded on inspection forms for manholes, vaults, network protectors, and transformers, and are available in hard copy and an online form (see Attachment D for a sample online manhole inspection form). Note that if a Network Mechanic enters a manhole/vault to inspect a piece of equipment, an inspection is performed and documented of both the equipment and the manhole/vault.
Network Maintenance Programs
| Inspection | Period or Cycle |
| Manhole Inspection | 4-year cycle. Inspections are also performed as part of ongoing equipment inspections on a 1-year cycle. |
| Vault Inspection | 1-year cycle (as part of network protector and transformer inspections) |
| Network Protector Inspection (open door) | 1-year cycle |
| Network Protector Maintenance (on the rail) | 4 year cycle (full maintenance) |
| Transformer Inspection | 1-year cycle |
| Transformer Maintenance | 3 year cycle (oil sampling and testing). Full maintenance activities are driven by oil test findings |
| Trip Checks (Drop Tests) of Network Feeders | 1-year cycle |
Table 1
Technology
Conditions identified through inspection are recorded in the AEP NEED (Network Enclosure and Equipment Database). When information is entered into NEED, repair or replacement priorities are noted. Inspection forms provide guidance to the inspector in prioritizing and recording findings. For example, the following codes are used for assessing corrosion/rust of network equipment:
Corrosion/rust
-
normal, good condition
-
surface rust
-
rust with metal flaking
-
severe rust allowing “seeping” oil leak
-
severe rust allowing severe oil leak
Note that all network trucks are equipped with on-board computers.
7.5.17.2 - Ameren Missouri
Maintenance
Preventative Maintenance and Inspection
People
The majority of the maintenance and inspection programs associated with network equipment, such as inspection and maintenance of network transformers and network protectors, are performed by resources within the Service Test group.
Organizationally, the Service Test group is part of Distribution Operations, led by a manager. Within Distribution Operations, there is a Reliability Support Services group led by superintendent. Reporting to the Superintendent Reliability Support Services are both the Service Test group led by a supervisor and the Distribution Operating group, also led by a supervisor.
The Service Test group is made up of Service Testers and Distribution Service Testers. Service Testers perform low-voltage work only. They focus on things such as voltage complaints, RF interference complaints, and testing and maintaining batteries. Distribution Service Testers perform vault inspections, network protector maintenance and calibration, and transformer maintenance including oil testing.
Manhole inspections, performed on a four year cycle and required by the PSC (commission), are performed by a contractor, typically, two-man crews.
Recently, Ameren Missouri has formed the “Underground Revitalization Department,” a team of engineers (all 4-yr degreed) focused on researching, evaluating, and developing plans for performing capital improvements to and revitalizing downtown St. Louis, including the network. As part of this group’s role, they are examining Ameren Missouri’s practices for inspecting and maintaining network infrastructure, and developing recommendations for optimal approaches. They have developed a draft document which details strategies for inspection and maintenance of network units, cable systems, vaults, manholes, indoor rooms and customer switchgear. See . .
Process
Maintenance and inspection frequencies vary depending on the type of equipment and the location.
Network Maintenance Programs
| Program | Period or Cycle |
| Network protector maintenance and testing | Two years. Primary feeder energized. |
| Network transformer oil testing Including ground switch, and main tank | Two years, done at the same time as the NP maintenance. Primary feeder energized. |
| Network transformer oil testing | Two years, primary feeder de-energized. |
| Secondary Service Compartment Inspections | Two years, includes secondary cable limiter continuity testing. |
| Vault inspections | Network vaults inspected every two years in conjunction with network unit inspections In addition, network vaults are entered annually to conduct secondary limiter continuity checks. Detailed inspection of non- network vaults every four years |
| Indoor Room Inspections | Four Year Cycle. No transformer oil testing. Includes heat gun inspection. |
| Manhole inspections | Detailed inspection every four years. Conforms to a Missouri PSC requirement. Performed by contractors. |
| Customer Owned Switchgear | Annual General Inspection. |
| Pad mounted switchgear and transformers | Inspection on four year cycle |
Technology
Information from inspections of network manholes, vaults and service compartments (adjacent manholes with bus work) is recorded on laptops (tough books). (Note that this is a relatively recent change. Historically, information was captured on paper forms and entered into computer systems.)
Inspections may be performed by either contractors (manhole inspections) or Distribution Service Testers (vault inspections).
The inspection information from manhole inspections is recorded in a Circuit and Device Inspection System (CDIS). Information from the vault inspections is entered into both Ameren Missouri developed databases used by the Service Test department to manage the inspections, and into the CDIS, the permanent repository for inspection information.
Ameren Missouri includes the taking and recording of photographs of manhole and vault infrastructure as part of its inspection programs. At the time of the practices immersion, Ameren Missouri was considering augmenting the inspection photography with infrared.
The contractor who performs the manhole inspections utilizes a camera that is attached to a tripod positioned above the hole and is lowered into the hole from the top. The visual inspection of the infrastructure within the manhole is performed by using this camera.
Distribution Service Testers who are performing vault inspections take photographs while in the vault.
Contractors performing manhole inspections utilize a half ton survey truck with a camper shell.
[1] Note that the PSC requirement for urban underground structures is for a general inspection (patrol) on a 4 year cycle, and a detailed inspection on an 8 year cycle. Ameren Missouri has elected to perform a detailed inspection on a four year cycle.
7.5.17.3 - CEI - The Illuminating Company
Maintenance
Preventative Maintenance and Inspection
People
CEI has one Underground Network Services Center responsible for performing preventive maintenance and inspections of the underground, including the networked secondary and non network ducted conduit systems. The service center is comprised of Underground Electricians who inspect and maintain the underground system.
Process
Network system preventive maintenance and inspection programs include:
| Program | Cycle or other Trigger |
| Manhole Inspection / Maintenance Program | 5 years |
| Network Vault Inspection / Maintenance | 6 months |
| Network Transformer Maintenance (Oil Sampling) | 2 years |
| Network Protector Maintenance | 6 years |
| Network Relay Maintenance | 6 years |
| Network Protector Operational Test | yearly |
Other non-network maintenance programs include 5kV oil switch maintenance, 11kV non-network vault maintenance, 37kV terminator maintenance, and 138KV Pipe Type Cable System maintenance.
Each Program will be discussed in more detail in the sections that follow. See Attachment K for a summary of Underground Ducted Systems Maintenance practices at CEI.
Non urgent corrective maintenance actions that are identified during inspection are put into a folder to be performed the next time a particular feeder is out of service. This is consistent with the approach used by many utilities.
Technology
SAP is the repository for inspection records for equipment at CEI. Each facility type, such as a manhole, has a maintenance plan assigned in CEI’s SAP system that defines the cycle or other trigger for maintenance. This system automatically initiates maintenance by moving work to the CEI scheduling system – CREWS.
A Planner would then create a work request to perform a specific inspection or maintenance task out of the CREWS system. Note that the progress is tracked manually, and the inspection findings or records of the maintenance performed are not being stored in SAP at this time; rather, they are being kept manually (or recorded in the CAD system) at CEI.
FirstEnergy is in the process of installing Cascade, a system that will house all inspection data and will interface with other key systems such as CREWS, their outage management system (Power On), etc. Cascade will track inspection and maintenance accomplishment and provide CEI with record of what field inspectors are finding. They will be able to perform inspections using hand held devices and the data collected will feed cascade.
7.5.17.4 - CenterPoint Energy
Maintenance
Preventative Maintenance and Inspection
People
Major underground preventive maintenance and inspection is performed by the Relay and Cable groups within Major Underground. The Major Underground organization includes Key Accounts, Engineering and Design resources, Support Services, and the field force responsible for all construction, operations and maintenance activities. The field force is divided into two main groups, the Relay group and the Cable group.
Both the Relay group and Cable group perform maintenance and inspection activities. The Relay group focuses on most of the non cable equipment inspection and maintenance, including performing vault equipment inspections, network protector testing, and other inspections and maintenance on devices with relays or motor operators. The Cable group focuses on inspections of cable, cable accessories and major equipment.
The Relay group is comprised of the Network Testers, and the Cable group, Cable Splicers. These field resources report to Crew Leaders, a non bargaining unit position at CenterPoint. Both the Relay and Cable groups are led by Operations Managers.
CenterPoint does not have dedicated maintenance crews. Rather, maintenance and inspection work is assigned to crews based on work priorities and resource availability.
Process
At CenterPoint the inspection frequency varies depending on the type of equipment and the location. CenterPoint gives priority to equipment supplying key customers, such as the automatic transfers for medical centers and airports. In the dedicated underground areas, CenterPoint is performing much rehabilitation work, including equipment replacements and upgrades. Over the past two years, 70% of the work they have been doing is rehab, and the remaining 30%, maintenance.
CenterPoint establishes maintenance plans, and works to accomplish these plans. Like many companies, conflicting priorities can affect this accomplishment. They will adjust their approach as needed, focusing on the maintenance areas where they get the most “bang for the buck”.
Preventive maintenance and inspection programs include:
| Program | Normal Cycle |
| Manhole Inspection/Maintenance | 1 year, 5 year, or 10 year depending on the manhole criticality |
| Vault Inspection / Maintenance | Normally 1 year, although maintenance may be performed more or less frequently depending on the vault criticality. |
| Network Protector Maintenance | 5 years testing / I year inspection |
| Padmount Transformer Inspection | Normally 1 year, although maintenance may be performed more or less frequently depending on the padmount location criticality and whether or not the pad transformer has a switch associated with it. |
See Attachment H for a copy of a complete list of their Preventive Maintenance Programs. Maintenance plans are entered into their SAP system. This system will generate maintenance orders and issue to the Crew Leaders. Crew Leaders prioritize and schedule this work. They describes their approach to maintenance as a “rifle approach” rather than a “shot gun” approach, in that they target specific locations based on priority.
CenterPoint is using an inspection checklist to guide inspectors through the various items included in the inspection. This same checklist, entitled MUDG Functional Location Inspection Sheet is used to record findings from all inspection types See Attachment I . An inspection sheet is completed for every location inspected. Inspection findings that require follow up corrective maintenance are noted and recorded by the Crew Leaders who schedule this work for completion. If the solutions to the findings require the involvement of other groups, the Crew Leaders will solicit their help. For example, corrective maintenance activities that require a customer outage will require the assistance of the Key Accounts group to coordinate with the customer to schedule the outage. The inspection sheets are filed by work center, so that CenterPoint has a record of the historic findings.
CenterPoint works closely with manufacturers to resolve product issues identified during inspection. They cited an example of there they had a problem with a certain network protector and were able to resolve it working with the manufacturer.
CenterPoint has installed remote monitoring in many of their vaults. Given that they have real time information about vault equipment from this system, they are reviewing their inspection frequencies. The remote monitoring system may present opportunities for them to spread out their maintenance cycles. One CenterPoint employee noted a situation where the remote monitoring system helped them identify a failed CT in a network protector, rather than have to wait until this was identified through an inspection.
CenterPoint is also performing periodic battery checks at locations that have battery powered or backed up microprocessor based equipment. The period depends on the anticipated battery life. As CenterPoint revisits their inspection frequencies, they plan to integrate the battery inspections with the underground inspections.
Technology
SAP is the repository for inspection records for equipment at CenterPoint.
Each facility type, such as a manhole, has a maintenance plan assigned in the SAP system that defines the cycle or other trigger for maintenance. This system automatically generates the maintenance by issuing orders to the Crew Leaders.
7.5.17.5 - Con Edison - Consolidated Edison
Maintenance
Preventative Maintenance and Inspection
People
Field Engineering Group
Con Edison has a field engineering group consisting of 40 individuals who perform a variety of quality-assurance-related tasks including:
-
Inspections/manhole inspections
-
Post-construction inspections to determine to adherence to specifications
-
Safety inspections
-
Critical manhole inspections, performed in any manhole on the immediate block of a substation, and inspected on a three-year cycle
-
Regular manhole/vault inspections, scheduled every five years
-
Infrared inspections of transformers/network protectors/substations
-
Infrared is a four-year cycle for 277/480-V installations.
-
Infrared is not programmatic, but is performed randomly, or by exception at 120/208 V. Infrared inspections are performed more frequently at sensitive customer locations such as hospitals and museums.
-
Substation infrared is annual.
-
Use strategically placed site glasses to obtain infrared views of some locations.
-
Use outside contractor to perform infrared training.
-
-
Cable and Joint failure analysis specimen retrieval and tracking
-
Fill-in work, special requests
-
Check out erroneous readings monitored through the RMS system
-
Map verification; that is, comparing what is on the mapping system to what is in the field
-
Random spot checks, focused on workmanship
-
Random equipment checks
- For example, the Field Engineering group performs random monthly spot checks of primary splice packs to be sure that the kit is complete.
-
Respond to voltage complaints
Note: This group does not routinely inspect design versus build, or as-built versus mapped.
The department is made up primarily of Splicers. People are chosen for jobs in the department by seniority.
Process
Inspection and Maintenance
Con Edison performs periodic maintenance and inspection of network distribution equipment, including network feeders, transformers, network protectors, grounding transformers, shut and series reactors, step-down transformers, sump pumps and oil minder systems, remote monitoring system (RMS) equipment, and vaults, gratings, and related structures.
Con Edison’s approach to performing an inspection is to inspect all the equipment and structures associated with a particular vault ID at a location regardless of category or classification, and even if the particular equipment associated with a particular vault ID resides within different compartments (for example, a transformer and network protector may be located in separate physical compartments even though they both share the same vault ID). This type of inspection is referred to as a CINDE Inspection, based on the name of their maintenance management system (Computerized Inspection of Network Distribution Equipment).
Con Edison performs inspections energized; crews do not take a feeder outage to perform inspections, perform pressure drop testing, or take transformer oil samples. Con Edison does not routinely exercise feeder breakers.
In an effort to more efficiently use their resources, and when nonpriority conditions allow, Con Edison takes advantage of situations where they have to enter a vault or manhole for a reason other than a scheduled inspection, and perform a nonscheduled inspection while they are in the vault. When the record of this nonscheduled inspection is recorded in CINDE, the system “resets the clock” for the next inspection date.
Network equipment at 208 V is generally inspected on a 5-year cycle. 460-V facilities, sensitive customers, facilities in flood areas, and other more critical locations are inspected more frequently, often annually. Con Edison establishes network equipment inspection cycles depending on two factors: the inspection category and the inspection classification.
The inspection category refers to the type of inspection, and includes a Visual Inspection, a 120/208-V Test Box Inspection, and a 460-V Test Box Inspection. The Visual Inspection includes activities beyond visually assessing condition and recording information, such as pressure drop testing and taking transformer oil samples. The test Box inspections involve specialized testing of network protectors with the network relay installed. Note that all of the elements of a Visual Inspection are performed along with the Test Box Inspections.
The inspection classification refers to characteristics of the inspection site that dictate the inspection cycle. For example, a “Routine” 208-V vault is visually inspected on a 5-year cycle, while a 208-V vault located in a “tidal” area would be visually inspected annually.
Con Edison considers the following classifications in determining inspection cycles:
-
Routine
-
Back-feed: banks installed on a feeder involved in a back-feed incident
-
Candidate for Replacement: commonly due to corrosion damage
-
Essential Services: critical customers
-
Flooded Bank: nonsubmersible equipment that has experienced high water levels
-
208-V Isolated Bank: units that require more frequent inspection than distributed secondary grid units
-
Remote Monitoring System(RMS), Non RMS, Unit Not Reporting (UNR): Con Edison varies inspection cycles based on the level of remote monitoring installed
-
Tidal, Water, and Storm Locations
Note that Con Edison requires employees to perform at least a quick visual inspection (QVI) anytime an individual enters a network enclosure, even if the reason for entering an enclosure does not warrant a CINDE Inspection. This type of inspection (QVI) differs from the CINDE inspection category of Visual Inspection described above, in that it is not a full, accredited inspection.
Network Protector Inspection
Network Protectors are inspected on various cycles depending on the inspection classification, as part of the CINDE Visual Inspection and Test Box Inspections.
Transformer Inspection
Transformers are inspected on varying schedules, depending on the inspection classification, but typically no longer an interval than six years. Transformer inspections are performed as part of the CINDE Visual Inspection.
Transformer inspections include:
-
Visually inspecting for leaks
-
Measuring pressure
-
Reading oil temperatures and levels
-
Taking oil samples for dielectrics and dissolved gas analysis
-
Performing pressure drop testing
-
Assessing condition of anodes and replacing if necessary
-
Performing a corrosion assessment
-
Checking bus condition
-
Checking condition of gaps/limiters, and connections
-
For 460-V units, inspect low-voltage bushing boots for debris and seal integrity
Con Edison performs approximately 8,000 inspections annually.
Cable Failure Analysis
Con Edison’s goal is to perform a failure analysis on every cable and splice failure that occurs. The utility is able to perform an actual analysis on 80 – 90% of the problems that occur; the remainder represent problems that are destroyed or inaccessible.
In addition to testing cable that failed, the utility tries to expand testing to look at the condition of adjacent cable sections that did not fail. In the case of a splice failure, crews replace all three splices and perform diagnoses on the unfailed splices to aid in drawing conclusions about the cause of the failure.
A big challenge for Con Edison is failures that occur in transition joints (between PILC and non-PILC conductors). These transition joints are commonly referred to as “stop joints.” The failures they encounter typically occur on the paper side of the joint. The utility has implemented a replacement program to install cold shrink joints to replace them. They have had good success with the cold shrink joints.
Transformer Failure Analysis
Con Edison performs a root cause analysis of all network transformer removals including units that failed in service, units that were removed because of failed dissolved-gas-in-oil-analysis (DGOA), units that were removed because of failed oil temperature, pressure, or level indications from the RMS system, and units that failed during testing.
Removed units are sent to Con Edison’s Distribution Engineering Equipment Analysis Center (DEEAC), where they are taken apart for a thorough root cause analysis. Analysis includes detailed physical inspections and review of oil test results. Common findings include excess corrosion due to tank holes or porosity, primary bushing failures due to installation defects or mechanical strain, secondary bushing leaks due to manufacturer defects or loose flex straps, evidence of partial discharge from DGOA results or from physical evidence such as carbon deposits, and evidence of arcing, again from test results or physical evidence.
Con Edison keeps detailed statistics on transformer failure performance, including the number of removed units by failure category (failed in service, failed during testing, etc.), and statistics about the causes of those failures (corrosion, insulation failure, manufacturer defect, etc.). Con Edison’s largest single cause of transformer failure is corrosion.
By understanding the root cause of transformer failures, Con Edison has increased the number of units removed based on inspection findings, monitored information, and testing results. This has resulted in a significant decrease in the number of transformers that fail in service. For example, transformer-in-service failures went from being the cause of 9% of network feeder lockouts (Open Autos or OA’s in Con Edison’s lexicon) in 2005, to being the cause of only 4% of network feeder lockouts in 2007.
Generator Maintenance
Con Edison maintains several emergency generators to be used at certain key customer sites in case of an outage. The Field Engineering group is responsible for maintaining these emergency generators. This maintenance includes monthly inspections, quarterly load tests, and annual drills where the generators are physically moved to the site and connected to the customer’s system. In order to expedite the connection of these generators in an emergency, the customers have specially designed features at their service connection points that enable a quick connection of the generators to their systems.
Technology
Inspection and Maintenance Software
Con Edison uses legacy maintenance management software called CINDE, which is an acronym for Computerized Inspection of Network Distribution Equipment. CINDE is a system that records inspection data and initiates inspections based on predetermined cycles. These cycles depend on the category of inspection (for example, a visual inspection versus a “Test Box” inspection) and various predetermined classifications of inspections (for example, a “Routine” 208-V vault is visually inspected on a 5-year cycle, while a 208-V vault located in a tidal area is visually inspected annually).
Con Edison inspectors record inspection data on hand-held devices (Tough Books). The utility requires that the inspection data be downloaded into the CINDE – Mainsaver system (Mainsaver is the part of the CINDE system used to record data) within three days following the inspection.
Inspection data that is entered into the CINDE system includes:
-
Equipment serial numbers
-
As-found and abnormal conditions, such as transformer oil level, state of corrosion, and water in the vault
-
Defective equipment or structures
-
Repairs or change-outs undertaken
-
As-left condition, such as transformer pressure and liquid level, and pressure of housing
The CINDE – Mainsaver system is also used by Con Edison to prioritize follow-up work, or outstanding defects to be corrected that are identified through inspection or other visits to network enclosures. The Electric Operations Region is responsible for prioritizing follow-up work by considering the location of the work with respect to risk to public safety, reliability impact, the type of installation, age of the outstanding defect, and the efficient use of resources.
Dissolved-Gas-in-Oil-Analysis (DGOA)
Con Edison performs Dissolved-Gas-in-Oil-Analysis (DGOA) as part of its routine transformer inspection. DGOA sampling was added to the inspection scope in 2006. The utility samples approximately 5,000 transformers per year, with the first complete round of sampling to be completed in 2011.
Con Edison implemented DGOA in an effort to identify trends in gassing profiles, so that they can preemptively remove transformers at risk of failure, minimizing the potential hazard. The utility recently purchased software called Automated Transformer Lab Analysis Alert System (ATLAAS) that will enable them to specify limits, issue alerts, and aid them in monitoring the rate of change in dissolved gas levels.
Each sample is categorized by severity with a corresponding action associated with it. A transformer categorized as “Normal” will continue to be sampled routinely; a transformer with a category of “Watch” will be re-sampled more frequently; a transformer with a category of “Recycle / Retrofilled” will be scheduled for oil replacement; and a transformer with a category of “Remove” will be scheduled for removal.
In 2006, Con Edison removed 54 transformers based on DGOA testing. In 2007, they removed 37. Con Edison engineers suspect they may have been initially too aggressive in replacing units based on DGOA, and continue to analyze trending to better understand and utilize test results.
7.5.17.6 - Duke Energy Florida
Maintenance
Preventive Maintenance and Inspection
People
Organizationally, the Duke Energy Florida resources that inspect, maintain, and operate the urban underground and network infrastructure fall within the Network Group which is part of the Construction and Maintenance Organization. More broadly, Duke Energy Florida’s construction and maintenance organization is divided into regions, with both Clearwater and St. Petersburg falling within their South Coastal Region. The Construction and Maintenance organization for the South Coastal Region is led by a General Manager. The region consists of various Operation Centers, organized either geographically or functionally throughout the Region.
The Network Group is organized functionally, and has responsibility for construction, maintain and operating all urban underground infrastructure (ducted manhole systems), both network and non - network, in both Clearwater and St. Petersburg. The Network Group is led by a supervisor who reports to the Region General Manager. The group consists of ten craft workers, five Electric Apprentices and five Network Specialists (the journey worker position), all part of the Network Specialist job family.
The Network Specialist is a jack-of-all-trades, position, responsible for all facets of UG work, including informing maintenance and inspection of underground network facilities. Network Specialists also work with the installation and maintenance of automation associated with the equipment they manage.
The Network Group at Duke Energy Florida has close ties with peers within Duke Energy sister companies throughout the country, and regularly shares information, lessons learned, and network standards with them.
Historically, the scheduling and resourcing of inspection and maintenance work has been performed by the Network Group. At the time of the practices immersion, Duke Energy Florida was modifying its process to engage the Resource Management group in providing scheduling services for inspection and maintenance activities.
Process
Network work crews at Duke Energy Florida perform regularly scheduled inspections and maintenance of all vaults, manholes, and equipment. The following table depicts program frequency, which can vary between Clearwater and St. Petersburg.
| Preventive Inspection & Maintenance Programs | Duke Energy Florida – Clearwater | Duke Energy Florida – St. Petersburg |
| Network Protector Inspection | Done in conjunction with Vault Inspections; 3 x per year to 6 x per year depending on vault criticality | Done in conjunction with Vault Inspections 1 x per year |
| Network Protector Maintenance and Testing | Every 2 years | As needed based on inspection findings |
| Vault Inspections | 3 x per year to 6 x per year depending on vault criticality | 1 x per year |
| Network Transformer Inspection and Maintenance | Done in conjunction with Vault Inspections 3 x per year to 6 x per year depending on vault criticality | Done in conjunction with Vault Inspections 1 x per year |
| Network Transformer Oil Testing | N/A Piloting dissolved gas monitoring sensor technology | N/A |
| Vault Environmental Cleanup | 3 x per year to 6 x per year depending on vault criticality | 1 x per year |
| Manhole Inspections | Every 5 years | Every 5 years |
| Network Feeder Sectionalizing Switches (RAs) – inspection and exercise | 3 x per year | N/A |
Crews perform regularly scheduled vaults and manholes visitations that include visual inspection and load checks. Note that historically, visual inspections and network load checks were performed on a separate schedule. They have been combined into one program referred to as “Load Checks.” Inspections include a visual check and cleaning of the vault. Also, crews perform an IR inspection. Then, network crews check network voltages and amperage, network protectors, transformer condition and cables. Amperage checks are performed on the secondary.
Crews check the overall integrity of the network protector cabinet, including gaskets, hands and mounting. They assure that the make that they are properly vented, and that there are no leaks. The network protector pressure is checked using a commercial liquid “soap bubble” product. Network protector amperage is checked with a CT clamp reading. Voltage readings between the network protector and transformer are compared.
The company had stopped transformer oil testing, but anticipates, with new equipment, that it will start oil sampling again soon. Duke Energy Florida typically replaces network transformers in the 25 to 30-year age range, or as conditions warrant.
As a part of an ongoing cable replacement project, cables are also checked during the Load Check against the cable replacement list.
Crews use checklist sheets during these scheduled Load Check inspection visits. Any faulty condition that cannot be immediately repaired is entered on the sheet and a repair work order is scheduled.
Technology
Completed inspection checklists are entered into the WMIS system including any defects found that need repair.
7.5.17.7 - Duke Energy Ohio
Maintenance
Preventative Maintenance and Inspection
People
Performance of maintenance and inspection of the network infrastructure in Cincinnati is the responsibility of the Duke Energy Ohio Dana Avenue underground group. This group is comprised of Cable Splicers and of Network Service Persons who perform inspection and maintenance activities in the network. Company representatives acknowledged that for a period of time, they did not attend to maintenance of their network infrastructure to the degree they are doing so today. In recent years, there has been a renewed focus on inspection and maintenance of network infrastructure.
Duke Energy Ohio also has network infrastructure in their Terra Haute office. This particular network system is comprised of 18 vaults and about 90 manholes. Field forces that maintain the network system in Terra Haute office are aligned closely with the substation side of the business. For example, splicing and maintenance of network equipment are performed by Substation Maintenance mechanics, who also perform substation maintenance work
Process
Maintenance and inspection frequencies vary depending on the type of equipment and the location. In the network, Duke Energy Ohio is performing much rehabilitation work as part of a ten year program that includes cable and equipment replacements and upgrades, and vault and manhole structural upgrades (See Network Rehabilitation). According to Duke, this rehabilitation has had a positive side effect of “capital eating O&M”, meaning that their capital investment in refurbishment has offset some maintenance expenses.
Maintenance Programs
| Program | Period or Cycle |
| Network protector drop tests | Weekly |
| Manhole inspections | Six years |
| Vault inspections | Four times per year (quarterly) |
| Network transformer oil sampling | Four years |
Technology
Duke Energy Ohio recognizes the role of technology in moving to a more predictive approach to maintenance. For example, they are installing communication enabled relaying in their network protectors which can notify an operator of a problem. They are planning to set up alarming in their PI system used to record monitored information to notify operators and network planning engineer of anomalies.
In addition to being able to monitor dynamic load, and remotely operate equipment, Duke desires for their remote monitoring system to have some sort of a life cycle count down; that is, to tell the operator or an engineer when a piece of equipment may need to be replaced.
As necessary to perform maintenance of a manhole (or vault), Duke Energy Ohio will use a specialized vacuum truck for removing debris from the enclosure.


Figure 1 and 2:
Debris Removal from Manhole


Figure 3 and 4:
Debris Removal from Manhole
7.5.17.8 - Energex
Maintenance
Preventative Maintenance and Inspection
People
Inspection and maintenance programs are developed by the Network Performance and Maintenance group within the Asset Management department. Within this group are two resources accountable for developing maintenance standards or policies for various asset types. The policies define what inspection and maintenance work is to be performed, how often, and is articulated in an associated “Activity Frequency Document.” The policies also include a refurbishment and replacement protocol for each asset type; that is, a description of what conditions should lead to either refurbishment or replacement. The approach used conforms to PAS 55. Note that the development of the maintenance policies is done jointly between asset managers at Energex and asset managers at Ergon, its sister company, serving the rural areas of Queensland. The decision to develop the maintenance and inspection plan jointly was driven by a desire for consistency, and so that both utilities could leverage a common information technology, Ellipse by Ventyx. Both Energex and Ergon are state-owned (Queensland) utilities. The Network Performance and Maintenance group has approximately 30 persons working to develop maintenance and inspection plans, and repairs.
One resource within Asset Management is responsible for taking the maintenance policies or standards and turning that into a program of work. This individual works closely with both internal and external providers to deliver the program of work.
All maintenance work is linked closely to the assets as defined in the Energex network asset register. In total, Energex has about $11B in assets. Energex’s approximate budget for inspection programs is $22 M, and for planned maintenance, $76M.
The development of the work plan and budget includes an allocation for inspection and planned maintenance. At the time of the immersion, the company was preparing for its five-year submission of a spend plan for approval to the regulatory agency in Australia (In Australia, utilities undergo a regulatory review and approval of an overall spending plan every five years). The company will likely submit a plan to hold the spending on operating expenses flat over the next five years, making it critical that they focus their investment in the right areas [1]. The company recognizes that with certain programs, like vegetation management, it is very difficult to adjust the spending levels from year to year. Therefore, it is working on strategies to reduce the unit cost of each activity.
Urban networks outside the city are mostly fed overhead. Thus, vegetation management is a large maintenance item for Energex. The current trim cycles are one year for urban areas, and a four-year cycle in the rural areas, with $40M in total spending.
Substation Inspection
Substation technicians and maintenance engineers are members of the Asset Management group at Energex and perform visual, security, and diagnostic testing of substations. The inspection and maintenance programs are developed by the Network Maintenance and Performance group within the Asset Management department. This group is accountable for developing maintenance standards or policies for various asset types such as substations. The policies define what inspection and maintenance work is to be performed, how often, and is articulated in an associated “Activity frequency document.”
In performing substation inspections, Energex differentiates relay – operated substations from non-relay operated substations (such as switchgear). Because of the difference in technology, Energex expects a different skill level in these separate substation types and have different inspection criteria and crews for each. Relay operated substations are maintained by Substation Fitter Mechanics, a more specialized position than the Electrical Fitter Mechanic who works with non-relay operated stations.
Process
Ellipse issues orders to perform either inspections or programmatic maintenance system to the field locations that will perform the work. For maintenance programs that are developed for each asset type, Energex has established a four-stage Maintenance Acceptance Criteria (called the “Big MAC”), which defines acceptance criteria to be used by inspectors and defines timelines for action depending on the criticality of the maintenance finding. The guideline includes a defect manual that guides the inspector in appropriately categorizing a finding, based on measurement readings, or visual indicators (such as rust, for example).
Findings are categorized as:
-
P1 – Critical finding – corrective maintenance must be completed within 30 days
-
P2 – Corrective maintenance must be completed within 6 months
-
C3 - Corrective maintenance must be completed within 18 months
-
C4 – Corrective maintenance can be held and scheduled when it can be worked in with other work (feeder outage for example).
If the finding is outside the acceptance criteria, Energex determines the action based on the guideline.
Note: The 11 kV: low-voltage substation maintenance protocol is covered by the substation policy.
Energex has trained operators (substation mechanics) who are focused on performing routine substation inspections (RSIs) in relay operated substations, both the 110-kV:11 kV substations, and the C/I substations (11 kV: low voltage) that are supplied by the three-feeder meshed system in the CBD. There is a periodic visual inspection, and then there is also cyclical maintenance performed by these resources. Energex has approximately 30 substation mechanics in a group who perform this work. Energex is moving to performing a visual “security” inspection on a six-month cycle (assuring that the station is secure), and a full inspection, including a visual inspection and taking readings, once every 18 months (see Table 1). The inspector records the information on a manual form. The information is then given to a clerk and entered into the system. At the time of the immersion, Energex was developing a tool for substation inspectors to enter information on-site into a tablet, but have not yet implemented this system-wide.
For non-relay operated substations, such as a transformer with a ring main unit, the inspections are performed by joint fitters who work in the hub locations. As the inspector identifies findings, he categorizes it, and records the information on a form. The information is entered into the Ellipse system on return to the office.
Energex knows how many defects of each type are in the system. Accomplishment of the corrective maintenance within the prescribed timeframe is a key performance indicator, and is reported on routinely. Energex stays current on the accomplishments of the corrective maintenance items identified by inspections.
Energex has a routine program that includes infrared thermography of substations. The company has had some problems with heating on low-voltage switchboards, which prompted this program.
The company has implemented a targeted application of partial discharge monitoring using a transient earth voltage device to address a particular problem.
Energex does not conduct any routine cable diagnostic testing. The company performs cable diagnostic testing as part of a new installation commissioning process and, of course, to find faults.
Energex is not performing routine pit (manhole) inspections.
Substation Inspection
Personnel perform routine substation inspections (RSI), including both Energex owned and customer owned substations, every six months. These inspections include a review of overall station condition including cable condition, and a review of substation security.
Energex performs full diagnostic testing of substations, including infrared testing, power transformer testing, and cable diagnostic testing (33 kV) every 18 months. Energex performs infrared inspections of substations to determine hot spots, especially switchgear and other components that have been known to have specific problems.
Technology
All asset maintenance policies and protocols are managed within an enterprise asset management technology called Ellipse by Ventyx. The maintenance cycles for all assets are kept here as well. If an inspector identifies something anomalous, they may record the finding with a photograph. Each asset has an inspection cycle assigned (see Table 1). Each asset also has a clearly defined inspection procedure as outlined in the online standards guide. Maintenance standards guides are also available in hard copy on maintenance trucks.
Table 1. Network maintenance programs and cycles.
| Program | Period or Cycle |
| Network circuit breaker | 5-year cycle |
| Network transformer | 5-year cycle |
| Pit (manhole) inspection | None |
| Work depot inspections | 5-year cycle, per regulation |
| Substation inspections | Visual security inspection every 6 months; full visual and testing inspection every 18 months |
| Customer substation inspections | 6 months |
| Vegetation management | 1-year cycle in CBD; 4-year in outlying areas with less rainfall |
[1]Queensland has established minimum service requirements, which are performance standards of reliability and service. These standards have become more stringent over the years, leading utilities to spend more to achieve the more aggressive targets. In the current environment, the regulator has relaxed the standards to 2009 - 2010 levels, and there is significant pressure on Energex to lower electricity prices. Consequently in planning their upcoming submission, the company is considering holding maintenance and inspection spending flat, recognizing that performance may drop back to 2009 – 2010 levels. One challenge that Energex faces is a difference in performance requirements between the state regulator in Queensland, which determines the spending plan and ultimately influence electricity pricing to pay for that plan, and the federal regulator. The federal regulator in Australia has a service target incentive scheme that rewards utilities on current performance that is improved over historic performance. Energex managers were addressing this challenge at the time of the immersion.
Substation Inspection
All asset maintenance policies and protocols for substation inspections are managed within an enterprise asset management technology called Ellipse by Ventyx. Each asset has an inspection cycle assigned; each asset also has a clearly defined inspection procedure as outlined in the online standards guide. Maintenance standards guides are also available in hard copy on some maintenance trucks .
If an inspector identifies something anomalous, they may record the finding with a photograph, which can be uploaded into the system.
7.5.17.9 - ESB Networks
Maintenance
Preventative Maintenance and Inspection
People
Maintenance and inspection programs are managed by the Asset Management group.
The development of maintenance and inspection programs is performed by engineers in close conjunction with a Strategy Manager who works as part of the Finance & Regulation group within Asset Management. This individual also works closely with the regulator, developing and submitting for approval a 5 year program of maintenance. The strategy works closely with the other groups in Asset Management to identify risks and prioritize programs.
The management of the execution of approved maintenance and inspection program is performed by the Program Management group, also part of Asset Management.
The execution of maintenance and inspection programs is performed by resources within Operations. ESB Networks has two operations centers, one north and one south.
Process
ESB Networks performs maintenance on a variety of equipment types. ESB Networks has established inspection frequencies within its SAP system based on equipment type and location, The system issues maintenance orders to the maintenance delivery teams for the predetermined maintenance and inspection cycles. Crews receive approximately 50,000 maintenance orders per year (total company – not just urban UG maintenance).
Orders are issued with “measurement points” associated with the expected completion time of the orders. If an order does not clear in the expected time frame, the system will re- issue the order as a high priority. Although most ESB Networks maintenance programs are cyclical, employees do have the opportunity and ability to escalate an inspection frequency or submit an individual maintenance request.
For its High Voltage underground system, ESB Networks performs seven different maintenance testing types. Not all components are subject to the full suite of tests, however. For example, transformer connections to a bus bar would not normally call for a sheath test.
Programs include bi-annual patrols of all its HV cable routes, as well as inspection and replacement programs for selected equipment including:
-
Five year program to replace oil filled cables and terminations
-
Replacement of 38kV PILC with XLPE for feeders supplying the business district
-
Replacing 9kM of leaking gas compression circuits (110kV)
-
Quarterly gauge inspections
-
Annual sheath inspections
For the Medium voltage system, ESB Networks Network Technicians perform periodic inspections of MV substations (each station visited once every four years). Orders are issued per group of substations within a particular block In addition to a visual inspection, Network Technicians perform ultraTEV™ inspections (a partial discharge inspection) at high risk locations, and check SF6 gas levels of primary switch gear. (Note that the Eaton Magnefix® style switchgear is inspected every two years). There is no proactive infrared testing.
ESB Networks does not have specific policies or procedures for preventative maintenance of its 10-20 kV conductor systems. Maintenance is performed only if there is a problem found, either by field crews or through monitoring.
All inspection information is recorded on a form at the site during the time of inspection, and then recorded into the SAP system at the office. If the crew finds an issue, it can address on the spot, it performs the necessary maintenance and records it.
Technology
ESB Networks uses an SAP business warehouse that addresses every aspect of network maintenance. The system is used to automatically issue scheduled maintenance orders to field teams, record maintenance findings, and to escalate maintenance when required. ESB Networks also uses this information in a program report to regulators who oversee the utility’s performance.
7.5.17.10 - Georgia Power
Maintenance
Preventative Maintenance and Inspection
People
Preventive maintenance and inspections of network equipment are performed by resources within the Network Operations and Reliability group. The Network Operations and Reliability group is led by a manager and consists of Test Engineers, Test Technicians, Cable Splicers and WTO’s and field supervision, which perform routine inspections of cable and cable systems, transformers, protectors, and other network infrastructure.
Vaults and manhole inspections are performed by Duct Line Mechanic and/or Cable Splicer crews depending on availability, and report to a Maintenance supervisor, part of Network Operations and Reliability. Although the Georgia Power Network Underground group does not have specific crews assigned to inspections, the Maintenance group will pull assign crew members to perform required inspections. The inspection and maintenance of network protectors is the responsibility of Test Technicians within the Network Operation and Reliability group.
Process
Inspections of vaults and manholes are on a five-year and six-year basis, respectively, on a statewide basis. Inspection crews are usually comprised of three crew members, drawn from senior Duct Line and Cable Splicers with a supervisor and possibly a WTO. Prior to inspections, the supervisor uses an Access database program to generate a blank form already populated with some specifics about the configuration of the particular manhole or vault to be inspected if a crew has filled out the information during construction or during a previous inspection. The printed inspection form does not have previous findings pre populated, assuring that the field crews must perform and record an updated inspection. Once completed, the form is populated into the Access system.
See Attachment A.
Similarly, Test Technicians generate forms from the Access database prior to network protector inspections. Completed forms are fed back into Access. All forms are kept in hard copy for seven years. If the crew identified a smaller problem at the site, and has the qualifications to implement a repair, they will perform the needed maintenance during their routine inspection; otherwise, a maintenance work order is generated by the supervisor and sent to the Maintenance group for action.
Table 1 Network Maintenance Programs
| Inspection | Period or Cycle |
| Manhole Inspection | 6-year |
| Vault Inspection | 5-year inspection, except high-priority locations, such as the Atlanta airport |
| Network Protector Inspection and Maintenance | 5-year, separate program from the vault inspection |
| Transformer Inspection | 5-year, done as part of vault inspection |
| 4kV network inspection | 4-year inspect and test on the network protectors |
Technology
Maintenance and inspection frequencies vary depending on the type of equipment and the location. For example, vault inspections at the Atlanta airport are performed yearly, while other vaults are inspected on a five-year inspection cycle. (See Manhole Inspection; Network Vault Inspection ; Network Protector Maintenance; Network Transformer Maintenance) Note that Georgia Power does not have any regulatory required maintenance frequencies that it must adhere to.
Where possible, information from inspection is also entered into the DistView software system for the Network Underground group. With DistView, inspectors can log onto the company intranet with a wireless laptop, bring up information about the location, enter data about inspections into pre-determined fields, and also add notes as findings are top-of-mind at the site and at the time of inspection. The inspector receives a monthly report of the pending corrective maintenance jobs from the Access system.
7.5.17.11 - HECO - The Hawaiian Electric Company
Maintenance
Preventative Maintenance and Inspection
People
HECO Substation resources perform maintenance and inspection of network equipment.
HECO currently is not performing any programmatic inspection and maintenance of their non-network underground facilities.
Process
Network system preventive maintenance and inspection programs include:
| Program | Cycle or other Trigger |
| Manhole Inspection, including amp readings of molimiters. | Annual[1] |
| Network Vault Inspection | 2-3 years – inspected during transformer and NP maintenance |
| Network Transformer Maintenance (Includes Oil Sampling and Pressure Testing) | 2 -3 years |
| Network Protector Maintenance | 2-3 years |
Non urgent corrective maintenance actions that are identified during inspection are put into a folder to be performed the next time a particular feeder is out of service. This is consistent with the approach used by many utilities.
Technology
See Strategic Inspection and Maintenance System.
[1] HECO’s desired schedule is to perform these inspections and take amp readings annually. In practice, they have not adhered to this schedule.
7.5.17.12 - National Grid
Maintenance
Preventative Maintenance and Inspection
People
National Grid has a strong focus on asset management. Organizationally, they have an Asset Management group led by a senior vice president. This group is comprised of Asset Strategy, Distribution Planning, Investment Management, Transformation (business transformation), and Engineering. The Asset Strategy group is responsible for establishing high level policies and strategic direction, including the development of maintenance and inspection strategies.
Execution of National Grid’s maintenance and inspection strategies is the responsibility of Underground Lines East. This group is led by a manager, and includes field resources focused on civil aspects of the underground system and a field resources focused on the electrical aspects. The Underground Lines group is responsible for both the network and non – network infrastructure in eastern NY, including the Albany network. The total UG Electric East group has 29 field resources.
The Civil Group is comprised of Mechanics, Laborers, and Equipment Operators, and is led by a supervisor. This group includes a machine shop located in Albany. The group has 23 field resources.
The Electrical Group, comprised of Cable Splicers and Maintenance Mechanics, is led by three supervisors. Cable Splicers work with cable and cable accessory installation and maintenance, including cable pulling and splice preparation. Cable Splicers are also responsible for performing manhole inspections. Maintenance Mechanics perform network switching, fault location, minor vault maintenance, and inspection and maintenance of network vaults and equipment such as transformers and network protectors.
In addition, National Grid has a company-wide Inspections Department, led by a manager, responsible for completing regulatory required inspection programs. This group consists of supervisors assigned to the National Grid regions, and a union workforce to perform routine inspections. Note, however, that network inspections within Albany are performed by crews from Underground Lines East.
National Grid does not use dedicated full time maintenance crews; rather, they schedule maintenance as a work assignment along with other work types.
Process
Historically at National Grid, there had not been much maintenance visibility for distribution network assets. Network systems are inherently reliable based on their design. As with most utilities, the implementation of asset management processes at National Grid is more mature for substation assets than for distribution assets. National Grid plans to roll critical distribution assets, such as network transformers and protectors, into the tool set they have established for managing substation assets. An example of this is the use of technologies such as the Cascade system to record information about and manage distribution assets.
National Grid has established an asset register for distribution assets. For most distribution assets, National Grid’s GIS system (Smallworld) serves as the asset register. Network protector and transformer maintenance and repair data was previously maintained locally or in AIMSS. There is ongoing corporate-wide discussion as to where the data will reside. It may migrate to CASCADE with substation data, or may be maintained locally. NYE is, and has been retaining, data locally on Microsoft Access.
National Grid has recently standardized its maintenance approach to network equipment, increasing the frequency of inspection from historical practice. One driver of increasing the maintenance frequency is to be able to gather data such as loading information. Because National Grid has no remote monitoring on their network system (beyond the substation feeder breaker), the only opportunity they have to gather information about the equipment, whether condition information or loading information, is during field inspections. In general, network facilities in the Albany network are well-maintained.
Maintenance and inspection frequencies vary depending on the type of equipment and the location.
Network Maintenance Programs
| Program | Period or Cycle |
| Network protector inspection | Annual |
| Network protector maintenance and testing | Five Years Two Years for CMD Style Protectors |
| Network transformer inspection and maintenance (does not include routine Oil sampling) | Annual |
| Vault inspections | Annual, performed in conjunction with the network transformer inspection |
| Manhole inspections | Five Years |
| Elevated Voltage Testing | Annual |
Technology
Crews use handheld devices (Symbol Units, part of Motorola) to record inspection information. This unit has the required inspection information built into it, and a mapping feature. It also contains the most up-to-date system data and previous inspection results. Appropriate codes for the inspection are entered directly into the unit and returned to the supervisor for entry into the computer database. These codes alert GIS of changes in the field.
Computapole is a mobile utilities software platform that runs on handheld devices and is customized to meet National Grid’s specific needs. Computapole is used for inspections and mapping functions on handheld devices. Once information is entered in the Computapole system, work is managed by an interface with STORMS (below) to create work requests.
Severn Trent Operational Resource Management System (STORMS) is National Grid’s work management system. The work management system includes tools to initiate, design, estimate, assign, schedule, report time/vehicle use, and close distribution work. Computapole sends inspection information to STORMS to create work requests as needed.
Inspectors do not take photographs of condition issues identified during inspection.
National Grid does not use duct line cameras.
Note that at the time of the EPRI immersion, National Grid was engaged in a corporate-wide discussion as to where network transformer and protector maintenance and repair data will reside. It may migrate to CASCADE with substation data, or may be maintained locally. NYE is, and has been, retaining data locally on Microsoft Access.
7.5.17.13 - PG&E
Maintenance
Preventative Maintenance and Inspection
People
PG&E has assigned a specific person as the “Manager of Networks”, part of the Distribution Engineering and Mapping organization. This asset manager is responsible for determining the maintenance and inspection strategies for network assets including network transformers, network switches, and network protectors. Note that the asset management of cables and cable accessories is the responsibility of a different asset manager at PG&E, located within Distribution Standards.
The Manager of Networks has a well documented asset strategy for managing network assets.
The Manager of Networks works closely with a program manager within the Electric Distribution Maintenance Program group, also part of the Distribution Engineering and Mapping organization. This program manager is responsible for defining the work processes and supporting the divisions in obtaining funding for distribution maintenance programs. The group looks closely at what assets are to be maintained, what the resource requirements are to perform the maintenance, and what the funding requirements are. They also actively work with the manager of networks to identify process improvement opportunities. See Attachment F for a sample process map developed by the Electric Distribution Maintenance Program group for performing network protector maintenance.
Performance of maintenance and inspection of the network infrastructure at PG&E is the responsibility of the Maintenance and Construction- Electric Network organization. The group is led by a Superintendent, VP, who is responsible for the secondary network infrastructure in the Bay Area Region, including San Francisco and Oakland. Note that this individual’s responsibility includes radial distribution in San Francisco and Oakland as well.
Reporting to the superintendent, VP are three Distribution Supervisor positions who supervise the network field resources, two in San Francisco and one in Oakland. In addition, there is a distribution supervisor who leads the Network Protector Maintenance / Repair shop, and a Supervisor of the Compliance group, responsible for quality compliance.
The field groups are comprised of cable splicers, a bargaining unit position (IBEW). Cable splicers perform both cable work, such as cable installation and splicing, and network equipment work, such as network protector and transformer maintenance.
In San Francisco, PG&E network crews who perform preventive maintenance work the night shift[1] . The decision to work at night is driven by two main factors. One is that regulations issued by the San Francisco Municipal Transportation Agency prevent utilities from blocking traffic during the day. The other is that loading is lower at night, enabling PG&E to clear feeders and maintain adequate capacity to meet loading. Note that in Oakland, PG&E performs network preventive maintenance with day shift crews.
In San Francisco, they typically run four 3- man crews in the evening to perform maintenance. A crew is normally made up of a journeyman cable splicer, who does most of the network protector maintenance work, and two helpers (usually apprentice cable splicers).
PG&E also has three cable crew foremen on the night shift. The cable crew foreman is a working position, with one foreman typically taking clearances and installing grounds, and the others overseeing the crews.
Inspection of manholes, including cables and cable accessories in the network, is performed by the Compliance Department, part of the M&C Electric network organization. This group performs and reports on regulatory required inspections and patrols (CPUC GO 165) of distribution infrastructure.
Process
Maintenance and inspection frequencies vary depending on the type of equipment and the location. PG&E is actively shifting its maintenance strategy from time-based maintenance to condition based maintenance approaches. An example of this is their annual sampling program of oil filled chambers within the network unit to develop performance trends for each chamber and triggers for action (see Network Transformer Maintenance / Oil Testing).
Network Maintenance Programs
| Program | Period or Cycle |
| Network protector inspection | Annual |
| Network protector maintenance and testing | Three years |
| Network transformer inspection, maintenance and oil testing Including primary chamber, ground switch, and main tank | Annual, transformer maintenance action driven by inspection and testing findings. |
| Vault inspections | Annual, performed in conjunction with the network transformer inspection |
| Vault Environmental Cleanup | Number of cleanups based on findings from annual vault inspection |
| Manhole inspections | Three years |
Technology
PG&E recognizes the role of technology in moving from time based to predictive, condition based maintenance. For example, they are installing a new, fiber based network monitoring system that will be able to monitor pressure, temperature, loading and voltage sensing of all chambers, and will enable remote control of switches and network protectors (See Remote Monitoring). The system will also enable automated generation of maintenance tags based on monitored trends.
[1] Note that Cable Splicers are assigned during the day to work on San Francisco’s radial underground system. These crews can be redirected to address network issues that may arise during the day. However, all planned work on the network is performed at night.
7.5.17.14 - Portland General Electric
People
Crews working in the CORE group primarily perform preventative maintenance and inspection on the network. In general, the CORE group uses a philosophy of repairing issues when they arise, including findings from period inspections. If crews find any significant electrical problems, they may engage Distribution Engineers for support. Civil issues are usually outsourced to external contractors for repair. The Service & Design Project Managers (SDPMs), who coordinate with the customer to make the required repairs, address structural problems in customer-owned facilities.
CORE Group
The CORE group oversees the underground facilities and has a supervisor overseeing operations and fieldwork. The CORE General Foreman reports to the Response & Restoration (R&R) Supervisor.
Crews
The craft workers assigned to the CORE group, which is a part of the Portland Service Center (PSC), focus specifically on the underground CORE, including both radial underground and network underground infrastructure in downtown Portland. Their responsibility includes operations and maintenance of the network infrastructure. An Underground Core Field Operations Supervisor leads the CORE group.
Currently, the following 16 people work in CORE:
- Four non-journeymen
- Eleven journeymen (e.g., assistant cable splicers, cable splicers, foremen)
- One Special Tester
Resources in the CORE include the following:
- Crew foreman: Crew foreman (a working, bargaining unit position), required to be a cable splicer
- Cable splicer: This is the journey worker position in the CORE.To become a cable splicer in CORE, an employee must spend one year in the CORE area as a cable splicer assistant.
- Cable splicer assistant: A person entering the CORE as a cable splicer assistant must be a journeyman lineman. All cable splicers start as assistant cable splicers for one year to learn the system and network.
The cable splicer position is a “jack-of-all-trades” position with work including the following:
- Cable pulling
- Splicing
- Cable and network equipment maintenance
- Cleaning
- Pulling oil samples from transformers
The typical underground crew consists of three people: two journeymen and a non-journeyman helper. The foreman, who is a qualified cable splicer, is one of the working journeymen on the crew. The two journeymen typically perform the work inside the manhole or vault, while the helper, typically a non-journeyman classification, stays above ground carrying material and watching the barricades and street for potential hazards.
Special Tester
PGE CORE has a Special Tester position, who is a journeyman lineman with additional training and technical skills. Outside the network, Special Testers work with reclosers and their settings, and perform cable testing and cable fault location. Within the network, the Special Tester works closely with the network protectors, becoming the department expert with this equipment. PGE has embedded one Special Tester within the CORE group who receives specialized training in network protectors from the manufacturer, Eaton.
The Special Tester usually partners with cable splicers and works as part of a crew. The “special testing” crew includes the Special Tester, a crew foreman (a cable splicer), a lineman/cable splicer, and a topman, who is a non-journeyman helper. The topman stays outside the hole and watches the manhole/vault entrance for potential hazards.
In addition to NP testing and settings, the Special Tester focuses on power quality issues, including customer complaints about voltage.
Reliability Technicians: Reliability Technicians perform infrared (IR) thermography inspections on primary systems and network protectors as part of the Quality and Reliability Program (QRP), a reliability improvement program targeted at key infrastructure. PGE has three of these IR specialists, who mainly focus on the transmission system but also work on high-priority distribution systems. Organizationally, the Reliability Technicians belong to the same group as the Special Testers and report to the Testing Supervisor.
Network Protector Crew: The CORE group has created a dedicated crew that deals with network protectors and performs other construction work. This crew is comprised of cable splicers who receive formal training and attend conferences to gain experience with network protectors. This crew includes a foreman, journeyman (who will rotate every three months), and Special Tester.
PGE has approximately 230 network protectors on the system, with half included in the 480 V spot networks, and half in the 120/208 V area grid systems. Presently, PGE has three construction/maintenance crews and will add the dedicated crew protector crew.
Maintenance Crew: Historically, work crews have been assigned a variety of work types depending on needs, ranging from new construction to maintenance and operation of the system. Due to the large number of new construction projects underway in Portland, and to assure that the demand for resources to support that construction does not erode the focus on maintenance, the CORE group is considering creating a dedicated maintenance crew that will maintain a focus on network infrastructure inspection and maintenance.
Process
PGE performs periodic inspection and maintenance of network equipment. An overview of its programs is provided in the following table.
| Preventive Maintenance Programs | |
| Network Protector Inspection, Maintenance and Testing | Testing is annual for 480 V units and every two years for 216 V units. Maintenance is performed with the primary feeder energized. Accompanied by complete vault inspection |
| Network Transformer Inspection and Maintenance | Informal cycle, usually performed in conjunction with NP maintenance |
| Transformer Oil Testing | Four-year cycle, accompanied by complete vault inspection |
| Vault Inspections | Informal cycle, usually performed in conjunction with equipment maintenance and testing |
| Vault Environmental Cleanup | Clean vaults as part of inspection |
| Manhole Inspections | Informal cycle, generally inspected every year |
Manhole and Vault Inspections
PGE’s network has 1300 manholes/vaults. Of these, 529 are vault structures, with 280 vaults containing equipment.
For vaults that contain equipment, such as network transformers or network protectors, the frequency of inspection dovetails the performance of equipment maintenance, as the maintenance of equipment is accompanied by a vault inspection. For example, 480 V network protectors are maintained annually, so the inspection of the vaults that house 480 V protectors is also performed annually.
For general purpose structures, including vaults, manholes, and handholes that do not contain equipment, PGE attempts to inspect all underground enclosures annually. However, manpower availability determines the exact cycle. At the start of each year, general work orders for inspection of manholes are created in Maximo for a particular geographical area, with each work order covering the manholes in a one- or two-block area. A crew receives these work orders and is expected to perform inspections of the general purpose enclosures when it does not have any customer work. If there is little customer work on the network, inspections can be completed for all non-equipment manholes and vaults within a calendar year.
PGE employees, not contractors, perform all inspections of general purpose structures, including both an electrical and civil (structural) review. Inspections also include a visual inspection to identify leaks, assess vault cleanliness, etc., and may include the use of IR thermography at the discretion of the inspection crew. All crew have been issued IR guns. If the crew identifies something amiss, it may bring in the Special Tester, who has a more sophisticated IR camera and has received special training in interpreting IR readings. (Note that PGE also has a cyclical IR program as part of its QRP program, which targets high-priority areas for routine IR thermography on a four-year cycle, including all network primary cables and equipment.)
Crews may take load readings on the secondary system to try identifying open limiters when inspecting vaults. Because some of the secondary feeders are difficult to access, this continuity testing is restricted to accessible secondary feeders.
Manhole/vault cleaning is bundled together with the inspection function. As part of the inspection, crews clean the manhole/vault. Crews clean vaults ahead of time if they know that they will be visiting a specific vault for maintenance work.
PGE does not use a formal inspection sheet for inspections of the general purpose vaults, although a crew completes a Field Action Report if it finds issues with a manhole/vault. The Field Action Report records follow-up corrective action identified during inspection. See Appendix B for a sample Field Action Report. If no action is needed, crews do not fill out any paperwork but the completion of the inspection is noted in Maximo. If testing of equipment is performed in the vault, then crews do not keep records of the testing.
If a crew can repair a problem without the need for engineering or design services, such as replacing a damaged ladder, it will do so while it is there. The CORE keeps limited documentation of these informal fixes as part of its “fix-it-when-you-find-it” approach. For repairs that are not done right away, the Field Action Report prioritizes them based on urgency. Electrical issues receive a “1,” the highest priority. A lid that is shattered or needs replacement receives a “2” priority. Priority “3” work is rarely undertaken because the crew tends to repair such small issues while at the site. The priorities guide the urgency of the repair but are not accompanied by specific deadlines for accomplishment. Crews do try to be as expedient and efficient as possible, scheduling work as soon as circuits are available.
Engineering generally responds to electrical problems while SDPMs handle the other tasks, such as coordination with external contractors. If vaults/manholes are in need of civil or structural repairs, PGE uses an external Level III contractor. The company has a two-year contract with the outside contractors to undertake this type of work. For large, complex repairs, a structural engineer will be used.
Engineering works closely with the CORE management to assure that these repairs are addressed. PGE notes that it has little backlog of electrical repairs but some backlog of structural repairs.
For vaults that contain equipment, inspections are performed in conjunction with the performance of equipment maintenance. For example, when a Special Tester performs protector maintenance, the crew also performs a visual inspection and IR inspection of the entire vault.
Network Protectors
Network protectors are maintained annually for 480 V protectors at spot network locations, and every two years for the 216 V protectors supplying the area networks. As part of the testing, the Special Tester connects a NP test kit. When crews inspect and maintain network protectors, the primary feeder remains energized. They re-pressurize the network protectors once they close them, using nitrogen at 2-3 lb of pressure and ensuring that there are no leaks around the enclosure. Protector maintenance is documented on index cards. PGE is presently undertaking a project to convert this process to an electronic format.
As part of the network protector testing, crews also undertake a general vault inspection, including an inspection of other equipment in the vault and civil condition. This includes inspection of the network transformer, checking and recording the transformer oil temperature (oil sampling and testing is performed as part of a separate program), and performing a general infrared inspection of the vault.
PGE does remotely monitor network protector information, including the voltage and all three-phase currents on the transformer side and bus side of the unit. This measures the power factor, temperature, position of the contact breaker, and whether it is open or closed. Part of the feeder clearance process involves checking the monitored values. If after opening a feeder breaker, the remote monitoring system indicates that one of the protectors is still closed, a crew goes out to the vault to troubleshoot.
PGE does not perform periodic drop testing, in which it opens the feeder to verify that all the network protectors will open, but it does identify closed protectors when it periodically takes a circuit out to perform maintenance.
Transformers
PGE has not had any catastrophic failures of network transformers and attributes this, in part, to the relatively low loading on the system and the area not having salted roads. It does not monitor the network transformers in any way, although a system for remotely monitoring transformer temperatures is planned.
Termination Chambers: PGE is actively replacing lead cable terminations at the network transformer with Energy Services Network Association (ESNA) style connections. Crews modify the transformer termination chambers using a new conversion kit on site. First, they establish clearance. Afterwards, the crew cuts the plate off the termination chamber, places a new termination, welds it, rewires the transformer, and re-energizes it. PGE has performed 6-12 of these conversions.
Transformer Oil Inspections: PGE does routinely sample and test oil in the network transformers. The CORE crews take the samples from all fluid-filled chambers, and an external laboratory performs the analysis. Crews de-energize the primary circuit at the feeder breaker before performing oil sampling. They are not taking a clearance, as this is not considered performing physical work on the system. They do try to schedule the pulling of oil in conjunction with feeder outages that may be scheduled for other reasons.
Historically, crews performed oil sampling and testing on a four-year cycle, but they believe that the frequency should be more often so that they can spot trends rather than react to individual high readings. They are in the process of accelerating the sampling period and have not yet decided on a timeframe.
The type of oil analysis performed on transformer samples includes oil analysis, dissolved gas analysis (DGA), power factor testing, and polychlorinated biphenyls (PCB) analysis. PGE has started using FR3 type oil (ester) on all equipment other than the network transformers, although the change is not yet complete. PGE will consider changing its network transformer specification to the use of flame retardant oil alternatives in the future.
When entering the vault to perform transformer oil sampling, crews also perform a vault inspection, including a visual inspection and the use of IR.
Infrared (IR)
As part of their vault inspections associated with equipment maintenance, crews perform infrared inspections of the major components in the vault with regular FLIR cameras. The Special Tester has more sophisticated equipment, and if crews identify an issue, they call the Special Tester to undertake a more in-depth assessment. Crews have started to undertake IR checks as part of manhole and vault entry, but this is informal and not part of the formal manhole entry requirements.
Crews use a form to document any anomalies, known as the Feeder Inspection Form. If they find an IR anomaly, they record the load to make sure that overloading is not the cause.
The Special Tester or Reliability Technician also performs IR inspections of network feeders on a four-year cycle, as part of a maintenance and inspection program separate from the vault inspections and performed in conjunction with transformer and network protector maintenance. This program is part of the QRP, a heightened inspection program for key infrastructure, including the network. In order to do this, the inspector, either the Special Tester or Reliability Technician, partners with a crew and at least a topman and a journeyman, because inspectors usually must enter the vaults.
The IR is undertaken on every component and primary joint, and the inspector looks for components that show a high temperature. Where resources permit, the inspector may also IR-test some secondary systems. If the inspector finds any abnormal conditions, the inspector takes a picture and creates a report. The issue is fixed within a week, and all reporting is by exception, with reports passed to the Network Engineering Group.
Special Testers IR test some cable joints/bends on the system. If they find a difference in temperature between joints in a cable of over 10oF (-12oC), the general practice is to deal with it within two weeks. Where the difference is between 20 and 28oF (-7 and -2oC), the problem must be dealt with immediately.
Cables and Connectors
Overall, the utility has had few issues with cable performance in the network. PGE does not perform any routine diagnostic cable testing on the network feeders, although it previously made some attempts to diagnose the primary cables crossing the river. PGE does not routinely test new cables. However, before commissioning new cable or returning a de-energized primary circuit to service, crews perform a DC hipot test. In general, PGE policies advise against leaving cables de-energized for long periods of time. If the cable has been de-energized for several weeks, the cable failed and was repaired, or the cable was modified (e.g., a section replacement), then crews perform a circuit verification test, which includes a DC hipot test. When replacing a T-body or a major component, a DC hipot test is also performed.
PGE performs very low frequency (VLF) testing on the getaway cables at substations and does not take, include, or record any tan delta measures.
Distribution Automation Inspection
PGE has a remote monitoring system that provides information from the network protector relay. All the line workers have access to this system and can determine if any network protectors are currently open. PGE would like to more effectively leverage the remote monitoring system to better ascertain the health of and troubleshoot the system.
Technology
Network Truck: The network van has the network test kit. All critical spares are either on the network truck or in easily accessible locations. The truck has a generator and pump.
Maximo: PGE uses the Maximo for Utilities 7.5 system to manage inspection reports and store details about any maintenance needed.
7.5.17.15 - SCL - Seattle City Light
Maintenance
Preventative Maintenance and Inspection
People
SCL has an Energy Delivery Field Operations department that includes a network Electrical Services group (Area Field Operations – Network) group, and a network Civil Services group.
The Electrical Services group is made of 84 total people including the supervision and a five-person cable-locate crew. (Note: this cable-locate crew does underground locating for the whole company). This group performs all construction, maintenance, and operation of the network system.
The Civil Services group consists of approximately 36 employees. In addition, SCL contracts approximately 25% of their civil construction work associated with their network system as well.
Cable Splicer Position
The Cable Splicer position at SCL is a generalist position. Cable Splicers perform all electrical aspects of network construction, operations, and maintenance. All electrical employees who work in the network are either Crew Chiefs, journeyman Cable Splicers, or apprentices in the mode of progression, working their way towards the journeyman level.
Crew Makeup
A network crew is normally made up of one Crew Chief, one or two Cable Splicers, and one apprentice. The type of work to be done and SCL work rules will dictate the appropriate crew makeup. For example, performing switching in a vault requires at least two journeyman-level employees to be in the vault. These and other work rules and safety practices are spelled out in the Washington State Safety Standards for Electrical Workers, Chapter 296-45 WAC.
Process
Preventive Maintenance and Inspection
SCL performs two main programmatic inspection and maintenance programs on network equipment:
-
Four-year maintenance cycle for network feeders. (Note: Network feeder maintenance includes transformer inspection and maintenance and manhole and vault inspection and maintenance.)
-
Four-year maintenance cycle for network protectors. (This program is completely independent of the feeder maintenance program.)
Modified Maintenance Approach
While SCL’s goal is to maintain feeders on a four-year cycle, they have fallen behind on their maintenance because of the construction workload. To address this, they have implemented two types of feeder maintenance. The first type is the “full maintenance,” which means they do a full and complete inspection and maintenance during the scheduled feeder outage. The second type is an abbreviated version of maintenance called a “modified maintenance.” This type of inspection includes a thorough inspection of any transformer exposed to the elements, such as a subsurface vault, but a shorter maintenance on a transformer housed in a surface or other dry vault. Note: any feeder that has not been maintained within six years must have full maintenance performed.
Technology
Transformer Oil Testing
Transformer oil samples are taken and tested at an SCL Testing Laboratory, rather than at an external lab.
7.5.17.16 - Survey Results
Survey Results
Maintenance
Preventive Maintenance and Inspection
Survey Questions taken from 2019 survey results - Inspection Practices survey
Question 7 : Please indicate if your company performs the following Inspection activities on a routine basis and at what frequency.


Question 11 : Are you using Infrared (iR) technology as part of your manhole and vault inspection / assessment process?


Question 12 : With which activities do you perform iR testing?


Question 14 : Are you using cameras (non iR) as part of your manhole / vault inspections (check all that apply)?


Question 25 : Please indicate if your company performs the following Maintenance activities on a routine basis and at what frequency.


Survey Questions taken from 2015 survey results - Maintenance
Question 91 : Do you perform cable limiter continuity checks (amp checks) as part of your preventive maintenance program?

Question 100 : Do you use a non-iR diagnostic camera to assess the condition of ducts and conduits?

Survey Questions taken from 2012 survey results - Maintenance
Question 6.12 : Do you perform heat gun checks as part of your preventive maintenance programs?


Question 6.19 : Do you perform cable limiter continuity checks as part of your preventive maintenance program?

Question 6.31 : Do you use a diagnostic camera to ascertain the condition of ducts and conduits?

Question 6.34 : Do your crews utilize tablets or laptop computers for maintenance


Question 6.35 : Is your record keeping done electronically or manually?


Survey Questions taken from 2009 survey results - Maintenance
Question 6.24 : Do you perform heat gun checks as part of your preventive maintenance programs? (This question is 6.12 in the 2012 survey)


Question 6.25 : Do you perform cable limiter continuity checks as part of your preventive maintenance program? (This question is 6.19 in the 2012 survey)


Question 6.36 : Do you use a diagnostic camera to ascertain the condition of ducts and conduits? (This question is 6.31 in the 2012 survey)

7.5.18 - Strategic Inspection and Maintenance System
7.5.18.1 - Con Edison - Consolidated Edison
Maintenance
Strategic Inspection and Maintenance System
(Computerized Inspection of Network Distribution Equipment (CINDE))
People
Field Engineering Group
Con Edison has a field engineering group consisting of 40 individuals who perform a variety of quality-assurance-related tasks including:
-
Inspections/manhole inspections
-
Post-construction inspections to determine to adherence to Specifications
-
Safety inspections
-
Critical manhole inspections, performed in any manhole on the immediate block of a substation, and inspected on a three-year cycle
-
Regular manhole/vault inspections, scheduled every five years
-
Infrared inspections of transformers/network protectors/substations
-
Infrared is a four-year cycle for 277/480-V installations.
-
Infrared is not programmatic, but is performed randomly, or by exception at 120/208 V. Infrared inspections are performed more frequently at sensitive customer locations such as hospitals and museums.
-
Substation infrared is annual.
-
Use strategically placed site glasses to obtain infrared views of some locations.
-
Use outside contractor to perform infrared training.
-
-
Cable and Joint failure analysis specimen retrieval and tracking
-
Fill-in work, special requests
-
Check out erroneous readings monitored through the RMS system
-
Map verification; that is, comparing what is on the mapping system to what is in the field
-
Random spot checks, focused on workmanship
-
Random equipment checks
- For example, the Field Engineering group performs random monthly spot checks of primary splice packs to be sure that the kit is complete.
-
Respond to voltage complaints
Note: This group does not routinely inspect design versus build, or as-built versus mapped. The department is made up primarily of Splicers. People are chosen for jobs in the department by seniority.
Process
Inspection and Maintenance
Con Edison performs periodic maintenance and inspection of network distribution equipment, including network feeders, transformers, network protectors, grounding transformers, shut and series reactors, step-down transformers, sump pumps and oil minder systems, remote monitoring system (RMS) equipment, and vaults, gratings, and related structures.
Con Edison’s approach to performing an inspection is to inspect all the equipment and structures associated with a particular vault ID at a location regardless of category or classification, and even if the particular equipment associated with a particular vault ID resides within different compartments (for example, a transformer and network protector may be located in separate physical compartments even though they both share the same vault ID). This type of inspection is referred to as a CINDE Inspection, based on the name of their maintenance management system (Computerized Inspection of Network Distribution Equipment).
Con Edison performs inspections energized; crews do not take a feeder outage to perform inspections, perform pressure drop testing, or take transformer oil samples. Con Edison does not routinely exercise feeder breakers.
In an effort to more efficiently use their resources, and when non-priority conditions allow, Con Edison takes advantage of situations where they have to enter a vault or manhole for a reason other than a scheduled inspection, and perform a nonscheduled inspection while they are in the vault. When the record of this nonscheduled inspection is recorded in CINDE, the system “resets the clock” for the next inspection date.
Network equipment at 208 V is generally inspected on a 5-year cycle. 460-V facilities, sensitive customers, facilities in flood areas, and other more critical locations are inspected more frequently, often annually. Con Edison establishes network equipment inspection cycles depending on two factors: the inspection category and the inspection classification .
The inspection category refers to the type of inspection, and includes a Visual Inspection, a 120/208-V Test Box Inspection, and a 460-V Test Box Inspection. The Visual Inspection includes activities beyond visually assessing condition and recording information, such as pressure drop testing and taking transformer oil samples. The test Box inspections involve specialized testing of network protectors with the network relay installed. Note that all of the elements of a Visual Inspection are performed along with the Test Box Inspections.
The inspection classification refers to characteristics of the inspection site that dictate the inspection cycle. For example, a “Routine” 208-V vault is visually inspected on a 5-year cycle, while a 208-V vault located in a “tidal” area would be visually inspected annually. Con Edison considers the following classifications in determining inspection cycles:
-
Routine
-
Back-feed: banks installed on a feeder involved in a back-feed incident
-
Candidate for Replacement: commonly due to corrosion damage
-
Essential Services: critical customers
-
Flooded Bank: nonsubmersible equipment that has experienced high water levels
-
208-V Isolated Bank: units that require more frequent inspection than distributed secondary grid units
-
Remote Monitoring System(RMS), Non RMS, Unit Not Reporting (UNR): Con Edison varies inspection cycles based on the level of remote monitoring installed
-
Tidal, Water, and Storm Locations
Note that Con Edison requires employees to perform at least a quick visual inspection (QVI) anytime an individual enters a network enclosure, even if the reason for entering an enclosure does not warrant a CINDE Inspection. This type of inspection (QVI) differs from the CINDE inspection category of Visual Inspection described above, in that it is not a full, accredited inspection.
Technology
Inspection and Maintenance Software
Con Edison uses legacy maintenance management software called CINDE, which is an acronym for Computerized Inspection of Network Distribution Equipment. CINDE is a system that records inspection data and initiates inspections based on predetermined cycles. These cycles depend on the category of inspection (for example, a visual inspection versus a “Test Box” inspection) and various predetermined classifications of inspections (for example, a “Routine” 208-V vault is visually inspected on a 5-year cycle, while a 208-V vault located in a tidal area is visually inspected annually).
Con Edison inspectors record inspection data on hand-held devices (Tough Books). The utility requires that the inspection data be downloaded into the CINDE – Mainsaver system (Mainsaver is the part of the CINDE system used to record data) within three days following the inspection. Inspection data that is entered into the CINDE system includes:
-
Equipment serial numbers
-
As-found and abnormal conditions, such as transformer oil level, state of corrosion, and water in the vault
-
Defective equipment or structures
-
Repairs or change-outs undertaken
-
As-left condition, such as transformer pressure and liquid level, and pressure of housing
The CINDE – Mainsaver system is also used by Con Edison to prioritize follow-up work, or outstanding defects to be corrected that are identified through inspection or other visits to network enclosures. The Electric Operations Region is responsible for prioritizing follow-up work by considering the location of the work with respect to risk to public safety, reliability impact, the type of installation, age of the outstanding defect, and the efficient use of resources.
7.5.18.2 - Energex
Maintenance
Planned Maintenance Outages
People
Energex has comprehensive maintenance standards. Standards are made available to employees on the internet. Energex performs a complete review of all standards on a three-year cycle. As changes occur mid cycle, Energex distributes bulletins that provide the updated information to the maintenance employee base. The Standards group employs maintenance engineers and uses contractors who follow the published Energex standards guides available on the company intranet. Contractors are used primarily for non-technical work such as vegetation management.
Process
Energex has embarked on a four year project to perform systematic upgrades and preventative maintenance of its extensive urban underground system in the CBD. As a result, Energex must engage with customers on its three-feeder mesh systems to provide a schedule for planned outages as the company works on specific sections of the CBD network.
For example, some customers are supplied by Energex via multiple transformers separated by a switch on the primary. If Energex plans to take the normal feed out of service, the customer may have to manually switch its load to received supply from the alternate feed to the building. Therefore, maintenance is usually done on weekends. Customers are good about switching their service during these outages. During planned maintenance, the customer is operating in n-1. If a customer loses service, they will have no power until Energex closes the switchboard
7.5.18.3 - HECO - The Hawaiian Electric Company
Maintenance
Strategic Inspection and Maintenance System
People
HECO has an Inspection group focused on performing asset inspections and prioritizing follow-up maintenance activities identified by inspection. This group is part of the Planning Division of the C&M Underground Division.
The group is comprised of five resources (Inspectors) plus a Senior T&D Maintenance Engineer. The Inspectors are people who have experience as Lineman in the Overhead C&M group. Inspectors are in the bargaining unit. The pay grade of an Inspector is higher than the pay grade of a Lineman.
Process
All of the programmatic inspections being performed by this group are focused on overhead facilities (wood pole inspections, for example). HECO currently is not performing any programmatic inspection and maintenance of their non-network underground facilities.
However the group may get involved with underground facility inspection and maintenance prioritization when a problem is identified by a third party such as a C&M supervisor.
For example, if a C&M Supervisor identifies a problem whose repair is not required immediately[1] (such as a padmount transformer “sweating” oil), the Supervisor will involve the Inspections group to evaluate and prioritize the repair.
The inspector will go into the field and inspect the unit and determine next steps. If the inspector does feel that the repair should be made immediately, they will create a Repair Order (RO) to fix / replace the unit.
If an inspector notes that a unit is actively leaking, they may place some oil absorbent material at the site.
If the inspectors concur with the initial assessment of the C&M supervisor who identified the problem, that the maintenance item is not an emergency and can be prioritized and scheduled for repair, they will perform a physical inspection, noting the findings, photograph the asset, and entered it into a company developed software system called the Strategic Inspection and maintenance System (SIMS).
SIMS houses the inspected data, photographs, and enables the inspection record to be viewed by others on HECO’s intranet. Note that cable diagnostic test data is not being recorded in SIMS.
Inspectors will review the findings in SIMS and assign a “severity” score based on weightings of certain characteristics. The finding is weighted depending on the environment, the type of construction, the type of structure or equipment, safety implications, and other considerations. See (Attachment J) Note that the weightings for underground equipment inspection findings are still under development at HECO, as HECO initially implemented this approach for overhead facility inspection findings.
After assigning the severity score, Inspectors will prepare work packages and send them to the C&M Planning group whose job it is to schedule the work and monitor its execution. One of HECO’s biggest challenges is that some of the identified work continues to be subordinated to other, higher priority projects, and doesn’t get addressed for some time. This has resulted in a backlog of corrective maintenance work packages.
HECO does not have written guidelines or checklists that that indicate that work of a certain type of or a certain assigned level of severity, must get done in a certain period of time. Sometimes the Inspectors will provide the Planning group with an email indicating the level of priority - but there is no list of criteria that guides the planners in prioritizing these items.
HECO noted that this lack of a written guideline is by design, in that they don’t want a document that says they must do something in a certain period of time, which could limit their scheduling flexibility. They also indicated that the relative priority of projects are changing all the time, so that if they did document the response to certain kinds of activity they would have to keep updating the document to keep it current.
Technology
HECO is using a work management system called Ellipse, by Mincom.
HECO is using a home developed system for creating Repair Orders (RO’s).
HECO is using a home developed software package, SIMS, to record and prioritize inspection information. Data, including photographs, associated with inspections are recorded in this system. Inspectors use field laptops to record inspection information into SIMS.
SIMS inspection data is available on HECO’s intranet.
HECO has 2 websites for posting inspection and corrective maintenance information - one where all the inspection information goes (from SIMS), and the other with information about the work packets that are created to perform follow up work indentified by the inspection. After the inspectors review the information they gathered by inspection, they create “work packets” for the findings that must be corrected. These work packets are the ones that are sent to the planning group to be scheduled for completion. Work packets can be reviewed at the second website.
Inspectors can utilize SIMS to review both the inspection data, and the progress of any follow up work.
[1] If a problem must be addressed immediately, the C&M supervisor will create a repair order, bypassing the Inspections group, with the work being treated as an emergency repair.
7.5.18.4 - Survey Results
Survey Results
Maintenance
Strategic Inspection and Maintenance System
Survey Questions taken from 2019 survey results - Inspection Practices survey
Question 24 : In determining your maintenance frequency, do you perform a risk or condition assessment of your individual equipment, (manholes, vaults, etc.), and vary your maintenance approach based on that assessment? (For example, a higher risk vault inspected more frequently than a lower risk vault)


Question 25 : Please indicate if your company performs the following Maintenance activities on a routine basis and at what frequency.


Survey Questions taken from 2015 survey results - Maintenance
Question 80 : In determining your maintenance frequency, do you perform a risk or condition assessment of your individual equipment, (manholes, vaults, etc.), and vary your maintenance approach based on that assessment? (for example, a higher risk vault inspected more frequently than a lower risk vault)


Question 85 : Please indicate if your company performs the following activities on a routine basis and at what frequency.


Survey Questions taken from 2012 survey results - Maintenance
Question 6.1 : Do you have a documented, up to date maintenance guidelines for performing maintenance on network equipment? (Example: network transformer maintenance guideline)

Question 6.2 : In determining your maintenance frequency, do you perform a risk assessment of your individual equipment, manholes, vaults, etc and vary your maintenance approach based on that risk? (For example, a higher risk vault inspected more frequently than a lower risk vault)


Survey Questions taken from 2009 survey results - Maintenance
Question 6.2 : In determining your maintenance frequency, do you perform a risk assessment of your individual equipment, manholes, vaults, etc and vary your maintenance approach based on that risk? (For example, a higher risk vault inspected more frequently than a lower risk vault)


Question 6.3 : Do you have a documented, up to date maintenance guidelines for performing maintenance on network equipment? (Example: network transformer maintenance guideline) (This question is 6.3 in the 2012 survey)

7.5.19 - Switchgear Inspection and Maintenance
7.5.19.1 - Duke Energy Florida
Maintenance
Switchgear Inspection and Maintenance
People
Regularly scheduled inspections and maintenance of all switchgear in Clearwater and St. Petersburg are performed by craft workers, Network Specialists and Electrician Apprentices, within the Network Group, part of the Construction and Maintenance Organization. The Network Group is led by a supervisor, and consists of ten craft workers, five Electric Apprentices and five Network Specialists (the journey worker position).
Duke Energy Florida’s construction and maintenance organization is divided into regions, with both Clearwater and St. Petersburg falling within their South Coastal Region. The Construction and Maintenance organization for the South Coastal Region is led by a General Manager.
A Project Manager (part of the Project Management group) will aid in the scheduling and oversight of inspections and maintenance for crews.
Process
Duke Energy Florida network crews inspect switchgear - both network sectionalizing switches, referred to as “RA” (rocker arm) switches, and Automated Transfer Switches, referred to as ATS switches - on a regular basis during vault inspections (see Figures 1 and 2). The frequency of inspection depends on the conditions at the site and the criticality of the device location, and can range from once per year to up to six times per year. For example, switchgear associated with hospitals are inspected and maintained six times per year (every 2 months). In general, Automatic Transfer Switches (ATS) not associated with critical customers are inspected twice per year.

Figure 1:
Network feeder primary sectionalizing switch (RA) switch

Figure 2:
Network feeder primary sectionalizing switch (RA) switch
Costs for performing switch inspection and maintenance are budgeted separately from other maintenance expenses.
Switch inspection and maintenance is comprehensive including items such as:
-
Visual inspection vault
-
Visual inspection of the switch, barriers, insulators, arresters
-
Record the switches controller’s setting(s)
-
Manually operate (exercise) the switch
-
Check the switch for automatic operation by source-loss simulation
-
Inspect fault indicators (RA switches have remote reporting FCIs)
-
Perform Infrared scan
Information from the inspection is recorded on an inspection form, including an assessment of the priority or severity of the finding. See Attachment J . Information from the inspection is entered into a computer system, and the hard copy form is maintained in a file. Duke Energy Florida has a “Further Work Ticket Process” which is initiated to pursue remediation for corrective maintenance items identified by inspection. The repair schedule is dictated by the priority of the finding.
Duke Energy Florida does have SCADA control and monitoring of most switchgear locations. SCADA may also alerts crews to switchgear conditions that need immediate attention. For example, Duke Energy has recently experienced a number of alarms from proximity sensors which were installed to ATS’s as part of the installation of distribution SCADA. Proximity sensors were added to these devices to confirm operation of the device by detecting the position of the switch blades using the sensor. The sensors can trigger alarms which result in the performance of on-demand inspections by network crews. Note that the recent experience in these alarms was determined to be the result of a performance issue with the sensor itself, and the Duke Energy Florida Network Group is in the process of replacing these sensors.
Technology
Switchgear checklist Inspection and Maintenance forms are filled out on site and entered into the online WMIS workflow management system.
SCADA utilizes a 900 MHz radio system.
7.5.20 - Terminator Maintenance (37kV)
7.5.20.1 - CEI - The Illuminating Company
Maintenance
Terminator Maintenance (37kV)
People
CEI has one Underground Network Services Center responsible for performing preventive maintenance and inspections of the underground, including the networked secondary and non network ducted conduit systems. The service center is comprised of Underground Electricians who inspect and maintain the underground system.
Process
CEI inspects 37kV oil filled terminations (spreaders) on 6 month cycle. These devices contain oil under pressure and are inspected for leaks and to assure they have adequate oil and oil pressure.

Technology
37kV Terminator maintenance is recorded manually on a 37kV Spreader Maintenance form. See Attachment Q
7.5.21 - Testing Laboratory
7.5.21.1 - AEP - Ohio
Maintenance
Testing Laboratory
Technology
AEP has a test laboratory (Dolan Labs). Network component testing and analysis may be performed at Dolan, or sent to external laboratories.
7.5.21.2 - Ameren Missouri
Maintenance
Testing Laboratory
Technology
Ameren Missouri has a laboratory testing facility. Transformer oil testing is being performed at the chemistry lab.
Ameren Missouri presently performs component failure analysis at their Underground Construction department location. Ameren Missouri also uses and will continue to use external laboratories to perform failed component analyses.
7.5.21.3 - CEI - The Illuminating Company
Maintenance
Testing Laboratory
Refer to:
( Cable Design)
( Unsatisfactory Performance Report)
( Network Transformer Maintenance )
( Failure Analysis (Cable, Transformers) )
BETA Lab
People
First Energy has a 60,000 sq ft, state of the art laboratory and testing facility, called the Beta Laboratory, for performing measurement, testing, calibration, electrical failure analysis, and safety and health training services. The Beta Lab provides services to both FirstEnergy operating companies, such as CEI, and offers for profit services to outside entities.
See Attachment X for a brochure that summarizes the Beta Lab’s capabilities.
Organizationally, the Beta Lab is part of the FirstEnergy Nuclear Operating Company (FENOC), but provides services to all FirstEnergy companies, including energy delivery companies, such as CEI. About 15% of it the Lab’s internal (FirstEnergy) work is focused on the energy delivery part of the business.
The lab is made up of 65 permanent employees, with some employees located at remote sites, but most working at the lab site itself.
The Beta Lab is ISO 9001 registered.
Process
The Beta Lab consists of five primary work units:
- Chemistry Unit, which performs testing such as transformer oil analysis for substation and network transformers,
- Metrology, which provides equipment testing and calibration services, such as recalibrating a crimping tool. (Note that this service work does not include meter testing, relay testing, or rubber goods testing – these services are provided to CEI by other test facilities, such as the Central Electric Lab, located in Akron.)
- Fire and Safety Services, which includes the provision and testing of fire extinguishers, as well as training services.
- Metallurgy, which performs metal failure investigations, such as analyzing a crane failure or defective truck parts.
- Component Material Testing, which performs dedication testing inspections for new materials (such as a new cable), electronic circuit card analysis, and electrical failure forensic analysis, such as cable splice failure analysis. The result of the failure analysis is a detailed report, which summarizes the evidence revealed during the investigation. The report may also include a discussion of the root cause and a recommendation. See Attachment Y
Technology
The Beta Lab uses technology extensively in the performance of its work. Some of this technology is “State of the Art”, such as their Scanning Electron Microscope (SEM), the camera based device they are using to scan electronic circuit cards to identify and catalogue failures, and an employee developed simulator to test Nuclear control rod operations control systems.
Information technology is also widely used, including databases for recording equipment calibration information, and test results. As an example, the Beta Lab is recording oil testing results in a Laboratory Information Management System (LIMS). This system provides indication and trending information from oil testing such as Dissolved Gas Analysis (DGA). The Beta Lab is pursuing tying this information with Energy Delivery Work Management systems, so that historical trends from LIMS can be used to drive the creation of work requests to inspect, maintain or replace equipment.
7.5.21.4 - CenterPoint Energy
Maintenance
Testing Laboratory
People
CenterPoint Training and Major Underground management resources perform analysis of failed splices.
Process
CenterPoint performs an analysis on each splice failure to understand what caused the failure.
This analysis is performed in-house , by CenterPoint Training and Major Underground management resources.
7.5.21.5 - Con Edison - Consolidated Edison
Maintenance
Testing Laboratory
Refer to:
( Cable Testing / Diagnostics)
People
Cable Testing Laboratory
Con Edison has its own cable testing laboratory, which has been in operation since the 1970s. This laboratory has over 100,000 cable and accessory specimens. Sometimes the lab sends specimens to outside labs to obtain independent analysis and opinions.
Con Edison invests in keeping its laboratory staff current on the latest thinking in cable testing. They are active in industry groups. They invest in rotating new people into the cable department, including engineers from Con Ed’s Gold program (a mentoring program for high potential engineers and business professionals).

Figure 1:
Photograph of portable partial discharge detector being developed / tested by Con Edison at the Cable Testing Laboratory
Distribution Engineering Equipment Analysis Center
Con Edison has recently launched a new team dedicated to the analysis of electric distribution equipment. The mission of the Distribution Engineering Equipment Analysis Center (DEEAC) is to optimize the performance of distribution equipment through a system safety approach that utilizes data trending and incident analysis. To support this mission, the team is focused on enhancing the safe operation of distribution equipment and also improving overall system reliability by proactively mitigating operational risk. These goals will be achieved through targeted forensic analysis, data characterization of all field-returned equipment, and quality assurance of distribution equipment. Con Edison is dedicated to supporting the mission of DEEAC with a shared focus on continuously improving system safety.
7.5.21.6 - Duke Energy Florida
Maintenance
Testing Laboratory
People
Failed equipment identified by field crews is sent to the Standards group for analysis via an informal process. Within Standards, there is a component engineer who may perform forensic analysis on failed equipment to understand failure causes.
Process
Performance of the forensic analysis within Duke Energy Florida is dependent on the complexity of the failure and the backlog of work for the component engineer. If Duke Energy is not able to perform the failure analysis internally, Standards will engage external laboratories to assist with failed component analyses.
7.5.21.7 - Duke Energy Ohio
Maintenance
Testing Laboratory
Technology
Duke Energy Ohio has a laboratory testing facility at Queensgate, in Cincinnati.
They are presently considering performing network transformer oil diagnostic testing at this facility.
This laboratory does not perform forensic analysis on failed cables or failed cable splices. Duke Energy Ohio utilizes external laboratories to perform forensic analysis on failed cable and cable splices.
7.5.21.8 - Energex
Maintenance
Testing Laboratory
People
Energex has a Network Performance and Maintenance group, responsible for implementing the maintenance and policy standards, and for monitoring the performance of the system. Any failed equipment identified which has been in service greater than two years is sent to this group for evaluation.
The group is comprised of engineers who perform forensic analysis in failed equipment to determine root causes, such as cutting open and analyzing a failed joint. Note that failed equipment which has been in service less than two years is sent directly to the Standards group, as early failures could be indicative of a product issue, rather than a workmanship / aging / or other issue.
Some issues are referred to the Procurement group, especially if workers in the field feel there may be a quality problem with a part or piece of equipment. Procurement then liaises with the vendor to determine if there is a part/equipment quality control problem.
Process
The Network Performance and Maintenance group liaises with the Standards group as necessary. Any workmanship issues are normally shared with the OAC for investigation.
7.5.21.9 - ESB Networks
Maintenance
Testing Laboratory
People
ESB Networks has a forensic lab for analyzing failed cables and joints located within the ESB Networks training center in Portloaise. The failure analysis is performed by both the training coordinator within the training facility responsible for UG cables and the Asset Manager for cables and his team.
Process
ESB Networks performs analyses on all failed joints, other than situations already identified, such as cable dig-ins. About 70 percent of all failed joints for any cause end up being analyzed. It is notable that ESB Networks analyzes all failed transition joints. Results of the analysis are summarized in a report, and significant findings are communicated to the field force through bulletins know as Technical Notifications, or TNs.
A noteworthy practice at ESB Networks is interaction among the training coordinator for cables, the asset manager for cables, and the field force (Jointers). This interaction has resulted in close working relationships and good two way communication between the Jointers, engineering and training. As a result of this close relationship, the Jointers do not hesitate to bring information about problems with joints back to “the office.” Trainers noted that they try to help the Jointer understand the science of joint preparation so that the jointers have a better appreciation for the importance of the steps associated with the preparation (see Figures 1 and 2).

Figure 1:
Cable Forensic Analysis

Figure 2:
Joint preparation using ESB Networks specific cut back template
The Training and Asset Management groups have a close working relationship and share the process of performing forensic analysis and preparing summaries. As an example of the effectiveness of these working relationships, the Training and Asset Management groups worked with a manufacturer to include ESB Networks-specific instructions in its cable splice kits. Much of the feedback to customize these instructions came directly from feedback from a field Jointer.
7.5.21.10 - Georgia Power
Maintenance
Testing Laboratory
People
The Network Underground group has a testing laboratory located at its centralized facility in Atlanta. The lab is managed by a senior engineer in the Network Underground group and staffed by Test Engineers and Test Technicians on an as needed basis. Network Underground Test Engineers, Test Technicians, and Network Engineers all have access to the network underground test Lab.
Process
The Georgia Power Network Underground testing facility is used to testing network system equipment, cable, and failed components. The test lab also performs routine commissioning tests on certain incoming items, such as transformers and network protectors before they are rotated into stock or deployed in the field.
For example, when a new transformer arrives, Test Technicians perform TTR and Meggers tests, check the oil level and its dielectric properties, and then record the nameplate information including serial number into the Georgia Power GIS system before it is put into stock.
The lab is also used for testing of failed components as most forensic analysis is performed in-house. In the event a cause of a failed component cannot be determined, the Network Underground senior engineers may turn the failed equipment over to the manufacturer or send it to an outside, third-party analysis group, such as NEETRAC.
Technology
EPRI researchers were impressed by the tools, equipment, and orderly management of the testing facility.
7.5.21.11 - PG&E
Maintenance
Testing Laboratory
Technology
PG&E has a high voltage testing facility at their research and development center in San Ramon.
Beginning in 2010 PG&E began transitioning the testing of network transformer oil samples from external laboratories to their San Ramon facility. During the transition phase, PG&E is testing both internally and in an outside laboratory. This parallel testing ensures the consistency of results and provides verification of the quality of the work undertaken by PG&E’s laboratory.
PG&E is presently implementing a failure analysis laboratory at their Livermore facility to be able to perform forensic analysis on failed equipment such as cables and splices. PG&E also uses and will continue to use external laboratories to perform failed component analyses.
7.5.21.12 - SCL - Seattle City Light
Maintenance
Testing Laboratory
Refer to:
( Preventive Maintenance and Inspection)
Technology
Transformer Oil Testing
Transformer oil samples are taken and tested at an SCL testing laboratory, rather than at an external lab.
7.5.21.13 - National Grid
Maintenance
Testing Laboratory
Technology
National Grid has two testing laboratories for performing failed equipment analysis. One is located in Syracuse, NY and the other in Worcester, MA. The laboratories analyze failed equipment and materials, including items such as splices, fire damaged cables or equipment, and insulation (e.g. for water presence).
The findings from the analysis are summarized in a Failure Report, which includes the following major sections:
i) Event Description ii)Description of Failed Equipment (and any reference material, if needed) iii) Failure Examination / Material Dissection iv) Analysis and Conclusions. See Attachment C for a sample Failure Report.
External services are used by National Grid as required for certain analyses.
7.5.22 - Vault - Manhole - Cleanup
7.5.22.1 - AEP - Ohio
Maintenance
Vault - Manhole - Cleanup
People
Routine vault and manhole cleaning are the responsibility of the Network Mechanics. Severe cases may be assigned to AEP’s civil contractor.
Process
As a part of its routine vault and manhole inspection program, network crews are responsible for cleaning and draining the enclosure and for power washing the equipment if necessary. The bread trucks used by AEP Ohio network crews do contain a vacuum pump for removing water (see Figures 1 and 2).

Figure 1:
Vacuum pumping of manhole water

Figure 2:
Manhole water being ejected
Technology
As a part of its enhancements to the remote monitoring system, AEP Ohio is adding the capability of remotely monitoring fluid levels in network protectors and in the vaults. The monitoring system will issue an alarm when high fluid levels are detected.
The bread trucks used by AEP Ohio network crews do contain a vacuum pump for removing water (see Figure 3).

Figure 3:
Bread Truck vacuum pump cabinet
7.5.22.2 - Ameren Missouri
Maintenance
Vault - Manhole - Cleanup
People
Vault and manhole cleaning is performed by System Utility Workers, part of the Underground Construction department.
This department is comprised of Cable Splicers, Construction Mechanics, and System Utility Workers. Cable Splicers and Construction Mechanics are journeymen positions, with Cable Splicers performing work with the electrical infrastructure such as making up joints and terminations, and Construction Mechanics performing the civil aspects of the work. Note that at the time of the practices immersion, Ameren Missouri was implementing a new position, called the System Journeyman, which combines the duties of Cable Splicers and Construction Mechanics.
System Utility Workers serve as helpers to the other two positions, and perform duties such as cable pulling and manhole cleaning.
Process
Vaults that require clean-up are identified through the manhole and vault inspection programs.
Technology
See figure 1

Figure 1:
Ameren Missouri Vactor truck, used for vault cleaning and vacuum
7.5.22.3 - Duke Energy Florida
Maintenance
Vault - Manhole - Cleanup
People
Network crews are used to clean manholes and vaults in Clearwater and St. Petersburg.
Cleaning of vaults on customer property are the customer’s responsibility, although inspections of customer property are made by Duke Energy Florida crews.
Process
All vaults are inspected three times a year in Clearwater, and once a year in St. Petersburg. As part of the inspection Process, manholes and vaults are cleaned if necessary. During the rainy season, additional inspections and cleanups may be required. Also, when pumps show as failed as reported by the Sensus system, crews will visit the manholes and vaults to clean the holes and address any environmental issues, and repair or replace the failed pump.
Technology
Pumps are monitored by the Sensus system. Dispatchers and the Network Group receive alarms of failed pumps.
7.5.22.4 - Georgia Power
Maintenance
Vault - Manhole - Cleanup
People
Vault and manhole cleaning are the responsibility of the Maintenance crews who report to a Distribution Supervisor of maintenance within the Network Operations and Reliability group. The maintenance supervisor has access to all work orders received from routine inspections of vaults and manholes, as well as responsibility for any immediate calls for maintenance from the Operations and Reliability group and the Network Underground engineering group.
Process
As a part of its routine vault and manhole inspection program, inspectors note the condition of vaults and manholes and whether they need to be cleaned. Entry of the inspection finding that a cleaning is required into the Georgia Power Access system generates an automatic work order to the maintenance group.
Vaults and manholes are cleaned by using vacuum trucks (See Figure 1). Debris is taken to a holding yard, put in a holding bin, and inspected for contamination. If the debris inspection determines contamination, the debris is first stored in hazardous materials bins before being sent to appropriate third-party disposal processors. All other debris is disposed of in a conventional manner.

Figure 1:
Vacuum Truck
If water is found during inspection, inspectors generate a work order to maintenance to have the vault or manhole pumped using water vacuum trucks. After testing, if the water is free of contamination, a special filter sock is fitted to the truck’s release valve and contaminant-free water is filtered through the sock and pumped into the street. Where contamination is found, the water is held in the vacuum truck holding tank and sent to the maintenance yard where is stored in hazardous waste containers for shipment to the appropriate waste disposal company for processing.
Technology
As a part of its remote monitoring system, the Network Control Center can monitor fluid levels in the protectors and in the vaults. The monitoring system issues an alarm to the control room when high levels are detected. Every morning Maintenance and Operations receive a monitoring report of fluid levels in vaults and manholes and any moisture alarms that might have tripped.
7.5.22.5 - PG&E
Maintenance
Vault - Manhole - Cleanup
People
PG&E has hired an external general contractor to perform vault cleaning and environmental cleanups. The contractor performs a turnkey service, and provides all the equipment for the work, including trucks. All work is supervised by a PG&E inspector who is on site during the vault cleaning.
The contractor will coordinate with other PG&E groups as necessary to complete the vault cleaning. For example, they will work with PG&E paint crews for asbestos abatement.
Process
Vaults that require clean-up or are identified as having environmental issues are recorded on a notification tag during the course of the annual inspection and maintenance procedures. In 2009, there were 26 vaults identified by maintenance crews for clean-up. The vault cleaning is performed with the vault energized.
The contractor removes any biohazards, and them vacuums and power washes the vault. The cables and any components that are energized are not power-washed.
In the majority of cases the need for environmental clean up of the vault is a direct consequence of their illicit use by vagrants as temporary sleeping quarters and/or drug use. In order to limit this, following the clean-up, the manhole covers are replaced with SWIVELOC covers, a vented manhole system using a solid rather than a vented cover (See Manhole Replacement Program.)
Throughout 2010 there has been a continued focus on environmental clean up of underground vaults. PG&E projects that 86 vault locations will undergo environmental cleanup during 2010.
7.5.22.6 - Portland General Electric
Maintenance
Vault - Manhole - Cleanup
People
The crews in the CORE group are responsible for both radial and network underground facilities in the downtown CORE. Vault and manhole cleaning is performed in conjunction with the performance of inspection and maintenance work, either prior to or during the inspection and/or maintenance.
Process
At the start of every year, general work orders for inspection of manholes are created in Maximo for a geographical area, with each work order covering the manholes in a one- or two-block area. A crew receives these work orders and is expected to perform inspections of the general-purpose enclosures when it does not have any customer work. As part of this normal vault and manhole inspection program, crews clean the structure if needed. They clean the structure in advance if they know that they will enter a specific vault to perform maintenance work.
At some point, the city decided to tie the sewage system to the storm drain system so high water levels and flooding may see sewage flow into vaults. If crews notice evidence of sewer gases in manholes/vaults, they do not enter the space and instead call for it to be cleaned. Crews call the repair organization and arrange for a contractor to clean the manhole/vault.
7.5.22.7 - References
EPRI Unde rground Distribution Systems Reference Book (Bronze Book)
7.6 - Operations
7.6.1 - Determining a Feeder to be De-energized
7.6.1.1 - AEP - Ohio
Operations
Determining a Feeder to be De-Energized
People
It is the responsibility of the Network Mechanics to determine a feeder is de-energized before performing work. Crews will often work with the Distribution Dispatchers as well to verify that feeders are de-energized.
Process
If any network maintenance, repair, or emergency work must be performed on the network, field crews have multiple fail-safes to determine that the feeder is de-energized before performing work.
Distribution Dispatchers control the system and will open feed breakers. Substation personnel perform the grounding of the feeder at the substation.
Workers establish perimeter grounds at the nearest three transformers to the work site. AEP Ohio works with two primary switch configurations: wall-mounted solid dielectric vacuum switches (Elastimold MVI), which is the new design, and transformer-based switches, which is the historical design.
If crews need to cut into a cable and there are no visible grounds, crews must spike the cable while wearing insulated rubber gloves, and using a hydraulic powered remote spiking device. If the crew needs to test/repair all three legs on a Y-splice or all four legs on an H-splice, they spike the bus to prove it is de-energized.
Technology
All new Y- and H-splice busses, prepared with 600-amp separable connectors, now have built-in spike probes (Elastimold Spiking Aids, see Figures 1 and 2). These enable a worker to remove the cap and assure that the cables are grounded by placing the spiking tool through the probe at the joint without having to spike the cable itself. As AEP Ohio crews service lines and splices, they are replacing older splices with the new splice that include the spike probes.

Figure 1:
Separable connector joint with Spiking Aid (1 of 2)

Figure 2:
Separable connector joint with Spiking Aid (2 of 2)
7.6.1.2 - Ameren Missouri
Operations
Determining a Feeder to be De-energized
People
Cable Splicers within the Underground (UG) Construction group are responsible for repairing failed cable and are thus involved in determining if a feeder is de-energized. The (UG) Construction group is organizationally part of the Underground Division, responsible for underground infrastructure within a defined geographic territory that includes downtown St. Louis, and thus, the St. Louis network infrastructure. The Underground Construction group is responsible for all of the conventional (manhole and conduit system) underground in the Division.
Process
Ameren Missouri does not spike cable. They will confirm that the cable is de-energized by testing for back pressure at the station, installing grounds to establish a safe work area in conformance with their clearance (WPA) procedures, and identifying the cable to be cut based on mapping, cable position, visual indication, and cable tags. Ameren Missouri will cut the cable with a remotely operated (from outside of the hole), hydraulic guillotine cutter.
Technology
Ameren Missouri uses a remotely operated, hydraulic guillotine cutter to cut cable.
7.6.1.3 - CEI - The Illuminating Company
Operations
Determining a Feeder to be De-energized
People
UG Electricians within the UG Network Services department are responsible to assure that feeders a de-energized using appropriate testing and grounding procedures.
Process
UG Crews who will need to work on a de - energized feeder will follow CEI’s process for obtaining a clearance on that feeder. For network feeders, the switching steps have been pre-written are used by the DSO to develop orders to provide clearance.
The feeder breaker itself may be opened by a switchman, but most often is opened by an UG Electrician.
The UG Electrician will utilize the manhole print and a device called a “Sound Coil”[1] to aid in determining which feeder in a given hole is de - energized, before attempting to cut and ground that feeder.
More specifically, CEI will send an UG Electrician into the hole with a feeder print and the sound coil device to determine which cable is deenergized. When the cable has been determined, the electrician will place the cutter head of the cable cutting device on the cable. CEI will then send a second Electrician into the hole, who will verify the selected cable by using the manhole print and applying the sound coil. Only when this dual check is complete, will CEI commence with the cable cut.
Note: This verification step was added to CEI’s procedure for de-energizing a feeder as a result of a post incident investigation of an incident where an employee marked and cut the wrong cable.
The UG Electrician will use an electrically operated hydraulic cutter to cut and ground the cable. This device is operated remotely, with the hose and pump located out of the hole, away from the manhole opening, and placed on a protective blanket[2] . The Electrician himself wears protective clothing, including dielectric shoes when operating the device.
Technology
The UG Electrician will utilize a device called a “ Sound Coil ” to aid in determining which feeder in a given hole is de- energized.
The UG electrician will utilize a remote hydraulic cable cutter to cut and ground the cable across the cutter head.
[1] The Sound Coil is a device that emits a tone when sensing current on a feeder (See “Sound Coil” for more information.)
[2] The only situation in which a CEI crew member would cut a cable while positioned in the hole is if they can see and confirm that both ends are cut free.
7.6.1.4 - CenterPoint Energy
Operations
Determining a Feeder to be De-energized
People
Cable Splicers within Major Underground are responsible to assure that feeders are de-energized using appropriate testing and grounding procedures.
Process
Substation Operators will open the feeder breaker under the direction of the Real Time Operations Dispatchers. Major Underground will check as dead and ground the feeder.
Major Underground crews who need to work on a de-energized feeder will follow CenterPoint’s process for obtaining a clearance on that feeder. For network feeders, the pre-written switching steps are used by the Distribution Dispatcher to develop orders to provide clearance. The Cable Splicer will utilize the maps, field labeling, and an ammeter to determine which feeder in a given hole is de-energized before attempting to cut and ground that feeder. Using maps and field labeling, Cable Splicers will carefully compare the physical position of the feeder in the hole with the documented position on the maps. In addition, the ammeter test is used to confirm that there is no load on the feeder.
After determining which cable is to be cut, the Cable Splicer will begin to carefully strip the cable. During this process, the Cable Splicer will look for evidence to confirm the cable is de-energized. For example, when removing the semi-conductor he will be looking for “spitting”. This will be followed by a “hair” test. After physically stripping the cable jacket and cutting past the semiconductor, the insulation will be notched while wearing rubber gloves and sleeves. Seeing no evidence that the cable is energized, the gloves will be removed to see if the hair on the arm stands up. Finally the cable will be touched and the cable cut completed.
CenterPoint is not using a remotely operated cable cutter. The Cable Splicer cuts through the de-energized cable in the hole.
Note: CenterPoint is presently reviewing their existing processes.
7.6.1.5 - Con Edison - Consolidated Edison
Operations
Determining a Feeder to be De-energized
Process
When Con Edison de – energizes a feeder, they do not open the network protectors, or pull the fuses. They also do not disconnect the transformers from the primary. Their approach, briefly, is to open the feeder, ensure no back feed through neon indicators at the substation, ground the feeder, and ground the work zone (including, if appropriate, the operation of an internally mounted ground switch in the transformer). Con Edison believes that this process addresses all potential energy sources, and provides a safe work environment for its employees.
De-energizing a Feeder
Con Edison performs its normal feeder maintenance with the feeder energized. For cables, this maintenance consists of an inspection of primary joints and terminations, Esna elbows, bayonets, cable racks, cable bonding or grounding, service take-offs, street ties, interval ties, gaps, quick connects, cable limiters, and duct entries to identify any abnormal conditions.
When Con Edison takes a feeder out of service to perform maintenance or construction, the utility does not “block and lock” the network protectors on the feeder. That is, they do not manually open the protector breaker or remove the protector fuses. Note that the utility also does not open a primary switch at the transformer, because Con Edison’s transformer specification does not call for a disconnect switch at the transformer primary.
This approach differs from the approach employed at many utilities, where crews visit every network protector, open up the secondary, and remove fusing before working on the de-energized circuit.
Con Edison’s process is to:
-
Open the feeder.
-
Ensure no back-feed from the back-feed indication that they have at the source. (Back-feed indication is a neon indicator at the breaker panel.) If the indicator at the station does reveal back-feed, crews visit the specific network protector or other source to resolve the issue.
-
Ground the feeder at the station.
-
Ground on either end of the work zone (all potential sources).
-
Do the work.
Con Edison believes that this process addresses all potential energy sources. They have never had a problem with this approach.
Why the difference in practice? One reason as that the very size of their system requires lengthy circuits with many transformer and network protector locations on each circuit. This high number of locations, combined with the potential to have to pump water out of the holes, makes it impractical to visit each location, pump it free of water, and block and lock the protectors. And, their current approach provides a completely safe, grounded work environment.
Technology
Cable Spear
Con Edison uses a device called a “Spear” to ensure that a cable is de-energized and grounded. A “spear” at Con Edison is a hydraulic cutter with a ground lead attached that can withstand 40,000 Amps. This device is operated remotely from outside of the hole. The device cuts into the conductor and grounds it. The term “spearing” the cable refers to the use of this device.
Normally, Con Edison does not spear a cable unless the cable has been positively identified. In an emergency, Con Edison may “spear” a cable without positive identification, based on information from the records.
The spearing tool Con Edison uses for network feeders is a specialty tool supplied by Reliable Equipment, 92 Steamwhistle Drive, Ivyland PA 18974 https://www.reliable-equip.com/.
7.6.1.6 - Duke Energy Florida
Operations
Determining a Feeder to be De-energized
People
Network crews at Duke Electric Florida are in charge of the tasks associated with establishing a clearance, including verifying that a feeder is de-energized. Clearing a network feeder involves close communication between the dispatchers in the DCC and the Network crews. Duke Energy Florida has a defined clearance process documented in their Switching and Tagging manual. All who perform switching must be on the company’s switching and tagging list. The DCC maintains the approved list.
Network Specialists are qualified to perform the tasks associated with taking a clearance, and Electrician Apprentices are trained as a part of their on-going OJT. Electrician Apprentices who received the required training and are on the switching and tagging list, can perform switching and hold clearances.
Process
Whenever a de-energization of a feeder or feeder section is needed, the work crews collaborate closely with the dispatcher to identify the location to be de-energized, and to establish the clearance through switching, tagging and grounding. Documented switching and tagging procedures are followed for de-energizing and re-energizing feeder.
To assure the cable section in question is de energized, Network Specialists first enter the manholes at each end, checking the feeder cable’s duct position visually and against their maps, making certain the feeder in question matches on each end. Crew will then apply a pulse tone on a single phase of the cable at two points around the work zone using an external, battery-operated tone generator. The tone it is put onto the conductor using a feed through. The pulse tone can be detected in the manhole to be worked by using a wand, confirming the cable to be cut.
Once the de-energized feeder is confirmed, a remotely operated hydraulic spike is used to pierce the cable to ground. After applying the jaws of the hydraulic piercing tool to the cable, the workman exits the hole before piercing the cable to ground. Duke Energy Florida has a documented standard procedure for grounding and piercing underground primary cable. See Attachment G.
Technology
For cable identification, Duke Energy Florida is using the Bierer [1] ST500 Digital Service Tester & Phase Identifier (see Figure 1).

Figure 1:
Bierer ST500PGN Digital All Purpose Service Tester & Phase Identifier
7.6.1.7 - Duke Energy Ohio
Operations
Determining a Feeder to be De-energized
People
At Duke Energy Ohio the responsibility for determining a feeder to be de-energized belongs to the Dana Avenue field crews, Cable Splicers and Network Service persons.
Process
Dana Avenue underground crews who will need to work on a de - energized feeder will follow their process for obtaining a clearance on that feeder.
After obtaining clearance on a feeder, including placing all of the transformer primary switches in the ground position, the Dana Avenue field personnel use the following process to determine a feeder to be de-energized before cutting the cable.
First, using their Conduit and Cable maps, field crews will identify the cable from the duct position indicated on the map.
Next, field crews will verify the feeder by checking the field applied tags in the hole. Duke Energy Ohio labels all of their conductors and equipment with tags.
Next, field crews will check amperage if possible.
Now, field employees will spike the one of the three cables using a hydraulic spear controlled from outside the hole. Before cutting the cable, they will have a second set of eyes look down on the spike for “copper on the chisel".
Finally, the crews will cut the cable.
7.6.1.8 - ESB Networks
Operations
Determining a Feeder to be De-energized
People
ESB Networks performs cable spiking to determine whether a feeder is the de-energized. Cable spiking is performed by Network Technicians. The Network Technician is the journeyman line worker at ESB Networks networks. Note that the Network Technician position is a jack of all trades position with specialization based on a work assignment rather than classification.
ESB Networks has very rigid procedures around determining if a feeder is de-energized. The company believes that their approach is a very safe one.
Process
Before any cable is worked on, it must be identified at the point of work. The Network Technician first identifies the cable through their records. Network Technicians maintain copies of their MV DFIS maps on their trucks. For their Dublin infrastructure, these maps are carefully maintained, detailed, and accurate.
The feeder in question is switched out of service through the ESB Networks switching and clearance process. The clearance process requires that switching actions are executed and confirmed.
The person who holds the clearance for the cable calls for a test signal to be placed on the cleared feeder at the station to assure that that test signal is present on the cable at the section he intends to cut, normally in a hole that has been excavated at the identified faulty section.
When ready to spike the cable, the person who holds the clearance contacts the ESB Networks control center and lets them know that he is about to spike the cable.
The Network Technician uses a spiking gun (see Figure 1), which is a chiseled device that is driven through the cable to ground using a charge (see Figure 2). The charge is released by striking the spiking device with a hammer. This device simultaneously spikes and grounds the cable. Note that the spiking gun is operated from outside the vault.

Figure 1:
ESB Networks cable spiking tool


Figure 2:
Cable spiking cartridges
ESB Networks networks has developed a detailed check list for MV cable identification and spiking. See Attachment A: Cable Identification and Spiking Checklist.
Technology
ESB Networks networks uses a cable spiking tool that drives a chisel through the cable using a charged cartridge that is struck with a hammer. This device uses customized aluminum bases developed by ESB Networks networks that are sized to fit the various cable sizes used by ESB Networks, and include a slot that is used to keep the cable captive during the spike (see Figure 3).

Figure 3:
Aluminum U Channel for retaining cable
7.6.1.9 - Georgia Power
Operations
Determining a Feeder to be De-energized
People
It is the responsibility of the Network Control Center personnel within the Georgia Power Network Underground group to obtain a clearance of a network feeder through the Distribution Control Center at Georgia Power. (See Operation Practices - Clearances )
Engineers in the Operations and Reliability Group at the Georgia Power Network Underground group are responsible for operating and monitoring the network system. This group is led by a manager, and is part of the Network Underground group, a centralized organization for managing all network infrastructures at Georgia Power.
The Operations and Reliability group has seven engineers on staff, responsible for the following:
-
Monitoring the network through the SCADA system.
-
Requesting and confirming de-energized feeders for maintenance or during failures.
-
Re-routing power to alternate feeders and/or networks in case of failures.
-
Serving as first-responders to customer service interruptions.
-
Part of the design phase for new networks or new major customer service.
-
Part of network protector selection (standards).
-
Responsible for the network system SCADA (remote monitoring and control) design and operation.
The Engineers, called Test Engineers, are four-year or two-year associate-degreed engineers. Test Engineers are responsible for network system operation, and work closely with maintenance crews, Test Technicians, Major Account representatives, and the Distribution divisions (Non – network operations) of Georgia Power.
The Georgia Power Network Control Center (part of Network Operations and Reliability) works closely with the Distribution Control Center (non – network) to clear a network feeder. The Network Control Center is responsible for obtaining a clearance for opening any network feeders (during emergencies, maintenance, routine inspection, etc). The Distribution Control Center, responsible for monitoring and controlling the breakers of the dedicated primary feeders that supply the network, issues clearances to the Network Operations and Reliability group. Field crews are ultimately responsible for assuring that a feeder is de-energized before commencing work.
Process
If any network maintenance, repair, or emergency work must be performed on the network, field crews must work through the Network Control Center to obtain clearance. The following steps are taken:
- To obtain clearance, the crew on site must confer with the Network Control Center, indicating the feeder that must de-energized.
- Operations personnel will check the status (through the remote monitoring system) of all network protectors at the locations to be affected to assure that de-energizing the feeder will not drop customers, or to identify those who will be affected.
- Operations must then call the Georgia Power Distribution Control Center to open the designated feeder.
- Work can begin when it is determined that the feeder is de-energized.
Once DCC and Operations have opened, grounded, cleared and tagged the feeder as open, the crew must verify that the feeder they are working on is de-energized.
First, the crew goes to adjacent vaults and moves the transformer handle to the “ground” position. Because of the interlock, if the feeder is not de-energized, the crewman would be unable to place the switch handle in the ground position. The crew then enters the manhole or vault to be worked, wearing appropriate PPE and verifies the feeder to be worked by its tag or by its position in the duct line. (Georgia has high confidence in the accuracy of its duct maps, and in its standard approach to cable racking (Peachtree racking).
From outside the manhole, personnel don protective boots, gloves, glasses, and full PPE clothing to spike (or “pike”) the cable with a either a cable spear (long pole) or a remotely operated hydraulic tool to confirm that that the feeder to be worked is de-energized and grounded. The blade of the cable spike or tool must pierce the metallic sleeve, sheath or covering and make contact with the conductor. According to maintenance personnel interviewed during the immersion, only twice in 32 years have crews spiked an energized cable.
When re – energizing a feeder after work which has separated cables, Georgia Power determines if feeders are phased correctly by leveraging a transformer modification (part of their standard) that uses phasing tubes on the top of every transformer. The phasing tubes provide a simple and foolproof way for tracing voltage to ascertain phase. On the transformer end, field personnel can insert a probe into the de-energized unit, and can put a signal on the cable and use this to determine phasing (See Figure 1).

Figure 1:
Network Transformer primary compartment – note phasing tubes
Technology
The Network Underground group of Georgia Power makes extensive use of its Network Control Center to coordinate the activities associated with a work clearance between the field crews and the Distribution Control Center. Its extensive mapping, tagging, and online vault and manhole diagrams available through GIS, give both the crew and the Operations Control Center a very high level of confidence in feeder identification, and their approach to on site testing assures worker safety.
7.6.1.10 - HECO - The Hawaiian Electric Company
Operations
Determining a Feeder to be De-energized
People
Cable Splicers within the Underground Group at HECO are responsible to assure that feeders a de-energized using appropriate testing and grounding procedures.
The Underground Group at HECO is part of the Construction and Maintenance organization. The group is comprised of two UG supervisors, fifteen Cable Splicers, 2 Utility Mechanics, and 2 Utility Assistants. The Cable Splicer is the journeyman position in the department.
Process
In most cases, the section of cable to be worked has already been isolated and tagged (“holdoff” tags) by the Primary Trouble Man (PTM) prior to the UG crew beginning to work. The UG crew is responsible for testing to determine that the feeder is de-energized and grounding the feeder.
The Cable Splicer will utilize the maps and plastic tags that label the circuits in the vault / enclosure to identify the feeder. HECO does use field labeling using these plastic tags throughout their system.

Figure 1:
Example Label indication the cable route (single phase URD)
HECO will use Test devices, such as the AB Chance tester or the HECO developed Fuse Stick (See Fuse Stick) ) at capacitive test points to confirm that the circuit is de-energized. They will then physically ground the circuit.

Figure 2:
HECO Fuse Stick
After the circuit is grounded, the Cable splicer will use either a hot line cutter for smaller cables, or a hydraulic cutter for larger cables to cut and ground the cable. This device is operated remotely, outside of the manhole. The Cable Splicer wears regular safety shoes – not dielectric shoes when operating the device.
Technology
The UG Electrician will utilize an AB Chance Tester, or home developed device called a Fuse Stick to test and ground.

Figure 3:
AB Chance Tester
7.6.1.11 - National Grid
Operations
Determining a Feeder to be De-energized
People
Maintaining and operating the Albany network system, including proving cables to be de-energized, is the responsibility of Underground Lines East. This group is led by a manager, and includes field resources focused on civil aspects of the underground system and a field resources focused on the electrical aspects.
The Electrical Group, comprised of Cable Splicers and Maintenance Mechanics, is led by three supervisors. Maintenance Mechanics perform network switching, fault location, minor vault maintenance, and inspection and maintenance of network vaults and equipment such as transformers and network protectors. It is typically the Maintenance Mechanics who are involved in switching a network feeder. They can be backed up on this by Cable Splicers. When the network feeder is de-energized, tagged and a Clearance issued, grounds are applied. Cable Splicers will then use the procedure in EOP UG013 to perform an electronic trace of the feeder and prove it dead by cutting the cable with an approved grounded cutter from outside the manhole or vault.
National Grid has a documented procedure for Positive Identification of De-Energized Underground Cables that is part of their Electric Operation Procedures (EOP). This procedure, undergoing a revision at the time of the EPRI immersion, includes a decision tree flow diagram to guide field workers through the steps of the procedure.
Note that National Grid EOP’s are available in hard copy or electronically on the company’s intranet.
Process
National Grid has a documented procedure for Positive Identification of De-Energized Underground Cables that is part of their Electric Operation Procedures (EOP). This procedure details the steps associated with determining a feeder to be de-energized and includes a detailed flow diagram outlining the steps.
National Grid will isolate, tag, test as de-energized and ground the feeder in question.
After clearing a feeder field crews will identify the cable in the hole through various means including prints, cable tags, duct location, cable size, location markings, etc.
National Grid does label all of their conductors with tags.
National Grid uses a tone signal generator or electronic signal tracer, such as units from Timco Instruments, Biddle, and Hipotronics, to identify the de-energized cable.
National Grid’s preferred method of cutting the cable is to use a remotely operated guillotine cutter from outside the hole. This tool will cut and ground the cable. As an alternative, where the remotely operated guillotine cutter cannot be used, crews can use a grounded 8 foot insulated ratcheted cable cutter from a safe position outside of the hole. National Grid does not spike cables.
National Grid’s procedure includes steps for identifying de-energized lead covered cables where an electric signal trace (tone) is not possible. In these cases, field crews will perform a series of cuts, performing a voltage test after each step using a Clantech PV1100 or Statiscope. For example, they will start by removing an appropriate length of lead cover, and then perform a voltage test.
Technology
National Grid uses a remotely operated hydraulic guillotine cutter that simultaneously cuts and grounds the cable. As an alternative, where the remotely operated hydraulic guillotine cutter cannot be used, crews can use a grounded 8 foot insulated ratcheted cable cutter from a safe position outside of the hole.

Figure 1:
Hydraulically operated guillotine cutter
National Grid uses a tone signal generator and electronic signal tracer such as units from Timco Instruments, Biddle, and Hipotronics.
7.6.1.12 - PG&E
Operations
Determining a Feeder to be De-energized
People
At PG&E, the responsibility for determining a feeder to be de-energized belongs to the M&C Electric Network field crews.
PG&E has good, up to date maps that show duct positions.
Process
After clearing a feeder (opening and grounding), field personnel use the following process to determine that a feeder is de-energized before cutting the cable.
First, using their duct maps, field crews identify the cable from the duct position indicated on the map.
Next, field crews verify the feeder by checking the field applied tags in the hole. PG&E labels all of their conductors with tags.
Next, field crews will check amperage, if possible.
The crews will put phase identification on the cables.
Finally, field employees will spike one of the three cables using a hydraulic spear controlled from outside the hole. Before cutting the cable, they will confirm the presence of copper on the cable. This is the normal practice. If they can’t reach the cable with the spike from outside the hole, they will use a set of remotely operated hydraulic cutters that both cut and ground the cable.
Technology
PG&E’s spiking tool is a fiberglass rod with a spike on it.
The also utilize a remotely operated hydraulic guillotine cutter that simultaneously cuts and grounds the cable.
PG&E also uses a Hipotronics phase identifier to confirm phasing before making repairs. The device, connected at the substation, sends out one pulse on A phase, 2 pulses on B and returns on C phase. They use a sound coil to pick up the pulse and identify the phases down stream.
7.6.1.13 - Portland General Electric
Operations
Determining a Feeder to be De-energized
People
The System Control Center (SCC) is responsible for operation of the network and grants clearances for crews working on a feeder.
The load dispatcher works closely with the network crew foreman to accomplish switching on the network. Substation operations perform switching at the substation, while the CORE underground crews perform switching out on the network. The Special Tester is also often involved in this process.
Process
After clearing a feeder, the load dispatcher monitors the network protectors remotely. If the load dispatcher sees that a protector still shows as closed on the monitoring system when it should be open, the load dispatcher contacts the individual listed on the shut-down order to notify the individual that a particular unit still shows as closed.
When the dispatcher sees that the feeder is de-energized, the dispatcher gives the crew clearance to install grounds.
To ascertain that a feeder is de-energized, crews first use duct maps and field-installed cable tags to identify the circuit to be worked on in the hole. Crews may use an acoustic tool called the hummer, listening for radio frequency (RF) on the feeder to help confirm that the cable is dead. If they hear no RF, they know that the feeder is de-energized. PGE noted that this listening tool is not foolproof, however, and that crews always cut cable remotely from outside the hole just in case they inadvertently cut into an energized cable.
They identify the cable to be cut using a battery-powered guillotine cutter operated from outside of the hole. This cutting tool simultaneously cuts and grounds the cable through the cutting blade. PGE does not spike network cables.
7.6.1.14 - Survey Results
Survey Results
Operations
Determining a Feeder to be De-energized
Survey Questions taken from 2018 survey results - safety survey
Question 25 : Please indicate which of these activities are part of your procedure for determining a feeder to be de-energized and cutting a medium voltage network cable.


Question 26 : Please indicate which of the following activities are part of your network feeder clearance procedures.


Question 27 : When the feeder has been cleared, in what position have you left the network transformer primary switch?


Question 28 : Are there any differences in your network feeder clearance procedures for a routine clearance (such as for adding a new transformer) and an emergency clearance (such as for a cable failure)?


Survey Questions taken from 2012 survey results - Operations and Safety (Question 8.9)
Question 7.12 : Do you have a means to do a group feeder pickup in the event of a network outage? (Multiple feeders)

Question 8.9 : What procedures / tools do you use to determine that a cable is de-energized?

Survey Questions taken from 2009 survey results - Operations and Safety (Question )
Question 7.16 : Do you have a means to do a group feeder pickup in the event of a network outage? (Multiple feeders) (This question is 7.12 in the 2012 survey)

Question 8.9 : What procedures / tools do you use to determine that a cable is de-energized?

7.6.2 - Dispatching
7.6.2.2 - CEI - The Illuminating Company
Operations
Dispatching
People
The CEI underground system is operated out of the Northern Ohio Regional Dispatch Office (RDO). This office is responsible for the operating the entire Illuminating Company system, including the network.
The RDO is staffed with 36 employees, including a manager, 27 Distribution System Operators (DSO’s), 2 Outage Coordinators, 1 Engineer, a computer system expert, and other support staff.
The DSO position is a non bargaining position. Most DSO’s have an electrical background in distribution and were hired “from the outside”. A formal degree is not required. CEI will give preference to candidates with military experience when hiring DSO’s, as military training provides structure and discipline – two characteristics sought after by CEI in DSO’s. DSO’s can advance to a senior level by gaining experience and demonstrating proficiency in certain tasks required for advancement. DSO’s will periodically be assigned to accompany Underground crews in the field to gain experience.
Process
The RDO runs seven operations “desks”, 24-7, with the system broken up by geography. That is, each desk controls a different geographic area. In assigning DSO’s to the desks, CEI will mix senior people with newer people to provide training. They assure that at least two senior DSO’s are working on the floor at any one time. Their goal is for all the DSO’s to eventually progress to the senior level.
Technology
The RDO is documenting operating processes and procedures in a system called E Net. They have one individual who is assigned the responsibility of maintaining and updating this system.
7.6.2.3 - CenterPoint Energy
Operations
Dispatching
People
Distribution dispatching is housed within the CenterPoint Energy Control Dispatch Center (ECDC). This facility also houses the Regional Transmission Operator (RTO) desk.
Distribution Dispatchers focus primarily on switching and troubleshooting of the distribution system beyond the substation breaker. Distribution Dispatchers are assigned responsibility for certain territory by service center. CenterPoint has twelve Service Centers, and assigns one or two dispatchers per service center. A normal day shift will employ a minimum of 14 dispatchers.
The RTO focuses primarily on the transmission network, but is also responsible for operation of distribution breakers at the substation. For example, the RTO would dispatch a Substation Operator to open a major underground dedicated distribution feeder breaker at the substation.
Process
At CenterPoint, Distribution Dispatchers are represented by a collective bargaining agreement (Union). A Distribution Dispatchers can become a journeyman after three years of training (both formal and OJT) and testing. Distribution Dispatcher candidates must pass a highly selective test to enter the program. Only 10-15% of candidates who take the test qualify for entry into the program. Apprentice dispatchers are assigned a mentor to guide them through the program.
7.6.2.5 - Energex
Operations
Dispatching
People
Outages and trouble calls are the responsibility of the Operations Center , part of the Service Delivery organization at Energex.
Outages in the CBD that come in through customer calls are managed by Evaluators within the control center.
Management
Energex has a centralized crew dispatch team comprised of ten resources who work the day shift (6:30 – 4:00). The team is organized by geographic area, with dispatcher responsible for dispatching to field crews within their assigned area.
Note that crew dispatching is a distinct group from the switching coordinators in the central control center who operate the distribution system. The dispatchers work closely with the control center, as area service issues, such as feeder outages, are handled by the Control Center.
Resources that fill the crew dispatcher positions typically come from the Contact Center Group (CCG). The crew dispatch position is a bargaining unit (union) position.
Energex noted that the centralized dispatchers have good rapport with field crews. They encourage field crews to visit the center, and dispatchers to visit with field crews.
After hours, crews are typically dispatched by Evaluators, who are part of the control center, and work directly with customer in-bound calls of outages or reports of area outages.
Process
Every power bill to customers lists three phone numbers: one for general enquiries, one for reporting loss of supply and one for reporting network related emergencies. Energex’s IVR system routes calls accordingly: general enquiries go to the Energex contact center whilst loss of supply and network emergencies are routed to the operations control room where the calls are answered by dedicated trouble call staff. The IVR system proactively sends out messages to customers in the event of an outage in the area. Incoming calls recognize caller ID, and Trouble Call staff are presented with the customer account information when they field calls.
Trouble Call staff receive customer calls or field reports and put in trouble tickets to the online trouble ticket system, which creates a service request. Service requests are then evaluated to determine the extent of the problem and a job service order is created. The Service order is then routed to central dispatch to provide the appropriate crew(s) to respond to the outage or service interruption. On any given day there is at least one evaluator assigned for every two of the 12 zones in the Energex service grid.
When a call or calls come in, an evaluator can help to determine whether the report is merely an individual outage or an area problem, and route the trouble ticket to the appropriate division — log it as a network incident if it is an area problem and forward it to either an LV or HV switching coordinator, or send to dispatch if it is an individual outage.
During prolonged outages, estimated time to recovery (ETR) recorded messages can be proactively sent to customers within designated affected areas. The same message can be played to customers calling into the customer center. ETRs are determined by near real-time information from dispatch crews in the field reporting into the operations center.
Management
Switching coordinators and evaluators (from the Central control center) determine which type of job to dispatch through the central dispatch center. Area service issues, such as primary feeder outages are handled by the switching coordinators to repair/maintain. Customer-related outages, transformer outages, and wires down are handled and trouble tickets issued to central dispatch by evaluators.
Energex has central hubs throughout its system, each of which has at least two maintenance crews. The CBD hub also has mechanics specifically trained for CBD network underground work.
Technology
Energex uses an automated service request generation and trouble ticket tracking system. When calls come in from customers, they are routed as service tickets to dispatch, but network service calls, such as lines down, are routed to operations, all through the same online system.
Dispatch crews utilize a mobile data system, Field Force Automation (FFA), a Ventyx system, which uses a commercial 3G wireless network. Dispatch crews can receive and report back information into operations via wireless “tough book” laptops and through Energex’s 3G network.
Energex uses a distributed management system that tracks which crews are available, where they are located, and what the crew’s area of expertise is — Electrical Connections Officer (ECO) or Rapid Response crew. Service requests are handled by an automated system at central dispatch that issues trouble tickets to the appropriate crews closest to the service issue. A percentage of the business as usual work can be automated at start of day to assist in the allocation of customer service work to the appropriate work crews.
7.6.2.8 - HECO - The Hawaiian Electric Company
Operations
Dispatching
People
HECO System Operations has implemented a comprehensive cross training program for Trouble Dispatchers. The program involves the dispatchers spending a period of weeks working with other departments to gain real world experience to supplement classroom training. The program is administered by the System Operations Training Department.
Process
The cross training consists of several “ride along” opportunities where a Trouble Dispatcher trainee will work along side certain field types, such as a Primary Trouble Man (PTM).
The first “ride along” takes seven weeks and is part of a general orientation of different functions within the Company. This program consists of two weeks with the PTM’s, three weeks with a C&M day crew, and two weeks with a C&M night crews. At this point the dispatch trainees are trying to associate the classroom portion of the training (trouble shooting, repair work, terminology, equipment) with what they see in the field.
The Trouble Dispatcher trainee then goes through seven training modules and receives on-the-job training in the dispatch center. They work on a shift and learn while working alongside the experienced dispatchers. This takes at least 6 months, after which the dispatcher is tested and qualified. The seven training modules include:
-
Orientation
-
Basic Distribution Concepts
-
Trouble Dispatch Orientation
-
Trouble Dispatch Operations
-
Switching & Tagging for Trouble Dispatchers
-
Communications Skills for Trouble Dispatchers
-
Emergency Operations for Trouble Dispatchers
Optionally, a second “ride along” occurs after the dispatcher has more experience and can ask detailed questions. This second “ride along” is for 1 week with the PTMs, and can occur anytime during the last 5-6 months of training.
Technology
HECO has documented the objectives of each training module and uses “sign off sheets” for each module to record when the Trouble Dispatcher trainee has accomplished each step of the module.
See Attachment(s) Attachment L and Attachment M .
7.6.2.9 - SCL - Seattle City Light
Operations
Dispatching
People
Operations Center
SCL uses a centralized operations center for their company. This center operates both the transmission and distribution systems. There are two distribution desks in the operations center, one of which has accountability for the network. (Note that there is not a dedicated desk to operate the network. The operators at this desk have both network and radial distribution operations responsibility.)
Distribution Operators (dispatchers) typically enter the position with either utility experience and electrical background, or specific experience as a journeyman. Often, they have four years of education plus two years of electrical experience. They must take a test to get into the position.
7.6.3 - Fault Indicators
7.6.3.1 - AEP - Ohio
Operations
Fault Indicators
People
Monitoring of the underground network system, including fault detection, is the responsibility of the Dispatchers at the Operations Center. AEP does not utilize faulted circuit indicators (FCIs) on its network feeders.
Process
Most faults are detected by Operations Center personnel through its SCADA system.
Technology
Overcurrent relays and network protectors feed data into the AEP Ohio redundant, dual-loop fiber-optic SCADA communications network. Dispatchers can identify fault conditions occurring in the field from the Operations Center monitoring facility.
AEP engineers are leveraging the waveform data collection ability of the Schweitzer 351S relays to perform fault impedance location. Engineers have provided information to the dispatchers than provides a table of distances and impedances to particular manholes.
7.6.3.2 - Ameren Missouri
Operations
Fault Indicators
Process
Ameren Missouri has not historically used faulted circuit indicators (FCIs) on its network system. At the time of the practices immersion, Ameren Missouri was piloting the use of faulted circuit indicators on its radial primary system.
Technology
Ameren Missouri is piloting a faulted circuit indicator on their primary radial distribution system. Specifically, they are currently piloting the AutoRanger, from Schweitzer, and have plans to test the communications enabled feature of that product in the future.
7.6.3.3 - CEI - The Illuminating Company
Operations
Fault Indicators
People
Troubleshooting of locked out feeders is performed by Operators (or Switchmen) under the control of the Regional Dispatcher. The present practice for troubleshooting a feeder that has tripped off line includes an Operator going to the location of the fault indicators to ascertain their status.
The fault indicator specification was developed by the CEI Engineering Services group.
Process
CEI has a standard practice of installing fault indicators on their substation exit cables. Their substation exit cables exit the substation underground, and then go up a riser to the overhead portion of the line. The fault indicators are placed on the overhead line just beyond the riser pole disconnects.
Prior to the implementation of the practice to install these fault indicators, CEI’s dispatching practice for troubleshooting a feeder that tripped off line was to open the disconnects at the Substation exit riser and try to reclose the feeder (in effect, testing the condition of the exit cable portion of the circuit). If the circuit tripped upon reclose, the dispatcher would know that the problem was in the exit cable portion of the feeder. If not, the dispatcher would know that the problem was located beyond that point. This approach was effective, but would typically consume 20-30 minutes to have a switchman perform the work involved. Because these problems involved feeder lockouts, large numbers of customers were involved, contributing significantly to CAIDI.
In an effort to improve reliability by reducing the number of customer minutes of interruption by shortening the troubleshooting time, CEI implemented the practice of installing fault indicators on all the substation exit cables, just beyond the disconnects where the feeder moves from underground to overhead.
The present practice for troubleshooting a feeder that has tripped off line includes an Operator going to the location of the fault indicators to ascertain their status.
If the fault indicators are flashing, the troubleshooter would know that the fault occurred beyond the disconnect switches. The operator could them begin troubleshooting the rest of the feeder and restoring customers, without spending the time to ascertain the condition of the exit feeder cables.
If the fault indicators are not flashing, this would suggest that the faulted section of the feeder is in the exit cable portion. However, because the fault indicators do not always register on a downstream fault, the dispatcher will still disconnect and attempt to close the exit cable section to prove its condition before continuing with additional troubleshooting / restoration activities.
Technology
The fault indicators they use for this application are relatively inexpensive and reset automatically upon circuit re-energization. (Note: this is different than the type of fault indicators used to troubleshoot momentary interruptions where the fault indicators would retain their status until manually reset).
7.6.3.4 - CenterPoint Energy
Operations
Fault Indicators
Process
CenterPoint does not use fault current indicators (FCI’s) in their major underground infrastructure, as they have found them to be unreliable.
7.6.3.5 - Con Edison - Consolidated Edison
Operations
Fault Indicators
Process
Conduit Size Restriction
One challenge that Con Edison faces is trying to expand capacity given the space limitations of and damage to existing duct bank systems. In some locations, spare ducts may be crushed or blocked. In others, the size of the spares may not be adequate to pull through the necessary cable to meet loading.
For example, in a design where 750 MCM cable is called for, Con Edison may have to consider running double 500’s because the 750 cannot fit in the 4-inch spare conduit.
The Brooklyn Operation Center noted that about 10% of their ducts are crushed. In Manhattan, the number of crushed ducts is significantly higher, at 45 – 50%.
In some cases, Con Edison bifurcates the feeders; that is, breaks the feeder into two sections outside the station in order to adjust to the limited space considerations and add reliability. In this design, Con Edison installs SF6 switches with fault indication outside the station, protecting each leg of the bifurcated feeder. In a feeder lockout, this enables them to isolate the faulted section and pick up the rest of the load.
7.6.3.6 - Duke Energy Florida
Operations
Fault Indicators
Process
Most faults are detected by the Network Control Center personnel through its SCADA system connected to remote network protectors and to self-reporting fault circuit indicators located at locations near the feeder midpoint. The fault indicators provide Operations with the general area of a fault via SCADA, so that they can direct field to the location for further analysis and fault isolation. The Operations and Reliability group, as well as maintenance crews, have a written procedure for fault location and isolation.
Technology
Duke Energy Florida utilizes sectionalizing devices in its network feeders. Historically, these devices have been oil filled three way switches and are equipped with remote reporting fault circuit indicators (FCIs). All remote reporting FCIs communicate to the company’s SCADA system. (See Network Monitoring).
Duke Energy Florida is in the process of replacing the oil-filled sectionalizing devices used on the Clearwater network feeders with solid dielectric vacuum switches. The oil-filled devices are near end of life, and it is becoming more difficult to obtain parts. In addition, the move away from an oil insulated device is motivated by safety considerations. The new solid dielectric vacuum devices are slightly larger than the oil filled devices and will be placed in sidewalk vaults.
These devices, which do not have fault interruption capability, will also be equipped with remote reporting faulted circuit indicators (FCIs) that communicate via SCADA to the DCC. The new devices will be placed on an angled stand so that the switch faces the vault exit and can be easily operated with a hot stick from outside the hole. The switches will also have a pendant operation arm.
The decision to proactively replace the older oil gear with the new solid dielectric switches was collaborative involving the component engineer within the PQR&I group, the Standards engineer, and the Network Group.
7.6.3.7 - Duke Energy Ohio
Operations
Fault Indicators
Process
Duke Energy Ohio does not use fault current indicators (FCI’s) in its network system. They do use them in some 19.9 kV applications at selected locations on their radial distribution system.
7.6.3.8 - Energex
Operations
Fault Indicators
Process
Energex has a photovoltaic monitoring research project underway focused on gathering data to be able to better forecast power supplied by intermittent solar panel supplies, to determine battery storage requirements.
The project is focused on approximately 150 solar panel-equipped customers. The monitoring system is bringing back “one minute” data from the grid. So far Energex has amassed six terabytes of information for its study. The project includes the allocation of batteries for storage at the pilot sites, and will include battery monitoring.
Working with researchers, the Energex team is attempting to come up with network forecasting of intermittent supply, which is quite useful for battery storage.
Technology
The team is investigating a system that integrates solar panels with an intelligent inverter and a battery. By remote control, Energex could send parameters to the device for demand management and voltage management for the utility, and the customer could receive information and capability to change parameters to minimize his bill.
7.6.3.9 - ESB Networks
Operations
Fault Indicators
Process
ESB Networks has broadly applied Faulted Circuit Indicators (FCIs) on their MV 10kV system in Dublin. The company typically places the FCI on the MV cable where it terminates within the switchgear.
FCIs are an integral part of ESB Networks’ troubleshooting process. The company utilizes the FCIs to narrow down the cable sections where the outage occurred. Then ESB Networks disconnects that section, and attempts to reclose the remaining sections.
Technology
A commonly used FCI is maintenance free, self-resetting FCI manufactured by Horstmann GmbH[1] (see Figure 1 and Figure 2). This indicator uses a vial filled with a clear liquid, with a red particulate in the base of the vial. During a fault, a “mixer” is pulled up by the magnetic field, which stirs up the red particles, turning the liquid in the vial from clear to red. After 6-8 hours, the red die particles resettle, resetting the indicator. ESB Networks reports high trust in this type of indicator.

Figure 1:
Faulted circuit indicators

Figure 2:
Faulted circuit indicators: Note spring shaped “mixer”
ESB Networks has not invested in remote indication of FCI status. The company notes that without the implementation of automated (remote) switching, the investment in remote indication of FCI status is uneconomic.
7.6.3.10 - Georgia Power
Operations
Fault Indicators
People
Monitoring of the underground network system, including fault detection and self-reporting faulted circuit indicators, is the job of the Operations and Reliability personnel in the Network Control Center. The Operations and Reliability Group, part of Network Underground, is responsible for operating and monitoring the network system, and for directing field crews in locating faults. Operators will use information from fault indicators to narrow the investigation to the faulted sections of the feeder as reported by the FCIs. It is the responsibility of the field crews to assist operations in locating faults.
The Network Control Center Test Engineers are four-year or two-year associate-degreed engineers. The group works closely with maintenance crews, Key Account representatives, Test Technicians, and the Distribution Control Center.
Maintenance and trouble-shooting crews are comprised of Cable Splicers, Duct Line Mechanics, WTOs, and their supervisors .
Process
Most faults are detected by the Network Control Center personnel through its SCADA system connected to remote network protectors and to self-reporting faulted circuit indicators located at locations near the feeder midpoint. The fault indicators provide Operations with the general area of a fault via SCADA, so that they can direct field to the location for further analysis and fault isolation. The Operations and Reliability group, as well as maintenance crews, have a written procedure for fault location and isolation.
Technology
Fault indicators feed into the Network Control Center through the Network Underground SCADA network. Operators can monitor the entire network from the center, including data from self-reporting fault indicators.
Georgia Power is also studying the use of electronic relaying and a distance-to-fault calculation to further narrow the location of the fault. They have installed some substation relays capable of monitoring and recording the fault signature, and have are building models within CYME to calculate the maximum fault duty at various locations along the feeder.
7.6.3.11 - HECO - The Hawaiian Electric Company
Operations
Fault Indicators
People
Troubleshooting is performed by Primary Trouble Men (PTM’s) under the control of the Dispatcher. The HECO practice for troubleshooting a feeder or feeder section that has tripped off line includes a PTM going to the location of the fault indicators to ascertain their status.
Process
HECO installs fault current indicators in all padmounted transformer installations, three phase and single phase. In addition, HECO has a standard practice of installing fault indicators on their substation exit cables. Their substation exit cables exit the substation underground, and then go up a riser to the overhead portion of the line. The fault indicators are placed on the overhead line just beyond the riser pole disconnects.
The HECO practice for troubleshooting a feeder that has tripped off line includes a PTM going to the location of the fault indicators to ascertain their status.
If the fault indicators at a station exit riser are flashing, the troubleshooter would know that the fault occurred beyond the disconnect switches. The operator could them begin troubleshooting the rest of the feeder and restoring customers, without spending the time to ascertain the condition of the exit feeder cables.
If the fault indicators at a station exit are not flashing, this would suggest that the faulted section of the feeder is in the exit cable portion.
In troubleshooting looped underground infrastructure, the PTM will open each padmounted transformer along the route to isolate the section in which the fault occurred. The PTM will then sectionalize in order to isolate the faulted section and restore service to customers.
Technology
The fault indicators HECO uses for substation exit cable risers and for transformer installations are relatively inexpensive and reset automatically upon circuit re-energization. (Note: this is different than the type of fault indicators used to troubleshoot momentary interruptions where the fault indicators would retain their status until manually reset).

Figure 1:
FCI – Manual Resetting
In underground applications, HECO’s is presently using the following FCIs:
-
Fisher Pierce 1514SH
-
SEL TPR – used on elbow capacitive test point
-
Chance MR450 or Linam MR450 – manual reset
-
HECO is testing a Power Delivery Products Overhead Load Tracker w/ Navigator Memory in one of their switch vaults on conjunction with a telemetric RTU.
In Overhead applications, HECO’s is using the following FCIs:
-
Power Delivery Products - Overhead Load Tracker w/ Navigator memory.
-
Cooper CPS SCVT (Star, current reset, variable trip) with FlexNet communications (TEST ONLY on selected 46kv overhead lines)

Figure 2:
FCI – Self Resetting
7.6.3.12 - National Grid
Operations
Fault Indicators
Process
National Grid does not use fault current indicators (FCI’s) in its network system. Network feeders are designed without sectionalizing points, with feeders going right to the network transformers, leaving no place to install FCI’s. National Grid has applied fault indicators in selected locations where they have more than one circuit feeding off a common breaker, with no specific circuit monitoring capability. In these cases they use FCI’s to ascertain which feeder caused a breaker operation.
National Grid uses FCI’s extensively in their radial system.
7.6.3.13 - PG&E
Operations
Fault Indicators
Process
Within San Francisco, PG&E uses primary sectionalizing devices on network feeders (historically, the G&W T Ram). Fault indicators are placed at these switch locations to aid troubleshooters (cablemen) in fault location.
Technology
PG&E is buying Schweitzer three conductor lead cable fault indicators. These fault indicators are SCADA ready, but are not presently tied in to SCADA. PG&E, with the implementation of their new network remote monitoring system, intends to tie these fault indicators into SCADA so that the distribution operator can view indicator status.
7.6.3.14 - References
EPRI Underground Distribution Systems Reference Book (Bronze Book)
7.6.3.15 - Survey Results
Survey Results
Operations
Fault Indicators
Survey Questions taken from 2019 survey results - Inspection Practices survey
Question 15: Do you use faulted circuit indicators (FCI’s) in your Urban UG infrastructure? (Check all that apply)


7.6.4 - Fault Location
7.6.4.1 - AEP - Ohio
Operations
Fault Location
People
Fault location is the responsibility of the Network Mechanics, who work closely with both the Distribution System Operators and Network Crew Supervisors. In the event of a fault off hours, the dispatcher will notify the Duty Supervisor, who will then call in needed crews.
All Network Mechanics are trained in fault locating and perform all aspects including switching, location, and making repairs. The exception is switching and placing grounds at the substation, which is performed by Station Servicers. Network Mechanics will lift cable terminations at the station to connect the thumper. The AEP network engineers may also be involved in fault location.
Process
When a fault occurs, the Operations Center Dispatcher will call out the Duty Supervisor, who will mobilize Network Mechanics to locate the fault. AEP Ohio has a test truck specifically outfitted for fault location. It is pre-rigged with a DC Hi pot impulse generator (thumper) and all other necessary equipment for fault location.
After repairs, AEP will perform an AC VLF withstand and tan delta test, at 15-kV for 45 minutes. The company captures and records information. Note that for new cable, AEP will perform a “commissioning” AC VLF tan delta test – 20 kV for 45 minutes. This initial test provides a benchmark. From then on, the company will perform the 16-kV test after repairs. Note that subsequent withstand tests are only performed if they have broken into the cable insulation on the feeder.
Once the fault is found, Network Mechanics will make repairs. The makeup of the repair crew depends on the type of problem that created the fault and can include network maintenance and civil construction personnel.
Technology
The Dispatch Center and crews have extensive, accurate network maps, which are available online. The AEP Ohio system contains microprocessor relays (Schweitzer SEL 351S), which are being used by Network Engineering to analyze waveforms to aid in pinpointing the location of faults. In some cases, the information recorded by the relays is highly useful in isolating the location of faults. However, in its network circuit design, some feeders branch off the main trunk circuit, making fault location more difficult. In these cases, Network Engineers can analyze the fault impedance on the main trunk and give the work crews a place to start for location using maps from the Dispatcher. Network engineers are also investigating using waveform information for precursor fault detection.
NPServe, a new Eaton device, is under test and consideration at AEP Ohio to aid in secondary fault locations. A firmware upgrade to current VaultGard devices, along with NPServe, can obtain data from downstream devices and may enable AEP Ohio to more accurately pinpoint faults.
7.6.4.2 - Ameren Missouri
Operations
Fault Location
People
At Ameren Missouri, fault location for network primary cables is the responsibility of the Service Test organization. Distribution Service Testers perform the locating and work with the Traveling Operators who perform the switching to the clear the feeders for locating.
Organizationally, both the Traveling Operators within the Distribution Operating group and Distribution Service Testers within the Service Test group are part of Reliability Support Services.
The Service Test department has training guideline for cable fault locating used for training of the Distribution Service Testers. At the time of the practices immersion, Ameren Missouri was developing a formal fault location procedure.
Secondary troubleshooting is the responsibility of the Underground Construction department. In a network outage, the dispatcher in the SDC would first call a supervisor within the either the Service Test group or the Underground Construction department depending on the nature of the outage.
The steps for clearing a network feeder involve the dispatchers within the System Dispatch
Center and Traveling Operators. Dispatchers issue the switching orders for clearances, and the Traveling Operators are responsible for performing switching within the network vaults (including operating both the primary disconnect switch on the network unit and the network protector), at the substation for network feeders, and at customer switchgear. The dispatcher may issue a “restraint”, which enables one operator to apply a test voltage.
Repairs, such as cable replacement or splices, are the responsibility of the Underground Construction group.
Process
In a cable outage, the traveling operator’s first step is to switch open the feeder. In most cases, the feeder would have locked out. When they first open the feeder, they apply the test breaker at the station and check for potential using phase sticks to assure that there is no back feed from hung up protectors. If they do find one hung up, they will identify the protector that failed to open form their remote monitoring system, and then go to that location and manually open and lock open the protector before fault locating.
Traveling operators visit every hole and open the transformer primary switches in each vault. Ameren Missouri does not require a visible break at the transformer disconnect switch. Note that the Traveling Operator knows which vault entrance leads to the primary switch because that entrance (the primary side entrance) is marked with a tag just below the grate, visible from above. After opening all the transformer switchers, the operator would go back to the station and perform a “shorts” test - a way of confirming that they haven’t missed a transformer or that there isn’t a short on the system.
As the Traveling Operators perform switching, they place appropriate clearance tags, such as Holdoff tags and Grounding tags. At the station they use a Racking Holdoff tag, which enables the breaker to be racked into the test position, but not back onto the bus. They also use information tags (Blue tags) to notify others of pertinent information.
Once the Traveling Operators have the feeder switched open, they would call in the Dist Service Testers to locate the fault. After the fault is located, the repair work is the responsibility of the Underground Construction group.
Distribution Service Testers use DC hi pot testers (capacitor impulse discharge units) to thump the cable. They use ballistic detectors to narrow the location and galvanometers to pinpoint the location of the fault.
In order to reduce the time to repair, the Traveling Operators will call for fault location crews (comprised of Distribution Service Testers) BEFORE they are completed with the switching to account for the time necessary to call out and assemble the Dist Service Test crews. Similarly, the Dist Svc Testers will call out UG crews (Cable Splicers) prior to completing their location to allow time for the UG folks to respond to the call and assemble. In this way there is no “down time” associated with the handoffs from task to task.
After a network feeder has been separated (to prepare splices, for example) the Traveling Operators will check phasing before restoring the feeder. (See Clearances for more discussion on phasing).
Technology
Dist Service Testers and Traveling Operators have mobile data terminals in the trucks. These are used to access the Byers maps (See Mapping).
Ameren Missouri is using DC hi pot impulse generators from Biddle, Hipotronics, High Voltage, and Von. They are using ballistic testers and galvanometers to narrow the location of faults.
7.6.4.3 - CEI - The Illuminating Company
Operations
Fault Location
People
Fault location is the responsibility of the UG Electricians within the Underground Network Services department. Typically, certain electricians become proficient with fault location techniques and are normally assigned this responsibility.
Process
A network distribution system fault usually results in a primary feeder breaker locking out.
At CEI, a Substation department employee normally obtains relay targets, and racks out the breaker at the substation.
Underground Electricians will verify the feeder as dead and obtain clearance on the feeder by confirming that all of the network protectors are open and tagging them. UG Electricians will also open the primary disconnect switch on each transformer. (Note: the transformer disconnect switch remains within the zone of protection and can be operated as needed by electricians to perform phasing and grounding)
CEI uses both a high voltage capacitance discharge test set (Thumper), and a DC Hi Pot tester to locate faults.
CEI is using above ground fault detection equipment, in the form of a pickup coil designed by a CEI employee. When using a high energy (high voltage pulses) device to locate faults, an Electrician can hear a hum from the pickup coil from above grade. When the worker loses tone, then he knows he has gone past the fault. CEI strives to narrow the problem to no more than three holes using this above ground technique.

Figure 1:
CEI Pickup Coil
Once they’ve narrowed down the locations, UG Electricians enter the manholes and take readings with a galvanometer to detect pulses. If the pulse is present, the operator proceeds to the next manhole. The absence of a pulse indicates that the fault is located somewhere between the current manhole and the one previously checked.
After locating and cutting a faulted section of cable clear, CEI crews will Megger the cable in both directions to assure that these sections are fault free. They will also Meggar the faulted section to confirm the failure in the faulted section.
After the fault is located, Underground Electricians will go to the transformers in each side of the faulted section and put the transformer primary switches in the ground position, so that they will be working between grounds when spicing.
After repairing the fault, CEI will perform a cable test (a VLF test at elevated voltages based on the IEEE maintenance rating) before attempting to reenergize a circuit or circuit section to verify that the cable is good and that no other faults exist. An exception is in testing circuit sections that contain old 5kV oil switches. Here they will use a 5kV Meggar test so as to not damage the switches.
Technology
CEI has several fault location trucks, equipped with test equipment to facilitate fault locating.

Figure 2:
CEI Fault Location Truck

Figure 3:
Primary connection transformer
7.6.4.4 - CenterPoint Energy
Operations
Fault Location
People
Fault Location is performed by Network Testers of the Relay group within the Major Underground group at CenterPoint.
The Relay group is comprised of Network Testers, a bargaining unit position at CenterPoint. Network Testers report to a Crew Leader, a non bargaining unit position at CenterPoint. The Relay group is lead by an Operations Manager.
Cable Splicers, from the Cable group, may assist Network Testers on fault locations, acting as “listeners” to help pre locate faults.
CenterPoint does not have dedicated fault location crews. All Network Testers are trained in performing fault location.
Process
CenterPoint uses DC Hi Pot testing and high voltage capacitance discharge testing (the Thumper) in conjunction with above ground impulse detection to locate faults.
After checking feeders for dead and grounding, Network Testers will apply the fault location test set to the faulted cable. They will first Meggar the cable, then apply the Hi Pot test set to determine the break down voltage. They use this to set the Thumper.
CenterPoint is using an above ground impulse detection device to aid in locating faults. The device is TEC-X35, developed by a vendor in partnership with Con Edison. The X35 device is used above ground to display polarized thumper signals to help direct field operators to the fault location. A field operator stands directly over the feeder and takes measurements above the ground. A reference measurement is taken at the feeder source. The operator then moves along the path of the feeder taking measurements and comparing them to the reference measurement. A positive reading with an amplitude similar to the one taken in the substation vicinity indicates that the operator has not yet reached or passed the fault location. A small or negative reading indicates that the operator has passed the fault or has chosen the wrong feeder leg.
If for some reason, the crews are having difficulty locating the fault, they will disconnect all the transformers and try again. In difficult to find faults, they will resort to breaking the feeder in half and testing cable sections.
After locating and cutting a faulted section of cable clear, CenterPoint crews will VLF test the remaining cable in both directions to assure that these cable sections are fault free (see Cable Testing / Diagnostics).
Technology
CenterPoint has specialized trailers that are equipped with fault location / cable diagnostic equipment, including DC hi pot testers, and VLF testers. Network Testers will hook the trailer on their trucks and take to the job site.

Figure 1:
Cable Testing Van - External

Figure 2:
Cable Testing Van - Internal
CenterPoint is using test units by Cable Dynamics and by Centrix
7.6.4.5 - Con Edison - Consolidated Edison
Operations
Fault Location
People
Field Operating Department (FOD) (Also called the Field Operating Bureau)
The Field Operating Department is part of Electric Distribution, and has responsibility for the emergency crews (the crews using the red emergency trucks), as well as the following accountabilities:
-
Fault locating (distribution and transmission)
-
High-tension switching (entering customer high-tension vaults and operating devices)
-
Feeder identification
-
Hi-pot testing
Fault Location Knowledge Retention
The biggest issue faced by the Fault Locating group is the loss of knowledge as experienced resources leave the department. Their biggest challenge is to find ways to retain people and knowledge.
Con Edison is currently rewriting the Field Operating Department (FOD) manual; however, this manual will provide a general overview, not specifics. Con Edison believes that much of performing fault location is based on experience and “feel.” Because each situation is different, fault-locating techniques are not skills that can be learned from books alone. Fault-locating skills must be developed through work experience.
Con Edison is bringing young employees into the department to learn. General Utility workers (GU’s) who enter the department must go through formal training, testing, OJT, and Field Operating Department (FOD) school. It takes 3-4 years to become a journeyman. Even after an employee becomes a journeyman Field Operator, Con Edison typically waits until that employee is more experienced before assigning certain duties, such as high-tension switching.
The performance of fault locating is a 24-hour-a-day, 7-day-a-week operation. Con Edison, on average, locates three faults a day. Their average time to locate a fault is two hours.
One of the challenges faced by many companies is that fault locating is shared with other duties. Consequently, it is difficult to develop experts and retain expertise. At Con Edison, the fault-locating group is a dedicated group, enabling them to become very proficient in fault-locating techniques. Con Edison has been called on by other utilities numerous times to aid in fault location.
Process
Feeder Identification
When the suspected location of the fault is identified, the Con Edison field operator places a “Suspected” tag on the cable where the fault is suspected to have occurred. After identifying the suspected location of a fault, Con Edison sends out low-voltage pulses on all three phases of the feeder to positively identify the cables and cable phases. Only after the cable and cable phases are positively identified, does the field operator apply a tag confirming the feeder with the fault.
Once the location of the fault is identified, the field operator calls the station operator to take off the signal used to locate the fault, and ground and test the feeder. The District Operator orders the placement of the ground in the first vault with a transformer past the fault. Placing that ground at the transformer involves receiving an order including the switch lock combination and operating the ground switch at the transformer primary. This grounds and shorts all three phases. The reason for going to the transformer is to confirm that the circuit is being grounded, and because good tracing current can be identified at this location.
The Substation operator then puts a tracing current on the circuit. The following protocol is utilized for distinguishing the phases: A phase, one beat; B phase, 2 beats; C phase, negative (return). An operator in the manhole listens for the A, B, and C signals. He or she also checks every other cable in the hole to be sure the proper cables have been identified.
Once the field operator identifies the cable, he or she physically marks the cable and fills out a tag that positively identifies the cable, moving it from “suspected” to being positively identified. The tag has a serial number, and is included in switching orders with dispatcher.
Fault Locating
A distribution system fault usually results in a primary feeder breaker locking out (Open Auto). When a feeder opens, the District Operator (DO) has the substation operator retrieve the relay targets. Then the DO gives the feeder to the substation operator to establish the condition of the feeder. The Substation Operator performs a Hi-pot test to confirm that there is a fault.
When it is determined that there is a cable fault, the Control Center calls the Field Operating Department (FOD) to locate the fault.
The basic steps to fault locating include:
-
Isolate the feeder (Open high-tension switches and any other potential back-feed source.).
-
Verify the feeder as dead (Confirm that there is no back-feed from network protectors that may be hung up.).
-
Ground the feeder.
-
Locate fault.
Con Edison uses several methods to locate faults. High-voltage methods (use of high-voltage pulses applied to the feeder at the substation) include:
-
High-voltage pulses can be applied with a capacitance discharge test set (thumper) (20,000 V)
-
High-voltage DC pulses can be applied with a Thyratron
-
High-voltage Kenotron surges
After the pulses are applied, fault-locating operators travel the route of the feeder, entering manholes to take readings with a galvanometer that detects the pulse. If the pulse is present, the operator proceeds to the next manhole. The absence of a pulse indicates that the fault is located somewhere between the current manhole and the one previously checked.
Although inherently time-consuming and labor-intensive, applying high-voltage pulses (thumping) has proven best suited to the characteristics of Con Edison’s system when compared with other fault-location methods. Low-voltage methods are used much less often, because they only work under certain circumstances. Note that Con Edison uses an above-ground fault detection technology that minimizes the number of manholes that must be entered to detect a fault.
Other methods, such as Time Domain Reflectometry (TDR) are used to locate faults on transmission lines, but are less effective on Con Edison’s distribution system because of the significant number splices, Y and T connections, transformer connections, and the bonding of dissimilar cable types with varying propagation velocities, which can create indistinguishable reflections to an operator, masking the identity of the fault.
Secondary Fault Location
Con Edison does not have a good method of ascertaining whether or not cable limiters have blown. Utility crews take a current reading and use a device that puts a signal on the secondary, but these methods are not trusted by all the work groups at Con Edison.
Con Edison has asked three different manufacturers to develop a new limiter design that provides fault indication and can be quickly replaced. For example, one manufacturer has developed a cable limiter with a clear covering so that the user can see that the device is open. Con Edison is currently evaluating this product.
Technology
Reactance to Fault Application – RTF
Con Edison is using a system that predicts the location of faults on the system based on an analysis of the electrical waveform at the time of the fault. The base platform for the system is the EPRI PQ View product, with an add-on called the “Fault Location Module.” The Con Edison system collects and houses the data and manages the waveform of the fault. Con Edison has integrated this model with their mapping system, such that the system can display the prediction of the fault location on their feeder map board. From this system, Con Edison can also view relay targets from a locked out feeder.
Prior to the implementation of this system, Con Edison’s approach to troubleshooting a feeder was to go halfway out on the circuit, and begin tracing and testing. The implementation of the Reactance to Fault (RTF) application enables the utility to pinpoint the location of the fault, significantly reducing the average restoration time. (Con Edison reduced the average restoration time by about one hour!)
The system also lets an operator know if the fault type is of a hazard level where company safety rules require special precautions for manhole entry, or prevent entry, depending on the specific hazards encountered (called C & D faults in Con Edison lexicon).
Above-Ground Fault Detection
Con Edison utilizes an above-ground device to pre-locate faults, opening manholes only to pinpoint the location of the faults. The device is a TEC-X35, and was developed collaboratively over a period of years by Con Edison and several technology partners, such as the former Bell Labs, and the Technology Enhancement Corporation (TEC). This device has helped Con Edison to substantially reduce the time and cost of finding faults, and thus, reduced the length of feeder outages. The savings results from a reduction in the number of manholes to be opened, possibly pumped out, and entered using traditional fault-location techniques. By minimizing the number of manholes entered, Con Edison avoids dealing with potential environmental issues associated with pumping out oil-contaminated water.
The X35 device is used above ground to display either polarized thumper signals or DC high-voltage test set (Thyratron) signals to help direct field operators to the fault location. A field operator stands directly over the feeder and takes measurements above the ground. A reference measurement is taken at the feeder source. The operator then moves along the path of the feeder taking measurements and comparing them to the reference measurement. A positive reading with an amplitude similar to the one taken in the substation vicinity indicates that the operator has not yet reached or passed the fault location. A small or negative reading indicates that the operator has passed the fault or has chosen the wrong feeder leg. When the location of the fault has been narrowed down, Con Edison uses traditional techniques (Galvanometer) to pinpoint the fault location.
Trucks
Con Edison provides its employees with the specialized tools and equipment that they need to do their jobs, including trucks outfitted for the different types of work that they perform. Employees stated that they believed Con Edison provides them with good quality trucks, appointed with the equipment they need to perform their work. People demonstrated a sense of pride in their trucks and associated equipment.
Con Edison’s network resources use specially equipped box trucks. Each department truck is outfitted to meet the needs of that group, including multiple storage bins for housing the onboard equipment.
For example, Fault Location Operators use a box truck equipped with a capacitive dc test set and a Galvanometer.
7.6.4.6 - Duke Energy Florida
Operations
Fault Location
People
For network issues, the Network Specialists and Electrician apprentices who are part of the Network Group serve as first responders in a system outage, and are responsible for fault location.
For non-network issues, such as troubleshooting an automated transfer switch (ATS), Troublemen, serve as first responders and are responsible for fault location. Troublemen report to a field supervisor, and are organizationally part of Duke Energy Florida’s Construction & Maintenance (C&M) group. Troublemen work closely with the dispatchers at the DCC.
All supervisors at Duke Energy Florida have an “on call” responsibility. Supervisors rotate their on-duty responsibility.
Duke Energy Florida uses the ARCOS automated callout system for obtaining craft worker resources.
Process
In Clearwater, the dispatchers at the DCC monitor feeder cables and can identify faults, usually when a breaker trips. In addition, dispatchers may receive indication from remote reporting faulted circuit indicators installed at network feeder sectionalizing switches. In general, the dispatcher relies on field crews to identify which fault indicators (FCIs) are tripped, and locate faults.
Any switching performed on the network during fault events at a site is performed by network work crews in the field. In non-network areas, field switching during fault events will be performed by Troublemen. At remotely operated substations, DCC will open breakers. If manual switching is required at a substation, Substation Electricians are sent to the substation to perform switching.
Permanent repairs to faults are not always performed immediately when a feeder opens because the network system has enough contingency to pick up the load. Once a feeder is open and isolated, crews can perform hi-pot (thumper) tests to determine the where the fault is along the isolated line segment. After the fault is located, the dispatcher is notified and generates a work order for a crew to make repairs the next day, unless customers are without power. If customers are without power, repairs are made immediately after the fault has been located.
In St. Petersburg, when an ATS successfully transfers, crews may also wait until the next day to address the issue. If necessary, crews will identify and isolate the faulted segment to ensure safe delivery of power to customers.
Radial feeders with no contingency will be repaired immediately after fault location by Troublemen and Dispatch.
Technology
Duke Energy Florida has SCADA control and monitoring at its substation breakers. In addition, for network feeders, they have installed remote reporting faulted circuit indicators at network feeder sectionalizing switch locations. These devices are hardwired to pole mounted devices which communicate back to the DCC via a 900 MHz radio system.
Duke Energy Florida has expanded its application of SCADA to monitor and control its automated transfer switches (ATS), which are prevalent in the primary / reserve feeder scheme used to serve customers outside of the network in Clearwater and in St. Petersburg.
Duke Energy Florida’s historic cable design has used separable connectors, such as the use of T-body connections for straight splices. This type of design enables field crews to separate cable sections, facilitating the fault location process.
7.6.4.7 - Duke Energy Ohio
Operations
Fault Location
People
At Duke Energy Ohio, fault location is the responsibility of the Dana Avenue underground. This includes not only fault location on the network system, but fault locating on the URD system as well[1] .
The Relay and Test department and Substation Maintenance departments typically get involved in network feeder fault location, as they are responsible for diagnostic testing performed inside the substation fence.
Process
One of the first actions taken by the Dana underground group in responding to a fault is to notify the Relay and Test department and Substation Maintenance department so that they can report to the substation and begin doing the necessary work to prepare to locate the fault (un-tape cable terminations, for example).
Dana Ave. crews will visit each transformer location long the feeder and open up the transformers; that is, put the transformer primary switch in the open position. Crews will place a ground on the first transformer outside the substation.
For certain feeders, Dana crews will look to see if there’s water in manholes. They know of certain holes that typically take on water, near the river. If there is water present, they will notify a pumping contractor to visit these holes and pump out the water.
After the Relay and Test department resources at the substation are ready to perform the fault location test, the Dana underground crews will remove the grounds so that they can perform the test. For network feeders, the Relay and Test department “thumps” the cable using a Hi pot tester (Thumper) permanently installed at the network substation.
Dana Avenue field resources use a receiver and locate the fault. Duke Energy Ohio is not using above ground signal detection, as they are not using a grounded system. Field resources enter each hole with the receiver to determine the location of the fault.
After the fault is found, the Dana Avenue crew’s will put a ground on the system outside the station. Then, the resources at the substation will ground the station. Finally, Dana Avenue crews will revisit every transformer location on the feeder, and put the transformers in the ground position. Note that every transformer is grounded, rather than creating an island around the fault.
Duke is unable to obtain a visible break in their network system. Their network transformer primary switch compartments do not contain a site window. Crews will lock open and tag network protectors, but they do not remove network protector fuses or rack out the breakers.
After repairs, Dana Avenue underground crews revisit every transformer location, and move the transformer switch back to closed position returning the system to normal.
Before they reenergize the primary feeder, they will perform a fuse test. (See Network Protector Fuse Test)
Technology
Duke is using a Hi pot capacitive discharge tester (Thumper) to locate faults.
They do not use radar for fault location, as radar is ineffective for them, having a hybrid system, with long feeders and multiple branches.


Figure 1 and 2:
Thumper located at Network Sub
[1] Note that, on average, Duke Energy Ohio experiences between 600 and 700 URD burnouts per year.
7.6.4.8 - Energex
Operations
Fault Location
People
Fault location is the responsibility of the Operations Center , part of the Service Delivery organization at Energex. Outages that are reported by customer calls typically flow through the Evaluator position in the center, while outages that are reported through remote monitoring or field service reports typically flow through the switching coordinators.
Energex has rapid response crews located in their various service centers, referred to as hubs. The rapid responders are comprised of electrical fitter mechanics, which is the highest capability journeyman position at Energex. Within the Central Business District (CBD), substation fitter mechanics, who are qualified to work with the relay operated switchgear (breakers) that are part of three-feeder mesh, serve as rapid responders. Substation fitter mechanics are a bit more specialized than the electrical fitter mechanic position.
Rapid response crews work two shifts, a 6:00 am to 2:00 pm shift, and a 2:00 pm - 10:00 pm shift, 7 days per week. Energex utilizes a “stand by” roster, which it uses to call out to standby rapid response crews on the night shift. Within the Central Business District (CBD), Energex also holds a substation crew (substation fitter mechanics) on standby. Note that workers on standby may take vehicles home with them so that they can respond more rapidly (each crew member takes a vehicle home).
Process
Switching coordinators monitoring the CBD can monitor alarms associated with the primary feeder that has a protection indicator that flags a fault. Multiple indicator flags isolate the leg of the feeder that has a fault. Almost every substation is relay operated, and all 11 kV units have fault indicators.
A rapid response crew and a substation crew respond the outage. When it is determined that cable fault location will be required, a cable diagnostic crew would be called in to locate the fault.
Technology

Figure 1:
Cable test set applied to medium voltage circuit
7.6.4.9 - ESB Networks
Operations
Fault Location
People
ESB Networks has a well-documented process for performing fault location, documented in their Cable Fault Location manual (See Attachment B: Cable Fault Location Manual Table of Contents ). The document outlines the ESB Networks preferred processes for performing cable location, and includes information on various cable fault location tools and techniques as well as issues related to safety and training. ESB Networks revisits the content of this manual on a three-year cycle to assure it is up to date.
Process
ESB Networks had defined a preferred process for performing fault location. It consists of:
-
Evidence gathering: Includes performing a thorough assessment, including obtaining maps, and reviewing information provided from protective relays or fuses.
-
Fault assessment and diagnosis: Includes test to confirm the existence of and to categorize the fault, so that the proper fault location techniques can be employed. Includes continuity and resistance testing.
-
Pre-location and fault conditioning, if required: Includes application of strategies to reduce the test time voltages are applied to minimize cable stresses, and to minimize the down time on the cable. The pre-location strategies vary depending on the findings from the fault assessment and diagnosis. The table below (Figure 1) outlines the pre-location strategies:

Figure 1:
Pre-location Strategies
-
Route tracing and measurement: Includes impressing a signal on the cable to mark the route of the cable.
-
Pin-pointing: Includes strategies to pinpoint the location of faults such as thumping the cable and using a ground microphone, and using audio frequency signal generators and receiver coils.
-
Excavation: Includes strategies for positively identifying the cable, including spiking the cable.
-
Secondary effects: Includes checking to make sure that secondary and service were not damaged by the fault.

Figure 2:
ESB Networks fault location process
ESB Networks primary switches used within their MV substations cannot be used to break load, but can be closed into a fault – a “fault make.” When ESB Networks troubleshoots a faulted primary cable section, it first uses faulted circuit indicators (FCIs) to try to narrow down the location of the affected section. Then personnel disconnect the portion of the feeder thought to be outaged, and try closing back in the remaining section. If it closes into the fault, the feeder trips again. In this way, personnel can narrow down the location of the fault.
Technology
Because ESB Networks uses sector-shaped cables within its secondary, there is some difficulty getting good crimp connections with traditional secondary connector systems such as HOMAC connectors. Consequently, the system experiences occasional connector failures in the secondary system.
In Dublin, many services are “T” services, where the service is tapped off of the secondary using a self-piercing connector. One challenge that ESB Networks networks faces is that the locating of faults in the secondary system is difficult with these T connections. ESB Networks often must resort to “stabbing” the cable at various locations to see if it is still live.
Fortunately, ESB Networks has excellent records of where the cables are located. It has hand-drawn records that include detailed maps of the secondary. Highly congested areas are enlarged so that details are available, including the location of joints and cable bends.
For cable changes, an Engineering Officer goes out into the field and confirms the change and assures that the records are up to date. The ESB Networks UG has a separate person for this operation because the group understands the importance of complete records. For example, ESB Networks needs accurate records to be able to dig up the ground in the right spots.
Neutrals are connected through a Peterson coil to the 38-kV side of transformers that creates an arc-suppressed system. ESB Networks does not trip for earth faults, and it has three hours to clear the fault. When there is a ground fault, ESB Networks monitors the open delta voltage and receives an alarm indicating it has a ground fault on the system. The fault could be transient. If it is sustained, ESB Networks receives a sustained alarm. Because the meshed system in Dublin is protected by impedance and differential relays, it can isolate interruptions in milliseconds.
7.6.4.10 - Georgia Power
Operations
Fault Location
People
It is the responsibility of the Network Control Center personnel (Test Engineers) within the Georgia Power Network Underground group to assist ground crews in locating faults on the network system. Test Engineers in the Operations and Reliability Group are responsible for operating and monitoring the network system, including directing fault location activities. This Network Control Center is organizationally part of the Network Operations and Reliability group, led by a manager.
The Network Control Center Test Engineers are four-year or two-year associate-degreed engineers. The group works closely with maintenance crews, Key Account representatives, Test Technicians, and the Distribution Control Center.
Operations department Test Engineers along with Maintenance crews comprised of Cable Splicers, Duct Line Mechanics, and WTOs, perform the field work associated with fault location.
Process
When a primary fault occurs, it causes the feeder breaker to trip. That causes alarms at the Distribution Control Center and at the Network Control Center. The DCC operator immediately notifies the Test Engineer on call and sends a text message to selected management and others. Most faults are also detected by the Network Control Center personnel through its remote monitoring system connected to all the network protectors and reporting faulted circuit indicators. The fault indicators provide the general area of a fault through SCADA and enable the operator to narrow down the location to send crews for further analysis and fault isolation. Georgia Power has a written procedure for fault location and isolation.
Georgia Power crews will use a DC hi-pot (impulse tester) applied to the circuit at the substation, and thump the cable to identify the fault location. Operations department field personal and maintenance crews, under the direction of the Network Control Center operator, will walk the line above using an above-ground EMF detector, and listening for the thump. Maintenance crews open manholes that might be near the fault. A second crew of operations and maintenance workers will start on the other end of the feeder, opening manholes to inspect, and working their way back to narrow the location of the fault.
The impulse generator (thumper) charges and discharges at automatic eight-second intervals, and the crew may leave a person behind at the station to monitor the generator. While crews normally use an above-ground EMF detector while walking the line, they occasionally lose the pulse, and must enter the manhole to use a cable-clamp based EMF detector. The clamp-based detectors are 90 to 95 percent accurate. Once crews pass where the fault is occurring, deflections almost disappear.
Once the fault is found, operation personnel ground the feeder at the substation, and notify the maintenance supervisor to proceed with work. The maintenance supervisor will then put his field grounds in place to make sure the crew is working between grounds. The makeup of the repair crew involved depends on the time of day, and type of problem that created the fault, and can include maintenance or construction resources
In general, the Georgia Power secondary grids in Atlanta experience few faults, as they are not heavily loaded. However, in Savannah the company has a heavily loaded secondary mesh system and is designed with cable limiters. At selected locations in Savannah, the secondary is configured with current transformers (CTs) clamped around half the secondary cables and CTs on the other half of the mesh, with remote communications. If a cable limiter blows, Operations can then see through SCADA the load shift from one CT to the other, and thus determine remotely that the limiter has blown. To reduce cost, the company uses two CTs per phase on a four-cable secondary run.
Technology
The Network Control Center and maintenance crews have extensive, accurate network maps available online through the Georgia Power Underground group’s GIS system.
Georgia Power uses the ARCOS system to perform callouts of field crews to respond to an outage / emergency. This automated phone system calls the roster of “on-standby” personnel and directs them to call their supervisors for instructions. Maintenance crews and other designated personnel are expected to be on stand-by and have a response requirement: they must respond to at least 50 percent of all emergency, off-hours calls each year. Georgia Power also has a volunteer list for those who want overtime, and volunteers are first in the ARCOS calling queue. Note that all employees of a classification are grouped together for call out, even if they work in different groups.
Georgia Power has installed self-reporting faulted circuit indicators on some feeders, which helps to narrow the search for the fault location (at least eliminates half the feeder). They noted that these devices have limited battery life.
Georgia Power has also done pilot projects using fault current magnitude with computer models of the system to predict the likely fault locations. This is promising, and is expected to be even more useful as data improves in the system models, and as more network feeder breakers are equipped with electronic relays.
7.6.4.11 - HECO - The Hawaiian Electric Company
Operations
Fault Location
People
Primary Fault location at HECO is the responsibility of the Cable Splicers within the Underground Group. Secondary fault location is the responsibility of the Overhead Group.
The Primary Trouble Man (PTM) position is also involved in the front end of the fault location process, responding to the initial outage caused by the fault, isolating the suspected faulted section, and restoring service.
Process
Most of HECO’s distribution system is installed in concrete encased conduit. The exception is some older direct buried, looped URD sections. According to HECO, the majority of cable faults occur in these direct buried installations.
A distribution system fault usually results in the operation of a protective device such as a riser fuse or breaker lockout. HECO will dispatch a Primary Trouble Man (PTM) to isolate the problem to a cable section, and sectionalize to restore service. Because HECO’s URD system is designed in a loop configuration, and because of their practice of using fault current indicators in all pad mounted equipment, the PTM is able to go to each transformer location, and using fault indicators, identify the suspected cable section in which the fault occurred. The PTM can then sectionalize; that is, lift elbows to isolate the faulted cable section, and close normally open points along the loop to restore service to customers. The PTM will also apply the appropriate safety tags to the isolated cable section.
Cable Splicers from the Underground group will perform the actual fault finding and repair. Having the PTM’s respond to outage, isolate, and sectionalize to restore service to customers enables HECO to schedule fault location. When the Cable Splicers arrive, the faulted cable section will have been already isolated and tagged by the PTM. The Cable Splicers will verify the feeder as dead, before commencing with fault location. They will do this using both an AB Chance tester using the elbow test point, and a HECO fuse stick, a HECO developed tester for testing and grounding (see “Fuse Stick”).

Figure 1:
Padmount transformer with parked, tagged elbow

Figure 2: AB Chance tester
HECO uses a high voltage capacitance discharge test set (Thumper) to locate faults. Note the test set leads attached to the cable section through a feed through bushing in the pictures below.


Figure 3 and 4:
Test Set leads applied
Using the thumper, the Cable Splicers will isolate the location of the fault so that they can make repairs. After locating and cutting a faulted section of cable clear, HECO crews make the splice, and then do a proof test (voltage test) to assure that the splice holds.


Figure 5 and 6:
URD Splice
Technology
HECO uses Fault Current indicators in every padmounted transformer. This facilitates trouble shooting in that a PTM can quickly isolate the section in which the fault is located.

Figure 7:
Fault Current Indicator in Padmounted Transformer
HECO has fault location trucks, equipped with test equipment to facilitate fault locating.


Figure 8 and 9:
HECO Fault Location Truck
7.6.4.12 - National Grid
Operations
Fault Location
People
Maintaining and operating the Albany network system, including fault locating, is the responsibility of Underground Lines East. This group is led by a manager, and includes field resources focused on civil aspects of the underground system and a field resources focused on the electrical aspects.
The Electrical Group, comprised of Cable Splicers and Maintenance Mechanics is led by three supervisors. Maintenance Mechanics perform fault locations, as well as network switching, minor vault maintenance, and inspection and maintenance of network vaults and equipment such as transformers and network protectors.
National Grid has a documented procedure for fault location that is part of their Electric Operation Procedures (EOP). This procedure contains flow charts that guide the field resources through the process. Note that National Grid EOP’s are available in hard copy or electronically on the company’s intranet.
Process
To perform testing, National Grid will isolate, tag, test as de-energized and ground the circuit to be tested per their written Clearance and Control procedures. For network feeders this procedure includes visiting every transformer vault, opening the transformer primary switch, and opening the network protectors. All network protector switch handles are opened, tagged and locked open, and the transformer primary disconnect switches are locked open.
As stated in the National Grid EOP, the objective of the fault locating procedures is to safely and expeditiously pinpoint the exact location of a cable system failure while minimizing the potential for damage to good cable. The procedure consists of five steps: Investigation, Verification, Pre-locating, Pinpointing and Confirmation.
Investigation provides a preliminary assessment of the fault situation from field conditions, relay targets, and a review of maps and records to determine feeder type and configuration.
Verification usually consists of two parts; performing a Meggar test to measuere insulation resistance of each phase, and an AC VLF Hipot test (Pick Up test) to identify the faulted phase.
Pre-Locating involves performing activities to narrow down the location of the fault, including such things as examining the cable route for visible signs of the fault, (for example, dislodged manhole covers or smoke emanating from a manhole) and applying tests to determine the distance to the fault, such as Time Domain Reflectrometry (TDR) . These tests and others, including the Murray Loop Bridge Method and Voltage Ratio Method, are detailed in the National Grid EOP.
Pinpointing consists of applying a tracer signal to the faulted cable and then finding the signal in the field. This can either be a capacitor discharge test (“thumper”) where an employee goes to the site and listens for the audible thump or detects the discharge using a magnetic / audio detector (pickup coil), or the use of a current trace (Thyratron) signal where a field employee can detect the signal using an impulse detector.
Confirmation involves a field employee observing the faulted cable if possible.
Technology
National Grid is using fault location equipment from HV Diagnostics. Resources appear to have confidence in this equipment.

Figure 1:
HV Diagnostics VLF Test equipment

Figure 2:
HV Diagnostics VLF Test equipment
National Grid is using two different magnetic detectors, the TEC-X35, Megger Electromagnetic Impulse Detector and the Megger MPP1000. The TEC-X35 is a handheld detector that is capable of picking up the signal from above, eliminating the need to enter manholes.
7.6.4.13 - PG&E
Operations
Fault Location
People
PG&E’s Maintenance & Construction Electric Network Department is responsible for the maintenance of the underground network system, including fault location. In San Francisco, all routine maintenance is undertaken at night. However, the department does maintain a daytime crew that performs fault location and repair.
The more complicated faults to locate are often supervised by a Supervisor- Distribution, part of the M&C Electric Network group.
PG&E has well documented procedures explaining the use of its fault location equipment. (See Attachment L .)
Process
Faults may result in a feeder locking out, or emerging faults may be identified through diagnostic testing, such as Very Low Frequency (VLF) alternating current (AC) which is sometimes referred to as high potential (Hi-pot) testing. .
EPRI observers witnessed the PG&E fault location process associated with a feeder identified as having a problem, through VLF testing. PG&E field crews and supervision demonstrated high degrees of proficiency in the use and understanding of the function of fault location equipment, executing the fault location process, and interpreting the readings from the tests. EPRI observers noted good working relationships among crew members, supervision, engineering, and Applied Technology Services (ATS) resources that were on site.
PG&E had performed a VLF test on the network feeder as part of a proactive testing program. The VLF test revealed some breakdown of the installation on one of the phases of a particular feeder. PG&E used a combination use of VLF testing and a capacitive discharge unit (thumper) to locate the fault.
After clearing the feeder, the VLF test was initially applied at the substation which showed a breakdown somewhere on the feeder.
Because PG&E’s network feeders are designed with normally closed sectionalizing points (typically either older oil-filled switches or new solid dielectric switches), fault location crews have the ability to isolate a section of a feeder to be tested. In this case, PG&E opened one of the sectionalizing points and then re- performed the VLF test at the substation. This second test revealed no breakdown of the insulation, indicating that the problem with the cable was further down the line, beyond the sectionalizing point.
To perform testing, PG&E will open the circuit and ground it. They will visit the sectionalizing locations, and open and ground them. Once they have isolated a section to be tested, they will visit every transformer vault between the switches, and open both the transformer primary switch, and the network protectors. All switch handles are tagged and locked in the open position.
They will then apply the VLF test set to the section of cable. Note that proactive VLF testing is performed by the Applied Technology Services (ATS) group. This group will sometimes participate in and supervise VLF testing associated with fault location. In this case, the ATS group was on site because the initial problem was discovered by proactive testing of the network feeders.
After confirming that the feeder section isolated between the two sectionalizing devices was indeed the faulted section, the fault location crew applied a thumper with arc reflection (radar), which provided a signal to indicate the location of the fault. However, this particular circuit had so many taps that the reflection did not reveal the location of the fault.
The fault location crews then “thumped” the cable, and assigned resources to visit each vaults using pickup coils to pinpoint the location of the fault. The cause of the breakdown, in this case, was a failed lead splice.
Technology
PG&E is using fault location equipment Von. Their tester is a combination arc reflection and capacitive discharge unit. PG&E resources appear to have confidence in this equipment.
The VLF test set is transported to the location by a specialized van equipped with a ramp used to wheel the VLF test set on and off the truck. This particular van also contains other cable diagnostic equipment, such as tan delta device and a TDR kit.

Figure 1:
Von Arc Reflection and Capacitive Discharge Tester

Figure 2:
VLF Test Truck

Figure 3:
VLF Test Kit
PG&E is buying Schweitzer three conductor lead cable fault indicators. These fault indicators are SCADA ready, but are not presently tied in to SCADA. PG&E, with the implementation of their new network remote monitoring system, intends to tie these fault indicators into SCADA so that the distribution operator can view indicator status.
7.6.4.14 - Portland General Electric
Operations
Fault Location
People
Crews within the underground CORE group, along with the Special Tester, perform fault location. The load dispatchers within the System Control Center (SCC) are usually participants in the fault location process as well.
If a breaker locks out on a network feeder, the dispatcher receives an alarm and contacts the duty engineer and duty general foreman (DGF), the people on call to respond to situations in the network. The DGF will assemble a crew and try to isolate the fault. This crew normally involves the Special Tester, who performs fault locating. The Special Tester is a journeyman lineman with additional training and technical skills, including fault locating. PGE has embedded one Special Tester within the CORE group.
The typical underground crew performing fault location consists of the Special Tester, a crew foreman (a working foreman who is a journeyman cable splicer), a lineman/cable splicer (journeyman), and a topman, a non-journeyman helper.
Process
To locate faults, crews use a direct current (DC) high potential (hipot) tester (thumper) and time-domain reflectometry (TDR). All Special Testers carry fault location equipment on their trucks.
If a feeder breaker opens for a network feeder due to a fault, the SCC calls the duty general foreman in the network group. Because of the system redundancy of the network design, a faulted feeder would not result in customer outages, so there will be no outage management system (OMS) events. The DGF decides whether the issue can wait until the following day or needs to be dealt with immediately. In light load periods, the repair of single feeder outages is often left to the following workday.
When a feeder locks out, the dispatcher provides a clearance to the crew, which performs fault locating. Obtaining this feeder clearance involves going to each vault and opening both the network protector (handle in the open position), and the primary switch on the network unit. The crew then goes back to the substation and tests and grounds the feeder for safety.
To perform fault location, the crew ungrounds the feeder at the substation and connects the DC hipot equipment to each phase at the cable termination, one at a time, to determine which phase may have faulted. Once it has isolated the phase, it performs a TDR test to try to determine the location of the fault. TDR injects a voltage pulse into the cable system and looks at reflections back to the source end of the circuit caused by discontinuities in system impedance. The Special Testers noted that TDR is useful in narrowing the location of the fault if the fault is not far from the substation.
The main method used for fault location is cable thumping. The Special Tester applies the thumper to the circuit at the cable terminations at the station. Crews use a hand-held impulse detector, which must be placed on the cable to detect the pulse. Crews go from manhole to manhole until they locate the fault. If this device detects the pulse from the thumper, then the crews know that the location of the fault is further out on the circuit. If the TDR test does not help them narrow the location of the fault, crews typically begin this process midway out on the feeder.
Technology
To locate faults, crews use a DC hipot tester (thumper) and time-domain reflectometry (TDR). All Special Testers carry fault location equipment on their trucks.
While PGE uses faulted circuit indicators (FCIs) on its radial systems, they are not extensively used on the network system.
7.6.4.15 - References
EPRI Underground Distribution Systems Reference Book (Bronze Book)
7.6.4.16 - Survey Results
Survey Results
Operations
Fault Location
Survey Questions taken from 2019 survey results - Inspection Practices survey
Question 16 : In what applications will you perform network primary cable diagnostic testing? (Check all that apply)


Question 17 : In what applications will you perform Non-network primary cable diagnostic testing in urban UG systems? (Check all that apply)


Survey Questions taken from 2018 survey results - Asset Management survey
Question 10 : If you perform periodic network primary cable diagnostic testing, please indicate / describe what testing techniques you use.


Survey Questions taken from 2015 survey results - Maintenance
Question 81 : In what applications will you perform network primary cable diagnostic testing? (check all that apply)


Question 84 : Please indicate / describe what testing techniques you use.


Question 87 : Are performing periodic secondary network cable withstand testing?

Survey Questions taken from 2012 survey results - Maintenance
Question 6.5 : In what applications will you perform cable diagnostic testing?


Question 6.7 : If yes, please indicate / describe what testing techniques you use.


Survey Questions taken from 2009 survey results - Maintenance
Question 6.9 : In what applications will you perform cable diagnostic testing?


Question 6.10 : If yes, please indicate / describe what testing techniques you use.


7.6.5 - Flood Plan
7.6.5.1 - Energex
Operations
Flood Plan
People
The central business district of Brisbane is a flood-prone area, and Energex has historically had multiple experiences with CBD flooding. Energex has produced a comprehensive flood risk management plan that includes strategies for improving flood resilience in the CBD.
The plan was produced by a committee that was formed to specifically identify strategies for making the Energex infrastructure more resilient to flooding. The plan was guided by recommendations from a study performed by an external contractor to assist Energex in identifying flood mitigation options for the CBD.
Process
The plan includes guidelines such as:
-
Plans for identifying electricity assets that may be affected by a major flood, such as overlaying Energex network assets (from GIS) over a map of major flood risk areas.
-
A review of business continuity plans for key areas, such as the control center and stores and logistics.
-
Operational plans for critical infrastructure, such as installing sandbags/protective barriers to protect certain equipment in substations, and performing switching to shift load away from stations that are susceptible to flooding.
-
Plans for identifying dry disconnection switching points for flood-prone distribution assets.
-
Priority listing for performing preemptive disconnection and reconnection of certain critical assets.
Energex has implemented a number of flood resiliency initiatives including the following:
-
Raising facilities and implementing barriers at substations prone to flooding.
-
Documenting and prioritizing assets that should be disconnected and when in advance of a predicted flood event.
-
Identifying spots for generator connections around the network, and installing ground level connections for mobile generators at building vaults.
-
Sealing conduits to prevent flood waters from flowing through conduits and flooding normally dry vaults.
-
Installing remotely operated switches at wet/dry interface points around the system.
7.6.6 - Fuse Stick
7.6.6.1 - HECO - The Hawaiian Electric Company
Operations
Fuse Stick
People
The Fuse Stick is a home made device developed by the HECO Underground group as a tool for testing, grounding, and confirming that facilities are de-energized. See Determining a Feeder to be De-energized . The tool is used as supplemental tester to conventional testers. HECO developed the device because of a lack of confidence in conventional test devices, and because the fuse stick tester provides a quicker way to ground than applying a ground elbow.
Note that HECO is using conventional testers also, and that the fuse stick is used as a supplemental tester only.
Process
HECO crews will first apply a conventional tester, such as an AB Chance tester, to capacitive test points to determine whether or not a cable is de-energized. Note that their testers are outfitted with batteries, and are checked to assure they are working prior to each use.
Assuming that the Chance tester provides no reading, indicating that the circuit is dead, HECO will next apply the fuse stick. The “Ground End” of the fuse stick is grounded via a ground lead. The “Fuse End” is then touched to test point. ( If the circuit is energized, the fuse would pop.) Then the Fuse stick head is flipped over and the ground end is touched to the test point, grounding the feeder. This process is repeated at each test point (multiple phases for example).
Technology
Soldered end cap that would blow out and provide visible indication (Fuse End)
The Fuse Stick tester consists of an insulated stick with a 1 amp fuse mounted in the end. The one end of the fuse is fitted with a copper probe that is grounded by a ground lead (Ground End). The other end of the fuse is fitted with a conductive cap with a soldered end designed to blow out should the fuse blow (Fuse End). (See photographs below)

Figure 1:
HECO Fuse Stick

Figure 2:
HECO Fuse Stick (Grounded End)
7.6.7 - Incoming Materials Inspection
7.6.7.1 - Duke Energy Florida
Operations
Incoming Materials Inspection
People
Equipment standards are determined by the Network Standards group, in cooperation with the local (Duke Florida) and Duke Corporate Network Standards groups.
At the Clearwater supply and maintenance facility, Network Specialists test, maintain and rehabilitate network protectors and NP relays.
Process
Network Specialists acceptance test new network protectors as they arrive from the manufacturer. Duke Energy Florida underground experts feel this acceptance testing of new equipment is critical and noted that they had two new network protectors fail their acceptance testing in recent years.
Incoming cable and accessories are also spot inspected to identify failures.
7.6.7.2 - Energex
Operations
Incoming Materials Inspection
Process
In years past, Energex performed routine incoming equipment inspections for new materials coming onto their property. With the advent of ISO 9000, and Energex’s requirement that vendors comply with this standard, Energex has ceased these inspections, and instead relies on the supplier quality procedures for testing new materials. Incoming materials are accompanied by the results of this vendor testing. Some quality issues with a product identified by the field force would be addressed through procurement (e.g., receipt of a batch of cable with cracked insulation).
Energex has defined testing and commissioning procedures for installing equipment. For example, new cables are subjected to diagnostic (DC hi-pot for PILC, AC VLF for XLPE) testing, prior to energization.
Other examples of quality initiatives include the approval of all civil designs by a civil professional engineer, procurement of hardened materials, such as the purchase of an outer cable jacket that is resistant to termites, a common problem in Queensland, and the use of dry type transformers in the building vaults within the CBD.
7.6.7.3 - Georgia Power
Operations
Incoming Materials Inspection
People
The Network Underground group has a testing laboratory located at its centralized facility in Atlanta. The lab is managed by a senior engineer in the Network Underground group and staffed by Test Engineers and Test Technicians on an as needed basis. Network Underground Test Engineers, Test Technicians, and Network Engineers all have access to the network underground test Lab.
Process
The Georgia Power Network Underground testing facility is used to test network system equipment, cable, and failed components. The test lab also performs routine commissioning tests on certain incoming items, such as transformers and network protectors before they are rotated into stock or deployed in the field.
For example, when a new transformer arrives, Test Technicians perform TTR and Meggers tests, check the oil level and its dielectric properties, and then record the nameplate information including serial number into the Georgia Power GIS system before it is put into stock.
The lab is also used for testing of failed components as most forensic analysis is performed in-house. In the event a cause of a failed component cannot be determined, the Network Underground senior engineers may turn the failed equipment over to the manufacturer or send it to an outside, third-party analysis group, such as NEETRAC.
Technology
EPRI researchers were impressed by the tools, equipment, and orderly management of the testing facility.
7.6.8 - Load Shedding
7.6.8.1 - CEI - The Illuminating Company
Operations
Load Shedding
People
If circumstances require manual load shedding, the execution of the load shed is led by the RDO.
Process
CEI has pre-prioritized circuits and can initiate a rolling load shed of predetermined amounts of load, as required by the situation. The blocks of load included in this scheme are primarily served by the 13kV distribution system.
Network feeders are not included in this listing; consequently, network load is not included in manual load shed.
Similarly, the 11kV subtransmission system that serves the major load centers in downtown Cleveland is excluded from the manual load shed predetermined load groupings. Major customers may be sought out to voluntarily curtail loads in an emergency.
Technology
Using their EMS system, CEI can call for blocks of load to be shed on a rolling basis automatically, based on predetermined load groupings based on circuit priority.
7.6.8.2 - CenterPoint Energy
Operations
Load Shedding
People
If circumstances require manual load shedding, the execution of the load shed is led by the Energy Control Dispatch Center (ECDC).
Process
CenterPoint has prioritized circuits based on criticality. As required by the state of Texas, they have implemented a flagging system to prevent any inappropriate disconnect of critical customers.
Network feeders are not included in manual load shed listings.
Technology
CenterPoint can call for blocks of load to be shed on a rolling basis automatically, based on predetermined load groupings based on circuit priority.
7.6.8.3 - Con Edison - Consolidated Edison
Operations
Load Shedding
People
Con Edison has one main System Operations Control Center, and Regional Control Centers, such as the Manhattan Control Center.
The System Operations Control Center is the main operating authority, responsible for operating the system and for the protection of the workers for the entire Con Edison system. The System Operations Control Center controls and operates Generation, Transmission, and Distribution.
Technology
Con Edison has a scheme to shed load as the frequency drops or if the rate of change in the frequency exceeds a given threshold. The system prioritizes the feeders that it drops. For example, the scheme sheds overhead load first.
Con Edison has installed a network start-up and shutdown panel for picking up multiple feeders at one time in the event of the loss of an entire network. The panel brings the controls for all breakers to two points in the station, because stations are designed to service two networks. The panel is connected to the operator at the System Operations Control Center.
7.6.8.4 - Duke Energy Ohio
Operations
Load Shedding
People
At Duke Energy Ohio, load shedding is the responsibility of the Power Supervisor, within the Operations Center (made up of PS and the Trouble department).
Process
Duke Energy Ohio has established multiple priority levels for feeders to guide power supervisor’s in shedding load in an emergency.
Load shedding is done manually – Duke Energy Ohio is not using the software to automatically roll blocks of load at different time intervals.
Note that network feeders are excluded from manual load shed.
7.6.8.5 - HECO - The Hawaiian Electric Company
Operations
Load Shedding
People
If circumstances require manual load shedding, the execution of the load shed is led by the Dispatch Center.
Process
HECO has pre-prioritized circuits and predetermined load blocks for use in the event of a manual load shed. Circuit priority is based on key customers along a feeder such as hospitals, airports, military installations, etc.
The decision as to which load to shed will be made by the Load Dispatcher based on these priorities, and other factors such as the time of day.
Network feeders are not included in this listing; consequently, network load is not included in manual load shed.
HECO will also call on large customers to assist with load curtailments. Some of these customers receive discounted rates in exchange for the ability to shed their load in an emergency.
Technology
HECO sheds load manually, using predetermined blocks of load that consider circuit priority. They are not using software that automatically sheds load on a rolling basis.
7.6.8.6 - National Grid
Operations
Load Shedding
People
At National Grid, load shedding is the responsibility of the Regional Control Center.
National Grid has a written procedure that describes plans for shedding and restoring the network load. This document provides operating guidelines for a network load shed and restoration. The guideline includes network primary cable ratings, network secondary cable ratings, detailed descriptions of required operator action in contingency situations, detailed descriptions of the potential results of an various primary feeder contingencies on the network during peak conditions, and procedures the operator must follow in the event that the shedding of network load is ordered.
Process
Network feeders are excluded from National Grid’s normal manual load shed plans. National Grid has developed a separate plan to be able to shed the network load and pick it up. This involves opening the bank breakers at the two substations that supply the networks within Albany.
National Grid performs an annual tabletop drill focused specifically on the network. In addition, every five years it does a larger, more complex drill.
Technology
National Grid does not have a network group feeder switch that simultaneously opens or closes network feeder breakers. Rather, their procedure requires the opening of substation bank breakers in order to drop network feeder load simultaneously, followed by the opening of the individual breakers, then followed by the closing of the bank breakers to restore any radial (non-network) circuits. The procedure also describes switching to restore network load.
7.6.8.7 - PG&E
Operations
Load Shedding
People
At PG&E, load shedding is the responsibility of Distribution Operations.
Process
Network load is included in manual load shedding plans.
7.6.8.8 - SCL - Seattle City Light
Operations
Load Shedding
People
If circumstances require manual load shedding, the execution of the load shed is led by the System Operator.
Process
During high load conditions, the System Operator polls the network using the DigitalGrid (Hazeltine) system four or five times a day to understand field loading and voltage conditions.
SCL System Operators maintain a list of customers that are fed by each network feeder so that they can contact customers to curtail load during critical periods.
SCL’s procedures for responding to network emergencies are not formally documented. SCL does not perform regular drills to practice restoration procedures to the network. Note: SCL does document and drill restoration procedures for outages to the non-network parts of their system. These drills normally exclude outages to network facilities.
Technology
SCL has installed a system developed by DigitalGrid, Inc. (formerly Hazeltine, and referred to by SCL employees as “the Hazeltine System”) to monitor their network equipment. This system uses power line carrier (PLC) technology for communication. (Communication signals are sent through existing utility power cables) SCL has been using this system for years, and has some degree of remote monitoring in all network vaults.
Operations Practices — Vault / Network Fires
SCL’s current design standard calls for fire protection heat sensors and temperature sensors in their vaults. The heat sensors are designed to open all the network protectors in the vault when the heat sensor registers 225°F. The temperature sensors send an alarm to the dispatcher at 40°C. (SCL utilizes temperature sensors in about 20% of their network transformer locations. They are actively adding locations, with a goal of 100% coverage.)
SCL does not have a written procedure for responding to a vault fire. Although their operators do have the authority to drop load in an emergency, they do not have a protocol to guide them as to whether or when they should drop load in response to a fire.
Note that because of the “sub-network” design, with each secondary network completely separated from the other, a complete network outage due to a fire would be limited to the customers served by that one sub-network, with the other networks unaffected.
7.6.9 - Network Protector Fuse Test
7.6.9.1 - Duke Energy Florida
Operations
Network Protector Fuse Test
People
Maintenance of network protectors are performed by craft workers, Network Specialists and Electrician Apprentices, within the Network Group, part of the Construction and Maintenance Organization. The Network Group is led by a supervisor, and consists of ten craft workers, five Electric Apprentices and five Network Specialists (the journey worker position).
Process
Before network protectors are returned to service they are checked for back feed current on all connections in and out of the network protector using a one-amp fuse.
7.6.9.2 - Duke Energy Ohio
Operations
Network Protector Fuse Test
People
When a network feeder is out of service, Duke Energy Ohio will perform a network protector fuse test to identify any potential faults or grounds on a primary feeder before re-energizing the feeder at the station breaker. The test will confirm that all transformers on a feeder have been switched from the ground position to closed position.
The network protector fuse test is performed by Network Service persons.
Process
Duke Energy Ohio is using a network protector fuse test to identify a fault or ground on the primary system before closing the feeder breaker.
They will identify a vault location housing a network protector where it is safe to work. They will remove the network protector fuse and replace it with a smaller fuse, normally a 500 amp fuse. They will then manually close the protector, thus energizing the primary through the network protector and transformer. If there is a fault or ground on the primary, this test will pop the smaller fuse.

Figure 1:
Network Protector – With small fuse links
Duke Energy Ohio performs this test to save the wear and tear on the substation breaker that would be caused by closing into a fault. The fuse test was developed at a time when test instrumentation was difficult to use and not portable.
7.6.9.3 - Georgia Power
Operations
Network Protector Fuse Test
See Network Protector Maintenance
People
The Georgia Power Network Underground group has two full-time Test Technicians responsible for Network Protector Testing and Maintenance who report to the Network UG Reliability Manager of the Network Operations and Reliability Group.
Process
When they are putting a network protector back in service, Georgia Power does not perform any sort of a “fuse test” in the protector, such as placing a low amperage fuse in the protector so that if there is a problem, the fuse will open. They don’t like the idea of exposing a worker to that condition. Their process is to close the network protector remotely - if there is a problem on the system, the worker would be out of the hole. Note that they are examining other options for safely closing protectors such as a device (by EDM) that uses timing to check for proper phasing.
7.6.10 - Operations Practices - Clearances
7.6.10.1 - AEP - Ohio
Operations
Operational Practices - Clearances
People
The Distribution Dispatching Center is responsible for operating the distribution systems, including granting clearances for Network Mechanics to perform work activities on a feeder. The Dispatch Center coordinates closely with the Network Mechanics who report out of the Network Service Center to operate the network system. The Dispatcher is responsible for operating feeder breakers at the substation, but has given Network Mechanics authority to operate feeder devices beyond the station, such as opening the HV switches on the network units to clear a feeder.
Process
Work crews, in cooperation with the Dispatcher, are authorized to clear feeders and open network protector switches and primary transformer switches. Worker clearances are established by establishing perimeter (bracket) grounds at the nearest three transformers to the work site.
Because AEP Ohio’s new standard for the network unit includes the use of a separate (from the transformer tank) wall-mounted primary switch, such as an Elastimold MVI, workers can often obtain a clearance to work in a particular location without having to de-energize and clear the entire feeder.
In these cases, the worker notifies the dispatcher and can remotely operate the switch, which is a load break device, from outside the hole. If the protector does not open automatically, the worker can remotely open the protector from outside the hole as well. The worker can then test and ground the primary feeder feeding into the transformer and proceed with the work. Grounding is done with a grounding feedthrough tied to ground. Note that for 480-V NPs, workers have the ability to create a visible break between the protector and the secondary bus by operating disconnects mounted on top of the protector. Separating the secondary avoids the potential for arc flash from inadvertent contact with the secondary system.
AEP employees cite the ability to de-energize the primary supplying any one network vault as a key benefit of the use of the separately-mounted switch. Specifically, it avoids the process of obtaining and clearing an entire feeder, which requires advance notice to the dispatcher and entails a visit to every network unit location to verify as open and ground, and it enables them to maintain N-2.
In many cases, existing infrastructure is designed with the network unit primary switch integrated into the transformer. In these cases, after assuring that the protectors are open, the Network Mechanic will place the transformer switch in the ground position.
AEP Ohio works with two primary switch configurations: wall-mounted Elastimold (see Figures 1 through 4) and transformer-based switches. Wall-mounted switches can be remotely closed. In some cases, Network Mechanics install 200-A elbow grounds on the back of the 600-A termination, with elbows bolted to the ground ring at the bottom of the vault. Transformer-mounted switches are put into the ground position after making certain the protector is in the open position (either manually or automatically). If the crew is working with an MVI or SF6 switch, they check the protector, pull the caps off the back of the transformer, perform a test to determine that it is de-energized, and then put the grounding in place.

Figure 1:
Wall-mounted Elastimold MVI switch – network vault

Figure 2:
Wall-mounted Elastimold MVI switch – note grounding bar

Figure 3:
Wall-mounted Elastimold MVI switch – network vault

Figure 4:
Disconnects on top of protector
7.6.10.2 - Ameren Missouri
Operations
Operation Practices - Clearances
People
At Ameren Missouri, the steps for clearing a network feeder involve the dispatchers within the System Dispatch Center and Traveling Operators, part of Reliability Support Services.
The Traveling Operator position is responsible for performing switching within the network vaults (including operating both the primary disconnect switch on the network unit and the network protector), at the substation for network feeders, and for operating customer switchgear. In addition, Traveling Operators may perform overhead work using an Extendo stick. (Traveling Operators do not use bucket trucks).
Organizationally, Traveling Operators work in the Distribution Operating group, part of the Reliability Support Services group and work closely with the Service Test group, also part of Reliability Support Services. They provide 24 x 7 coverage. The Distribution Operating group has a support engineer assigned to provide support to the Traveling Operators.
Ameren Missouri has a 20 week intensive training program for Traveling Operators to become qualified.
Process
Ameren Missouri’s clearance process involves the preparation of a switching order, called Workman’s Protection Assurance (WPA), by the dispatchers within the SDC. Dispatchers have prepared pre-defined orders for both normal and emergency switching in the network. These predefined orders serve as templates and provide a starting point for the dispatcher to prepare specific switching orders per request.
The SDC uses a triple check process when preparing a switching order (WPA).
-
Step one is writing the order, performed by the SDC dispatcher.
-
Step two is that someone else within the dispatch center checks the switching order.
-
Step three is a check by the dispatcher who issues the order to the Traveling Operator to perform the switching. Note that this may be a different dispatcher than the one who wrote the order.
The traveling operator who receives the order is, of course, a fourth check of the accuracy of the order.
The individual steps associated with the orders for network clearances are not delivered one at a time from dispatcher to traveling operator. Rather, all of the switching orders to clear a network feeder or feeder section are turned over to the traveling operators for execution. As traveling operators move from hole to hole, they don’t communicate routinely with the dispatcher in every hole. Rather, they will contact the dispatcher at various points during the switching to notify the dispatcher of their progress.
Traveling operators will perform the various tasks associated with clearing a feeder, including racking out the feeder breaker, racking in a test breaker if required (for fault location, for example), testing for potential using phase sticks, operating transformer primary switch handles within each network, operating network protectors if required for the clearance, and placing required clearance tags.

Figure 1:
Transformer Primary Switch Handle

Figure 2:
Transformer Primary Switch Handle – note phase positions

Figure 3:
Test Breaker
As the traveling operators perform switching, they place appropriate clearance tags, such as Holdoff tags and Grounding tags. At the station they use a Racking Holdoff tag, which enables the breaker to be racked into the test position, but not back onto the bus. They also use information tags (Blue tags) to notify others of pertinent information.
Note that entering a network vault to perform switching is a two person job at Ameren Missouri, with one person in the hole, while the other is up top (above the hole).
When a traveling operator finds a problem within a vault, they will document the problem on a Network / Radial Vault Entrance and Condition form. Substation problems are reported on a Substation Maintenance Request form.
If a cleared feeder has been separated for some reason (for example, because cable splices have been installed to repair a failed cable section), the traveling operators will check the feeder phasing before restoring the feeder to service.
They do this by going to a transformer location and moving the switch handle into the ground position. Back at the substation, an operator will hook up a home developed annunciator device called a rabbit cage. This device uses a DC supply and has indicator lights which illuminate when the cable legs are grounded. So, when the transformer switch is in the ground position - all of the lights on the rabbit cage will be illuminated.
Ameren Missouri transformers have phase positions on their transformer switch handles (part of their transformer specification). To check phasing, the traveling operator will begin with the transformer switch in the ground position and assure that all of the lights on the rabbit cage are illuminated by checking in with the operator at the substation. The traveling operator will then move the switch handle to each phase position and check with the attendant at the substation to assure the appropriate light for that phase on the rabbit cage goes out. In the first position, the C light should go out, then the B light, and finally the A light, indicating that the phasing at the transformer matches the phasing at the station.
Ameren Missouri performs this test twice before confirming phases. They will perform this phasing test before restoring a feeder even if only one cable was spliced, just to be sure there weren’t inadvertent other changes made to the system.
Note that sometimes, traveling operators will “give phases”. For example, a cable splicer may want to determine the appropriate phases to mark the cable phases before completing a splice. In this case, traveling operators at the station will ground a phase at the station, and the cable splicer will apply a set of test lights similar to the rabbit cage in the vault to assure that they illuminate on grounds.
Note that if a transformer and protector are replaced, the Dist Service Testers will assure phasing on the secondary side.
Technology
Traveling operators utilize mobile data terminals in their trucks to access the mapping system.
Traveling operators will don a 40 Cal arc suit, which is a lab coat style with shin covers to perform certain activities such as testing for potential using phase sticks.

Figure 4:
40 Cal Arc Flash Suit

Figure 5:
Testing for potential with phase sticks
When using the test breaker, traveling operators will test for potential using phase sticks to assure that there is no back feed from hung up protectors.
Traveling operators utilize a home developed annunciator device called a “rabbit cage” to check the feeder phasing before restoring a feeder to service.

Figure 6:
Connecting the Rabbit cage to the Test breaker

Figure 7:
The Rabbit Cage – used to test for phasing

Figure 8:
The Rabbit cage connected to the test breaker
7.6.10.3 - CEI - The Illuminating Company
Operations
Operation Practices - Clearances
People
The DSO’s within the RDO are responsible for issuing clearances, subject to FirstEnergy’s Clearance Procedure Manual of Operations. The Manual defines procedures and responsibilities associated with requesting and obtaining clearance.
FirstEnergy has produced an “Excerpts from the Manual of Operations” booklet that serves as a useful reference and training guide.
The RDO has produced a “Network Switching Guidelines” document which describes procedures for clearing the primary feeders that provide the secondary network. This document includes pre-written switching steps to “clear” the network system in the event of a fault, to establish an issue clearances for the network primary feeders, and to establish and operating condition for the network feeders once a fault location has been identified, allowing the Person in Charge to perform agreed to work on the system. See Attachment T
Further, the RDO has created pre-written switching instructions for every vault in the 11 kV non-network system serving the main load centers in downtown Cleveland.
When UG crew leaders request an outage of a network feeder, they submit a clearance request to the RDO. This process, as well as the required timeframes for initiating the request, is defined in the FirstEnergy Corp Manual of Operations.
CEI uses Outage Coordinators, who are responsible for reviewing this request and preparing and coordinating the necessary clearances on an advance basis. Ultimately, the DSO orders the required switching and tagging for the clearance. Network clearance steps are pre-written in the Network Switching Guidelines.
Process
CEI requires a “visible break” as part of their clearance procedure. For example, when clearing a network feeder, the feeder will be opened and the breaker racked out and tagged, and all network protectors will be placed in manual open, and tagged. CEI will also operate the disconnect switch on the network transformer primary, moving it to the open position. The transformer switch is not tagged because it is in the clearance zone created by the clearance tag at the protector.
An exception to the visible break requirement is the 5 kV oil switch (not used in the network feeders) which does not provide the visible break.
Technology
Procedures are documented in E Net system. Manual copies of procedures are made available to those that require them.
7.6.10.4 - CenterPoint Energy
Operations
Operation Practices - Clearances
People
Distribution dispatching is housed within the CenterPoint Energy Control Dispatch Center (ECDC). This facility also houses the Regional Transmission Operator (RTO) desk.
The RTO will issue orders to open and tag feeder breakers at the substation. This switching is executed by Substation Operators.
Distribution Dispatchers focus on the switching of the distribution system beyond the substation breaker. Distribution Dispatchers are assigned responsibility for certain territory by service center. CenterPoint has twelve Service Centers, and assigns one or two dispatchers per service center. A normal day shift will employ a minimum of 14 dispatchers.
The Distribution Dispatch Center provides switching orders for all devices beyond the substation breaker. Note that while the Dispatcher will prepare switching orders and issue clearances for major underground feeders, the execution of the switching on the feeders is led by Major Underground resources.
In Major Underground, all crew members are eligible to perform switching. In performing switching, Major Underground will assign one person on the crew (usually the head journeyman) to interface with the Dispatcher to complete switching. This person will assign the various switching tasks to other members of the crew – but he will service as the point person to interface with the dispatcher. CenterPoint decided to conduct switching in the Major Underground this way because of difficulties communicating from dispatching to resources in each of the manholes, the fact that in obtaining an UG clearance, the devices do not have to be opened in a particular sequence, and most of the feeders supplying the networks don’t have any tie points.
Process
When UG Crew Leaders request an outage of a network feeder, they submit a clearance request to the ECDC. Note that for the “dedicated” circuits in Major Underground, the Distribution Dispatcher prepares switching orders to clear the circuits from pre-written templates maintained by the GIS group with Major Underground. This pre- written order indicates what locations and devices the switchman must visit to execute the switching. In preparing the job specific switching order, the dispatcher updates the pre-written template with what specific work must be accomplished at each location. For example “open”, “close”, “verify”, etc. The Dispatcher will review the switching order against the mapping system to verify its accuracy.
The Distribution dispatcher coordinates with the RTO to open and tag the feeder breaker. After obtaining a hold order from the RTO, indicating that the circuit has been opened with a visible break and tagged, the Distribution Dispatcher will coordinate with the head journeyman on the Major Underground crew who will act as a liaison between the Dispatcher and the field crews who will perform the switching. The crew will verify the feeder breaker as open and ground the circuit.
Then the switching will be performed to isolate other potential sources (ex: open and tag the network protectors). Note that all of this switching is performed and controlled by the head journeyman of the crew
- not by the Dispatcher. The Dispatcher will record the Start time on a running switching order; however, the dispatcher does NOT read each line of the order to the switchman as they do in overhead. The crew members will report back to the head of the crew when the switching is complete.
After he has received confirmation from his crew members that the work is complete, the head journeyman of the crew completes the order to the dispatcher who verifies the circuit as dead by checking the circuit loading.
CenterPoint requires a “visible break” as part of their clearance procedure. All vaults must have a place to create a visible disconnect, either a blade that is open that a crew member can see, or an elbow that is parked. Before a CenterPoint crew will “check for dead” and ground, there must be a visible disconnect to every point feeding that cable.
Technology
Procedures are documented on line. Manual copies of procedures are made available to those that require them.
7.6.10.5 - Con Edison - Consolidated Edison
Operations
Operation Practices - Clearances
People
Operations Control Centers
Con Edison has one main System Operations Control Center, and Regional Control Centers, such as the Manhattan Control Center.
The System Operations Control Center is the main operating authority, responsible for operating the system and for the protection of the workers for the entire Con Edison system. The System Operations Control Center controls and operates Generation, Transmission, and Distribution.
Employees called District Operators (DO’s) report to the System Operations Control Center. District Operators work in shifts (several DO’s per shift), and provide 24-hour a day, 7 days a week, 52 weeks a year coverage. District Operators have exclusive operating authority and control of all distribution feeders, including circuit breakers within the substation, and all equipment and cable runs up to and including the points of termination in the field. District Operator operating authority includes issuance of approval for status change, application of protection, and issuance of work permits and test permits on distribution feeders. (Distribution feeders include all network feeders and all non-network “cable” feeders including aerial cable, and some open wire on 33 kV in Staten Island.)
Con Edison network workers (in the Work Out Centers or in the Field Operating Department [FOD]) don’t place and check their own protection; they rely on the District Operator. Con Edison has a methodical, tightly controlled clearance process, where the District Operator (DO) directs the activities to provide clearance on a feeder. If field personnel encounter a situation that doesn’t match what they expect to find, or if there is any lack of clarity in the clearance steps, the job stops immediately.
The Regional Control Centers interface between the System Operations Control Center and the Work Out Centers to get the work done. Following a strict protocol, after fault location, positive feeder identification and application of protection, the District Operator at the System Operations Control Center delegates the responsibility for work on cable or equipment to the “Feeder Control Representative” in a Regional Control Center. Again, following strict protocols, the Feeder Control Representative “signs on” each work crew at each work location and “signs them off” after they complete or partially complete their assigned work. When all work is completed and all workers are signed off, again following a strict protocol, the Feeder Control Representative reports the work completed and all sign-off’s to the District Operator, who then takes back full control of the distribution feeder, orders it tested, prepared for service, and finally orders it restored (cut in).
Overhead feeders (open wire, bare wire, tree or covered wire, and self-supporting wire) plus underground radial spurs fed from the overhead wire are under the control of the appropriate Regional Control Center. Strict but different protocols are followed for those feeders as well.
Process
When Con Edison takes a feeder out of service to perform maintenance or construction, the utility does not “block and lock” the network protectors on the feeder. That is, they do not manually open the protector breaker or remove the protector fuses. Note that the utility also does not open a primary switch at the transformer, because Con Edison’s transformer specification does not call for a disconnect switch at the transformer primary.
This approach differs from the approach employed at many utilities, where crews visit every network protector, open up the secondary, and remove fusing before working on the de-energized circuit.
Con Edison’s process is to:
-
Open the feeder.
-
Ensure no back-feed from the back-feed indication that they have at the source. (Back-feed indication is a neon indicator at the breaker panel.) If the indicator at the station does reveal back-feed, crews visit the specific network protector or other source to resolve the issue.
-
Ground the feeder at the station.
-
Ground on either end of the work zone (all potential sources).
-
Do the work.
Con Edison believes that this process addresses all potential energy sources. They have never had a problem with this approach.
Why the difference in practice? One reason as that the very size of their system requires lengthy circuits with many transformer and network protector locations on each circuit. This high number of locations, combined with the potential to have to pump water out of the holes, makes it impractical to visit each location, pump it free of water, and block and lock the protectors. And, their current approach provides a completely safe, grounded work environment.
7.6.10.6 - Duke Energy Florida
Operations
Operations Practices – Clearances
People
Clearing a network feeder involves close communication between the dispatchers in the DCC and the Network crews. Network crews take clearances on feeder cables in the field through a process defined by Duke Energy Florida’s Switching and Tagging manual. All who perform switching must be on the company’s switching and tagging list. The DCC maintains the approved list.
Network Specialists are qualified to perform the tasks associated with taking a clearance, and Electrician Apprentices are trained as a part of their on-going OJT. Electrician Apprentices who received the required training and are on the switching and tagging list, can perform switching and hold clearances.
Process
To initiate a clearance of a feeder, a clearance authorization is required. A Network Specialist or Supervisor within the Network Group will prepare a switching request where he will detail the steps to clear the feeder. Alternatively, a Dispatcher may prepare the initial listing of steps based on the clearance required. The switching request is then forwarded to an experienced dispatcher (a second dispatcher in the case where a Dispatcher prepared the initial listing of steps) who will review the steps and assure that they are correct. The reviewed version of the switching request is then sent back to person who created the initial listing. Finally, the switching steps are send back to a Network Specialist in the Network Group – the requester of the clearance - for final approval.
To clear a feeder, after opening the feeder breaker, Network Specialists will visit each vault on the feeder, open all network protectors, and also open the high side switches suppling the transformers in each vault. They will do this at every vault on the feeder or de-energized section of the feeder. Note that Duke Energy Florida does have primary sectionalizing switches installed on their network feeders. Where possible they will operate these switches to isolate the section to be de-energized. In these cases, they will visit every vault on the de-energized portion of the feeder to open the protectors and high side switches. The use of the sectionalizing switches reduces the number of vaults they must visit to clear a feeder section.
The steps associated with taking a clearance on a feeder section including switching to open the feeder on both sides of the work area, certifying the cable section as dead, tagging and grounding.
Switching is performed by crew members with field direction from the Network Specialists. Crew members carry a switch book where all switching orders are written down. The switching orders will identify all of the switching steps including:
-
Who performs the switching
-
What device is operated
-
Where the location of the device to operate is located
-
When will the device will be operated (in operational order)
Each step associated with the switching and tagging is communicated between the dispatcher and person doing the switching using three-way communication. The crew member will record what the dispatcher tells him verbatim in his switch book and then he will read the information back to the dispatcher. After the crew member has read the switching step to the dispatcher, the dispatcher will confirm that it matches what is on his switching order. Only after confirmation, the dispatcher will issue the clearance number and allow the crew member to operate the device. For prearranged switching, the dispatcher and switchman may review a series of switching steps using this process. When the switchman receives authorization, he will then complete the steps. He will not contact the dispatcher at every step unless there is a discrepancy.
To assure the cable section in question is de energized, Network Specialists enter the manholes at each end, check the feeder cable’s duct position, make certain they match on each end, and apply a pulse tone on the cable with an external, battery-operated tone generator on a single phase of the feeder. Once the de-energized feeder is confirmed, a remotely operated hydraulic spike is used to pierce the cable to ground.
All switchers must be on the approved switching and tagging list. Every two years, all Network Specialists and Electrician Apprentices take a switching and tagging procedure training course.
Another standard safety procedure prior to entry into a manhole/vault is to establish a protection “hotline.” The “hotline” is a safety setting in the network protector to cut down the instantaneous trip from the normal setting of 30 cycles down to 6 cycles. The “hotline” clearance is tagged to the crew leader, who designates the person working in the hole as an alternate clearance holder.
Technology
Duke Energy Florida uses an Access Data Base to facilitate the clearance authorization process. Switching requests are entered into this system, and approved.
Before network protectors are returned to service they are checked for back feed current on all connections in and out of the network protector using a one-amp fuse.
7.6.10.7 - Duke Energy Ohio
Operations
Operation Practices - Clearances
People
The steps for obtaining clearance of a network feeder are performed by a combination of the Dana Avenue underground group, and Mobile Operators who are part of the Substation department.
Dana Avenue underground resources are trained to do switching, and are on the Duke Energy Ohio Switching and Tagging list. Switching is performed by either Senior Cable Splicers or Network Service Persons.
For most of the distribution system, the Trouble Department takes care of required switching at night, operating devices and placing tags, so that when the crews arrive in the morning, they can place grounds and begin working immediately. Mobile operators do this switching within the substation.
For the network distribution system, field switching and tagging is performed by the Network Services persons within the Dana Avenue underground.
Process
For a scheduled outage, Dana Avenue Underground personnel will complete an outage request form. The outage request form includes the date and time of the outage, the name of the “tag person”; that is, the person who would be doing the bulk of the work and in whose name clearance tags would be placed. The request also includes a “counter tag person”, generally a supervisor, who is the person to contact in case of a schedule change. Sometimes the request will also include the person who will do the switching (either mobile operators or Dana Avenue switchers). The outage request will also ask for the specific clearance requirements, including requesting grounding to create isolation. (The request may ask for a “Hold”, which is a one sided isolation, where a major customer performing the work would have to provide their own isolation on their end.)
Normally a five day lead time is required for a distribution outage to a network feeder. The outage request is sent to two T&D Operations Coordinators, who are the individuals who write the actual switching orders. Next, the request goes from the Operations Coordinators to the Power Supervisor (PS).
Dana Avenue supervision will monitor requests for scheduled feeder outages that may originate with the Substation group, so that they can take advantage of the outage to perform any pending corrective maintenance or refurbishment.
Emergency clearance requests are normally coordinated through the Trouble Desk and PS.
For work on a network primary feeder, Dana Avenue underground crews will open up the network transformer primary disconnect switches as part of their clearance process. For secondary work, they may not open the transformer primary.
When racking out a network protector breaker, they will take a primary feeder outage. Before racking out the breaker to do the work, they will open up the primary disconnect and put it in the open position.
7.6.10.8 - Energex
Operations
Operation Practices - Clearances
People
Energex has 22 staff members called switching coordinators who operate its central control center on rotating shifts. Switching coordinators are responsible for issuing clearances for distribution system work. The people in the control center rotate their positions on a regular basis, and any operator can monitor and/or control any segment of the Energex power grid, including the CBD underground network.
Switching coordinators are typically drawn from field staff ranks, usually either substation technician or mechanic and rapid response, with training specifically for the control room operation.
Process
Switching coordinators are responsible for issuing clearances on lines. If clearance is needed for a low-voltage line, the LV coordinator on duty in the control center issues the clearance. However, if a clearance of a medium or high voltage portion of the system is required, the clearance is issued by a switching coordinator.
Technology
Energex uses its Distribution Management System (DMS), Power On, to reflect switch position changes in real time. The system is either updated automatically for all telecontrolled or telemetered equipment, and manually by the control room operators for non telemetered or non telecontrolled equipment, so that the DMS reflects the actual real time, switched state.
7.6.10.9 - ESB Networks
Operations
Operation Practices - Clearances
People
Network operations at ESB Networks, including issuance of working clearances on medium voltage distribution lines, are performed by Operations Managers and Customer Service Supervisors, part of the Operations Group. ESB Networks has a Customer Services Supervisor for each of its 35 MV geographic areas. Organizationally, the Operations group, part of Asset Management, is comprised of two Operations Management centers, one North and one South, a System Protection group, an Operations Policy group, and a Systems Support group.
ESB Networks has two central operations centers, North and South, but it is soon moving to a single central control center.
Process
Clearance for any emergent line work must go through the Operation Centre. The clearance process is called “Telemess”, and involves a rigorous formal process for executing the switching and proving the readiness of the system. The process includes the request, proof of disconnect (such as through a technique such as cable spiking) and proof of readiness. The proof of readiness is a separate written document communicated at the conclusion of the switching that articulates the end results of the switching that are relevant to the clearance holder.
Planned outages are formally requested using an online request system. For some requests, particularly at HV, an outage planner will perform a study to assure that the system can manage the outage, that other outages will not affect the planned outage, and to develop the outage load transfer plan which defines the switching stems necessary to provide the outage. For this reason, planned outages and requests for clearances are avoided during peak demand periods.
Operators can remotely open the specified circuit through the SCADA system, or issue orders to field operators to perform the required switching. Note that within the Underground section, ESB Networks has operators who utilize small map boards that replicate the downtown underground network , and reflect the condition of the system manually using push pins (similar to the electronic version used in the control room for the rest of the system) (see Figure 1).

Figure 1:
Map board used by ESB Networks operators to reflect conditions in the underground network
The term Telemess is derived from the use of telephone messaging to issue the clearance to the field worker or operator who will perform the work. (see Figure 2).

Figure 2:
Telemess form used for switching for clearances

Figure 3:
Electronic view of the system
7.6.10.10 - Georgia Power
Operations
Operation Practices - Clearances
People
Engineers in the Network Operations and Reliability Group are responsible for operating and monitoring the network system. This group is led by a manager, and is part of the Network Underground group, a centralized organization for managing all network infrastructure at Georgia Power.
The Operations and Reliability group has seven engineers on staff, responsible for the following:
-
Monitoring the network through the SCADA system.
-
Requesting and confirming de-energized feeders for maintenance or during failures.
-
Re-routing power to alternate feeders and/or networks in case of failures.
-
Serving as first-responders to customer service interruptions.
-
Part of the design phase for new networks or new major customer service.
-
Part of network protector selection (standards).
-
Responsible for the network system SCADA (remote monitoring and control) design and operation.
The Engineers, called Test Engineers, are four-year or two-year associate-degreed engineers. Test Engineers are responsible for network system operation, and work closely with maintenance crews, Test Technicians, Key Account) representatives, and the Distribution regions (Non – network operations) of Georgia Power.
The Georgia Power Network Control Center (part of Network Operations and Reliability) works closely with the Distribution Control Center (non – network) to clear a network feeder. The Network Control Center is responsible for obtaining a clearance for opening any network feeders (during emergencies, maintenance, routine inspection, etc). The Distribution Control Center, responsible for monitoring and controlling the breakers of the dedicated primary feeders that supply the network, issues clearances to the Network Operations and Reliability group.
Process
All requests for clearances for work to be performed on the network must come through the Network Control Center. Note: If the work to be performed is civil in nature, and will not require handling of cable and cable accessories, no clearance is necessary.
The following steps are taken to obtain a feeder clearance (For example to perform transformer maintenance):
- The crew to perform the work confers with the Network Control Center, indicating the feeder that must be de-energized.
- Operations personnel will check the status (through the remote monitoring system) of all network protectors at the locations to be affected to assure that de-energizing the feeder will not drop customers, or to identify those who will be affected.
- Network Operations will then call the Georgia Power Distribution Control Center to open the designated feeder. The DCC will check to confirm that the feeder is clear. Network Operations can also verify that the protectors have opened. The DCC will tag the feeder, and issue a clearance to Network Operations to test for voltage, ground and work on the feeder. Note that a feeder clearance involves opening and grounding the feeder at the station, but not going into every vault and isolating the feeder from the network. Field crews may ground transformers adjacent to a work location to establish temporary working grounding.
- Work can begin when field crews verify that the feeder is de-energized. (See Determining a Feeder is De-Energized ).
Technology
The Network Control Center has online access to remotely control network protectors, and gather information from the protectors, such as voltage, current and status (open or closed). The control center works closely with field crews to identify and confirm feeder information using maps and feeder tags.
7.6.10.11 - HECO - The Hawaiian Electric Company
Operations
Operation Practices - Clearances
People
HECO has a C&M Planning group that is focused on setting up the job packages and scheduling the work to be performed. This group is also responsible for submitting “Holdoffs”, HECO’s term for requesting a feeder clearance.
The C&M Planning group is comprised of 7 people, with one resource focused on the underground.
Switching orders are prepared by Load Dispatchers within the System Operations Dispatch Center.
Switching orders and the placement of tags are executed by the Primary Trouble Men (PTMs).
Process
When UG crews require sectionalizing of a feeder (for a feeder outage, for example) they work through the C&M Planning group to request the switching orders. The C&M planning group prepares and submits a “Holdoff” request to the System Operations Dispatch Center. System Operations requires at least 7 days in advance to write the switching orders.
Switching orders are prepared by Load Dispatchers within the System Operations Dispatch Center. Switching orders and the placement of tags are executed by the Primary Trouble Men (PTMs). Note that the Holdoff Tag can be used to either show that a line is isolated or grounded.

Figure 1:
Holdoff Tag placed on Transformer Primary Switch
HECO’s Underground system is designed to N-1. Most work on the
underground system can be performed safely by switching customers to
alternate feeders / feeder sections, enabling the normal feeder to be
de-energized without disrupting service to customers. However, this
approach often requires significant switching steps to isolate the
section to be de-energized. See “Three Phase Transformer Change outs – Hot Cap Procedure”
as an example. The number of PTM’s available to
perform the switching is often the limiting factor in the amount of
holdoffs that can be requested for any one week.
7.6.10.12 - National Grid
Operations
Operation Practices - Clearances
People
National Grid has a Regional Control Center (RCC) responsible for their Eastern Region in eastern New York. This region is broken into four control areas, by geography with a separate control desk for each area. One control area (Capitol) includes the city of Albany, and thus control of the network. National Grid does not have a dedicated operator focused solely on the network – the operator responsible for the Capitol control area has responsibility for both network and non network infrastructure.
Each control desk within the RCC is manned by a Regional Operator, responsible for both load dispatch and trouble dispatch for that area. Regional Operators provide switching orders to direct switching and tagging, issue clearances, and direct restoration activity. Regional Operators work 12 hour shifts each, and provide 24/7 coverage. The Regional Operator position is a bargaining unit position at National Grid.
If switching is required for a project, the supervisor within the underground organization is responsible for submitting an application, called a transmission outage application (TOA) to the Outage Coordinator within the regional control center. The Outage Coordinator assigns the writing of the switching order to a regional operator.
Substation operators are responsible for performing switching and tagging at the substation, including network feeders.
Network switching is only performed by the underground organization. Switching to clear a network feeder is normally performed at night so that the feeder is cleared before the start of the next workday. The underground supervisor would schedule switching crews to report to work at two or three in the morning to accomplish the switching.
National Grid has a well-defined clearance procedure in their electric operating procedures (EOP).
Process
National Grid’s normal required lead time to submit a TOA is three days prior to needing the feeder cleared. However, for network projects, the underground group often provides extra lead time – up to several weeks in some cases. The supervisor who prepares the TOA request will identify the clearance points to facilitate the writing of the formal switching order by the regional operator.
The RCC operators prepare the switching orders to clear a network feeder. The RCC does not use templates for network switching orders, as they want to assure that the operator is thinking through the process. The switching order includes orders to go into each vault to clear the network protector and transformer primary switch. The Regional Control Center Operator issues switching orders using National Grid’s s formal documented switching process.
In general, substation operators perform all switching in the substation including the placing of tags. Switching on the network system is only performed by the underground crews who are part of New York Underground East.
Note that the regional operator will provide the switch men multiple orders associated with a given vault. For example, if the switching order requires the man to enter a vault and open up two network units, both of these orders will be given at one time to prevent the switchman from having to come out of the hole after switching the first unit to receive orders to switch the second.
National Grid does require a visible open for a clearance point. Network protectors and network transformer disconnect switches are an exception to this rule. When National Grid clears the feeder, underground crews (Maintenance Mechanics) go to each vault to open and lock open all network protectors, and open and lock all transformer primary disconnects.
Technology
National Grid has remote monitoring and control of network feeder breakers at the substation. National Grid does not have remote monitoring and control of the network.
Note: National Grid is planning to pilot a network remote monitoring system as part of their network secondary distribution system strategy.
7.6.10.13 - PG&E
Operations
Operation Practices - Clearances
People
The steps for obtaining clearance of a network feeder may be performed by a combination of the distribution operators, cable crew foremen, cable splicers, cablemen, and substation resources.
Distribution operators will issue clearances of network feeders.
In Oakland, the distribution operators use substation resources to open breakers or confirm them as open and place grounds. A cable crew foreman will observe this and accept the clearance by reporting the placement of the grounds to the distribution operator. (Note that in Oakland, a journeyman cable splicer is normally upgraded to a cable crew foreman in order to obtain the clearance.)
In San Francisco, the cable crew foreman, part of the M&C electric network group, will both place the grounds and accept the clearance.
Additional steps for clearance depend on the work to be performed. Cable splicers or cablemen may be utilized to perform additional sectionalizing as required.
Process
In Oakland, network feeder clearances are scheduled for the daytime, and may last for a week, as the Oakland networks are lightly loaded. In San Francisco, network feeder clearances are scheduled for the night time, and are normally returned to service by the next morning. This avoids traffic issues, and takes advantage of the lower loading at night.
For a scheduled outage, a project coordinator who works within the M & C Electric Network group will request a feeder clearance from the distribution operator using an electronic clearance request form. This form describes which feeder is to be cleared, and the time. Normally a seven day lead time is required for distribution outage to a network feeder. The distribution operator will write the actual switching order. The dispatcher does have pre-planned switching orders prepared for common clearances. Switching orders are sent back to the requestor for conformation.
PG&E attempts to complete all switching before the crews arrive for work. Network circuits are normally opened by the distribution operator via SCADA. The distribution operator will confirm that all network protectors have opened through the remote monitoring system before giving orders to place grounds.
In Oakland, the distribution operators use substation resources to open breakers or confirm them as open and place grounds. A cable crew foreman will observe this, and accept the clearance by reporting the placement of the grounds to the distribution operator. In San Francisco, the cable crew foreman, part of the M&C electric network group, will both place the grounds and accept the clearance.
Additional steps for clearance depend on the work to be performed. Cablemen or cable splicers may be utilized to perform additional sectionalizing as required.
For cable work, the only ground placed is at the substation, other than personal grounds placed around the work location.
For network protector testing, a cable splicer wearing a 100 cal suit, will confirm that the protector is open, rack it out, pull the fuses, and open the associated transformer primary switch. Note that the distribution operator is notified when the transformer primary switch handle is operated.
For transformer oil sampling, the cable splicer checks the network protector to confirm it is open. Note, they do not set the network protector to the open position. They will move the transformer primary switch lever to open. Where the transformer primary switch is a wall mounted vacuum switch, they will open the switch, and park the elbows on standoff brackets.
PG&E has experienced network protectors “hanging up” when a circuit is de-energized. In some cases this may be a result of light loading conditions. In others, this may be due to voltage imbalance between feeders supplying a given spot network. In yet other cases this may be due to improper relay settings. At the time of the EPRI immersion, PG&E was researching this issue to identify and address the causes and to develop consistent procedures for addressing hung up protectors.
Technology
PG&E has embarked upon a five year project to replace the existing network remote monitoring system with a modern system that provides increased monitoring and control (See Remote Monitoring). This system will include remote operating capabilities for the network protectors will include remote open/close of switches and station transfer trip.
7.6.10.14 - Portland General Electric
Operations
Operation Practices - Clearances
People
The System Control Center (SCC) is responsible for operation of the network and grants clearances for crews working on a feeder.
The load dispatcher works closely with the network crew foreman to accomplish switching on the network. Substation operators perform switching at the substation, while the CORE underground crews perform switching out on the network.
Process
Planned outages on the network follow a structured process.
The Network Engineering Department creates a shut-down order document, which lists the steps necessary to take the network feeder out of service and grants clearance to field crews to work on the feeder. The shutdown order is forwarded to the load dispatcher for verification and completion. PGE utilizes templates that guide the creation of the switching steps associated with a shut-down order. Load Dispatch receives a three-day lead time for planned shutdowns.
Dispatchers communicate with crews to carry out the switching in the field.
To clear a feeder, dispatchers use the following steps:
- Call the general foreman to ensure that no one is working on the feeder to be opened or in any of the feeder vaults or manholes.
- Open the feeder breaker via SCADA.
- Wait for the network protectors to open and verify that they have opened by checking the remote monitoring system. Note that the CORE group is responsible for checking the remote monitoring system to confirm that all the network protectors have opened. Load Dispatch performs a secondary verification when crews and substation wiremen call to request rack-out and tagging of the substation breaker.
- A dedicated wireman at the substation racks out the breaker and tags it with a danger tag. Once this action is complete, the wireman reports to the dispatcher that the wireman has opened, racked out, and tagged the breaker for the crew.
- The dispatcher calls the crew and gives it permission to open and danger tag all the associated vaults on the shutdown order. The shutdown order lists all the vaults, and the dispatcher gives one order specifying to open and tag all the associated vaults.
- Field crews visit each network work protector (already opened on backfeed), move the NP handle to the open position, and tag it so that it cannot close in any way.
- The crew opens the primary switch on the transformer and tags it.
- Everything is now open and tagged as specified in the order.
- The crew notifies the dispatcher that all switches have been opened and tagged.
- The load dispatcher gives the crew clearance to install grounds and proceed with its work.
Feeders are typically grounded only at the substation, and PGE’s common practice is not to set up a tighter zone of grounding.
The SCC relies on the CORE group to isolate faults and provide them with recommendations about what switches need to be opened. SCC still authorizes the switching but works closely with the crew to ensure that it understands exactly what process and order to follow.
Power Restoration: To restore power, there is a simultaneous close capability that closes all four network feeder breakers at the same time. The SCADA operates this remotely. The SCC calls the general foreman before closing any breaker to ensure that crews are not currently working in any of the vaults on that feeder. The foreman confirms with the crews whether it is safe to close.
Technology
PGE migrated to an Oracle NMS outage management system, which is based on WebSphere technology [1]. Oracle NMS is a scalable distribution management system that manages data and supports switch planning and management.
- D. Handova, “PGE: Driving Customer Value With Network Management Systems.” EnergyCentral.com. http://www.energycentral.com/c/iu/pge-driving-customer-value-network-management-systems (accessed November 28, 2017).
7.6.10.15 - SCL - Seattle City Light
Operations
Operation Practices - Clearances
People
Operations Documentation
Clearance procedures are well documented in the Seattle City Light System Operations Clearance, Keep Open, and Hold Open Procedures. Employees who are qualified to perform switching and tagging and give and receive clearances must be familiar with these procedures, and pass a test to demonstrate their proficiency.
Process
Operations Practices – Clearances
When network crew leaders request an outage of a network feeder, they submit a clearance request to the dispatchers. This process is defined in the System Operations Clearance, Keep Open, and Hold Open Procedures Document.
SCL has a position called Outage Coordinator, who is responsible for reviewing this request and preparing and coordinating the necessary clearances, keep opens, and equipment outages on an advance basis. Ultimately, the System Operator (dispatcher) orders the required switching and tagging for the clearance, keep open, or hold open.
SCL requires a “visible break” as part of their clearance procedure. They contend that this requirement – being able to observe the visible break on the transformer primary switch through the site window, and also pulling the fuses when opening the network protector – has contributed to their strong safety record.
Network clearances are site specific. The clearance must describe both the location and the specific piece of equipment that a crew is working on.
7.6.10.16 - Survey Results
Survey Results
Operations
Clearances
Survey Questions taken from 2018 survey results - safety survey
Question 26 : Please indicate which of the following activities are part of your network feeder clearance procedures.


Question 27 : When the feeder has been cleared, in what position have you left the network transformer primary switch?


Question 28 : Are there any differences in your network feeder clearance procedures for a routine clearance (such as for adding a new transformer) and an emergency clearance (such as for a cable failure)?


7.6.11 - Organization - Operation Center
7.6.11.1 - AEP - Ohio
Operations
Organization - Operation Center
People
AEP Ohio performs all operations activities associated with its network infrastructure from its Grandview Network Service Center in Columbus. The center is comprised of Network Mechanics and Network Crew Supervisors, who perform all field activities associated with the network. Note that some network crews do report to a center in Canton to be physically closer to the Canton infrastructure, but organizationally report to the Network Service Center.
The Center is also responsible for field activities associated with ducted manhole systems (network and non-network), substation exit cables, and looped UG distribution systems. In addition, the center houses trouble-men, who work 24 x 7 and respond to OH and UG issues, and a transformer repair shop.
The Service Center works closely with the Distribution Dispatch Center, which is responsible for all distribution operations, including operations of network systems. Distribution Operators (dispatchers) are responsible for operating the entire distribution system, both network and non-network. There is not a dedicated network operations group.
Process
AEP Ohio has a remote monitoring system installed in its network infrastructure. The data monitored can vary depending on the level of monitoring in each vault, but includes protector status information, transformer data, and vault sensor information such as thermal event monitoring. Note that at the time of the practices immersion, the Dispatch Center did not yet have the ability to monitor network protectors.
The Dispatch Center coordinates closely with the Network Mechanics who report out of the Network Service Center to operate the network system. The Dispatcher is responsible for operating feeder breakers at the substation, but will typically grant Network Mechanics authority to operate feeder devices beyond the station, such as opening the HV switches on the network units to clear a feeder, for example.
Technology
AEP Ohio has a SCADA system installed in is network that enables partial remote monitoring and control of network devices through NP relays and using the Eaton VaultGard system. AEP is in the process of implementing a new communications and control system in the network that will expand its remote control capability in the network. This fiber-based system will expand the monitoring and control capability of vault devices such as protectors and switches. AEP is also installing a network master trip and close system, which will enable a group feeder pick up, and the ability to selectively enable or disable any of the feeders that are part of the group.
7.6.11.2 - Ameren Missouri
Operations
Organization - Operation Center
People
Ameren Missouri’s operations center is referred to as the System Dispatch Center (SDC).
At any one time, the SDC has six dispatchers on duty, with two dispatchers having responsibility for the downtown area including the network. Dispatchers are rotated through each desk within the SDC so that each is experienced with each control area.
Dispatchers are a management position at Ameren Missouri.
Ameren Missouri has two positions that work closely with the SDC - Troublemen, and Traveling Operators. Troublemen serve as first responders and work primarily with the overhead and URD systems. Traveling Operators work with the network system and substations, including troubleshooting the network, and performing switching within network vaults and substations when required. The Traveling Operator is classification called by the dispatcher when a network feeder locks out. The Traveling Operators work as part of Reliability Support Services group and work closely with the Service Test group, also part of Reliability Support Services.
Process
Ameren Missouri’s clearance process, called Workman’s Protection Assurance (WPA), involves the preparation of a switching order by the dispatchers within the SDC. Dispatchers have prepared pre-defined orders for both normal and emergency switching in the network. These predefined orders serve as templates and provide a starting point for the dispatcher to prepare specific switching orders per request.
The SDC uses a triple check process when preparing a switching order (WPA).
-
Step one is writing the order, performed by the SDC dispatcher.
-
Step two is that someone else within the dispatch center checks the switching order.
-
Step three is a check by the dispatcher who issues the order to the Traveling Operator to perform the switching. Note that this may be a different dispatcher than the one who wrote the order.
The Traveling Operator who receives the order is, of course, a fourth check of the accuracy of the order.
The individual steps associated with the orders for network clearances are not delivered one at a time. Rather, all of the switching orders to clear a network feeder or feeder section are turned over to the Traveling Operators for execution.
Technology
Ameren Missouri’s network feeders are portrayed on the large display board within the SDC. Ameren Missouri uses a ring bus design at the substation, with only two network feeders fed from any given bus section.
The Ameren Missouri dispatch center does have a group pickup switch for network feeders, enabling Ameren Missouri dispatchers to either open or close an entire network from that switch.
Ameren Missouri’s SCADA system is an Open Automations Systems (OAD) product, and was developed with Price Waterhouse.
Ameren Missouri has remote monitoring of its network vaults. Using the ETI electronic relay in network protectors as part of its remote monitoring system, they monitor various points including voltage by phase, amps by phase, protector status, transformer oil top temp and water level in the vault. The monitoring points are aggregated at a box mounted on the vault wall that communicates via wireless. Information from this system is available to the dispatcher.
From the remote monitoring system, the Service Test supervisor, as well as a predetermined group of other recipients, receives a computer system generated Email that indicates when a network protector has opened. So, when a feeder locks out for example, the supervisor would immediately be notified by the system through emails indicating that the protectors on the feeder have opened. In addition, the department supervisor receives a report each morning that indicates which feeders were out the night before, and those that exceed preset load levels.
At the time of the practices immersion Ameren Missouri was considering the implementation of a Distribution Management System, and was looking to include reactance to fault technology to aid in fault location.
7.6.11.3 - CEI - The Illuminating Company
Operations
Organization - Operation Center
People
The CEI underground system is operated out of the Northern Ohio Regional Dispatch Office (RDO). This office is responsible for the operating the entire Illuminating Company system, including the network.
The RDO is staffed with 36 employees, including a manager, 27 Distribution System Operators (DSO’s), 2 Outage Coordinators, 1 Engineer, a computer system expert, and other support staff.
The DSO position is a non bargaining position. Most DSO’s have an electrical background in distribution and were hired “from the outside”. A formal degree is not required. CEI will give preference to candidates with military experience when hiring DSO’s, as military training provides structure and discipline – two characteristics sought after by CEI in DSO’s. DSO’s can advance to a senior level by gaining experience and demonstrating proficiency in certain tasks required for advancement. DSO’s will periodically be assigned to accompany Underground crews in the field to gain experience.
Process
The RDO runs seven operations “desks”, 24-7, with the system broken up by geography. That is, each desk controls a different geographic area. In assigning DSO’s to the desks, CEI will mix senior people with newer people to provide training. They assure that at least two senior DSO’s are working on the floor at any one time. Their goal is for all the DSO’s to eventually progress to the senior level.
CEI does not run a distinct network desk; rather, the DSO (s) assigned to the desk whose geographic responsibility includes the area of Cleveland served by the network operates the network. CEI has had minimal problems with the network.
The RDO has a full backup center, with redundant systems. CEI does periodically practice the transfer of control from the primary center to the backup center.
Technology
CEI is utilizing a SCADA system, with limited monitoring and control of facilities beyond the substation breaker for distribution feeders.
CEI utilizes an outage management system (Power ON) to facilitate outage determination and restoration.
The RDO is documenting operating processes and procedures in a system called E Net. They have one individual who is assigned the responsibility of maintaining and updating this system.
7.6.11.4 - CenterPoint Energy
Operations
Organization - Operation Center
People
Distribution dispatching is housed within the CenterPoint Energy Control Dispatch Center (ECDC). This facility also houses the Regional Transmission Operator (RTO) desk.
Distribution Dispatchers focus primarily on switching and troubleshooting of the distribution system beyond the substation breaker. Distribution Dispatchers are assigned responsibility for certain territory by service center. CenterPoint has twelve Service Centers, and assigns one or two dispatchers per service center. A normal day shift will employ a minimum of 14 dispatchers.
The RTO focuses primarily on the transmission network, but is also responsible for operation of distribution breakers at the substation. For example, the RTO would dispatch a Substation Operator to open a major underground dedicated distribution feeder breaker at the substation.
At CenterPoint, Distribution Dispatchers are represented by a collective bargaining agreement (Union). A Distribution Dispatcher can become a journeyman after three years of training (formal and OJT) and testing. Distribution Dispatcher candidates must pass a highly selective test to enter the program. Only 10-15% of candidates who take the test qualify for entry into the program. Apprentice dispatchers are assigned a mentor to guide them through the program.
Process
To obtain clearance to work on a feeder, Major Underground will submit a Switching Order request to the Distribution Dispatch Center at least 24 hours in advance of the needed switching.
The Distribution Dispatch Center provides switching orders for all devices beyond the substation breaker. Note that for the dedicated[1] circuits in Major Underground, the Distribution Dispatcher prepares switching orders to clear the circuits from pre-written templates maintained by the GIS group with Major Underground.
The Distribution dispatcher coordinates with the RTO to open and tag the feeder breaker. The RTO is responsible for providing switching orders to operate distribution feeder breakers at the substations.
For circuit lock-out switching:
The RTO will issue a hold order, indicating that the circuit has been opened with a visible break and tagged. RTO will communicate with Distribution Dispatcher. Distribution Dispatcher will issue a switching order to the head journeyman on the UG crew to field switch all locations on the locked out circuit. Switching will be performed to isolate all potential back feed sources (For example: Network Protector Maintenance). After switching is complete, the UG crew will verify the circuit is de-energized and ground the circuit. The UG crew will now take a clearance to work on the circuit.
Note that the field switching sequence is performed and controlled by the head journeyman on the crew–not by the dispatcher. The dispatcher does NOT read each line of the order to the switchman as they do in the overhead.
For planned switching:
Distribution Dispatching will issue a switching order to the UG crew to clear-up all locations on the circuit. Switching will be performed to isolate all potential back feed sources (for example: Network Protector Maintenance).
After the UG crew completes their switching, they will communicate with Distribution Dispatching to drop out and clear up the circuit. The Distribution Dispatcher coordinates with RTO to open and tag the feeder breaker. Once the feeder breaker is cleared up and tagged, UG will receive an order to check for de-energized and ground the circuit. The UG crew will now take a clearance to work on the circuit.
Note that the field switching sequence is performed and controlled by the head journeyman on the crew–not by the dispatcher. The dispatcher does NOT read each line of the order to the switchman as they do in the overhead.
Technology
CenterPoint utilizes a “home grown” outage management system. This system has a prediction engine that creates cases for each suspected trouble location. It is tied to SCADA, in that Breaker trips and lockouts are displayed in the OMS. It is further linked to CenterPoint ’s “graphical switching” system, described more fully below. Note that the OMS is not linked to the GIS system, because the development of the outage management system predates the GIS system.
CenterPoint’s graphical switching system, developed by CES (now Oracle), is tied in with both their outage management system and GIS system to display up-to-date maps on the wall. This system updates the digital maps as switching is performed. For example, during an outage restoration, as circuits are sectionalized, these changes are recorded in the Outage Management system, and the Graphical switching system displays an up to date map of the distribution system.
However, the “dedicated” underground system, including network secondary systems, is not displayed in the graphical switching system. This is in part because the foundation for this system is the GIS system (ESRI) and at the time the graphical switching system was installed, the GIS system had not yet been up dated with the dedicated underground facilities.
CenterPoint’s GIS system is ESRI. The GIS has been updated to include dedicated underground facilities, and CenterPoint intends to implement graphical switching for this distribution. CenterPoint has not fully implemented GIS for underground because the congestion inherent in underground systems and the looped nature of network systems makes both the display and the electrical connectivity of the GIS model complex.
CenterPoint is using mobile data units in its troubleshooter vehicles. These units enable no lights cases to be “dumped” to a mobile data unit located in the truck, rather than dispatching the troubleshooter by radio. CenterPoint has equipped its relay section trucks with mobile data units. However, trouble is normally dispatched to the major underground group by radio (voice).
In storms, major underground resources and trucks may support the service centers. In storm situations, the mobile data terminals are used, with “no lights” cases sent to the mobile units.
CenterPoint does have a backup dispatch center, and periodically checks to see that backup functionality is working.
[1] The term “dedicated” underground at CenterPoint refers to three phase infrastructure is located entirely underground in their ducted manhole system. A dedicated network feeder does not mean that the feeder serves only a network. Rather, it refers to a feeder that is entirely underground. In fact, at CenterPoint, feeders that supply the underground network also supply radial load along the way.
7.6.11.5 - Con Edison - Consolidated Edison
Operations
Organization - Operation Center
People
Operations Control Centers
Con Edison has one main System Operations Control Center, and Regional Control Centers, such as the Manhattan Control Center.
The System Operations Control Center is the main operating authority, responsible for operating the system and for the protection of the workers for the entire Con Edison system. The System Operations Control Center controls and operates Generation, Transmission, and Distribution.
Employees called District Operators (DO’s) report to the System Operations Control Center. District Operators work in shifts (several DO’s per shift), and provide 24-hour a day, 7 days a week, 52 weeks a year coverage. District Operators have exclusive operating authority and control of all distribution feeders, including circuit breakers within the substation, and all equipment and cable runs up to and including the points of termination in the field. District Operator operating authority includes issuance of approval for status change, application of protection, and issuance of work permits and test permits on distribution feeders. (Distribution feeders include all network feeders and all non-network “cable” feeders including aerial cable, and some open wire on 33 kV in Staten Island.)
Con Edison network workers (in the Work Out Centers or in the Field Operating Department [FOD]) don’t place and check their own protection; they rely on the District Operator. Con Edison has a methodical, tightly controlled clearance process, where the District Operator (DO) directs the activities to provide clearance on a feeder. If field personnel encounter a situation that doesn’t match what they expect to find, or if there is any lack of clarity in the clearance steps, the job stops immediately.
The Regional Control Centers interface between the System Operations Control Center and the Work Out Centers to get the work done. Following a strict protocol, after fault location, positive feeder identification and application of protection, the District Operator at the System Operations Control Center delegates the responsibility for work on cable or equipment to the “Feeder Control Representative” in a Regional Control Center. Again, following strict protocols, the Feeder Control Representative “signs on” each work crew at each work location and “signs them off” after they complete or partially complete their assigned work. When all work is completed and all workers are signed off, again following a strict protocol, the Feeder Control Representative reports the work completed and all sign-off’s to the District Operator, who then takes back full control of the distribution feeder, orders it tested, prepared for service, and finally orders it restored (cut in).
Overhead feeders (open wire, bare wire, tree or covered wire, and self-supporting wire) plus underground radial spurs fed from the overhead wire are under the control of the appropriate Regional Control Center. Strict but different protocols are followed for those feeders as well.
Process
Morning Call
Con Edison conducts a “morning call” in each region, and in their System Operations group. The morning call is a telephone conference call where important operating issues are discussed. The morning call typically takes about ten minutes to complete. The call includes a discussion of:
-
first contingencies; that is, situations where a piece of equipment is out of service and the system is operating in an N-1 condition,
-
activities and outages scheduled on primary feeders
-
secondary activity anticipated for the day
-
outages/incidents experienced on the systems
-
work reporting; that is, a review of the work scheduled for the day
-
shunts and bridges; that is, places where temporary cables are installed, usually above ground, bypassing a section of the distribution system
-
street light work scheduled for the day
-
environmental issues
-
feeder issues
The handout used during the call consists of:
-
Display of the Feeder Board, listing the primary feeders that are out of service
-
Display of the Critical Transmission and Substations Equipment Outage Status
-
Table of the current feeder outages, indication of the reason for the outages, anticipated duration, work to be performed, other pertinent comments, etc.
-
HIPOT Summary (high potential feeder test summary), listing feeders that were tested the previous day
-
Banks dropped
-
Customer Service – Distribution Equipment report, indicating the defective banks off the system, both customer and company owned
-
Lists of other systems statuses, such as Banks Made Auto, Banks on Outage, Open Mains Received, Open Mains Tied Permanent
-
Customer Outages
-
Shunts and Bridges Summary Report
-
Customer Outages
-
Outstanding Job Summary by Responsibility
-
Age Distribution Summary by Responsibility, showing the number of projects of different types, sorted by how long the job has taken (the age of the job)
-
Daily Open Mains summary Report
-
Summary of Primary C and D Faults
-
Daily Incident Report, highlighting safety incidents
Outages
Con Edison’s System Operations Control Center has control of primary feeders. If a feeder trips, it is the responsibility of this control center to clear the feeder. More specifically, the System Operations Control Center is responsible for tasks such as troubleshooting the feeder, applying grounds, performing testing, and using Con Edison’s Reactance to Fault (RTF) system to predict the location of the fault. See Reactance to Fault Application - RTF.
Because of Con Edison’s network design and N-2 contingency planning, most faults that result in feeder lockouts (“Open Autos,” in Con Edison lexicon) do not result in customer outages. For reports that do come in from customers, a ticket is created by the Con Edison Call Center in their outage management system with a customer address. The linkage between the customer’s account and the electrical location is not automatic. The Distribution Operator adds a structure number to the outage ticket, indicating the location on the electrical system. When this assignment is complete, information about these outage tickets can be displayed on the map. Con Edison is working on automating the process for assigning a structure number to a customer address.
When the fault is located and the feeder is scheduled for work, the System Operations Control Center hands the feeder over to the Manhattan (or other regional) Control Center to accomplish the work.
When work is done, the Manhattan Control Center gives control of the feeder back to the System Operations Control Center. System Operations verifies that the feeder is ready to be re-energized by test, and then puts the feeder back in service.
Con Edison Operators can view the status of feeders on their “Feeder Board,” available through their Heads Up Display (HUD). One feature of this display is that if two feeders are out of service, the feeder board highlights common holes — that is, vaults or manholes that contain both out-of-service feeders.
Con Edison carefully manages the time of the outage of a feeder. Feeder restoration time during hot periods at Con Edison has been significantly reduced, from about 36 hours to around 13 hours on average. The utility’s target is to have feeders out of service for no more than 14.7 hours during high temperatures. (14.7 hours was arrived at by targeting reductions in the various components that comprise outage duration.). Note that this target applies to both unplanned feeder outages (Open autos) and planned outages.
Distribution System Operation Under Contingency Conditions
Con Edison has a specification that provides guidance for actions to be taken and activities to be pursued by the Electric Operations, System Operation, and Substation Operations when unusual operating conditions such as multiple contingencies above the design criteria and/or elevated system loading arise on the distribution system.
The document includes guidelines for emergency cooling of network transformers, outlining different methods for cooling, and describing in what circumstances to use each method.
The document includes sections that describe actions that should be taken in the event of first and second contingencies for networks of different voltages and substations, including things such as information that should be gathered, people to be notified, and factors to consider.
For example, in a first contingency condition on a 13 kV network, where a network feeder opens automatically, some of the actions that should be taken include:
-
Examine the Reactance-to-Fault (RTF) Application (where available), and determine the type of fault (i.e., single-phase, double-phase, or three-phase) and a calculated fault location.
-
Examine relay targets, and determine the type of fault (i.e., single-phase, three-phase, or instantaneous with ground or time delay with ground).
-
Process the feeder, and identify the component that failed (i.e., cable, splice, transformer, or transformer termination. Also, if it is a single-phase or three-phase cable or splice).
-
Correlate the identified failure with the RTF application and the feeder relay targets. If they do not correlate, consider performing a modified Hi-pot after repairs are completed.
-
Complete repairs, remove feeder grounds, and apply Ammeter Clear Test and modified Hi-pot test.
-
Monitor system conditions for possible overloaded equipment (from Con Edison’s Remote Monitoring system).
-
Identify and investigate open network protectors.
-
Replace network protector blown fuses reported by RMS.
-
Review RMS data (Visual WOLF) and exception data to identify potentially overloaded feeder sections and transformers.
-
Review “next worse” contingency scenario in anticipation of an additional feeder out of service.
-
Etc. (This is only a partial listing of actions)
The document also provides guidance for operators in making the decision to initiate and execute a network shutdown if necessary.
Technology
Heads Up Display (HUD)
Con Edison has much information available to operators through their Heads Up Display tool (HUD). HUD is a map-based graphics tool that displays the real-time status of primary and secondary network components. This tool provides users with an integrated, layered approach to viewing real-time information about most components of the distribution system. The system provides visual alerts to notify users of existing or potential problems or events. The system integrates data from multiple sources (SCADA, RMS, etc.) to reflect the real-time status of each network across the Con Edison distribution system.
Remote Monitoring System (RMS) / Distribution SCADA
Con Edison uses a Remote Monitoring System (RMS) in every one of its network transformer vaults to remotely monitor and communicate information back to the office. The system uses power line carrier (PLC) technology to communicate monitored information from transmitters located in each vault, over the 60-cycle electric signal, to receivers located at the substation.
The RMS in use at Con Edison was originally designed at Con Edison’s request in the 1970s, by Hazeltine, with installation of devices beginning in 1982. The RMS system is made up of transmitters located in each of the transformer vaults, pick-up coils on every feeder at the substation that detect the PLC signal, and receivers at the substation that gather the information detected for a given network. From the substation, information is communicated back to the central office using telephone frame relay lines (TCPIC lines), that provide near-virtual connectivity, enabling Con Edison to download information from every receiver about every one minute.
At the substations, Con Edison is using receivers developed by Digital Grid. The utility has experienced good performance from these receivers. Con Edison is currently testing a receiver developed by ETI and is in the process of replacing older Hazeltine receivers with these newer units.
At network transformer vault locations, Con Edison uses transmitters from ETI and Digital Grid. Many existing installations are equipped with older transmitters from Hazeltine and BAE. The transmitter is connected to one phase of the network protector. The power connection is to network side of the network protector (always powered), and the signal wire connection is to the transformer side, so that if a network protector opens on light load, there is still a signal. In area substations that supply two networks, the transmitters on each network are connected to and transmit information over different phases.
As Con Edison has been using RMS for years, it has different “generations” of systems in place. In the first-generation installations, the RMS system monitors the three-phase % percent loading, and five status points such as network protector status or transformer temperature alarm status. In the second-generation installations, the RMS monitors three-phase % loading, three-phase voltage, eight status points, and two analog readings. In the latest generation installations, the transmitters have additional processing capability and can monitor things such as transformer tank pressure, oil temperature, and oil level status. The utility is also monitoring the Oil Minder System in those vaults that contain them.
Con Edison is effectively using its intranet to give employees access to this remotely monitored data. The utility has developed an on-line system, Net RMS, which enables all employees to view the information from their computers, including field laptops. The system is tied in with SCADA, so it displays which feeders are open and closed. The system also displays the % offload that will be picked up by the nearby vaults if a given feeder locks out, a useful tool in contingency planning.
Con Edison is planning to expand functionality of its RMS to be able to communicate with the network protector relay, and to gather additional information such as network protector temperature.
The Distribution SCADA department is made up of 10 engineers, who are responsible for all the Distribution SCADA beyond the area substation.
Picking up Multiple Feeders in the Event of a Network Outage
Con Edison has installed a network start-up and shutdown panel for picking up multiple feeders at one time in the event of the loss of an entire network. The panel brings the controls for all breakers to two points in the station, because stations are designed to service two networks. The panel is connected to the operator at the System Operations Control Center.
Con Edison has a scheme to shed load as the frequency drops or if the rate of change in the frequency exceeds a given threshold. The system prioritizes the feeders that it drops. For example, the scheme sheds overhead load first.
7.6.11.6 - Duke Energy Florida
Operations
Organization - Operation Center
People
Duke Energy has a centralized Distribution Control Center (DCC) which provides operational control for the distribution system throughout Duke Energy Florida, including network infrastructure in Clearwater and St. Petersburg. The group is led by a General Manager. Previous to the formation of a centralized DCC, Duke Energy Florida had operated with smaller operations centers scattered throughout the state, and would operate decentralized during the day, and centralized at night. With the formation of the new center, they operate centrally at all times.
Within the DCC, approximately 30 dispatchers work rotating shifts to provide 24x7 staffing. The dispatchers are assigned to operations desks, called pods, and are assigned specific areas geographic regions of responsibility such as the North Coastal region, or the South Coastal region. Duke Energy Florida has 18 operating regions, and each pod serves two of these areas.
On each shift there is usually one dispatcher who has network experience. Duke Energy Florida feels that this staffing level adequate to support the network, as network design is self-healing, experiences few outages, and because of the expertise of the Network engineers and underground resources. The DCC collaborates closely with the Network Group on network issues. If major network system problems arise, network experts from the Network Group or engineering are called in to supplement the Operations Center staffing.
The dispatcher is a bargaining unit position at Duke Energy Florida. Candidates for a dispatcher position must have journeyman line worker experience or operator experience, with the senior qualified applicant receiving the position. Dispatchers, having knowledge of line work, have good rapport with the field force.
Within the DCC, Duke Energy Florida does not distinguish between “load” dispatching and “service” dispatch – dispatchers are responsible for all aspects of dispatch within their geographic area of responsibility. Part of their rationale for this approach was to aid in scheduling.
The DCC has a full back up center (in the process of being rebuilt at the time of the immersion).
Duke Energy Florida also has a Grid Management function, co-located with the DCC, which provides engineering and other technical support to the DCC. Both the DCC and the grid management group fall organizationally under the same director.
Process
In dealing with network operations issues, the DCC works closely with the Network Group. For example, for network switching, the dispatcher will prepare switching orders and send to the network group to perform a peer review of the switching steps, an important failsafe according to Duke Energy Florida.
Online geographical GIS maps, SCADA screens, and system schematic views to enable dispatchers to perform a number of tasks including load management, switching, outage management, and workforce management. Dispatchers can operate network switches and monitor open/closed feeders from the Operations Center. One important Dispatch job is performing system modelling during outages: when an outage occurs, Dispatchers can use the online modelling program to perform load analysis when rerouting feeders. Whenever a feeder is out, the system automatically tags it as open and reports the information to the field crews via mobile data terminals or on a laptop.
While Duke Energy Florida has remote monitoring of its network vaults, this information is being monitored by the Network Group, not the dispatcher. (See Network Monitoring)
Technology
The DCC is an impressive, state-of-the-art operations center that has consolidated monitoring, dispatch, and operations for all of Duke Energy Florida in one command center. The center is equipped with modern technology, such as excellent and varied monitors, wall mounted displays, and desks that raise and lower so that people can stand.
Within the DCC, a master list of the available trucks and their locations are online. Dispatchers can track truck locations in real-time via an online GPS-enabled mapping program. Outage information is also displayed.
SCADA, GIS, and schematic views of the network are online for Dispatchers.
7.6.11.7 - Duke Energy Ohio
Operations
Organization - Operation Center
People
Duke Energy Ohio has an Operations Center that is comprised of a Power Supervisor (PS), and a Trouble Desk Supervisor.
The Power Supervisor deals with all operations issues within the substation and on network feeders. System alarms are forwarded directly to the Power Supervisor. The power supervisor issue switching orders and grants working clearances.
The Trouble Desk Supervisor, as the name implies, deals with trouble on the system such as outages and is involved in mobilizing crews to respond. This person deals with Dana Avenue crews on a daily basis.
Duke Energy Ohio does not have a dedicated Power Supervisor or Trouble Desk representative focused solely on the network.
Process
For a scheduled outage, Dana Avenue Underground personnel will complete an outage request form. Normally a five day lead time is required for a distribution outage to a network feeder. The outage request is sent to two T&D Operations Coordinators, part of the Operations Center, who write the actual switching orders. Next, the request goes to the Power Supervisor (PS), who will issue the switching orders.
Emergency clearance requests are normally coordinated through both the Trouble Desk and PS.
Technology
Duke Energy Ohio is using a system called DEETS for scheduling and managing planned outages.
Duke is using an Outage Management system (DOMS, by Oracle) to manage unplanned outages. This is a GIS based system , although the network system beyond the network substations is not modeled in the system.
At the time of this immersion, Duke Energy Ohio was in the process of installing a communication backbone for remote monitoring in their network system (see Remote Monitoring / SCADA).
7.6.11.8 - Energex
Operations
Organization - Operation Center
People
Energex has 22 staff members called switching coordinators who operate its central control center on rotating shifts. The people in the control center rotate their positions on a regular basis, and any operator can monitor and/or control any segment of the Energex power grid, including the CBD underground network. Switching coordinators are typically drawn from field staff ranks, usually either substation technician or mechanic and rapid response, with training specifically for the control room operation.
Process
Energex has a control room that monitors its entire electric power infrastructure, which is primarily radial in nature. The entire network is broken up into 10 to 12 control zones, with switching coordinators manning and monitoring each zone. Two to three staff generally share a number of control zones which includes the CBD underground network. (see Figure 1). These staff monitor all alarms and SCADA systems on the CBD. All CBD substations have alarms that are connected to the control room either through hard-wired connections or through a wide area network (WAN). The switching operators in the control room assigned to CBD issue switching instructions, issue clearances, assign tags, and also work with Central Dispatch to dispatch crews to unplanned events affecting the CBD network (tripped circuits, faults, flooding, etc.). [See the Remote Monitoring section in this report.]

Figure 1:
Portion of Energex control room
The switching coordinators in conjunction with shift managers in the control room decide what needs to be done in any given situation they have monitored. This includes what human resources to dispatch to a scene after hours.
(See the Rapid Response)
Technology
Energex has a remote monitoring system in place throughout its grid using both hard-wired RTUs and SCADA systems over a WAN.
(See the Remote Monitoring section in this report.)
7.6.11.9 - ESB Networks
Operations
Organization - Operation Center
People
The transmission system, 400kV, 220kV and 110kV outside of Dublin is operated by the TSO – Eirgrid. Within Dublin, the 110 kV system is controlled by the Distribution System Operator (DSO) at ESB Networks.
ESB Networks also controls also controls the 38kV transmission system, as well as the medium voltage (10, 20 kV) and Low voltage (230, 200V) distribution systems.
Network operations at ESB Networks, including supervision and training of operations personnel, is performed by Operations Managers within the Operations group, part of Asset Management.
Organizationally, the Operations group is comprised of two Operations Management centers, one North and one South, a System Protection group, an Operations Policy group, and a Systems Support group.
The operations group includes a demand manager for forecasting network load demands in both regions, and ESB Networks has a MV manager, called a Customer Services Supervisor, for each of its 35 MV geographic areas. The central control of these areas is the responsibility of the centralized operations centers. ESB Networks has two central operations centers, North and South, but it is soon moving to a single central control center.
Network operator training includes the following:
-
A seven-day classroom training course that concludes with a written test. The test includes many critical questions, especially concerning safety procedures. If candidates do not get these questions right, they must retake the test.
-
There are also practical assessments for operations personnel that cover a variety of on-the-job tasks in the areas of:
-
Overhead line work
-
Cable work
-
HV stations
-
Metering
-
Commissioning of new equipment.
-
MV system management is the responsibility of a customer services supervisor (CSS) trained in MV operations. These personnel assume the responsibility of their assigned MV systems, and give permission for work to take place on the MV system. Once permission is granted, work is coordinated between the field operator and the CSS. The CSS personnel are also the managers and controllers of the LV network.
Process
The “Bible” for ESB Networks networks operators is its internally-developed “Safety Rules” book. This document was prepared and is continually updated by the Operations Policy group.
Every Network Technician (NT) has a signed copy of the “Safety Rules” book, certifying that they have received it and read it. The book aids operations managers in the following way:
-
Sets out how work should be organized
-
Sets out how to communicate with the control room operator
-
Sets out the different roles personnel have when operating on the system
In a typical operations scenario, a customer may call in that an outage has occurred. The CSS MV operator can trace the outage through its online outage management system (OMS), which has a real-time representation of the system through its SCADA field controls. The MV stations have SCADA reporting in to the operations center, mainly over fiber optic cable.
OMS provides extremely detailed views of the network and can point to a particular LV outlet coming out of any monitored MV station. There are typically four LV outlets out of each MV station. These MV circuits are available to the operator in a schematic view.
Once the outage is traced, the CSS can arrange for maintenance through its Dispatch Centre, which is also housed in the operations center. The Dispatch Centre calls out to the appropriate Network Technicians. After hours (holidays and nights), operators use the OMS to dispatch stand-by NTs to investigate outages.
Technology
ESB Networks has deployed SCADA at most (98%) of their 38:10kV substations. At the time of the immersion, they were piloting the use of remotely monitored and controlled devices at a medium voltage station (10KV : LV), in Dublin. ESB Networks utilizes the ABB Network Manager 3 (NM3) SCADA system.
Within SCADA controlled substations, ESB Networks is utilizing a backup communications device, called CELLO. CELLO, installed as a business continuity measure, enables communications in the event of a communications failure of SCADA. If an RTU is lost, the CELLO system will send a text message via the cellular network to the operations Center, who will them dispatch someone to the station.
ESB Networks is using an OMS system, (Oracle Utilities OMS V1.7.10), which is linked to their SCADA system. In addition, the SCADA is linked to their Asset Register System (ARS), which records breaker operations.
Each control area has its own OMS computer and system. These systems are maintained by IT staff who are solely dedicated to the ESB Networks network system, not part of a traditional corporate IT organization. Any employee can log in and see the network state through OMS. Mobile phone applications are also available for personnel in the field to access OMS information.
Outside the city of Dublin, ESB Networks has remotely monitored and controlled devices, and is actively involved in a system wide deployment of smart grid technology on their distribution. The deployment involves the implementation of recloser auto loop schemes, with automated reclosers placed at MV feeder cubicles, with remote monitoring and control of these devices from the Operations Centre. The driver if the deployment is to improve reliability performance as measured by customer minutes lost (CML) and customer interruptions (CI). (Note that ESB Networks is subject to potential penalties associated with reliability, such as an 8 Euro penalty for each hour that customers are out of service, and a 10 Euro penalty for every interrupted customer).
7.6.11.10 - Georgia Power
Operations
Organization - Operation Center
People
Georgia Power maintains a Network Control Center (also referred to as the SCADA Room) for operating its urban network infrastructure across the state. This center, located at the Network Underground headquarters in Atlanta, is distinct from the distribution control center(s) used to manage the remainder (non–network) of the Georgia Power distribution infrastructure. Test Engineers in the Network Operations and Reliability Group are responsible for operating and monitoring the network system, including new installation commissioning, establishment of SCADA connectivity, and the ongoing operations, monitoring and control of each network vault.
The Network Operations and Reliability group is part of the Network Underground group at Georgia Power, a centralized organization responsible for all design, construction, maintenance and operation of the network infrastructure for the company.
The Network Operations and Reliability group has seven Test Engineers on staff, responsible for the following:
-
Leadership of the Network Control Center
-
Monitoring and controlling the network through the SCADA system.
-
Requesting and confirming de-energized feeders for maintenance or during failures (feeder clearances).
-
Re-routing power to alternate feeders and/or networks in case of failures.
-
First-responders to customer service interruptions.
-
Can be part of the design phase for new networks or new major customer service.
-
Part of network protector selection (standards).
-
Responsible for SCADA network design and operation.
The Test Engineers are four-year or two-year associate-degreed engineers. The Test Engineer position is a non-bargaining, non-exempt position.
The group works closely with field Maintenance crews and Test Technicians, also part of Network Operations and Reliability.
Process
The Network Control Center monitors every Georgia Power network underground network protector location, including voltage, current, temperature, protector position (open / closed) and fluid levels from both the vault and the protector. In some locations, the center can monitor custom data points that are installed for fans or doors open/closed, for example. In addition, Georgia Power has installed AMI metering at customer sites. Monitoring of the Georgia Power underground network system has been in place since 1990.
The Network Control Center uses a combination of dedicated radio (Southern Link, a company owned radio network) and cell frequencies, with fiber (often at collector points aggregating information from multiple vaults) to connect to SCADA systems in every vault. The Control Center monitors voltage and current from protector equipment in each vault, at the bus level at substations, and can monitor bigger customers in every spot network location from CTs in network protectors there. The SCADA system cycles data every five to 10 seconds.
The Georgia Power Network Control Center only monitors and responds to alarms within the underground network system and its dedicated SCADA equipment. Non – network distribution infrastructure is operated by a separate Distribution Control center. However, the Distribution Control Center is responsible for monitoring and controlling network feeders. So the opening or closing of a network feeder breaker is performed by the Distribution Control Center, in coordination with the network Control Center. The Network Control Center is not staffed at all times, but only when needed by the Test Engineers. The Distribution Control Center is always staffed, with a specific operator responsible for the network feeders.
The Network Control Center personnel open and close protectors remotely on a regular basis, mainly as a part of the routine five-year Network Protector Maintenance program. Operators can lock protectors open remotely.
If the Network Control Center seeks to clear a network feeder, a Test Engineer must obtain a clearance from the Distribution Control Center (See Operations – Clearance) The Network Center Control personnel can monitor whether a feeder is still hot once the breaker is open (a network protector hang up, for example). In addition to having remote monitoring of protector voltage, current, and position, each network feeder has potential lights at the station which illuminate on back feed. Georgia Power Control Center personnel find that monitoring cable potential is critical for operating a network infrastructure. ) The Network Center Control personnel can monitor whether a feeder is still hot once the breaker is open (a network protector hang up, for example). In addition to having remote monitoring of protector voltage, current, and position, each network feeder has potential lights at the station which illuminate on back feed. Georgia Power Control Center personnel find that monitoring cable potential is critical for operating a network infrastructure.
In most situations, the Network Control Center can determine whether a network protector is hung up in about five minutes, although the group is moving to a faster communication system. Crews can also go to that location and ping it for a faster response.
The Operations and Reliability group also has piloted an automatic fault finding system at a few locations. This system uses reporting faulted circuit indicators in conjunction with Schweitzer electronic relay information to pinpoint where a fault may have occurred.
The Operations and Reliability group runs routine disaster drills. It uses a Network Contingency Plan book that details procedures for when a network goes out, etc. The Contingency Plan breaks down every step to assigned roles within the department. The plan is also useful in determining steps for finding out how much load there is on a network segment, if a segment needs more capacity, if the group should tie to another network, etc.
Technology
Access to the Network Control Center is by a locked door for use by authorized personnel only, and operators must securely log into the Control Center console(s) once inside. The Control Center is currently tied to its SCADA devices through licensed radio, cellular, DSL-type connections, and fiber optic cable.
From the Control Center map Operations Personnel can guide field crews to particular locations, which the crews can access online as well. The Operations Control Center can also call up a detailed circuit map online (See Figure 1 through Figure 4).
At the time of the immersion, Georgia Power was investigation options to remotely monitor network transformer information.

Figure 1:
Network Operations Center wall map

Figure 2:
Network Operations Center wall map

Figure 3:
Network Operations console

Figure 4:
Network Operations console
7.6.11.11 - HECO - The Hawaiian Electric Company
Operations
Organization - Operation Center
People
The HECO Dispatch Center is comprised of two dispatch desks, and one supervisory desk.
The dispatch desks in include the “Load dispatch” desk and the “Trouble dispatch” desk.
Both desks are manned by one person, in a 24-7, three shift operation. Both Load dispatchers and trouble dispatcher are union jobs at HECO.
HECO does not have a distinct desk or dispatcher position for monitoring and operating its network infrastructure.
The supervisory desk is manned by a Supervisor Load Dispatcher (SLD), in a 24-7, two shift operation (12 hour shifts). The SLD is a non bargaining position.
Process
The Load Dispatcher is responsible for operating the system, writing and issuing switching orders, and making sectionalizing decisions.
The Load Dispatcher does not have real time access to cable loading information out on the feeders/ feeder sections, as HECO’s application of SCADA is limited to the substation. For each circuit, the dispatcher has access to spot readings that are taken for each feeder annually - one reading is obtained during the day, one at night, one in the summer, and one in the winter. Before switching, the dispatchers will review these published spot readings to understand the typical loading of a feeder or feeder section, and compare that with knowledge of actual loadings obtained from either SCADA (at the station) or spot readings. HECO dispatchers acknowledged that one of their challenges is that the load steadily “creeps” up over time so that the published loadings may not match actual loadings.
The Trouble Dispatcher responds to outages and dispatches Primary Trouble Men. HECO has an Outage Management system that includes a representation of their distribution system, and knows which customers are served by what transformers. During the day, customer no lights calls are received by a HECO call center. At night, these calls are taken and processed by a contracted call center. Calls do not come directly to the dispatcher, other than situations that cannot be addressed by the call centers.
The Dispatch Center participates in annual Outage Drills / tests of the HECO Incident Command Structure. HECO is in the process of updating their written Blackstart procedure. HECO drills typically do not model the loss of the network, and they do not have a written procedure that outlines what to do if the network is lost.
Technology
HECO is utilizing a SCADA system with limited monitoring and control of facilities beyond the substation breaker for distribution feeders. Most 12kV feeders do have SCADA monitoring and control at the breaker.
HECO’s wallboard depicts 46kV circuits down to the 12kV breaker. From that point on, HECO is using their OMS system to display distribution circuits, with the exception of network circuits, which are not mapped within OMS. They are presently working with a vendor to combine the OMS circuit displays with the wallboard application. This will enable them to tag the wall board through OMS and on EMS through SCADA. HECO is planning to model network circuits in OMS in the future.
HECO is not using remote monitoring in the network, with the exception of some water alarms in certain network vaults.
HECO utilizes an outage management system (Siemens) to facilitate outage determination and restoration. Their system resides on a circuit model that is built from their GIS system. HECO is in the process of implementing a new customer information system that will tie into OMS.
7.6.11.12 - National Grid
Operations
Organization - Operation Center
People
National Grid has a Regional Control Center (RCC) responsible for their Eastern Region in eastern New York. This region is broken into four control areas, by geography with a separate control desk for each area. One control area (Capitol) includes the city of Albany, and thus control of the network. National Grid does not have a dedicated operator focused solely on the network – the operator responsible for the Capitol control area has responsibility for both network and non network infrastructure within the area.
Each control desk within the RCC is manned by a Regional Operator, responsible for both load dispatch and trouble dispatch for that area. Regional Operators provide switching orders to direct switching and tagging, issue clearances, and direct restoration activity. Regional Operators work 12 hour shifts each, and provide 24/7 coverage. The Regional Operator position is a bargaining unit position at National Grid.
Regional operator positions are normally filled from within. It is sometimes a challenge to fill open positions, as the job involves shift work. New Regional Operators receive intensive formal and on-the-job training for the first nine months they are in the position. Formal training is delivered three days a week, with much of it delivered by on-site trainers. Training on network systems and operations is included in the formal program.
Process
The RCC operators prepare the switching orders to clear a network feeder. The RCC does not use templates for network switching orders, as they want to assure that the operator is thinking through the process. The switching order includes orders to go into each vault to clear the network protector and transformer primary switch. The Regional Control Center Operator issues switching orders using National Grid’s formal documented switching process. Network switching procedures are detailed in an appendix to Electric Operating Procedure G014, Clearance and Control.
In general, substation operators perform all switching in the substation including the placing of tags. Switching on the network system is typically performed by the underground crews who are part of New York Underground East. Switching to clear feeder is typically performed at night. Underground crews will be scheduled to come in at night to complete a switching to clear a feeder before the start of the next workday.
Note that the regional operator will provide the switchmen multiple orders associated with a given vault. For example, if the switching order requires the man to enter a vault and open up two network units, both of these orders will be given at one time to prevent the switchman from having to come out of the hole after switching the first unit to receive orders to switch the second.
Technology
National Grid uses GE Small World as their GIS tool, and Power On as their outage management tool.
The Regional Control Center has remote monitoring and control of all network feeder breakers. National Grid does not have remote monitoring and control of any network equipment beyond the feeder breaker. The only exception to this is Henry St. Station in Glens Falls, one of two stations feeding a small network in the city of Glens Falls.
7.6.11.13 - PG&E
Operations
Organization - Operation Center
People
PG&E has multiple operations centers. At the time of the EPRI practices immersion, PG&E was in the process of consolidating their operations centers into one center.
These operations centers include distribution operators who provide switching orders to direct switching, tagging, and issue clearances, and switchmen who perform field switching.
PG&E also uses Cablemen, part of the Restoration Group, who trouble shoot the underground distribution system and perform restoration activities. The cablemen work rotating shifts and provide 24/7 coverage. Restoration activities are directed by the distribution operators.
PG&E does not have a dedicated distribution operator focused solely on the network.
Process
PG&E conducts a daily outage conference call, involving people from multiple departments to review outage incidents that occurred the previous day.
For a scheduled outage, a project coordinator who works within the M & C Electric Network group will request a feeder clearance from the distribution operator using an electronic clearance request form. This form describes which feeder and the time. Normally a seven-day lead time is required for a scheduled distribution outage to a network feeder. The distribution operator will write the actual switching order.
Technology
PG&E has an existing remote monitoring system installed in their underground network system. They have embarked upon a five-year project to replace the existing network remote monitoring system with a modern system that provides increased monitoring and control. (See Remote Monitoring).
7.6.11.14 - Portland General Electric
Operations
Organization - Operation Center
People
System Control Center (SCC): The SCC is usually referred to as Load Dispatch, and operators are known as load dispatchers, who are managed by the Transmission and Distribution (T&D) Dispatch Manager. The SCC has two distribution control regions, and Dispatchers are assigned geographically. From Monday to Friday, two dispatchers cover each of the two PGE regions.
One of the regions and therefore one of the dispatch desks includes downtown Portland and the CORE network. Dispatchers rotate between the two desks so that all dispatchers gain experience working with the network. The SCC employs eight dispatchers total who rotate between the desks on 12-hour shifts. Dispatchers are salaried employees (non-bargaining).
PGE employs load dispatchers from a range of backgrounds. Some are electrical engineers, some are ex-lineman, and others are SCADA technicians or truck drivers. This approach provides a diverse range of experience. PGE lacks a formal training program for load dispatchers. Training is primarily on the job. The load dispatcher position is not considered entry level, so PGE prefers to hire people with prior experience and qualifications.
Load dispatchers perform switching according to checked and verified plans drawn up by engineers. Dispatchers then communicate with crews to carry out the switching in the field.
Distribution/Network Engineers: Three Distribution Engineers cover the underground network and are responsible for supporting the maintenance and operation of the network, including working with dispatchers on operational issues and determining maintenance approaches for network equipment. The Distribution Engineers are not based in the Portland Service Center (PSC) or CORE group. The Eastern District Central Supervisor, who reports to the Manager of Distribution and T&D Standards, oversees them. The underground Distribution Engineers are qualified electrical engineers. When needed, PGE hires civil engineers to perform certain civil maintenance tasks.
Crews
The craft workers assigned to the CORE group, part of the PSC, focus specifically on the underground CORE which includes both radial underground and network underground infrastructure in downtown Portland. Their responsibility includes operations and maintenance of the network infrastructure. An Underground Core Field Operations Supervisor leads the CORE group. This supervisor reports to the Response & Restoration Area Line Manager (ALM).
Currently, the following 16 people working in CORE:
- Four non-journeymen
- Eleven journeymen (e.g., assistant cable splicers, cable splicers, foremen)
- One Special Tester
- Crew foreman: Crew foreman (a working, bargaining unit position), required to be a cable splicer
- Cable splicer: This is the journey worker position in the CORE.To become a cable splicer in CORE, an employee must spend one year in the CORE area as a cable splicer assistant.
- Cable splicer assistant: A person entering the CORE as a cable splicer assistant must be a journeyman lineman. All cable splicers start as assistant cable splicers for one year to learn the system and network.
- Cable pulling
- Splicing
- Cable and network equipment maintenance
- Cleaning
- Pulling oil samples from transformers
Resources in the CORE include the following:
The Cable Splicer position is a “jack-of-all-trades” position with work including the following:
The typical underground crew consists of three people: two journeymen and a non-journeyman helper. The foreman, who is a qualified cable splicer, is one of the working journeymen on the crew. The two journeymen typically perform the work inside the manhole or vault, while the helper usually stays above ground, carrying material and watching the barricades and street for potential hazards.
In addition, a crew may include an equipment operator to operate the cable puller, vacuum truck, or other equipment. Note that some work, such as backhoe work, is usually performed by external contractors.
Other Crews and Positions
Special Tester: PGE CORE has a Special Tester position, who is a journeyman lineman with additional training and technical skills. Outside the network, Special Testers work with reclosers and their settings, and perform cable testing and cable fault location. Within the network, the Special Tester works closely with the network protectors, becoming the department expert with this equipment. PGE has embedded one Special Tester within the CORE group. This individual receives specialized training in network protectors from the manufacturer, Eaton.
The Special Tester usually partners with cable splicers, working as part of a crew. The “special testing” crew includes the Special Tester, a crew foreman (a cable splicer), a lineman/cable splicer, and a topman. The topman stays outside the hole and watches the manhole/vault entrance to ensure no accidents.
In addition to NP testing and settings, the Special Tester focuses on power quality issues, including customer complaints about voltage.
Network Protector Crew: The CORE group has created a dedicated crew that deals with network protectors and performs other construction work. This crew is comprised of cable splicers who receive formal training and attend conferences to gain experience with network protectors. This crew includes a foreman, journeyman (who rotates every three months), and Special Tester.
PGE has approximately 230 network protectors on the system, with half included in the 480 V spot networks, and half in the 120/208 V area grid systems. Presently, it has three construction/maintenance crews and will add the dedicated crew protector crew.
Journeyman Locator: The CORE has a cable splicer/journeyman in charge of “locate” requests, and this role is never outsourced. The network had 1600 locates last year, and ideally the locator works with the Mapper to ensure accurate maps.
Infrared (IR) Tech: IR techs inspect primary systems and network protectors as part of the Quality and Reliability Program (QRP). PGE has three IR techs, who mainly focus on the transmission system. They also work on high-priority secondary systems.
None of the IR techs are dedicated solely to the CORE.
7.6.11.15 - SCL - Seattle City Light
Operations
Organization - Operation Center
People
SCL uses a centralized operations center for their company. This center operates both the transmission and distribution systems. There are two distribution desks in the operations center, one of which has accountability for the network. (Note that there is not a dedicated desk to operate the network. The operators at this desk have both network and radial distribution operations responsibility.)
Distribution Operators (dispatchers) typically enter the position with either utility experience and electrical background, or specific experience as a journeyman. Often they have four years of education plus two years of electrical experience. They must take a test to get into the position.
Operations Documentation
Clearance procedures are well documented in the Seattle City Light System Operations Clearance, Keep Open, and Hold Open Procedures. Employees who are qualified to perform switching and tagging and give and receive clearances must be familiar with these procedures, and pass a test to demonstrate their proficiency.
Operations Performance Management
Individual performance evaluation for dispatchers includes a peer evaluation. Trainees receive mentoring from seasoned employees. For example, trainees spend two rotations with each team of dispatchers. Only about 30% are successful getting through the program.
Outage Drills
SCL does not regularly conduct drills to practice restoration of outages to the network. Note that SCL Operators do conduct routine outage drills / blackstart drills; however, these drills normally are not focused on responding to network problems.
Process
Operations Practices – Clearances
When network crew leaders request an outage of a network feeder, they submit a clearance request to the dispatchers. This process is defined in the System Operations Clearance, Keep Open, and Hold Open Procedures Document.
SCL has a position called Outage Coordinator, who is responsible for reviewing this request and preparing and coordinating the necessary clearances, keep opens, and equipment outages on an advance basis. Ultimately, the System Operator (dispatcher) orders the required switching and tagging for the clearance, keep open, or hold open.
SCL requires a “visible break” as part of their clearance procedure. They contend that this requirement – being able to observe the visible break on the transformer primary switch through the site window, and also pulling the fuses when opening the network protector – has contributed to their strong safety record.
Network clearances are site specific. The clearance must describe both the location and the specific piece of equipment that a crew is working on.
Operations Practices - Primary Switch Operation
In order to open the primary switch (on the network transformer primary), SCL either de-energizes the primary feeder or opens the network protector, separating the load from the transformer before operating the switch.
SCL work practices require that at least two journeymen be present in the vault to perform switching.
Operations Practices — Network Protector Maintenance
SCL maintains a network protector by simply opening the protector and removing the fuses. They leave the primary switch closed (energized), such that the source side of the protector remains energized. Note that they do not necessarily tag it, nor is a clearance required from the dispatcher in order to maintain a network protector.
Operations Practices – Operations Center
SCL has a separate network display board in their control center (separate from the large display that depicts their transmission system, substations, and distribution breakers). This display board depicts the transformer vault locations and the secondary network. The board is manually updated by dispatchers to show open devices, clearances, abnormal conditions, etc.
SCL also uses an issues board where they indicate any abnormal conditions, such as one of the network feeders for a sub-network being out of service for maintenance. If one feeder is out of service, they indicate which feeder is out, as well as indicate that the other feeders supplying that network are operating at an N-0 condition. Should the operators encounter issues with the network, they check the issues board to understand the system conditions.
Operations Practices – Emergency Response / Restoration
During high load conditions, the System Operator polls the network using the DigitalGrid (Hazeltine) system four or five times a day to understand field loading and voltage conditions.
SCL System Operators maintain a list of customers that are fed by each network feeder so that they can contact customers to curtail load during critical periods.
The Operations Center does not have a means for a group load pickup for network feeders, nor a written procedure that describes the processes for responding to a network blackout. The last time they encountered the need to pick up multiple feeders, they sent multiple crews to various locations and performed a countdown – three, two, one, close – to close multiple switches at the same time.
SCL’s procedures for responding to network emergencies are not formally documented. SCL does not perform regular drills to practice restoration procedures to the network. Note: SCL does document and drill restoration procedures for outages to the non-network parts of their system. These drills normally exclude outages to network facilities.
Operations Practices — Vault / Network Fires
SCL’s current design standard calls for fire protection heat sensors and temperature sensors in their vaults. The heat sensors are designed to open all the network protectors in the vault when the heat sensor registers 225°F. The temperature sensors send an alarm to the dispatcher at 40°C. (SCL utilizes temperature sensors in about 20% of their network transformer locations. They are actively adding locations, with a goal of 100% coverage.)
SCL does not have a written procedure for responding to a vault fire. Although their operators do have the authority to drop load in an emergency, they do not have a protocol to guide them as to whether or when they should drop load in response to a fire. Note that because of the “sub-network” design, with each secondary network completely separated from the other, a complete network outage due to a fire would be limited to the customers served by that one sub-network, with the other networks unaffected.
Technology
Monitoring
SCL does not use distribution-level SCADA on their network, but they do have access to the remote monitoring system (DigitalGrid). They have a separate console for accessing this remote information, and alarms from this system are available at each dispatcher console.
The SCL Dispatchers have access to the NetGIS system through a network viewer. This viewer enables them to view the contents and configuration of each network vault.
7.6.11.16 - Survey Results
Survey Results
Operations
Operation Center
Survey Questions taken from 2015 survey results - Operations
Question 107 : Do you have a dedicated operator within your dispatch center/control room for operating the network?

Question 108 : Do you remotely sense / monitor information about network devices beyond the primary feeder substation breaker?

Question 109 : If you remotely monitor information about network devices, please indicate what information you are monitoring. (check all that apply)


Question 110 : If you are remotely monitoring information about network equipment beyond the primary feeder breaker, is this information tied in with your SCADA system?

Question 111 : Do you have the ability to remotely control switches, network protectors or other devices on your network system primary beyond the substation breaker?

Question 112 : If so, what devices are remotely controlled? (check all that apply)


Question 126 : Do you require your network crews to wear flame retardant (fr rated) clothing?

Question 127 : If so, what clothing system level is required to work in the network (routine work)?


Survey Questions taken from 2012 survey results - Operations
Question 7.1 : Do you have a dedicated operator within your control room for operating the network?

Question 7.2 : Do you remotely sense / monitor information about network devices beyond the primary feeder substation breaker?

Question 7.3 : If you remotely monitor information about network devices, please indicate what information you are monitoring. (Check all that apply)


Question 7.4 : If you are using remote sensing, how is the information communicated? (check all that apply)


Question 7.5 : If you are remotely monitoring information about network equipment beyond the primary feeder breaker, is this information tied in with your SCADA System?

Question 7.6 : Do you have the ability to remotely control switches, network protectors or other devices on your network system primary beyond the substation breaker?

Question 7.7 : If so, what devices are remotely controlled?

Question 7.8 : If you do remotely control devices, indicate from which location(s) you have the ability to do so.

Question 7.9 : If you are remotely monitoring and/or controlling network equipment, what vendor/system are you using?

Question 7.10 : Do you have documented, up to date procedures for responding to network emergencies?

Question 7.12 : Do you have a means to do a group feeder pickup in the event of a network outage? (Multiple feeders)

Survey Questions taken from 2009 survey results - Operations
Question 7.1 : Do you have a dedicated operator within your control room for operating the network?

Question 7.2 : Do you remotely sense / monitor information about network devices beyond the primary feeder substation breaker?

Question 7.3 : If you remotely monitor information about network devices, please indicate what information you are monitoring. (Check all that apply)


Question 7.5 : If you are using remote sensing, how is the information communicated? (check all that apply) (This question is 7.4 in the 2012 survey)


Question 7.6 : If you are remotely monitoring information about network equipment beyond the primary feeder breaker, is this information tied in with your SCADA System? (This question is 7.5 in the 2012 survey)

Question 7.7 : Do you have the ability to remotely control switches, network protectors or other devices on your network system primary beyond the substation breaker? (This question is 7.6 in the 2012 survey)

Question 7.8 : If so, what devices are remotely controlled? (This question is 7.7 in the 2012 survey)

Question 7.9 : If you do remotely control devices, indicate from which location(s) you have the ability to do so. (This question is 7.8 in the 2012 survey)

Question 7.10 : If you are remotely monitoring and/or controlling network equipment, what vendor/system are you using? (This question is 7.9 in the 2012 survey)

Question 7.13 : Do you have documented, up to date procedures for responding to network emergencies? (This question is 7.10 in the 2012 survey)


Question 7.14 : Do you have a procedure that provides guidance in responding to vault fires?

Question 7.15 : If so, does it provide guidance to an Operator indicating when it is necessary to de-energize a network due to the emergency?

Question 7.16 : Do you have a means to do a group feeder pickup in the event of a network outage? (Multiple feeders) (This question is 7.12 in the 2012 survey)

7.6.12 - Outage Drills
7.6.12.1 - AEP - Ohio
Operations
Outage Drills
People
At present, there is no AEP-wide formal procedure for conducting outage drills to simulate network emergencies – the decision to and performance of drills has been and remains the responsibility of each operating company. However, at the time of the practices immersion, AEP was considering adopting a system-wide approach to the performance of drills involving network infrastructure.
Process
For example, SWEPCO, one of AEP Ohio’s sister companies, recently held outage drills simulating outage conditions on their network. In the first drill, the Dispatcher on duty knew of the drill, but the field personnel did not. Only when field personnel were dispatched to the “trouble” area, did the Dispatcher lay out the particular drill scenario of a smoking manhole. The drill was successful in that it revealed some opportunities to improve the restoration process. (For example, the drill revealed an issue with manhole labeling that hindered the ability of the field force to locate a particular manhole.) SWEPCO made some adjustments to its restoration process based on learnings from the first drill and conducted a second drill.
Findings from the two drills were taken to the Distribution Leadership Team, and lessons learned were shared across all operating companies, with specific recommendations on how to conduct drills and what items needed to be refined in such drills. There is discussion at AEP Ohio that training personnel may play a role in formulating and running outage drills in the future in coordination with Dispatchers.
7.6.12.2 - Ameren Missouri
Operations
Outage Drills
People
Ameren Missouri does not have documented procedures for responding to outages of different types related to the network.
Process
While Ameren Missouri does perform periodic outage drills, these drills have not historically involved the network.
7.6.12.3 - CEI - The Illuminating Company
Operations
Outage Drills
People
Outage Drills are conducted and led by the Regional Dispatch Office (RDO), and involve the UG Network Services department, as well as other departments at CEI.
Process
CEI conducts outage drills annually, and is required to do so by the Ohio utility commission (PUCO), if they don’t experience a major storm[1] . These drills typically do NOT simulate the loss of the network, but do include simulating the loss of underground radial feeders.
CEI has black start plans and conducts black start drills. However, the RDO and UG Network Services department are not included in black start drills.
Technology
CEI is using an outage management system (OMS) called Power On. CEI utilizes its outage management technology in conducting outage drills.
[1] Major storm defined as having 6 % or more of their customers (43000 customers) out of service
7.6.12.4 - CenterPoint Energy
Operations
Outage Drills
People
CenterPoint conducts periodic Emergency Operation drills, led by the Energy Control Dispatch Center (ECDC). These drills include practicing hurricane preparedness activities.
CenterPoint also conducts periodic “Blackstart” training.
Major Underground maintains an Emergency Operations Plan document.
Process
CenterPoint Emergency Operation drills typically do NOT simulate the loss of the network.
Technology
CenterPoint maintains a fully function backup control center in the event of the loss of the primary control center.
CenterPoint uses a simulator to aid them in Blackstart training.
7.6.12.5 - Con Edison - Consolidated Edison
Operations
Outage Drills
Process
Distribution System Operation under Contingency Conditions
Con Edison has a specification that provides guidance for actions to be taken and activities to be pursued by the Electric Operations, System Operation, and Substation Operations when unusual operating conditions, such as multiple contingencies above the design criteria and/or elevated system loading, arise on the distribution system. The document includes guidelines for emergency cooling of network transformers, outlining different methods for cooling, and describing in what circumstances to use each method.
The document includes sections that describe actions that should be taken in the event of first and second contingencies for networks of different voltages and substations, including information that should be gathered, people to be notified, and factors to consider.
For example, in a first contingency condition on a 13-kV network, where a network feeder opens automatically, some of the actions that should be taken include:
-
Examine the RTF application (where available), and determine the type of fault (for example, single-phase, double-phase, or three-phase) and a calculated fault location.
-
Examine relay targets and determine the type of fault (for example, single-phase, threephase, instantaneous with ground, or time delay with ground).
-
Process the feeder, and identify the component that failed (for example, cable, splice, transformer, or transformer termination. Also, if it is a single-phase or three-phase cable or splice).
-
Correlate the identified failure with the RTF application and the feeder relay targets. If they do not correlate, consider performing a modified HIPOT after repairs are completed.
-
Complete repairs, remove feeder grounds, and apply Ammeter Clear Test and modified HIPOT test.
-
Monitor system conditions for possible overloaded equipment (from Con Edison ’ s RMS).
-
Identify and investigate open network protectors.
-
Replace network protector blown fuses reported by RMS.
-
Review RMS data (Visual WOLF) and exception data to identify potentially overloaded feeder sections and transformers.
-
Review the next-worse contingency scenario in anticipation of an additional feeder out of service.
The document also provides guidance for operators in making the decision to initiate and execute a network shutdown if necessary.
Generator Maintenance
Con Edison maintains several emergency generators to be used at certain key customer sites in case of an outage. The Field Engineering group is responsible for maintaining these emergency generators. This maintenance includes monthly inspections, quarterly load tests, and annual drills where the generators are physically moved to the site and connected to the customer’s system. In order to expedite the connection of these generators in an emergency, the customers have specially designed features at their service connection points that enable a quick connection of the generators to their systems.
7.6.12.6 - Duke Energy Florida
Operations
Outage Drills
People
Working closely with the DCC, the network group is responsible for emergency preparedness and response for issues in the network.
At the time of the practices immersion, Duke Energy Florida had no written guidelines or procedures for responding to emergencies in the network, such as for a smoking manhole or loss of the network. They do have written guidelines for substation level outages. In the rare historic cases where they have experienced trouble, they have relied on experience.
Duke Energy Florida has recognized the need to document emergency response procedures for the network, including a black start, and responding to a smoking manhole condition. The development of these procedures is an item that will be addressed as part of their network revitalization plan. (See Network Revitalization – Florida Primary and Secondary Network Improvement Plan)
The Duke Energy Florida training matrix for network workers does include training courses that prepare workers for emergencies, such as manhole rescue training.
Annually, a Senior Network Specialist, with the assistance of a Network Engineer, will provide training for DCC dispatchers, both training for new hires and refresher training for dispatchers. This is done on an as need basis, and occurs annually. This training includes bringing dispatchers into the field, as well conducting training within the DCC.
Process
Duke Energy Florida does perform extensive storm preparedness and hurricane preparedness drills. These drills involve simulated major events, including populating OMS with changing weather conditions, areas affected, predicted storm surges, etc. Every employee has a role, with documented lists of responsibilities. For example, the Network Specialists and Electrician Apprentices within the Network Group would typically have responsibility for network feeders in these drills. At the end of the Simulation, employees are asked for lessons learned and improvement suggestions. After the last simulation, for example, questions were raised about how to handle oil spills from switchgear in the event of storm surge flooding of manholes/vaults. The company responded by developing a comprehensive Storm Surge Process document for use in the field that documents and prioritizes roles and responsibilities.
Historically, these drills have not included the case where the network feeders are out of service. The thinking has been that if you lose a network feeder, it will probably be as a result of a problem “above” the feeder level, such as the loss of the substation. However, the developers of these drills do plan to include network scenarios in future drills.
In a network emergency, an expert within the Network Group would provide guidance to the crews, especially if new members join the organization, including how to bring feeders back online. This is often done in the field at specific locations. These on-site scenarios are coordinated with Dispatch.
All network supervisors have dedicated On-Call and On Duty time slots to insure emergency response coverage at all times. “On-Call” means that personnel are expected to respond in case of emergency. “On-Duty” personnel report on-site and actively monitor systems for trouble.
Duke Energy Florida also has an automated robo-call system (ARCOS), capable of delivering 100 phone calls at once, to bring network crews in during emergencies. Network crew members have a contractual obligation to respond to a predetermined percentage of calls. The Network Group has very good callout response.
Technology
Duke Energy Florida uses ARCOS to handle worker call outs in response to outages after hours. ARCOS is a Software as a Service (SaaS) solution for utilities to respond, restore and report in real-time for day-to-day events and emergencies. The software is cloud-based and include callout, scheduling, and crew management functions. ARCOS lists of crew members with skills and contact information are populated by Duke Energy Florida and updated as crew member information and job skills change.
Duke Energy Florida is investigating the application of self -ventilating manhole systems, though hadn’t installed any at the time of the practices immersion. They noted that their manhole tops are not designed with “lips,” making the installation of a manhole restraint system that requires modifications and connection to the manhole cover frame much more problematic. To add the lip to the existing opening would result in an opening which is too small (29 ½ inches). Consequently, to install self-venting manhole systems that require the lip for retention requires a change out of the manhole roofs, a costly effort.
7.6.12.7 - Duke Energy Ohio
Operations
Outage Drills
People
Duke has documented procedures for responding to emergencies of certain types. For example, they have a procedure for responding to a secondary cable fire , a procedure for responding to a manhole fire (See Attachment I ), and a procedure for operating the network under emergency conditions (See Attachment J). Documentation of emergency response procedures is the responsibility of the Network Planning Engineer
Process
Duke Energy Ohio does perform periodic black start drills. Network feeders are not included in black start drills.
7.6.12.8 - Energex
Operations
Outage Drills
People
Disaster and emergency drills for the CBD underground network are the responsibility of the Network Operations group, part of the Service Delivery organization at Energex.
Process
Evaluators and switching coordinators within the control center run yearly preparedness audits prior to the peak summer demand season (see Figure 1). They work on the company-wide Energex Emergency Preparedness Committee and the Summer Prep Steering Committee, which includes the CEO. The group runs two simulation exercises, which simulate a test of the full end-to-end process for a major storm. The simulation runs from operations down to the street-level with dispatches of crews to “affected” areas in the scenario.

Figure 1:
Energex Summer Preparedness Plan
The group also performs system re-start drills. Contingency plans are also reviewed on an annual basis that takes into consideration various scenarios, such as loss of supply to substations. All contingency plans are N-1 in nature. Generally speaking, Energex does not have any N-2 contingency plans formalized. However, if network planning and project maintenance call for an N-2 situation, there are engineers in the network operations center who formulate load flows and contingency plans to address the N-2 situation.
7.6.12.9 - Georgia Power
Operations
Outage Drills
People
Troubleshooting and restoration of outages falls primary with the Georgia Power Underground Network Operations and Reliability group, part of Network Underground. The group is supported by field maintenance and trouble-shooting crews comprised of Cable Splicers, Duct Line Mechanics, WTOs, and their supervisors. The Operations and Reliability group is responsible for issuing clearances and directing maintenance crews to affected areas of the network.
Georgia Power has developed a Contingency Plan, available internally in print and on line, which describes actions to be taken in the event of an emergency. The plan guides decision makers in various situations, such as the loss of multiple feeders, loss of a vault due to excessive flooding, loss of a network substation, and other scenarios extensive flooding of a network.
Georgia Power is active with the Southeastern Electric Exchange (SEE), a consortium of companies (trade association) who collaborate on mutual issues. SEE has a Network Underground Committee, and Georgia Power has developed relationships with other utilities who could possibly help if outside assistance is needed for major trouble on the network. SEE also has a Mutual Assistance Committee which could help coordinate that assistance.
Process
The Operations and Reliability Group has performed outage drills in the past, but does so infrequently.
7.6.12.10 - HECO - The Hawaiian Electric Company
Operations
Outage Drills
People
HECO does conduct annual Outage Drills that test their use of the Incident Command System. These drills involve most everyone in the company, including the Dispatch Center and the C&M Underground group.
Process
HECO conducts outage drills annually. These drills typically do NOT simulate the loss of the network, but do include simulating the loss of underground radial feeders.
Technology
HECO utilizes its outage management technology in conducting outage drills.
7.6.12.11 - National Grid
Operations
Outage Drills
People
National Grid has documented procedures for responding to network emergencies of certain types.
Procedures for shedding and restoring network load are maintained on the Regional Control Center. Other procedures such as responding to a fire in a manhole are held by the underground group common and often part of the electric operating procedures (EOP).
Process
National Grid performs annual table top drills to practice response to network emergencies. These annual network drills mock specific scenarios such as peak loading conditions, feeders out of service, equipment fires, load shedding, etc. National Grid operations resources practice the various steps associated with restoration. The annual drill conforms to a regulatory requirement in the State of New York.
In addition, once every five years, National Grid conducts a more detailed drill that includes network outage situations. These drills go well beyond the tabletop exercises, including things such as dispatching crews to specific locations. These drills are not mandated.
7.6.12.12 - PG&E
Operations
Outage Drills
People
PG&E has documented procedures for responding to emergencies of certain types. For example, they have a procedure for responding to a manhole fire, and perform periodic table top drills to practice and train.
Process
PG&E performs table top drills to practice response to certain emergencies such as manhole fires.
7.6.12.13 - Portland General
Operations
Outage Drills
People
Emergency preparedness and response in the network is a shared responsibility among multiple groups, including the System Control Center (SCC), Distribution Engineers, and the CORE underground group.
In the case of a smoking manhole or other manhole event, the load dispatcher in the SCC informs the duty general foreman (DGF), who assembles the appropriate field crews to respond to the event.
Process
The response depends on the situation. As an example, PGE described a situation where they had a smoking manhole, and lost two of four primary feeders supplying a network. After conferring, the distribution engineer and load dispatcher decided to drop the network to avoid overloading of the equipment. PGE relies on the experience of its people to make these decisions and has not developed written guidelines related to unforeseen events occurring on the network, such as when to drop the network or how to respond to a smoking manhole.
During an emergency,PGE follows the principles of the incident command system (ICS). Employees are well-versed in ICS at the management level.
Fire Department Training: PGE coordinates with the Portland Fire Department (PFD) for training and covers what actions to take if there is a fire in a vault or manhole. PGE used to run exercises on a yearly basis with the PFD and intends to reestablish these. If a vault rescue is needed, the Portland Fire Department (PFD) utilizes their own rescue equipment. The PFD’s response time is good because they operate from locations across the downtown area.
Technology
PGE uses solid 32 in. (81 cm) diameter manhole lids with venting holes. PGE is testing various manhole lid retention systems to prevent covers from being launched into the air during events.
7.6.12.14 - SCL - Seattle City Light
Operations
Outage Drills
People
SCL’s procedures for responding to network emergencies are not formally documented. SCL does not perform regular drills to practice restoration procedures to the network. Note that SCL Operators do conduct routine outage drills / blackstart drills; however, these drills normally are not focused on responding to network problems.
Technology
Operations Practices — Vault / Network Fires
SCL’s current design standard calls for fire protection heat sensors and temperature sensors in their vaults. The heat sensors are designed to open all the network protectors in the vault when the heat sensor registers 225°F. The temperature sensors send an alarm to the dispatcher at 40°C. (SCL utilizes temperature sensors in about 20% of their network transformer locations. They are actively adding locations, with a goal of 100% coverage.)
SCL does not have a written procedure for responding to a vault fire. Although their operators do have the authority to drop load in an emergency, they do not have a protocol to guide them as to whether or when they should drop load in response to a fire. Note that because of the “sub-network” design, with each secondary network completely separated from the other, a complete network outage due to a fire would be limited to the customers served by that one sub-network, with the other networks unaffected.
7.6.12.15 - Survey Results
Survey Results
Operations
Outage Drills
Survey Questions taken from 2018 survey results - safety survey
Question 12 : Do you periodically conduct a network exercise (drill) for responding to a safety emergency in a manhole, vault, or multi-level vault?


Survey Questions taken from 2018 survey results - Manhole Event Preparedness and Response
Question 28 : Do you perform periodic drills that include network situations, such as a network outage or network manhole fire?


Question 29 : If you perform emergency drills that involve the network, do you sometimes involve other stakeholders, such as first responders (such as the fire department)?


Survey Questions taken from 2015 survey results - Operations
Question 117 : Do you perform periodic drills that include network situations, such as a network outage or network manhole fire?


Question 118 : Do you perform a network emergency drill at least once a year where your company will simulate a network emergency with key individuals in a room and everyone discusses how they would respond?


Survey Questions taken from 2012 survey results - Operations
Question 7.11 : Do your company’s periodic outages drills normally include network situations?


Survey Questions taken from 2009 survey results - Operations
Question 7.11 : Do your company’s periodic outages drills normally include network situations?


7.6.13 - Outages - Restoration
7.6.13.1 - AEP - Ohio
Operations
Outages - Restoration
People
Troubleshooting and restoration of outages is primarily the responsibility of the Network Mechanics and Network Crew Supervisors. Network Engineers and the Network Engineering Supervisor may also be involved troubleshooting and restoration.
Process
A key responsibility for each AEP network grid operating company is “Preparedness for Network Event,” including troubleshooting, outages, and restoration. Each local operating company has procedures in place for responding to such events.
For example, AEP Ohio has developed a procedure for responding to a fire in a spot network at a customer site. The procedure includes “first responder authority,” which empowers AEP field personnel to make the decision of whether to drop network feeders, if necessary, to protect the system, customers, and employees, or for quicker problem resolution. This procedure was developed in response to learnings from post-analyses of events that have occurred on the AEP system.
AEP Ohio has also developed a guideline for responding to “smoking manholes,” which is also based on post-event analyses and critique. This guideline includes steps for dealing with smoking manholes in both single and double contingency operations. The guideline was presented to the Network Standards Committee at AEP, which includes representatives from all AEP operating companies with network grids. These members hold regular teleconference meetings to tackle issues such as troubleshooting, outages, and restoration. The smoking manhole guideline from the Standards Committee and its members was sent to the Distribution Leadership Team (DLT), which includes all the vice presidents of the operating companies, for discussion and input. The DLT members are also invited to the regular Network Standards Committee teleconferences. After consideration, the smoking manhole guidelines were adopted and approved. (See Attachment I and Attachment J : Single Contingency and Double Contingency Guidelines.)
7.6.13.2 - Ameren Missouri
Operations
Outages - Restoration
People
Troubleshooting and restoration of outages may involve multiple groups at Ameren Missouri.
Traveling Operators and Distribution Service Testers are typically involved in troubleshooting, clearing and fault locating on the primary distribution system supplying the network.
Secondary troubleshooting is the responsibility of the Underground Construction department.
In a network outage, the dispatcher in the SDC would first call a supervisor within the either the Service Test group or the Underground Construction department depending on the nature of the outage.
The Ameren Missouri SDC includes dispatchers who prepare switching orders to direct switching and tagging, and issue clearances. Traveling operators perform the switching, Distribution Service Testers locate faults and repair network equipment (non cable), and Cable Splicers within the Underground Construction group repair cable and prepare splices.
Restoration activities may involve the network engineers in the Underground Division, who may be consulted for guidance in reconfiguring the system to restore service.
For outages involving major customers, Major account representatives are involved in coordination with customers throughout the restoration.
Process
While Ameren Missouri does perform periodic outage drills, these drills have not historically involved the network.
Technology
Traveling Operators and Distribution Service Testers have mobile data terminals installed on their trucks.
Ameren Missouri does have a group pickup switch for their networks.
7.6.13.3 - CEI - The Illuminating Company
Operations
Outages - Restoration
People
Outage restoration of the underground system is performed by the UG Electricians within the Underground Network Services Department, working closely with the Distribution System Operators (DSO’s) in the Regional Dispatch Office (RDO).
Unplanned network outages in Cleveland are rare and almost never result in customer interruptions. The same is true for major customers served by CEI’s 11kV sub-transmission system.
The RDO employs two Outage Coordinators who coordinate planned interruptions, including the drafting of the appropriate switching orders.
Process
The UG Network Services department assigns a crew to a “trouble shift” each day. In the event of an outage or other problem, the DSO will contact the trouble shift on duty to respond. The trouble crew works directly for the DSO in responding to trouble. In a larger event, additional crews will be called in, as required.
In a large outage restoration, the RDO assigns an individual to keeping the outage management system up to date with estimated restoration times (ETR). These times are entered on the trouble tickets themselves, and can be automatically provided to customers who call in through CEI’s Interactive Voice Response (IVR) system. Note that CEI has deemed the provision of ETRs to customers an important enough task to assign a full time resource to this responsibility.
Technology
CEI is using an outage management system (OMS) called Power On. In addition, they utilize an Interactive Voice Response System (IVR) that can record “no light” calls, automatically feed their outage management system to support automated prediction, and provide ETRs to customers.
7.6.13.4 - CenterPoint Energy
Operations
Outages - Restoration
(Troubleshooting / Outages)
People
Troubleshooting of the underground system is performed by both Troubleshooters who are part of the Dispatching organization and the Major Underground construction groups (Cable and Relay groups) working closely with the Energy Control Dispatch Center (ECDC).
In general, the responsibility for troubleshooting three phase underground infrastructure lies with the Major Underground group.
The responsibility for troubleshooting outages on overhead and single phase underground facilities lies with the Troubleshooter position, a union position reporting to the ECDC. These ECDC Troubleshooters will coordinate with Major Underground on certain outages.
Major Underground schedules crews to work on second shift (4pm to midnight) as part of its normal work schedule. This work force consists of ten Cable Splicers and from two to four Relay personnel. The second shift positions are posted positions. These crews are assigned schedule work and serve as Major Underground trouble shooters for outages that occur on second shift.
For night time outages (after midnight), the dispatcher would contact the crew leader or operations manager on duty (crew leaders and operations management rotate call out duty on an eight week rotation). This individual would call out the appropriate resources to respond to the trouble.
During major events, CenterPoint Major Underground crews will work 16 hour shifts.
Process
The Major Underground group is responsible for troubleshooting outages within the three phase major underground system.
Troubleshooters, a union position reporting to the ECDC, will troubleshoot outages with overhead and single phase underground infrastructure. These Troubleshooters work as one man crews, usually out of a pick up truck. In some cases they will work out of a telescopic bucket truck.
ECDC Troubleshooters deal mostly with overhead and single phase underground, infrastructure that is not the responsibility of the Major Underground Group. However, if there is a blown riser fuse on a three phase riser pole (normally the responsibility of the Major Underground group), the troubleshooter will be sent, and may attempt to refuse. In this case the Dispatcher will contact Major Underground for permission to operate the fuse. If the Troubleshooter finds all three phases of the riser pole have blown, he will not work it - the Major Underground group will be called to trouble shoot the problem.
With respect to network infrastructure, the troubleshooters do not respond to problems in spot networks, or the secondary network grid system. For outages in the network, Major Underground has responsibility for trouble shooting all three-phase underground infrastructure.
Technology
CenterPoint utilizes a “home grown” outage management system. This system has a prediction engine that creates cases for each suspected trouble location. It is tied to SCADA, in that Breaker trips and lockouts are displayed in the OMS. It is further linked to CenterPoint ’s “graphical switching” system.
CenterPoint’s graphical switching system, developed by CES (now Oracle), is tied in with both their outage management system and GIS system to display up-to-date maps on the wall. This system updates the digital maps as switching is performed. For example, during an outage restoration, as circuits are sectionalized, these changes are recorded in the Outage Management system, and the Graphical switching system displays an up to date map of the distribution system.
However, the “dedicated[1]” underground system, including network secondary systems, is not displayed in the graphical switching system. This is in part because the foundation for this system is the GIS system (ESRI) and at the time the graphical switching system was installed, the GIS system had not yet been up dated with the “dedicated” underground facilities.
CenterPoint’s GIS system is ESRI. The GIS has been updated to include dedicated underground facilities, and CenterPoint intends to implement graphical switching for this distribution. CenterPoint has not fully implemented GIS for underground because the congestion inherent in underground systems and the looped nature of network systems makes both the display and the electrical connectivity of the GIS model complex.
CenterPoint is using mobile data units in its troubleshooter vehicles and in the trucks in the Major Underground Relay group. These units enable no lights cases to be “dumped” to a mobile data unit located in the truck, rather than dispatching the troubleshooter by radio. However, trouble is normally dispatched to the Relay group (Major Underground) by radio (voice), except in major events where underground resources may support the service centers.
[1] The term “dedicated” underground at CenterPoint refers to three phase infrastructure is located entirely underground in their ducted manhole system. A “dedicated” network feeder does not mean that the feeder serves only a network; rather, it refers to a feeder that is entirely underground. In fact, at CenterPoint, feeders that supply the underground network also supply radial load along the way.
7.6.13.5 - Con Edison - Consolidated Edison
Operations
Outages - Restoration
People
Con Edison’s System Operations Control Center has control of primary feeders. If a feeder trips, it is the responsibility of this control center to clear the feeder. More specifically, the System Operations Control Center is responsible for tasks such as troubleshooting the feeder, applying grounds, performing testing, and using Con Edison’s Reactance to Fault (RTF) system to predict the location of the fault.
Process
Outages
Because of Con Edison’s network design and N-2 contingency planning, most faults that result in feeder lockouts (“Open Autos,” in Con Edison lexicon) do not result in customer outages. For reports that do come in from customers, a ticket is created by the Con Edison Call Center in their outage management system with a customer address. The linkage between the customer’s account and the electrical location is not automatic. The Distribution Operator adds a structure number to the outage ticket, indicating the location on the electrical system. When this assignment is complete, information about these outage tickets can be displayed on the map. Con Edison is working on automating the process for assigning a structure number to a customer address.
When the fault is located and the feeder is scheduled for work, the System Operations Control Center hands the feeder over to the Manhattan (or other regional) Control Center to accomplish the work.
When work is done, the Manhattan Control Center gives control of the feeder back to the System Operations Control Center. System Operations verifies that the feeder is ready to be re-energized by test, and then puts the feeder back in service.
Con Edison Operators can view the status of feeders on their “Feeder Board,” available through their Heads Up Display (HUD). One feature of this display is that if two feeders are out of service, the feeder board highlights common holes — that is, vaults or manholes that contain both out-of-service feeders.
Con Edison carefully manages the time of the outage of a feeder. Feeder restoration time during hot periods at Con Edison has been significantly reduced, from about 36 hours to around 13 hours on average. The utility’s target is to have feeders out of service for no more than 14.7 hours during high temperatures. (14.7 hours was arrived at by targeting reductions in the various components that comprise outage duration.). Note that this target applies to both unplanned feeder outages (Open autos) and planned outages.
Distribution System Operation Under Contingency Conditions
Con Edison has a specification that provides guidance for actions to be taken and activities to be pursued by the Electric Operations, System Operation, and Substation Operations when unusual operating conditions such as multiple contingencies above the design criteria and/or elevated system loading arise on the distribution system.
The document includes guidelines for emergency cooling of network transformers, outlining different methods for cooling, and describing in what circumstances to use each method.
The document includes sections that describe actions that should be taken in the event of first and second contingencies for networks of different voltages and substations, including things such as information that should be gathered, people to be notified, and factors to consider.
For example, in a first contingency condition on a 13 kV network, where a network feeder opens automatically, some of the actions that should be taken include:
-
Examine the Reactance-to-Fault (RTF) Application (where available), and determine the type of fault (i.e., single-phase, double-phase, or three-phase) and a calculated fault location.
-
Examine relay targets, and determine the type of fault (i.e., single-phase, three-phase, or instantaneous with ground or time delay with ground).
-
Process the feeder, and identify the component that failed (i.e., cable, splice, transformer, or transformer termination. Also, if it is a single-phase or three-phase cable or splice).
-
Correlate the identified failure with the RTF application and the feeder relay targets. If they do not correlate, consider performing a modified Hi-pot after repairs are completed.
-
Complete repairs, remove feeder grounds, and apply Ammeter Clear Test and modified Hi-pot test.
-
Monitor system conditions for possible overloaded equipment (from Con Edison’s Remote Monitoring system).
-
Identify and investigate open network protectors.
-
Replace network protector blown fuses reported by RMS.
-
Review RMS data (Visual WOLF) and exception data to identify potentially overloaded feeder sections and transformers.
-
Review “next worse” contingency scenario in anticipation of an additional feeder out of service.
-
Etc. (This is only a partial listing of actions)
The document also provides guidance for operators in making the decision to initiate and execute a network shutdown if necessary.
Technology
Reactance to Fault Application – RTF
Con Edison is using a system that predicts the location of faults on the system based on an analysis of the electrical waveform at the time of the fault. The base platform for the system is the EPRI PQ View product, with an add-on called the “Fault Location Module.” The Con Edison system collects and houses the data and manages the waveform of the fault. Con Edison has integrated this model with their mapping system, such that the system can display the prediction of the fault location on their feeder map board. From this system, Con Edison can also view relay targets from a locked out feeder.
Prior to the implementation of this system, Con Edison’s approach to troubleshooting a feeder was to go halfway out on the circuit, and begin tracing and testing. The implementation of the Reactance to Fault (RTF) application enables the utility to pinpoint the location of the fault, significantly reducing the average restoration time. (Con Edison reduced the average restoration time by about one hour!) See Operations Control Centers.
The system also lets an operator know if the fault type is of a hazard level where company safety rules require special precautions for manhole entry, or prevent entry, depending on the specific hazards encountered (called C & D faults in Con Edison lexicon).
7.6.13.6 - Duke Energy Florida
Operations
Outages - Restoration
People
For network issues, the Network Specialists and Electrician apprentices who are part of the Network Group serve as first responders in a system outage, and are responsible for fault location. For example, Dispatch will send Network Specialists as first responders to a smoking manhole evens. Off hours, such as nights and weekends, Troublemen would serve as first responders.
For non-network issues, such as troubleshooting an automated transfer switch (ATS), Troublemen serve as first responders and are responsible for fault location. Troublemen report to a field supervisor, and are organizationally part of Duke Energy Florida’s PQR&I group. Troublemen work closely with the dispatchers at the DCC.
All supervisors at Duke Energy Florida have an “on call” responsibility. Supervisors rotate their on-duty responsibility.
Process
In Clearwater, the dispatchers at the DCC monitor feeder cables and can identify faults, usually when a breaker trips. In addition, dispatchers may receive indication from remote reporting faulted circuit indicators installed at network feeder sectionalizing switches. In general, the dispatcher relies on field crews to identify which fault indicators (FCIs) are tripped, and locate faults.
Any switching performed on the network during fault events at a site is performed by network work crews in the field. In non-network areas, field switching during fault events will be performed by Troublemen. At remotely operated substations, DCC will open breakers. If manual switching is required at a substation, Substation Electricians are sent to the substation to perform switching. See Operations Practices – Clearances.
Permanent repairs to faults are not always performed immediately when a feeder opens because the network system has enough contingency to pick up the load. In St. Petersburg, when an ATS successfully transfers, crews may also wait until the next day to address the issue. If necessary, crews will identify and isolate the faulted segment to ensure safe delivery of power to customers.
Radial feeders with no contingency will be repaired immediately after fault location by Troublemen and Dispatch.
Technology
Duke Energy Florida has SCADA control and monitoring at its substation breakers. In addition, for network feeders, they have installed remote reporting faulted circuit indicators at network feeder sectionalizing switch locations. These devices are hardwired to pole mounted devices which communicate back to the DCC via a 900 MHz radio system.
Duke Energy Florida has expanded its application of SCADA to monitor and control its automated transfer switches (ATS), which are prevalent in the primary / reserve feeder scheme used to serve customers outside of the network in Clearwater and in St. Petersburg.
Duke Energy Florida’s historic cable design has used separable connectors, such as the use of T-body connections for straight splices. This type of design enables field crews to separate cable sections, facilitating the fault location process.
Duke Energy Florida uses ARCOS to handle worker call outs in response to outages after hours. ARCOS is a Software as a Service (SaaS) solution for utilities to respond, restore and report in real-time for day-to-day events and emergencies. The software is cloud-based and include callout, scheduling, and crew management functions. ARCOS lists of crew members with skills and contact information are populated by Duke Energy Florida and updated as crew member information and job skills change.
7.6.13.7 - Duke Energy Ohio
Operations
Outages - Restoration
People
Duke Energy Ohio has a troubleshooter position called the “Trouble Man”. Trouble Men report to the Trouble Desk, part of Distribution Operations. Organizationally, Trouble Men are not part of the Dana Avenue underground group, but work closely with Dana Avenue resources in emergency situations. In addition to troubleshooting, Trouble Men perform switching on the system.
The Dana Avenue field force is on a rotating callout list that is based on the hours worked also, field employees can voluntarily carry a pager if they want to get the first call.
Dana Avenue supervisors rotate the callout duty responsibility. If a network cable fails, the trouble desk will page the duty foreman, and the foreman will assemble the necessary crews to respond to the emergency.
Dana Avenue underground crews are also responsible to respond to non-network and emergencies. Cable Splicers and Network Service personnel are normally assigned secondary repairs on the overhead system.
Designers and engineers serve as “Assessors" in an outage. The Network Project engineer, part of the Distribution Design organization, coordinates these Assessors.
Duke has documented procedures for responding to emergencies of certain types. For example, they have a procedure for responding to a secondary cable fire, a procedure for responding to a manhole fire (See Attachment I), and a procedure for operating the network under emergency conditions (See Attachment J). Documentation of emergency response procedures is the responsibility of the Network Planning Engineer.
Process
Duke Energy Ohio does perform periodic black start drills. Network feeders are not included in black start drills.
Technology
Duke Energy Ohio does have the ability to pick up multiple network feeders at one time via a switch at the substation. Training for the Trouble men includes the operation of the group feeder pickup switch.
Duke Energy Ohio has a GIS system and an Outage Management System (OMS). Their GIS system, Smallworld, drives the OMS. Their OMS is called DOMS, and is an Oracle based system.
7.6.13.8 - Energex
Operations
Outages - Restoration
(Rapid Response)
People
Energex has rapid response crews located in their various service centers, referred to as hubs. The rapid responders are comprised of electrical fitter mechanics, which is the highest capability journeyman position at Energex. (Electrical fitter mechanics are both fully qualified electricians, and fully qualified “fitters,” which refers to line construction and other mechanical aspects of the journeyman level). Within the Central Business District (CBD), substation fitter mechanics, who are qualified to work with the relay operated switchgear (breakers) that are part of three-feeder mesh, serve as rapid responders. Substation fitter mechanics are a bit more specialized than the electrical fitter mechanic position.
Rapid response crews work two shifts, a 6:00 am to 2:00 pm shift, and a 2:00 pm - 10:00 pm shift, 7 days per week. Energex utilizes a “stand by” roster, which it uses to call out to standby rapid response crews on the night shift. Within the Central Business District (CBD), Energex also holds a substation crew (substation fitter mechanics) on standby. Note that workers on standby may take vehicles home with them so that they can respond more rapidly (each crew member takes a vehicle home).
Energex has certain rapid responders who serve as specialists, including responders who address the low-side secondary wiring that goes from devices such as pole mounted re-closers to the control box mounted at the base of the pole.
Energex also has certain rapid responders who specialize in performing voltage investigations. Energex has a high level of voltage complaints / inquiries due to the high level of photovoltaic (PV) system penetration, mainly, roof top solar panels. (Energex, in total, has about 800 MW of distributed PV.) Often, these voltage inquiries are complaints from customers that their PV systems are not exporting into the grid, because of settings in the inverters to assure that voltages stay within the prescribed voltage limits (+/- five percent of nominal by law).
In response to voltage complaints, the rapid responders go out to the site and troubleshoot the problem. The rapid responders may apply voltage / load recording devices at the customer premise or on the low-voltage network to analyze the signal. For the most complicated problems, Energex may involve the Power Quality group for assistance in resolving issues (see Figures 1 to 4).

Figure 1:
Energex rapid responder holding a recording device installed at a low-voltage mini pillar, in response to a customer voltage inquiry

Figure 2:
Note the simple, but innovative extension collar placed on top of the mini-pillar, allowing room for the recording device to be placed inside the pillar

Figure 3:
Rapid response bucket truck

Figure 4:
Ladder truck used in the CBD
Process
Rapid responders work at all sorts of facilities, including low voltage, medium voltage, high-voltage substations, performing switching, making repairs, etc. Rapid responders typically are assigned maintenance work to fill the gaps between rapid response opportunities.
Technology
Rapid responders work in two-man crews and are assigned a bucket truck in the suburban and rural areas and either a specialized van, or ladder truck within the CBD.
Rapid responders utilize a mobile dispatch system called Field Force Automation, a Ventyx System.
7.6.13.9 - ESB Networks
Operations
Outages - Restoration
People
Network operations at ESB Networks, including troubleshooting and outage restoration, are the responsibility of Operations Managers and Customer Service Supervisors, part of the Operations Group. Organizationally, the Operations group, part of Asset Management, is comprised of two Operations Management centers, one North and one South, a System Protection group, an Operations Policy group, and a Systems Support group.
ESB Networks has two central operations centers, North and South, but it is soon moving to a single central control center. ESB Networks has a Customer Services Supervisor for each of its 35 MV geographic areas, who focus on MV and LV distribution.
Process
Outage calls from customers are entered into the ESB Networks OMS system. Their customer record, in SAP, is tied to OMS, such that each customer can be linked to its electrical location, enabling ESB Networks Network to know which MV station each customer is fed from.
OMS is used by where control room operators and Customer Services Supervisors to track outages. The system issues an order to the ESB Networks Dispatch Centre, which is also housed in the Operation Centre. Dispatchers issue orders to Operators to investigate outages during normal working hours, or to Network Technicians to investigate outages at night.
Control room operators update OMS to reflect the real time conditions of the system, as they sectionalize to restore customers. The OMS is also used to develop switching orders for the MV system.
In the case of a wide-spread outage, incoming calls are pushed to an interactive voice response (IVR) system that gives them specific outage information and the estimated time for recovery. Through its IVR, ESB Networks provides a default ETR of 2 hours for a fault in a rural area, and 1 hour for a fault in an urban area. Network Technicians or field operators can override the system ETR with a realistic estimate after arriving at the site.
ESB Networks has a good track record for restoration. Tariffs of €8 per customer out and €10 per hour of outage are assessed by the regulator.
Technology
The ESB Networks OMS system is tied to its extensive SCADA network, and breaker operations are represented in the OMS in real time.
ESB Networks has implemented OMS On line, a tool that enables any employee to go into the system and view MV outages, as well as comments and other information associated with the outage.
At the time of the immersion, ESB Networks was implementing Power Check, a system that provides a view of outage conditions to the customer via the computer or through a smart phone app.
7.6.13.10 - Georgia Power
Operations
Outages - Restoration
People
Troubleshooting and restoration of outages falls primarily with the Georgia Power Underground Network Operations and Reliability group, part of Network Underground. Test Engineers, who are part of the Operations and Reliability group serve as first responders. The Network Control Center is responsible for issuing clearances and directing maintenance crews to affected areas of the network. The Operations and Reliability group is supported by field maintenance and trouble-shooting crews comprised of Cable Splicers, Duct Line Mechanics, WTOs, and their supervisors.
Process
In the event of an outage, Test Engineers serve as first responders, and crews are mobilized and dispatched when needed to repair and restore service.
Because the Georgia Power underground network is designed to N-1, it has seen few outages that result in full customer outages. In case of an outage, the Operations and Reliability group can re-route network load to other networks when possible.
UG resources are sometimes called upon to work as overhead service repair crews during storms. Georgia Power will assemble two man crews assigned to a small bucket truck to focus on service repair (from the transformer to the house). Once per year, UG employees are re-certified to be able to use a bucket truck.
Technology
The Georgia Power Operations and Reliability group has an extensive Network Control Center for monitoring and troubleshooting its network underground systems. During peak loading periods, resources within Operations will perform analyses of forecasted loads and system limits to assure that there is adequate reserve capacity in normal and first contingency conditions.
Georgia Power has mobile transformers for backup of some substations and is in discussions with neighboring utilities for cooperative service sharing of power transformers in case of emergency.
During emergencies where additional manpower is needed, the company initiates its ARCOS callout system. This automated phone system calls the roster of “on-standby” personnel and directs them to call their supervisors for instructions. Maintenance crews and other designated personnel are expected to be on stand-by and have a response requirement: they must respond to at least 50 percent of all emergency, off-hours calls annually. Georgia Power also has a volunteer list for those who want overtime, and volunteers are first in the ARCOS calling queue. Note that all employees of a classification are grouped together for call out, even if they work in different groups.
7.6.13.11 - HECO - The Hawaiian Electric Company
Operations
Outages - Restoration
People
HECO utilizes an employee classification called “Primary Trouble Man” or PTM. PTM’s are responsible for operating the distribution system, responding to trouble, and for obtaining clearances and placing safety tags. Organizationally, the PTM’s are part of the Construction and Maintenance organization, although they work closely with the Dispatchers in System Operations. PTMs work alone as one man crews. They are assigned light duty trucks equipped with the tools they need to perform their job.
Outage restoration of the underground system is performed by a combination of the PTMs, who troubleshoot and sectionalize, and the Cable Splicers in the Underground Group, who make repairs to the underground system. Both of these groups work closely with the Dispatch Center, who manages the restoration.
Process
PTM’s are available as first responders to troubleshoot outages. In some cases the PTM’s can restore service through switching or through making simple repairs. They can often identify and isolate a failed cable section, for example, enabling the UG group to schedule the fault location and cable repair. In other cases, UG Crews must be called in to assist with the repairs during the emergency.
HECO uses an Outage Management system that they report has been “highly useful” for them. The system provides an actual customer count based on the circuit configuration and protective device that operated. The system has representations of entire feeders, and knows which customers are served by what transformers and on what circuits they reside. The system is kept up to date to reflect field conditions.
HECO does not have written procedures to guide the Dispatchers in the event of the loss of all of their network feeders, or how to respond to a network emergency such as a manhole fire.
HECO is currently in the process of updating their written Blackstart procedure.
Technology
HECO utilizes an outage management system (Siemens) to facilitate outage determination and restoration. Their system resides on a circuit model that is built from their GIS system.
The Dispatch Center has two operating engineers who are modeling the OMS system and review the circuit configuration to assure that the circuit models are accurate and functional within OMS. As field changes occur, the Mapping section makes permanent additions or revisions to the circuit models in GIS. The operating engineers then “build” the circuits electrically within OMS.
HECO is in the process of implementing a new customer information system that will tie into OMS.
7.6.13.12 - National Grid
Operations
Outages - Restoration
People
Troubleshooting and restoration of outages may involve multiple groups at National Grid.
Maintenance Mechanics within NY Underground East are responsible for troubleshooting network feeders, performing switching on the network (outside the substation), and and in performing fault location.
The National Grid Regional Control Center includes Regional Operators who provide switching orders to direct switching and tagging, and issue clearances, and Substation Operators who perform switching at the substations. Field switching is directed by the Regional Operators and performed by the Maintenance Mechanics within the UG group.
Restoration activities may involve the planning engineers, who may be consulted for guidance to reconfigure the system to restore service.
Process
National Grid does perform periodic load shed drills for the network.
When National Grid crews shoot trouble on the underground system, they document their findings on an Underground Trouble / Splice Log. See Attachment H . This procedure is documented in their Electric Operating Procedures (EOP).
Technology
The Regional Control Center uses Small World GIS and power on as their outage management tool.
7.6.13.13 - PG&E
Operations
Outages - Restoration
People
Troubleshooting and restoration of outages may involve multiple groups at PG&E.
The M&C Electric Network group resources respond to routine emergencies / outages.
PG&E uses a position called a Cableman, part of the Restoration Group (not part of the M&C electric Network organization), who troubleshoot the underground distribution system and perform restoration activities. The cablemen work rotating shifts and provide 24/7 coverage. Restoration activities are directed by the distribution operators.
PG&E Operations Centers include distribution operators who provide switching orders to direct switching and tagging, and issue clearances, and switchmen who perform field switching. Distribution operators work closely with the cablemen and the cable splicers within the M&C Electric Networks group to perform restoration activities and provide support to the M&C Electric Networks group.
Restoration activities may involve the network planning engineers, who may be consulted for guidance in reconfiguring the system to restore service.
For outages involving major customers, Major Account resources are involved in coordination with customers throughout the restoration.
Process
PG&E does perform periodic black start drills. These drills include processes for picking up network feeders.
Technology
Cablemen have mobile data terminals installed on their trucks.
7.6.13.14 - Portland General Electric
Operations
Outages Restoration
Emergency preparedness and response in the network is a shared responsibility among multiple groups, including the System Control Center (SCC), Distribution Engineers, and CORE underground group.
System Control Center (SCC): The SCC is usually referred to as Load Dispatch, and operators are known as load dispatchers, who are managed by the Transmission and Distribution (T&D) Dispatch Manager. The SCC has two distribution control regions and dispatchers are assigned geographically. From Monday to Friday, two dispatchers cover each of the two PGE regions.
One of the regions and therefore one of the dispatch desks includes downtown Portland and the CORE network. Dispatchers rotate between the two desks so that all dispatchers gain experience working with the network. The SCC employs eight dispatchers total who rotate between the desks on 12-hour shifts. Dispatchers are salaried employees (non-bargaining).
In real time, load dispatchers respond to alarms for feeder breaker lockouts on network feeders. If a network feeder locks out, the dispatcher calls the duty engineer and duty general foreman (DGF) of the CORE underground group. The CORE underground group performs the troubleshooting and determines the restoration approach.
Note that while PGE has a remote monitoring system in its network, it does not send alarms associated with network protector behavior from this system to the dispatchers, as this information could overwhelm the dispatcher. However, dispatchers have access to the remote monitoring system so that they can proactively ascertain conditions on the network.
Line dispatchers know a range of systems, including Maximo, Asset Resource Management (ARM) Scheduler, and ArcFM. They should also understand the PGE-IBEW work rules and related Oregon Public Utility Commission (OPUC) regulations. Line dispatchers must have an associated degree or 1-3 years of experience in a related field.
Distribution/Network Engineers: Three Distribution Engineers cover the underground network and are responsible for supporting the operation of the network, including assisting dispatchers and field force with emergency preparedness and response. The Distribution Engineers are not based in the Portland Service Center (PSC) or CORE group. The Eastern District Central Supervisor, who reports to the Manager of Distribution and T&D Standards, oversees them. The underground Distribution Engineers are qualified electrical engineers.
CORE Underground Group
The craft workers assigned to the CORE group, a part of the PSC, focus specifically on the underground CORE, including both radial underground and network underground infrastructure in downtown Portland. Their responsibility includes operations and emergency response of the network infrastructure. An Underground Core Field Operations Supervisor leads the CORE group. This supervisor reports to the Response & Restoration Area Line Manager (ALM).
Special Tester: PGE CORE has a Special Tester position, who is a journeyman lineman with additional training and technical skills. Special Testers are actively involved with troubleshooting the system, including responding to voltage complaints and fault location. The Special Tester usually partners with cable splicers, working as part of a crew.
Process
In an emergency involving the network, the SCC works closely with the CORE Underground group and Distribution Engineers to respond. The response depends on the situation. As an example, PGE described a situation in which it had a smoking manhole and lost two of four primary feeders supplying a network. After conferring, the distribution engineer and load dispatcher decided to drop the network to avoid overloading of the equipment.
PGE has developed a safety procedure that informs emergency operating procedures for abnormal conditions in the CORE area. The procedure is focused on safety, including guidance for notification and securing the area to protect workers and the public. To develop the incident-specific response, PGE relies on the experience of its people to make these decisions. It has not developed written guidelines related to unforeseen events occurring on the network, such as when to drop the network or how to respond to a smoking manhole.
During an emergency,PGE follows the principles of the incident command system (ICS). Employees are well-versed in ICS at the management level.
Emergency Drills: PGE conducts system-wide outage restoration drills once a year, prior to the fall storm season. In the past, this included some scenarios that involved the CORE network system. The scenarios that impact the network have historically been associated with the substation. PGE also conducts annual earthquake drills, a tabletop exercise that sometimes involves the network substations.
The Business Continuity Group develops and runs emergency drills. While network scenarios have been included at the substation level, these drills have historically not been used to simulate problems with network infrastructure beyond the substation.
Incident Management Center: Portland has seen the United States’ first incident management center to promote disaster preparedness. The center, operated by PGE in partnership with Western Energy Institute (WEI), Concordia University-Portland, and Organizational Quality Associates (OQA), provides training and education for utilities. The new Incident Management for Utilities National Training Center is located at Concordia University’s Columbia River Campus, close to Concordia’s Center for Homeland Security Studies and Homeland Security Simulation Center. The simulation laboratory offers training in incident management and emergency response, sharing instructional resources and supporting mutual aid [54].
Compliance Training: PGE conducts periodic compliance training, including training to assure that employees properly respond to emergencies. Compliance training includes vault rescue, pole top rescue, and all other federally mandated training. The vault rescue class is a company-wide training program undertaken annually, with workers training in a shallow vault. Because the CORE group often works in deeper vaults than the one used in training, it has augmented this training with more specific vault rescue training geared to the network vaults. This training takes place in a live vault. PGE also provides annual computer-based training on confined space practices.
Fire Department Training: PGE may coordinate with the Portland Fire Department (PFD) for training and cover what actions to take if there is a fire in a vault or manhole. PGE used to run exercises on a yearly basis with the PFD and intends to reestablish these. If a vault rescue is needed, the Portland Fire Department (PFD) utilizes their own rescue equipment. The PFD’s response time is good because it operates from locations across the downtown area.
Overhead Training: CORE journeymen need the experience of working on primary overhead lines so that they are qualified to work on the overhead system and participate in restoration work when needed. By design, the CORE supervisor ensures that his journeymen gain this experience on an annual basis through the performance of simulated training. The training yard is used to set up a simulated scenario with de-energized lines so that the journeymen can practice working with overhead systems. Underground linemen generally work in two-man crews on wire-down situations during a storm.
Accident Response: During an accident, PGE procedures dictate that the crew should call the SCC with the relevant information. In addition, either the crews or SCC contact emergency services. The SCC completes an online form that is distributed to approximately 150 people automatically, and calls out the safety coordinator responsible for the network. In addition, PGE has a Crisis Response Team that responds to situations of employee injury. Representatives of this team travel to the hospital with the injured employee and notify the family. Using this team removes the burden from the SCC. This protocol was implemented approximately 10 years ago [51].
Technology
Because of its inherently redundant design, most network system outages do not result in customer outages.
PGE migrated to an Oracle NMS outage management system, which is based upon WebSphere technology [34]. Oracle NMS is a scalable distribution management system that manages data, predicts load, profiles outages, and supports automation and grid optimization. The system combines the Oracle Utilities Distribution Management and Oracle Utilities Outage Management systems in a single platform. The system supports outage response and the integration of distributed resources [35].
Oracle NMS blends SCADA function and geographic information system (GIS) models to combine as-built and as-operated views of the system. The application includes a number of advanced distribution management functions, including network status updates in real time, monitoring and control of field devices, switch planning and management, and load profiling. Oracle NMS can integrate with other SCADA and GIS systems, and monitors network health using data from a number of systems. The NMS includes a simulation mode for training and supports switch planning and control.
Oracle NMS maintains a network model that handles the whole grid, includes every device, and integrates with existing systems using standards-based protocols, such as Inter-Control Center Communications Protocol (ICCP), Common Information Model (CIM), and MultiSpeak-based web services. The system can also integrate with a range of GIS and Advanced Meter Infrastructure (AMI) systems [36].
PGE’s NMS/OMS integrates outage information and location, switching functions, and work management. The system allows operators to see present system status and other operational data, and a data model predicts outage locations [35]. During outage events, operators can manage outage calls, assign and manage crews, and use the Maximo database to locate assets in relation to customers without power. The OMS also integrates with the GIS and Customer Information System (CIS), which allows customers to access outage information [15, 34,]. Other functions within the OMS include the following:
Automatic Vehicle Location (AVL): As part of the new OMS, the AVL allows crew locations to appear on the NMS map. This allows operators to dispatch the closest crew to an outage. Asset Resource Management (ARM): PGE can now route service work and design construction orders through Maximo to WebSphere, and from there to the ARM system. Crew information from laptops can be sent to the system for retrieval. Oracle Utilities Analytics (OUA): Using OUA, operators can view if a crew dispatch is successful, and the system allows crews to view any pending work orders in their feed. Safety functions: The OMS uses the AMI to improve safety during outages. The AMI pings meters to determine on/off status during an outage event, allowing operators to determine if outages can be cleared from the OMS and free crews for other restoration priorities. In addition, meters send a “last gasp” message to the AMI system when they are about to run out of power.
- Concordia University-Portland and Western Energy Institute. “Nation’s First Incident Management Center for Utilities Launched.” Press release, April 20, 2015. https://centerforemergencysolutions.com/sites/default/files/Utility-Incident-Training-News-Release.pdf (accessed November 28, 2017).
- R. Lewis II. “Mobile Tools Maximize Productivity at PGE.” Transmission and Distribution World, January 27, 2015. http://www.tdworld.com/features/mobile-tools-maximize-productivity-pge(accessed November 28, 2017).
- D. Handova, “PGE: Driving Customer Value With Network Management Systems.” EnergyCentral.com. http://www.energycentral.com/c/iu/pge-driving-customer-value-network-management-systems(accessed November 28, 2017).
- Modernize Distribution Performance All the Way to the Grid Edge. Oracle, Redwood Shores, CA: 2015. http://www.oracle.com/us/industries/utilities/network-management-system-br-2252635.pdf(accessed November 28, 2017).
- Modernize Grid Performance And Reliability With Oracle Utilities Network Management System. Oracle, Redwood Shores, CA: 2014.
- Smart Grid Report. Portland General Electric, Portland, OR: 2017. http://edocs.puc.state.or.us/efdocs/HAQ/um1657haq16327.pdf (accessed November 28, 2017).
7.6.13.15 - SCL - Seattle City Light
Operations
Outages - Restoration
People
SCL’s procedures for responding to network emergencies are not formally documented. SCL does not perform regular drills to practice restoration procedures to the network.
Process
Outage Drills
SCL does not regularly conduct drills to practice restoration of outages to the network. Note that SCL Operators do conduct routine outage drills / blackstart drills; however, these drills normally are not focused on responding to network problems.
Design
From a design perspective, SCL breaks the network load into small, isolated “sub-networks” to limit the number of customers exposed to an outage in the event of loss of any one sub-network.
Operations Practices — Emergency Response/Restoration
During high load conditions, the System Operator polls the network using the DigitalGrid (Hazeltine) system four or five times a day to understand field loading and voltage conditions. SCL System Operators maintain a list of customers that are fed by each network feeder so that they can contact customers to curtail load during critical periods.
The Operations Center does not have a means for a group load pickup for network feeders, nor a written procedure that describes the processes for responding to a network blackout. The last time they encountered the need to pick up multiple feeders, they sent multiple crews to various locations and performed a countdown — three, two, one, close — to close multiple switches at the same time.
7.6.13.16 - Survey Results
Survey Results
Operations
Outage Restoration
Survey Questions taken from 2018 survey results - safety survey
Question 18 : For 208 V network protectors, do you de-energize the network transformer before removing the network protector fuses?


Question 19 : For 480 V network protectors, do you de-energize the network transformer before removing the network protector fuses?


Survey Questions taken from 2015 survey results - Operations
Question 114 : For 208 V network protectors, do you de-energize the network transformer before removing the network protector fuses.


Survey Questions taken from 2012 survey results - Operations
Question 7.10 : Do you have documented, up to date procedures for responding to network emergencies?


Question 7.12 : Do you have a means to do a group feeder pickup in the event of a network outage? (Multiple feeders)


Survey Questions taken from 2009 survey results - Operations
Question 7.13 : Do you have documented, up to date procedures for responding to network emergencies? (This question is 7.10 in the 2012 survey) (This Question is 7.10 in the 2012 survey)


Question 7.14 : Do you have a procedure that provides guidance in responding to vault fires?

Question 7.15 : If so, does it provide guidance to an Operator indicating when it is necessary to de-energize a network due to the emergency?

Question 7.16 : Do you have a means to do a group feeder pickup in the event of a network outage? (Multiple feeders) (This question is 7.12 in the 2012 survey) (This question is 7.12 in the 2012 survey)

7.6.14 - Picking Up Multiple Feeders after a Network Outage
7.6.14.1 - AEP - Ohio
Operations
Picking Up Multiple Feeders after a Network Outage
Technology
As AEP is updating its network substations, replacing mechanical relays with microprocessor based relays, it is installing master trip and close systems for networks that enables group feeder trip or pick up from the distribution control center or the station. The system includes the ability to enable or disable any of the particular feeders in a network group.
7.6.14.2 - Ameren Missouri
Operations
Picking Up Multiple Feeders after a Network Outage
People
Ameren Missouri has the ability to pick up multiple feeders after a network outage, via a group pick up switch at the substation.
Process
At the substation, Ameren Missouri has the ability to either open an entire network, or close the entire network (all feeders simultaneously) using a group feeder pick up switch.
7.6.14.3 - CEI - The Illuminating Company
Operations
Picking Up Multiple Feeders after a Network Outage
People
The responsibility for restoring outaged network feeders lies with the Distribution System Operator, in conjunction with the UG network Service Department.
Process
In the event of the loss of all network feeders, CEI does not have a method for picking them up simultaneously. If this were to happen, CEI would have to assign switchman to each feeder and close the feeders individually and simultaneously.
Technology
Network feeders, supplied at 11kV out the Hamilton substation, are not individually remotely controlled through SCADA. The DSO can obtain status information on these feeders and can remotely control the bank breaker at the sub, but not the individual feeders.
CEI does not have the ability to remotely pick up multiple network feeders after a network outage.
7.6.14.4 - CenterPoint Energy
Operations
Picking Up Multiple Feeders after a Network Outage
Process
In the event of the loss of all network feeders, CenterPoint has a method for picking them up simultaneously. If this were to happen, CenterPoint would close the transformer breaker with the feeder circuit breakers already closed.
7.6.14.5 - Con Edison - Consolidated Edison
Operations
Picking Up Multiple Feeders after a Network Outage
People
The System Operations Control Center operators.
Process
Outages
Con Edison’s System Operations Control Center has control of primary feeders. If a feeder trips, it is the responsibility of this control center to clear the feeder. More specifically, the System Operations Control Center is responsible for tasks such as troubleshooting the feeder, applying grounds, performing testing, and using Con Edison’s Reactance to Fault (RTF) system to predict the location of the fault.
Because of Con Edison’s network design and N-2 contingency planning, most faults that result in feeder lockouts (“Open Autos,” in Con Edison lexicon) do not result in customer outages. For reports that do come in from customers, a ticket is created by the Con Edison Call Center in their outage management system with a customer address. The linkage between the customer’s account and the electrical location is not automatic. The Distribution Operator adds a structure number to the outage ticket, indicating the location on the electrical system. When this assignment is complete, information about these outage tickets can be displayed on the map. Con Edison is working on automating the process for assigning a structure number to a customer address.
When the fault is located and the feeder is scheduled for work, the System Operations Control Center hands the feeder over to the Manhattan (or other regional) Control Center to accomplish the work.
When work is done, the Manhattan Control Center gives control of the feeder back to the System Operations Control Center. System Operations verifies that the feeder is ready to be re-energized by test, and then puts the feeder back in service.
Con Edison Operators can view the status of feeders on their “Feeder Board,” available through their Heads Up Display (HUD). One feature of this display is that if two feeders are out of service, the feeder board highlights common holes — that is, vaults or manholes that contain both out-of-service feeders.
Con Edison carefully manages the time of the outage of a feeder. Feeder restoration time during hot periods at Con Edison has been significantly reduced, from about 36 hours to around 13 hours on average. The utility’s target is to have feeders out of service for no more than 14.7 hours during high temperatures. (14.7 hours was arrived at by targeting reductions in the various components that comprise outage duration.). Note that this target applies to both unplanned feeder outages (Open autos) and planned outages.
Technology
Picking up Multiple Feeders in the Event of a Network Outage
Con Edison has installed a network start-up and shutdown panel for picking up multiple feeders at one time in the event of the loss of an entire network. The panel brings the controls for all breakers to two points in the station, because stations are designed to service two networks. The panel is connected to the operator at the System Operations Control Center.
Con Edison has a scheme to shed load as the frequency drops or if the rate of change in the frequency exceeds a given threshold. The system prioritizes the feeders that it drops. For example, the scheme sheds overhead load first.
7.6.14.6 - Duke Energy Florida
Operations
Picking Up Multiple Feeders after a Network Outage
Process
In the event of an outage, field crews would go to each vault and check to see that all protectors are closed with the handles in the auto position. Then, Troublemen at the substation would reenergize two of the three feeders supplying the network (close the breakers) simultaneously. Finally, the third feeder would be reenergized.
Technology
The DCC does have the ability to remotely operate the feeder breaker for the network feeders in Clearwater. They do not have a group feeder pick up switch, to close breakers simultaneously.
7.6.14.7 - Duke Energy Ohio
Operations
Picking Up Multiple Feeders after a Network Outage
People
Duke Energy Ohio has the ability to pick up multiple feeders after a network outage, via a group pick up switch at the substation.
Duke has a documented process to describe using this feature and periodically tests this functionality.
The training received by every trouble man includes operation of the group feeder pick up.
Process
At the substation, Duke has the ability to either open an entire network, or close the entire network (all feeders simultaneously) using the group feeder pick up switch.

Figure 1:
Group Feeder Pickup Switch (Note instructions for correct operations displayed on clip board)
7.6.14.8 - Georgia Power
Operations
Picking Up Multiple Feeders after a Network Outage
Process
Georgia Power is in the process of installing group feeder switches at select substations to pick up multiple feeders after a network outage. At these substations, Georgia Power would then have the ability to pick up an entire network from another bus segment at the station by closing the feeders simultaneously.
7.6.14.9 - HECO - The Hawaiian Electric Company
Operations
Picking Up Multiple Feeders after a Network Outage
People
The responsibility for restoring outaged network feeders lies with the Dispatch Center, in conjunction with the C&M Underground Group.
Process
In the event of the loss of all network feeders, HECO does not have an automated method for picking them up simultaneously. If this were to happen, HECO would have to pick up the feeders individually using SCADA, or assign a switchman or PTM to each feeder and close the feeders individually and simultaneously.
Technology
Network feeders can be remotely monitored and controlled through SCADA at HECO.
7.6.14.10 - National Grid
Operations
Picking Up Multiple Feeders after a Network Outage
People
Distribution operators within the regional control center are responsible for executing network load shed and restoration.
National Grid has a well written procedure that provides operating guidelines for a network load shed and restoration. The guideline includes network primary cable ratings, network secondary cable ratings, detailed descriptions of required operator action in contingency situations, detailed descriptions of the potential results of an various primary feeder contingencies on the network during peak conditions, and procedures the operator must follow in the event that the shedding of network load is ordered.
Process
National Grid does not have a network group feeder pickup switch that simultaneously opens or closes network feeder breakers.
Rather, their procedure requires the opening of substation bank breakers in order to drop network feeder load simultaneously, followed by the opening of the individual breakers, then followed by the closing of the bank breakers to restore any radial (non-network) circuits. The procedure also describes switching to restore network load.
Technology
National Grid does not have a network group feeder pickup switch that simultaneously opens or closes network feeder breakers.
7.6.14.11 - PG&E
Operations
Picking Up Multiple Feeders after a Network Outage
People
PG&E has the ability to pick up multiple feeders after a network outage, via a group pick up switch at the substation.
Process
At the substation, PG&E has the ability to either open an entire network, or close the entire network (all feeders simultaneously) using a group feeder pick up switch.
Technology
PG&E has embarked upon a five year project to implement a new fiber optic based SCADA monitoring system for their network. The new system will have group open, group close, transfer trip capability, controlled from the operations center.
7.6.14.12 - Portland General Electric
Operations
Picking Up Multiple Feeders after a Network Outage
People
System Control Center (SCC): Load dispatchers at the SCC have SCADA control of network feeders.
Process
Load dispatchers in the SCC notify the general foreman before they close any breaker to ensure that the crews are not currently working in any of the vaults on that feeder.
Technology
PGE has a simultaneous close capability at its network substations that closes all network feeder breakers at the same time. It does not have a group open switch.
7.6.14.13 - SCL - Seattle City Light
Operations
Picking Up Multiple Feeders after a Network Outage
Process
The Operations Center does not have a means for a group load pickup for network feeders, nor a written procedure that describes the processes for responding to a network blackout. The last time SCL encountered the need to pick up multiple feeders, they sent multiple crews to various locations and performed a countdown – three, two, one, close – to close multiple switches at the same time.
SCL’s procedures for responding to network emergencies are not formally documented. SCL does not perform regular drills to practice restoration procedures to the network. Note: SCL does document and drill restoration procedures for outages to the non-network parts of their system. These drills normally exclude outages to network facilities.
7.6.14.14 - Practices Comparison
Practices Comparison
Operations
Group Network Feeder Pickup

7.6.14.15 - Survey Results
Survey Results
Operations
Picking Up Multiple Feeders after a Network Outage
Survey Questions taken from 2012 survey results - Operations
Question 7.12 : Do you have a means to do a group feeder pickup in the event of a network outage? (Multiple feeders)


Survey Questions taken from 2009 survey results - Operations
Question 7.16 : Do you have a means to do a group feeder pickup in the event of a network outage? (Multiple feeders) (This question is 7.12 in the 2012 survey)

7.6.15 - Primary Trouble Man (PTM)
7.6.15.1 - HECO - The Hawaiian Electric Company
Operations
Primary Trouble Man (PTM)
People
HECO utilizes an employee classification called “Primary Trouble Man” or PTM. PTM’s are responsible for operating the distribution system, responding to trouble, and for obtaining clearances and placing safety tags. Organizationally, the PTM’s are part of the Construction and Maintenance organization, although they work closely with the Dispatchers in System Operations. See Attachment K
PTM’s work alone, as a one-man crew. They will perform switching on HECO’s distribution system up to 25kV. At 15kV they will switch with facilities energized. At 25 KV, PTM’s will only switch de-energized facilities.
PTM’s are assigned light duty trucks equipped with the tools they need to perform their job.
PTM’s receive 6000 hours of training from both HECO and from the State of Hawaii. This includes training and certification from the Northwest Lineman’s College.
HECO has also implemented a training program where Trouble Dispatchers spend time in the field with PTM’s to become familiar with the PTM role and to build relationships between these two key work classification types. (See Trouble Dispatcher Training).
Process
At HECO, PTM’s perform all of the sectionalizing required for the crews to obtain clearance to perform work on a circuit. In contrast to a “substation operator” position common at many utilities, the PTM’s will operate devices out on the distribution system. This includes operating overhead and padmounted switches, cutouts, transformer primary switches, and lifting elbows on dead front equipment. PTM’s will place safety tags at the direction of the dispatcher to indicate isolated cable sections. PTM’s will respond to trouble, determine and isolate the location of faults, and restore service to customers where possible.
PTM’s work very closely and collaboratively with Cable Splicers from the underground group. By focusing on operation of the system, the PTM’s effectively free the UG crews to focus on construction and maintenance activity.

Figure 2:
PTM using Chance tester

Figure 2:
PTM operating transformer switch

Figure 3:
PTM opening cutout

Figure 4:
PTM preparing to open padmounted switchgear
Technology
PTM’s are assigned light duty trucks outfitted with the tools and equipment they need to perform their job. These trucks are equipped with mobile data units.

Figure 5:
PTM Truck
7.6.16 - Remote Monitoring - SCADA
7.6.16.1 - AEP - Ohio
Operations
Remote Monitoring - SCADA
People
AEP Ohio has a remote monitoring system installed in its networks.. The data monitored can vary depending on the level of monitoring in each vault, but includes protector status information, transformer data, and vault sensor information such as thermal event monitoring.
At the time of the practices immersion, monitored data had not yet been made available to the dispatch center, though this is planned for the future. At the time of the practices immersion, AEP Ohio had embarked upon the implementation of a new system that will enhance the monitoring and control capability of the system. This effort, planned for completion in 2018, is being led by the Network Engineering Supervisor and is being supported by a contractor.
Process
AEP Engineers can monitor network protector status, such as voltage, current, and whether the protector is opened or closed, as well as some vault and transformer sensors, such as thermal detection through its remote monitoring system. This system uses the Eaton VaultGard system, which provides data monitoring from the network protector MPCV relays and other sensors and provides a communications platform (see Figure 1).

Figure 1:
Wall-mounted control box for Eaton VaultGard
Technology
The enhanced network communications and control system will be built on a redundant, dual-loop fiber-optic network. The new network was successfully piloted in Canton and will be deployed in Columbus.
The new remote monitoring system will expand AEP Ohio’s monitoring and control capability, and engineers are in the process of deciding on the specific items to monitor. Items being considered include traditional measures such as loading, voltage, equipment status, fluid in the vault, fluid in the protector, and fire detection, as well as other measures such as dissolved gas monitoring, and rapid transformer pressure rise monitoring in selected vaults. AEP Ohio is also considering an enhancement that would enable the VaultGard system to gather information to perform secondary diagnostics.
AEP Ohio will have two network monitoring boxes wall-mounted in its vaults. One box contains the fiber-optic termination; the second contains microprocessor controls and interfaces to the network protector and any other remote sensors or controls to be installed in the vaults. Maintenance, inspection, and replacement of communications systems components and batteries are being added to NEED used by AEP for tracking asset inspection information and for managing maintenance.
7.6.16.2 - Ameren Missouri
Operations
Remote Monitoring - SCADA
People
Ameren Missouri has an existing remote monitoring system installed in their underground network system. This system uses ETI electronic metering in the network protector relay to monitor selected points within the vault, and aggregate them at a collector box mounted on the vault wall. This box communicates wirelessly over the cellular network.
Ameren Missouri implemented the system quickly in the aftermath of a particular event. Their post event analysis revealed that additional monitoring might have prevented the incident. In order to implement remote monitoring of their network quickly, Ameren Missouri visited a neighboring utility and adopted a similar approach.
Process
Using the ETI electronic relay in network protectors as part of its remote monitoring system, Ameren Missouri monitors various points within the vault, including voltage by phase, amps by phase (can monitor even with the protectors open), protector status via a switch installed on the NP handle position, moisture content within the protector, transformer oil top temp and water level in the vault via a float to detect standing water. Note that they are not using fire alarm systems in the vault.
The monitoring points are aggregated at a box mounted on the vault wall that communicates via cellular wireless through a third party called Telemetric. Telemetric is a third party vendor who aggregates the information from the remote monitoring system at their operations center in Idaho, and provides the summary of that information back to Ameren Missouri via software from Telemetric PowerVista by Sensus. See Attachment K.
The remote monitoring system records load readings every 12- 15 minutes and saves hourly averages to Ameren Missouri’s load reporting system. Ameren Missouri has the ability to poll the system to ascertain vault statuses such as NP position or oil top temperature. Ameren Missouri can also obtain graphical displays of historical readings from the system software.
The system issues emails and alarms to key operation supervisors triggered by certain readings, such as whenever a network protector opens.
Note that while the system offers the ability to remotely control the network protectors, Ameren Missouri has chosen not to implement this feature because of security concerns associated with the cellular system and third party involvement.
Ameren Missouri engineers noted that the implementation of this system has helped them identify places in the network where the system may operate differently than expected. They cited spot network locations where protectors were opening under lightly loaded conditions as an example. They also noted that they have changed relay settings on protectors at numerous locations where the system revealed improper settings.
The system has been fully operational for about two years. For the first year after the installation of the remote monitoring system, the information was being monitored by a small group of engineers to work out any problems. After one year, the system was turned over to the System Dispatch Center, with information from the system available to dispatchers via their SCADA screens.
Monitoring Indoor Rooms
Ameren Missouri is also in the process of implementing automated indoor room transfer schemes that would provide the ability to transfer load from the primary to reserve feeder either remotely from the dispatch center, or automatically though a transfer scheme.
Ameren Missouri’s current standard calls for two manual switches. If they lose a radial feeder, they must manually transfer the entire load on that feeder to reserve feeders to restore power and before implementing fault locating. This load transfer process is time consuming.
Ameren Missouri is considering a standard that includes two stand alone switches with an automatic transfer scheme. These new installations would provide a cabinet near the vault door so that the switches could be open remotely from the door as well as from the SDC using remote monitoring and control technology. They are considering an auto transfer scheme where the load swaps to the reserve feeder automatically, and are investigating the role of a DMS to arbitrate these decisions.
Technology
To implement their remote monitoring system, Ameren Missouri replaced all network protector electromechanical relays with electronic relays from ETI. Richards Manufacturing, the maker of the ETI relay, provided wiring and retrofit kits for both the Westinghouse and GE style network protectors.
At the time of the practices immersion, Ameren Missouri was investigating replacing protectors with a style that enables them to rack the breaker off the bus with the door closed and then rack it completely out.

Figure 1:
Remote Monitoring Communication Box

Figure 2:
Remote Monitoring Communication Box, mounted on vault wall

Figure 3:
Indoor Room Transfer Scheme
7.6.16.3 - CEI - The Illuminating Company
Operations
Remote Monitoring - SCADA
People
The CEI underground system is operated out of the Northern Region Regional Dispatch Office (RDO). Distribution System Operators (DSO) utilizes the company’s EMS system within provides monitoring and control capability.
Technology
CEI has little monitoring and control capability beyond the substation.
Network feeders, supplied at 11kV out the Hamilton substation, are not individually remotely controlled through SCADA. The DSO can obtain status information on these feeders and can remotely control the bank breaker at the sub, but not the individual feeders.
CEI is not utilizing any remote monitoring of network vaults and associated equipment.
Most of the 4kV system (non-network), which services a significant portion of the underground, is limited to status monitoring (open / closed), with no control. Many of these feeders are set with one shot to lock out, with no automatic reclosing.
7.6.16.4 - CenterPoint Energy
Operations
Remote Monitoring - SCADA
People
CenterPoint has implemented remote monitoring infrastructure in its network vaults. About ten years ago, CenterPoint embarked on a network rehabilitation effort that included replacing all older network protectors with ones that have communication enabled relays. At present, most network protectors in the CenterPoint system can be remotely monitored and controlled.
In addition, CenterPoint is presently expanding the level of monitoring and control beyond network in its larger vaults, to include things such as vault primary breaker status, transformer information (loading, oil temperature, etc), and water level alarms.
The design and implementation of the remote monitoring and control system is being led by a Consulting Engineer within the Major Underground Engineering department. The pulling of fiber to provide the communications backbone for the system is performed by Cable Splicers, with the fiber being pulled through the CenterPoint duct bank system. The Network Testers within the Relay group perform all the installation of sensors and control boxes and make all connections.
Process
All network protectors in the CenterPoint Major Underground system are equipped with communication enabled relays. From these units CenterPoint can remotely monitor network protector status, remotely operate the units, and obtain current and voltage readings.
In practice, CenterPoint is currently using this technology to remotely monitor equipment, but not to remotely control devices, as they have not yet reviewed and revised their clearance procedures to assure continued safe system operation.
The remotely monitored information is available to certain employees within Major Underground, such as planning engineers, and operations managers on the CenterPoint intranet. Alarms from remotely monitored equipment are sent via pagers to Crew Leaders and the duty foremen.
CenterPoint ultimately plans to provide information from their remote monitoring system to the Dispatchers, either directly, or through some other system such as a Distribution Management System. However, at the time of this writing they have not yet deployed remote monitoring of network equipment in dispatch, as they are still in a learning mode. CenterPoint considers this information to be secondary to SCADA as a tool for a dispatcher to monitor and control the system.
Currently, the remotely monitored information is being used as an early warning system. Major Underground resources receive an alarm, and they will respond. However, CenterPoint ultimately plans to use this information to revisit their maintenance approach. They hope to move away from their current cyclical approach to a more “just – in – time ” approach based on real time information about equipment status and condition.
Technology
The heart of CenterPoint’s remote monitoring and control system is the Cutler-Hammer MPCV (micro processor controlled) communication enabled relay, by Eaton. From these units, installed in their network protectors, CenterPoint can remotely monitor network protector status, remotely operate the units (although in practice, they do not), obtain current and voltage readings, and alarm things such as temperature, and water intrusion levels.
CenterPoint is also installing “intelligent” relays (SEL) in vaults to expand their remote monitoring capabilities. For example, in high side spot networks, CenterPoint is replacing electromechanical relays with the “intelligent” relays. Intelligent relays are also being installed in all 34.5 kV vaults. New construction is being designed with intelligent relay panels, even if the fiber backbone is not yet in place, so that they are ready to be connected to the communications system at a later date.


Figure 1 and 2:
'Intelligent: Relay Panel'
The remotely monitored information is available to selected CenterPoint employees through the CenterPoint intranet. The information is communicated via custom software that interfaces with the proprietary information provided by the Cutler-Hammer network protector relays and the SEL relays.
Certain employees can access remotely monitored information on the CenterPoint intranet, using computers in their trucks with wireless capability. CenterPoint reports that most of the Network Testers in the Relay group use this information routinely.
When CenterPoint first implemented the remote monitoring system, the communications medium was a phone line with a modem, tied into a communications module. Today, the main communication backbone is a fiber ring, pulled through CenterPoint’s duct system, which serves the down town and medical center locations. CenterPoint also uses DSL lines at selected locations.
7.6.16.5 - Con Edison - Consolidated Edison
Operations
Remote Monitoring - SCADA
People
The Distribution SCADA department is made up of 10 engineers, who are responsible for all the Distribution SCADA beyond the area substation.
Process
Con Edison uses a Remote Monitoring System (RMS) in every one of its network transformer vaults to remotely monitor and communicate information back to the office.
Technology
The RMS system uses power line carrier (PLC) technology to communicate monitored information from transmitters located in each vault, over the 60-cycle electric signal, to receivers located at the substation.
The RMS in use at Con Edison was originally designed at Con Edison’s request in the 1970s, by Hazeltine, with installation of devices beginning in 1982. The RMS system is made up of transmitters located in each of the transformer vaults, pick-up coils on every feeder at the substation that detect the PLC signal, and receivers at the substation that gather the information detected for a given network. From the substation, information is communicated back to the central office using telephone frame relay lines (TCPIC lines), that provide near-virtual connectivity, enabling Con Edison to download information from every receiver about every one minute.
At the substations, Con Edison is using receivers developed by Digital Grid. The utility has experienced good performance from these receivers. Con Edison is currently testing a receiver developed by ETI and is in the process of replacing older Hazeltine receivers with these newer units.
At network transformer vault locations, Con Edison uses transmitters from ETI and Digital Grid. Many existing installations are equipped with older transmitters from Hazeltine and BAE. The transmitter is connected to one phase of the network protector. The power connection is to network side of the network protector (always powered), and the signal wire connection is to the transformer side, so that if a network protector opens on light load, there is still a signal. In area substations that supply two networks, the transmitters on each network are connected to and transmit information over different phases.
As Con Edison has been using RMS for years, it has different “generations” of systems in place. In the first-generation installations, the RMS system monitors the three-phase % percent loading, and five status points such as network protector status or transformer temperature alarm status. In the second-generation installations, the RMS monitors three-phase % loading, three-phase voltage, eight status points, and two analog readings. In the latest generation installations, the transmitters have additional processing capability and can monitor things such as transformer tank pressure, oil temperature, and oil level status. The utility is also monitoring the Oil Minder System in those vaults that contain them.
Con Edison is effectively using its intranet to give employees access to this remotely monitored data. The utility has developed an on-line system, Net RMS, which enables all employees to view the information from their computers, including field laptops. The system is tied in with SCADA, so it displays which feeders are open and closed. The system also displays the % offload that will be picked up by the nearby vaults if a given feeder locks out, a useful tool in contingency planning.
Con Edison is planning to expand functionality of its RMS to be able to communicate with the network protector relay, and to gather additional information such as network protector temperature.
7.6.16.6 - Duke Energy Florida
Operations
Remote Monitoring (SCADA)
(Network Monitoring)
People
Duke Energy Florida performs monitoring of its Clearwater and St. Petersburg network infrastructure at its Distribution Control Center (DCC). The DCC group works closely with the network Group and field crews. While all dispatchers are responsible for monitoring and control of both the entire radial and network systems, select employees at the DCC have extensive network underground experience.
In addition, remote monitoring of network vaults is performed by the Network Group; specifically, Electric Apprentices and Network Specialists who work in that group.
Process
Using a combination of SCADA and Sensus software, Duke Energy Florida has the ability to monitor every network vault supplying the Clearwater network.
Network Protector Monitoring
Duke Energy Florida uses the Eaton VaultGard communication platform for recording and aggregating data from the network protector microprocessor (MPCV) relay as well as from other vault sensors (Qualitrol). This information is communicated through a Sensus cellular monitoring system to a central server every half hour. Within the Network Group, information about the protectors provided by the Sensus system is monitored twice per day (see Figures 1 through 3). Note that the Sensus system is read only, with the functionality to remotely control equipment being disabled for security purposes.

Figure 1:
Network protector (CM22 with MPCV relay)

Figure 2:
VaultGard and Qualitrol collection boxes mounted on vault wall

Figure 3:
Wall-mounted antenna for communication with Sensus system
Monitored information includes information about the protector itself, such as protector status (open or closed), how many times a protector has opened and closed and amperage, as well as information from other vault sensors, such as transformer oil temperature, and the status of the sump pump.
Information communicated by Sensus is provided to the DCC twice per day, morning and evening, and is routinely monitored by experts from within the Network Group, who also have access to the Sensus data. Daily, the Network Group records information monitored through this system.
DCC control screens indicate network protector status using color coding. From the main screen (provided by Sensus), operators can switch views to list the entire system of protectors, or select condensed lists queried by user defined criteria, such as number of operations to determine in which vaults, protectors are pumping or cycling.
By clicking on an individual network protector, operators can see how many times it has reported, what data it has reported, etc. Historical information is also available for each protector in graphic format. If operators receive alerts (the system communicates alarms based on predefined triggers, such as a drop in voltage) or find potential problems, they notify the field crew supervisor for a vault/manhole inspection. If network protector data is not received over Sensus, this would indicate the need for a repair inspection.
A resource (Network Specialist or Electrician Apprentice) within the Network Group monitors the network protector information daily and exports the data into graphs. Data is aggregated by day, month, and year, enabling seasonal analysis of the performance of the network protector fleet. The high level of network protector data collected provides engineers and planners with current and historic information, which informs their decisions. More importantly, it quickly reveals network protector issues and outages that are in need of inspection and/or repair.
In Clearwater, roughly one-third of all network protectors are open during any given 24-hour period due to light loading, particularly at night and during off peak months, and for the loss of a feeder.
The Sensus system is only used to monitor information - the functionality associated with remotely control equipment was disabled for security purposes. There are no plans to implement remote operation of network protectors in the Duke Energy Florida system.
Duke Energy Florida has not installed the Sensus monitoring system within its St. Petersburg spot network vaults.
Network Feeder Sectionalizing Switchgear (Rocker Arm (RA)) SCADA
Duke Energy Florida also utilizes its SCADA network to monitor and control its RA switchgear in Clearwater, using older radio communications. The RA devices are also equipped with remote reporting (through SCADA) fault monitoring using self-resetting Faulted Circuit Indicators (FCIs).
In practice, Duke Energy Florida has experienced communications issues with the radio system. Therefore, these switches are typically opened and closed by crews in the field when necessary. As these RA switches are about to be replaced with newer switchgear, Duke Energy Florida plans to upgrade to a newer communication platform.
ATS SCADA
Duke Energy Florida expanded its application of SCADA to monitor and control its automated transfer switches (ATS), which are prevalent in the primary / reserve feeder scheme used to serve customers outside of the network in Clearwater and in St. Petersburg. One complication to the addition of this monitoring was that the company did not anticipate the volume of alarms/alerts on the ATS systems. Since the network group was responsible for initially installing the new ATS system SCADA, the response fell to that group as well. As a result, the network group has stepped up the frequency of ATS Inspections to lower the volume of alerts.
DSCADA Migration
Duke Energy Florida is planning to deploy Distribution Supervisory Control and Data Acquisition (DSCADA) system-wide, such that it will provide for supervisory control over both the ATS’s and the network feeder sectionalizing. All ATS’s currently have the new DSCADA. Once new sectionalizing switches (replacing the RAs), RTUs, and an upgraded communications system are installed, the new sectionalizing switches can be linked to the system-wide DSCADA.
Alarms and Alerts from Sensus
The Sensus system includes an alarm and alert function — if a system threshold is crossed, an alarm is immediately sent in the form of text or email to Underground department staff (Network Specialists and crew Supervisor(s). The system enables anyone working on the network system to sign up to receive Sensus alarms, including authorized contractors. Account Managers utilize this feature for early warnings of potential problems, and to notify customers when load has been moved to the reserve feeder (in an auto transfer scheme), and that they are operating temporally with no contingency.
Technology
All vaults with network protectors report data in real time to the Duke Energy Florida DCC over wireless cellular communications using Sensus software for electronic monitoring. Daily, weekly, monthly, and yearly reports can be generated and printed or displayed at any time.
Duke Energy Florida uses Eaton VaultGard and Qualitrol data aggregation to its Sensus central monitoring system at the DCC. RA switchgear is over an older DSCADA system. ATS systems are on a newer DSCADA command and control system. RAs use FCIs over SCADA.
Network vaults are equipped with the VaultGard system, for monitoring network protector information. They are equipped with a Qualitrol system, for monitoring transformers and other vault information. Data from the Qualitrol system and from protectors are aggregated by the VaulGard system and communicated over a cellular network to the Sensus group (a third party), who then presents the information back to the Underground operations center.
Data is aggregated and sent to Sensus approximately every 30 minutes. The main monitoring system is then updated with reports from this aggregated data by Sensus three times per day. Frequent, 30-minute polling of data from locations is performed to keep the cellular connection active. When the systems were polled less frequently, the group experienced some loss of cellular connections. Operators can also go onto the system and get real-time results and updates on-demand. Although the network system group is satisfied with the Sensus capabilities and quality of monitoring, as upgrade plans move forward, the group will investigate if there are any other platforms that could be used.
The company has applied the VaultGard and Sensus monitoring to the vaults supplying the Clearwater grid network. All St. Petersburg monitoring is performed during regular, on-site maintenance. There is one spot network location with SCADA monitoring of the network protectors. The company is considering expanding the Sensus monitoring to St. Petersburg, but first must upgrade the current cellular communications infrastructure. (The current Sensus system communicates over 2G cellular.)
Duke Energy Florida is considering an upgrade to its cellular infrastructure, as its communications carrier will phase out the existing 2G system over the next few years. Duke Energy Florida is collaborating with Eaton (VaultGard), Sensus, and Qualitrol for a smooth upgrade plan to the new cellular infrastructure and monitoring system. All systems must communicate seamlessly, so it is essential that all the monitoring equipment and software vendors are is sync with Duke Energy’s requirements.
All communications equipment has been tested and hardened for cybersecurity. Their cellular communication carrier has partnered with Duke Energy to secure the systems.
7.6.16.7 - Duke Energy Ohio
Operations
Remote Monitoring - SCADA
People
Duke Energy Ohio is in the early stages installing remote monitoring within their network infrastructure. The effort is being led by the Network Planning Engineer, in partnership with the Asset Manager, Network Project Engineer, and the Dana Avenue supervision.
Duke presently has SCADA monitoring and control of the network feeder breakers, and alarms from its fire protection system.
Process
Duke Energy Ohio has been installing devices capable of remote monitoring and control in their network in tandem with their network infrastructure refurbishment efforts. (Duke has embarked upon a 10 year network refurbishment effort - see Network Rehabilitation ). Their goal is to rollout remote monitoring and control capability to 95% of their network installations.
In particular they have standardized on the Eaton CM52 network protector with MPCV communication enabled relays. As they replace or rebuild a network protector, they install communication enabled devices.
Duke field resources are installing the communication backbone. They are planning to complete a few pilot installations of remotely monitored network infrastructure in 2010.
Technology
At present, Duke Energy Ohio has little remote monitoring and control ability beyond the network feeder breaker. They have embarked upon a multiple year program to install remote monitoring in conjunction with network equipment refurbishment.
Duke Energy Ohio is installing Eaton CM52 network protectors with MPCV communication enabled relays.
Duke Energy Ohio is installing a hard wire fiber optic communication backbone. Duke field resources are pulling the fiber.
7.6.16.8 - Energex
Operations
Remote Monitoring - SCADA
People
Energex has 22 staff members called switching coordinators who operate its central control center on rotating shifts. The people in the control center rotate their positions on a regular basis, and any operator can monitor and/or control any segment of the Energex power grid, including the CBD underground network.
Switching coordinators are typically drawn from field staff ranks, usually either substation technician or mechanic and rapid response, with training specifically for the control room operation.
Control
Engineers who focus on telecommunications and SCADA control of the distribution systems within the CBD are organizationally part of the Standards group, within the Asset Management team. Their role is to modernize the Energex systems for better remote control and monitoring through its telecommunications network.
Up until a few years ago, Energex had separate engineering teams for SCADA and telecommunications. As the company saw the growth and usefulness of integrating remote monitoring and control capability in the greater design and operations of the Energex systems, these two groups (SCADA and Telecommunications), were brought back into the main Asset Management business. In the field, a group of paraprofessionals and engineering support personnel manage the work issued by Asset Management. The paraprofessionals have substation, telecommunications, and SCADA experience.
As a result of this realignment, SCADA/telecommunications has become more an integral part of the entire design and planning processes within Energex. The paraprofessionals handle installation and wiring of telecommunications, SCADA, and smart control systems. These crews install intelligent relays and data acquisition modules at substations as well as wire communications back to the control center.
Process
Control
Beginning in 2012, Energex began to implement a technology upgrade to both standardize automation and control technologies, and to cover a greater portion of its system-wide network. To this end, Energex has deployed a new Operational Technology Environment (OTE) in two network operation centers. These centers are separate from the corporate IT applications and systems, for both security and efficiency, and are in place to exclusively serve the evolving telecommunications and SCADA operations at Energex. For example, the OTE provides a secure IT environment for key operational systems, such as SCADA and Telecommunications applications. The OTE isolation from any outside network is a notable practice, as it protects the system from outside tampering, malicious software code, or cyber threats, all of which are concerns in the electric power industry today.
Energex utilizes SCADA facilities to perform remote monitoring and control of bulk supply stations, zone substations, and some rural substations and customer substations. The Substations Automation Control Systems (SACS) at zone and bulk substations provide the following functions:
-
Volt Var Regulation (VVR)
-
Plant Overload Protection System (POPS)
-
Remote Terminal Unit (RTU) functions
Each SACS is equipped with a Human Machine Interface (HMI) for control and monitoring operations by Energex personnel.
Throughout the 11 kV CBD and zone substations, Energex now has telecommunications and SCADA systems in place. Energex has full remote control over the three-feeder mesh network (See Network Design).
In expanding its remote monitoring and control capability to the distribution system, Energex’s initial focus was the 11 kV overhead systems, adding recloser automation to increase reliability.
Energex has now shifted its automation focus to the underground network. Energex has implemented a program to install monitoring system on new and existing distribution transformers, both overhead and underground, to increase knowledge of the loading and power quality associated with low voltage assets.
Technology
Energex has basic alarming installed in their medium voltage substations, such as alarms for an open circuit breaker, and general alarms, such as alarms for a battery charge, or sump pump. Substations within buildings may also have fire alarms that tie to the fire brigade station.
Communication is hard-wired from medium voltage stations back to an RTU at the station that supplies the primary feeder. From that station, information is communicated back to the SCADA system over a wide area network (WAN).
Some models of air-insulated transformers also send back data about the transformer condition to the control center. In addition, its human-machine interface (HMI) software is connected to cellular network interfaces located at all substations. Crews can then remotely monitor information from these local substations, such as alarms and alerts from SCADA-attached controls to the network.
Control
Numerous distribution feeder auto change- over schemes are deployed throughout their system as applications running within their Substation Automation Control System (SACS), or in Remote Data Concentrators (RDC). In addition, Energex is using a new DMS system (PowerOn DMS) for monitoring and controlling its distribution network.
Energex is focused on the following on-going technology initiatives and deployments related to telecommunications:
Standardized communications
Energex has deployed industry-standard Internet Protocol / Multi-Protocol Label Switching (IP/MPLS) communication networks to support current and future operational systems. By using industry standard Ethernet/IP for its base communication with remote devices and controls, the company has a broader range of tools, controls, and applications at its disposal, and a low risk of communication network obsolescence.
Optical fibre
Energex has committed to using optical fibre as the preferred physical media for its communication network links between substations. Fibre is fast, efficient, and is the IT industry medium of choice for telecommunications. Energex specifies fibre cabling in all new substations, and in the refurbishment of existing substations. In addition, to save on deployment costs, optical fibre links are included as part of new or refurbished distribution feeder projects. This approach leaves gaps that must be filled in by other projects – Energex has a focused program to fill in these gaps.
Replacement of obsolete equipment
Much of the existing copper cabling used in the Energex communication network is 30 to 40 years old, and nearing the end of its design life. The company is replacing this cable with optical fibre cable wherever practical. Similarly, the majority of its existing operational telecommunications network that covers the bulk and zone substations uses Plesiochronous Digital Hierarchy (PDH) technology, no longer supported by original vendors. Energex is in the process of replacing these links with fibre-based IP/MPLS wherever possible, or by using its secure mesh radio links that are common in its distribution system network.
Expansion of Distribution system SCADA (DSS)
Energex uses a secure mesh radio network to monitor and control DSS devices, such as reclosers and load break switches. They have expanded coverage by deploying additional head ends and repeaters to support the throughout the region to support remote monitoring and control of an additional approximately 500 DSS devices. Energex notes that this has significantly improved its network reliability and helped it meet its service target performance incentive scheme (STPIS) goals.
Future technology projects
In addition to its IP/MPLS and fibre standardization, Energex will leverage the data and new network capabilities in a number of ways. For example, with better data acquisition, the company will increase its knowledge of the loading and power quality of its low voltage assets. This will be critical to understanding and addressing issues associated with the challenges associated with technology changes such as the increasing penetration of distributed generation on the system.
In cooperation with Ergon Energy, Energex has embarked on a Joint Smart Grids Program to trial the use of smart asset management approaches to maximize the value of capital expenditure, or even defer projects that may not be found cost-effective after analysis in its distribution network. This program will involve technology trials in a targeted area north of Brisbane.
Energex also plans to focus on greater integration of substation secondary systems, including protection, SCADA, and telecommunications. Work underway includes time synchronization of protection relays, relay interface and coordination with SCADA, and migration of auto reclose functions from SACS to the protection relays to enable additional operational modes to provide improved worker safety.
7.6.16.9 - ESB Networks
Operations
Remote Monitoring - SCADA
People
Network operations at ESB Networks, including remote monitoring of the network, are performed by Operations Managers within the Operations group, part of Asset Management.
Organizationally, the Operations group is comprised of two Operations Management centers, one North and one South, a System Protection group, an Operations Policy group, and a Systems Support group.
The operations group includes MV managers, called a Customer Services Supervisor, for each of its 35 MV geographic areas, responsible for monitoring and controlling the MV and LV network.
Process
ESB Networks has deployed SCADA at most (98%) of their 38:10kV substations.
In medium and low voltage networks in Dublin, they have little remote monitoring beyond the substation. At the time of the immersion, they were piloting the use of remotely monitored and controlled devices at a medium voltage station (10-kV : LV), in Dublin.
ESB Networks’ OMS system provides an extremely detailed view of the network to the operator. The OMS prediction can point to a particular LV outlet coming out of any MV station. There are typically four LV outlets out of each MV station. These MV circuits are available to the operator in a schematic view.
Note that in their overhead 10 kV and 20 KV networks, ESB Networks has widely deployed SCADA to over 1000 switch locations.
Technology
ESB Networks utilizes the ABB Network Manager 3 (NM3) SCADA system, tied to its Oracle Utilities OMS system.
7.6.16.10 - Georgia Power
Operations
Remote Monitoring - SCADA
People
Test Engineers in the Network Operations and Reliability Group are responsible for remotely monitoring the network system. The Network Operations and Reliability group, led by a manager, is part of the Network Underground group, a centralized organization that manages all network infrastructures at Georgia Power.
Georgia Power has a Network Control Center, manned by Test Engineers, for monitoring and controlling network infrastructure. All existing vaults have remote monitoring equipment installed on network protectors that is tied in with SCADA. Communications to the central control room is through multiple avenues, including DSL, a dedicated licensed cellular, a dedicated radio network (SouthernLINC, a Southern Company radio network), and fiber optic network. When a new vault is built, Operations commissions it, performs the system testing, and makes certain SCADA is set up to remotely monitor the vault, and then is involved in the ongoing operations and maintenance monitor of each vault.
The Test Engineers are four-year or two-year associate-degreed Engineers. Test Engineers are responsible for network system operation, and work closely with maintenance crews, Test Technicians, Key Account representatives, and the Distribution divisions (Non – network operations) of Georgia Power.
Process
The Network Operations and Reliability group, from the Network Control Center, monitors every network customer vault and Georgia Power vault location, including attributes such as voltage, current, temperature, and vault fluid levels. In some locations, the center monitors custom sensors that are installed for monitoring fan operation, or doors being open or closed, for example.
Remote monitoring of the Georgia Power underground network system has been in use since 1990. The Network Control Center uses dedicated radio and cell frequencies to connect to SCADA systems in every vault. In addition, the center can monitor AMI metering at customer sites.
The Georgia Power Network Control Center only monitors and responds to alarms within the underground network system and its dedicated SCADA equipment. Non – network distribution infrastructure is operated by a separate Distribution Control Center. However, the Distribution Control Center is responsible for monitoring and controlling network feeders. So the opening or closing of a network feeder breaker is performed by the Distribution Control Center, in coordination with the Network Control Center.
Technology
All network protectors are connected to the Network Operations center by a SCADA system that runs on DSL, radio frequency, or fiber network connection to the Network Control Center. Protector monitoring and opening/closing of protectors can be performed remotely by operators within the Network Control Center (See Figure 1 and Figure 2). Remote monitoring and control of protectors has been in place at Georgia Power for about 15 years.

Figure 1:
Network Operations console

Figure 2:
Network Operations console
All network protectors are connected to the Network Control Center by a SCADA system, ESCA (Alstom). This is the same SCADA system used for substation control and their distribution automation system. The system communicates by DSL, radio frequency, or a fiber network connection to the network operations center where protectors are monitored by the Network Operations staff. Remote monitoring has been in place at Georgia Power for 15 years.
The Network Operations center typically monitors the following information from the network protectors:
-
Current
-
Voltage
-
Protector Open or Closed
-
Fluid in the vault
-
Fluid in the protector
Access to the Network Control Center is locked for use by authorized personnel only, and operators must securely log into the Control Center console(s) once inside.

Figure 3:
Submersible vault wall – mounted remote monitoring system control box
7.6.16.11 - HECO - The Hawaiian Electric Company
Operations
Remote Monitoring - SCADA
People
The HECO underground system is operated out of the Dispatch Center. The Dispatch Center is comprised of two dispatch desks, and one supervisory desk. The dispatch desks in include the “Load dispatch” desk and the “Trouble dispatch” desk. HECO does not have a distinct desk or dispatcher position for monitoring and operating its network infrastructure.
Technology
HECO has little monitoring and control capability beyond the substation breakers. Most 12kV feeders do have SCADA monitoring and control at the breaker. Network feeders, also supplied at 12kV, are remotely controlled and monitored through SCADA.
Distribution circuits below 46kV are not shown on their EMS map board, with the exception of the 12kV system in Waikiki which supplies their network secondary system.
HECO is not utilizing any remote monitoring of network vaults and associated equipment, with the exception of some water level alarms in certain vaults.
7.6.16.12 - National Grid
Operations
Remote Monitoring - SCADA
People
National Grid has remote monitoring and control of all network feeders in New York East at the substation.
National Grid does not have any remote monitoring of their underground network system beyond the feeder breaker, primary or secondary. The only exception to this is Henry St. Station in Glens Falls, one of two stations feeding a small network in the city of Glens Falls.
Process
National Grid’s Distribution Planning group has developed a specific recommended strategy for upgrading the secondary network system, which includes the addition of remote monitoring. In developing this strategy, each network was studied to determine whether to keep the network, expand it, shrink it, or eliminate it. The specific investment strategy for each network would be dictated by this overarching direction. As an example, an investment for remote monitoring may be an appropriate strategy for a network planned for expansion, but not for a network planned for elimination.
Technology
Part of National Grid’s strategy for upgrading the network system is to test the viability of technology for remotely monitoring and controlling the network. This pilot will be targeted at a small network system for which National Grid has determined a strategy of either contract, maintain, or expand. The pilot will include technology to monitor and control network equipment, and be compatible with National Grid’s SCADA system.
The pilot is planned to include:
Network Protector Master Relay (may vary between relay manufacturers)
-
Network voltages
-
Differential voltages
-
Phasing voltages
-
Phase angles
-
Current - phase a, phase b, phase c
-
Transformer voltages
-
Power
-
Power factor
-
Relay state/status
-
Relay calling for trip, close, float
-
Block from closing
Auxiliary inputs:
-
Transformer:
-
Pressure sensor
-
Low oil level sensor
-
Temperature sensor
-
-
Network protector:
-
Temperature inside network protector
-
Pressure sensor
-
Breaker problems (some network protectors have diagnostics)
-
Fluid level
-
-
Vault:
-
Vault water level
-
Vault temperature
-
Unauthorized entry alarm
-
7.6.16.13 - PG&E
Operations
Remote Monitoring - SCADA
People
PG&E has an existing remote monitoring system installed in their underground network system. They have embarked upon a five-year project to replace the existing network remote monitoring system with a modern system that provides increased monitoring and control.
PG&E’s current SCADA system was installed in the mid 1980’s. The system provides some remote monitoring information including open/close status of network protectors, and load current on the feeders (through the protectors). The current system, however, has no control capabilities. PG&E does have remote monitoring and control of the feeder breaker.
The current SCADA computer system is maintained by the corporate Information Technology Department, and not by Distribution Operations. A crew of five (5) contract technicians is responsible for the maintenance of the system, supervised by a senior PG&E telecommunication engineer.
The information provided by the SCADA system (loading and protector status) can be accessed by PG&E personnel through the “Network Historian”, a PG&E developed graphical computer system. This system provides authenticated users a 15-minute delayed graphical representation of the underground system, and corresponding status of the network protectors. Users can drill down as well as aggregate load information using this software system.
Due to the importance of the five-year project to replace and upgrade the SCADA monitoring system in the network, PG&E has assigned a senior engineer to manage the project. This engineer will work with contracted field crews to install the new SCADA equipment. For example, the installation of the sensors on existing equipment was contracted to one vendor, who had the expertise with the equipment currently installed. The pulling of fiber was contracted to another vendor.
Process
Beginning in 2009, PG&E began to upgrade the existing system by installing fiber, adding sensors, and replacing the electro-mechanical relays in the network protectors with microprocessor controlled relays that are connected to SCADA remote terminal units.
Also in 2009, PG&E piloted the project and refined the implementation plans based on lessons learned from the pilot. For example, the pilot revealed the need to hire a contractor to install the new sensors because of the expertise required to do so (drilling, thermal welding, etc).
In 2010, PG&E implemented the new SCADA on half of a feeder group (34kv). In 2011, they will complete the installation of the new system in that feeder group, and in subsequent years, expand the installation to the rest of the system. The project is scheduled to be completed within 5 years.
Some of the features of the new system include:
- Installation of new fiber optics. The fiber optic system will be aligned with the network it is designed to work with. The fiber optic network is designed to be self healing, that is, looped to and from the same substation. This will enable the continued monitoring of the network group even if the fiber optic cable or SCADA system is damaged at any single point. For example, if the system is compromised at a certain location (for example a “dig-in”), communications would automatically be routed from the other direction.
PG&E is installing additional fiber count so that the system is “smartgrid” ready and can be used for potential future applications such as demand side management, and distributed generation (DG) dispatch.
- Installation of a complete monitoring system that that includes pressure, temperature, and oil level on each chamber, NP tank pressure, voltage, and current. PG&E is also considering adding hydrogen gas monitoring, Total Dissolved Combustible Gas (TDCG) sensors, and additional vault monitoring, such as intrusion sensors, in a later phase of the project.
The monitoring system will also include vault attributes such as SCADA battery level, distributed generation monitoring, motion detection, smoke alarm, ventilation, oil in water, sump monitoring, and sectionalizing switch position. (Network feeders are designed with sectionalizing switches. These switches will be tied to SCADA, but PG&E will not add remote control to these devices until a later date).
- Remote operating capabilities for the network protectors will include remote open/close and station transfer trip.
Unlike the current system, the individual network loops will match the associated network group to provide for group operation and monitoring capabilities. This will enable PG&E to control the network group as a whole (close and open the group) in case of a fire in a vault. This eliminates the need to program, which individual component on the network would be opened, and instead the whole group would be disabled. In addition the new SCADA system provides a “transfer trip” capability whereby should the substation breaker be “tripped”, all of the Network Protectors on that feeder would be notified via the SCADA and trip automatically rather then waiting for internal relays to pick-up a reverse feed. This will prevent the hanging of Network Protectors, and speed up the clearance process that PG&E currently uses.
Technology
In 2009, PG&E began to upgrade their system, replacing electro-mechanical relays in protectors that were connected to SCADA remote terminal units. They chose the Eaton MPCV relays and Eaton VaultGard translator units with Qualitrol sensors to report on transformer oil. The Eaton VaultGard translates Eaton’s relay protocol to PG&E’s preferred protocol, DNP.
Every vault will be fitted with a fiber transceiver (Model 570) H&L Instruments (hlinstruments.com). This is a self-healing loop system, which heals itself in less than four milliseconds. It is able to carry up to 128 channels of communications at up to 115kbaud, and includes two Ethernet ports, which will allow the VaultGard’s web server to be viewed at the distribution control center as well as in the vault.

Figure 1:
Network transformer with remote monitoring. Note transformer monitor panel mounted on top of unit

Figure 2:
Close up of transformer monitoring panel
7.6.16.14 - Portland General Electic
Operations
Remote Monitoring - SCADA
People
PGE has a remote network monitoring system installed at all network vault locations that gathers and reports information from the network protector relay.
Network monitoring is the responsibility of various groups including the System Control Center (SCC), Distribution Engineers, and the CORE underground group.
The SCC is usually referred to as Load Dispatch, and operators are known as load dispatchers who are managed by the Transmission and Distribution (T&D) Dispatch Manager. The SCC has two distribution control regions and dispatchers are assigned geographically. From Monday to Friday, two dispatchers cover each of the two PGE regions.
One of the regions and therefore one of the dispatch desks includes downtown Portland and the CORE network. Dispatchers rotate between the two desks so that all dispatchers gain experience working with the network. The SCC employs eight dispatchers total who rotate between the desks on 12-hour shifts. Dispatchers are salaried employees (non-bargaining).
Load dispatchers have SCADA installed on network feeder breakers. At one of its two network substations, a feeder lockout results in an alarm and page being sent to a preset distribution list, including the Distribution Engineers and CORE group supervisor. If a breaker locks out on a network feeder, the dispatcher calls both the duty engineer and duty general foreman (DGF) in the CORE underground group. The DGF assembles the appropriate crew to respond to the alarm, isolate the fault, and resolve the issue.
Though PGE has a remote monitoring system installed at each network protector location, this system is not connected to the SCADA system. PGE does not bring alarms from this monitoring system back to the dispatch center, as it does not want to inundate the dispatchers with alarms from protectors that may have opened under light loading conditions. Dispatchers can call up the network monitoring system on custom screens developed in Pi (OSIsoft). In the event of a network feeder lockout, dispatchers can access the remote monitoring system to confirm that the network protectors have opened.
Distribution Engineers and all CORE group resources can access remote monitoring system information through the Pi system. The network monitoring system is checked daily for any issues, but no paging notifications or alarms are triggered.
Process
At the substation level, PGE has SCADA monitoring and control on the network feeder breaker, and can receive alarms from one of the two stations supplying networks. Note that with the completion of PGE’s new substation, PGE will have alarming on all network feeders.
At each network vault, PGE can remotely monitor information at the network protector, including the voltage and all three-phase currents on both the transformer and bus sides of the protector. In addition, PGE can monitor the real and reactive power, power factor, temperature, and whether the network protector is open or closed.
The monitoring system is known internally as the “blue wire” system, as the twisted pair wires feeding into each protector are blue. PGE’s looped fiber system converts and communicates information from the protectors.
Load dispatchers, Distribution Engineers, and CORE underground resources have access to the remote monitored information through the “Pi” system (OSIsoft) using customized interface screens developed by PGE. Users can select any network and see the voltages and currents on each NP, as well as determine whether they are open or closed.
When a network feeder is opened as part of planned work using a shutdown order, the CORE group is responsible for checking the remote monitoring system to confirm that all the network protectors have opened. Load Dispatch performs a secondary verification when crews and substation wiremen call to request rack-out and tagging of the substation breaker. If the system indicates that a protector is still closed, the dispatcher contacts the responsible individual listed on the shut-down order to notify the individual that a particular NP still shows as closed, and to investigate.
PGE is utilizing the remote monitoring system to better understand the health of the network. For example, PGE uses the system to determine locations where protectors may be open and drive analysis.
Technology
Remote Monitoring: PGE is using the Eaton Mint II system (Master Incom Network Translator) with a PowerNet server platform interface and with the optic fiber to the Mint II monitors set in a H&L Fiber Loop configuration. The H&L Instruments system converts the fiber communications to the protocol used on the NPs, and vice versa.

Figure 1:
MINT II
At present, PGE only uses the system for monitoring and not for control. PGE is assessing the Eaton VaultGard monitoring system to harden the system, using the looped fiber optic communications already installed throughout the downtown area. The reason for looking at VaultGard is that it is a web-based protocol with integrated software that allows a higher degree of control.
Most of the monitored information is sent to and stored in an OSIsoft Pi system. Pi allows engineers and operators to view the load flows at each network protector. The Pi system can collect large volumes of data from multiple sources and helps users view, analyze, and share information [52].
H&L Model 570 INCOM Communications Adapter: The adapter translates Eaton Cutler-Hammer INCOM network signals to and from ten-character ASCII-encoded message format. The INCOM Communications Adapter is installed in the Model 570 Transceiver in the factory, and it translates daisy-chained signals from the INCOM protocol devices to the H&L Fiber Loop III system. It translates signals from a number of devices, including multiple microprocessor communications variant (MPCV) relays in the network protector, IQ analyzers and meters, and switchgear [53].

Figure 2:
H&L fiber optic transceiver
Communications System Upgrades: PGE has acquired a 220 MHz radio spectrum block to replace its older land mobile radio system. The utility also acquired a 700 MHz spectrum block to serve data transmission requirements, including distribution automation, SCADA, demand management, and customer smart devices. In 2018, PGE intends to complete the process of installing base stations to provide connectivity across the system.
In addition, PGE intends to phase out the leased copper lines used to connect SCADA with its substations, and replace them with a private Ethernet network by 2020 to support the monitoring of thousands of data points in each substation [15]. For generating plants and T&D substations, PGE uses high-reliability optic fiber for monitoring and control. Retail meters send information via a wireless network at low speed, and some substations use low speed connections or cellular systems.

Figure 3:
Vault wall-mounted control box
7.6.16.15 - SCL - Seattle City Light
Operations
Remote Monitoring - SCADA
Technology
Remote Monitoring of the Network
SCL has installed a system developed by DigitalGrid, Inc. (formerly Hazeltine, and referred to by SCL employees as “the Hazeltine System”) to monitor their network equipment. This system uses power line carrier (PLC) technology for communication. (Communication signals are sent through existing utility power cables) SCL has been using this system for years, and has some degree of remote monitoring in all network vaults.
The DigitalGrid system is used to monitor:
-
current
-
network protector status
-
voltage
-
power factor
-
digital and analog sensors
-
vault ambient air temperature
-
various flags, such as:
-
B - Network Protector Open
-
C – Transformer Oil Temp
-
E – Transformer Oil Level
-
G – Smoke (currently being piloted)
-
The system also has alarm features for current, voltage, network protector pumping, sensors, and flags, and is tied in with the Distribution Operator consoles.
SCL utilized a pilot approach to evaluating and selecting their monitoring technology. They established pilots with products from three different vendors. In the process, SCL evaluated not only monitoring capability, but also control technology, because they are interested in implementing distribution automation in their network. (More specifically, they are seeking ways to be able to remotely operate network protectors, and to shift load from one primary feeder to another.) The result of this evaluation was that the DigitalGrid system that they have in place best suits their monitoring needs. SCL is still interested in piloting network distribution automation.
Monitoring
SCL does not use distribution-level SCADA on their network, but they do have access to the remote monitoring system (DigitalGrid). They have a separate console for accessing this remote information, and alarms from this system are available at each dispatcher console.
The SCL Dispatchers have access to the NetGIS system through a network viewer. This viewer enables them to view the contents and configuration of each network vault.
Operations Practices — Vault / Network Fires
SCL’s current design standard calls for fire protection heat sensors and temperature sensors in their vaults. The heat sensors are designed to open all the network protectors in the vault when the heat sensor registers 225°F. The temperature sensors send an alarm to the dispatcher at 40°C. (SCL utilizes temperature sensors in about 20% of their network transformer locations. They are actively adding locations, with a goal of 100% coverage.)
7.6.16.16 - References
EPRI Underground Distribution Systems Reference Book (Bronze Book)
7.6.16.17 - Survey Results
Survey Results
Operations
Remote Monitoring - SCADA
Survey Questions taken from 2019 survey results - Inspection Practices survey
Question 29 : For primary sectionalizing or tie points installed on your Urban UG system, excluding auto transfer schemes at customer sites, are the switches manually or automatically controlled?


Question 30 : Do you remotely sense / monitor information about devices beyond the primary feeder substation breaker?


Question 31 : If you are remotely monitoring information about equipment beyond the primary feeder breaker, is this information tied in with your SCADA System?


Question 32 : On your network system, do you have the ability to remotely control switches, network protectors or other devices on your system beyond the substation breaker?


Question 33 : If so, what devices are remotely controlled?


Question 34 : On your non- network urban underground system, do you have the ability to remotely control switches, or other devices beyond the substation breaker?


Question 35 : If so, what devices are remotely controlled?


Survey Questions taken from 2018 survey results - Asset Management survey
Question 30 : Do you remotely sense / monitor information about network devices beyond the primary feeder substation breaker?


Question 31 : If you remotely monitor information about network devices, please indicate what information you are monitoring.


Survey Questions taken from 2018 survey results - Manhole Event Preparedness and Response
Question 21 : Do you remotely sense / monitor information about network devices / vaults beyond the primary feeder substation breaker?


Question 22 : If you remotely monitor information about network devices / vaults, please indicate which of the following you are monitoring. (Check all that apply)


Survey Questions taken from 2015 survey results - Operations
Question 107 : Do you have a dedicated operator within your dispatch center/control room for operating the network?

Question 108 : Do you remotely sense / monitor information about network devices beyond the primary feeder substation breaker?

Question 109 : If you remotely monitor information about network devices, please indicate what information you are monitoring. (check all that apply)


Question 110 : If you are remotely monitoring information about network equipment beyond the primary feeder breaker, is this information tied in with your SCADA system?

Question 111 : Do you have the ability to remotely control switches, network protectors or other devices on your network system primary beyond the substation breaker?

Question 112 : If so, what devices are remotely controlled? (check all that apply)


Survey Questions taken from 2012 survey results - Operations
Question 7.2 : Do you remotely sense / monitor information about network devices beyond the primary feeder substation breaker?

Question 7.3 : If you remotely monitor information about network devices, please indicate what information you are monitoring. (Check all that apply)


Question 7.4 : If you are using remote sensing, how is the information communicated? (check all that apply)


Question 7.5 : If you are remotely monitoring information about network equipment beyond the primary feeder breaker, is this information tied in with your SCADA System?

Question 7.6 : Do you have the ability to remotely control switches, network protectors or other devices on your network system primary beyond the substation breaker?

Question 7.7 : If so, what devices are remotely controlled?

Question 7.8 : If you do remotely control devices, indicate from which location(s) you have the ability to do so.

Question 7.9 : If you are remotely monitoring and/or controlling network equipment, what vendor/system are you using?

Survey Questions taken from 2009 survey results - Operations
Question 7.2 : Do you remotely sense / monitor information about network devices beyond the primary feeder substation breaker?

Question 7.3 : If you remotely monitor information about network devices, please indicate what information you are monitoring. (Check all that apply)


Question 7.5 : If you are using remote sensing, how is the information communicated? (check all that apply) (This question is 7.4 in the 2012 survey)


Question 7.6 : If you are remotely monitoring information about network equipment beyond the primary feeder breaker, is this information tied in with your SCADA System? (This question is 7.5 in the 2012 survey)

Question 7.7 : Do you have the ability to remotely control switches, network protectors or other devices on your network system primary beyond the substation breaker? (This question is 7.6 in the 2012 survey)

Question 7.8 : If so, what devices are remotely controlled? (This question is 7.7 in the 2012 survey)

Question 7.9 : If you do remotely control devices, indicate from which location(s) you have the ability to do so. (This question is 7.8 in the 2012 survey)

Question 7.10 : If you are remotely monitoring and/or controlling network equipment, what vendor/system are you using? (This question is 7.9 in the 2012 survey)

7.6.17 - Sound Coil
7.6.17.1 - CEI - The Illuminating Company
Operations
Sound Coil
People
The Sound Coil is an induction device used by CEI underground crews to aid in determining whether or not a cable is energized. It was developed by a CEI employee and has been used at CEI for many years.
Process
CEI crews utilize a device called a Sound coil, to aid them in feeder identification, and in determining whether or not a cable is energized. See Determining a Feeder to be De-energized. The UG Electrician will simply attach the device to the cable and listen for a tone, which would indicate that the cable is energized.
The sound coil is not “foolproof”. CEI has experienced dead cables that emit a tone.
CEI relies on a combination of its manhole prints and the sound coil device to identify de - energized cables.
Technology
The Sound coil is an induction pick up coil that sounds a tone if the cable is energized. The device works on both lead and non-lead cables, and is used a tool by CEI crews to indentify a cable.

Figure 1:
CEI Sound Coil
7.6.18 - Temporary Overhead Jumpers
7.6.18.1 - HECO - The Hawaiian Electric Company
Operations
Temporary Overhead Jumpers
People
When HECO experiences a failure in a direct buried secondary or service cable, they will make a temporary repair that may involve the installation of a temporary overhead jumper. Temporary Overhead Jumpers are usually installed by Overhead C&M crews.
Process
HECO’s current standard is to install all underground facilities, primary and secondary, in conduit. Primary conduits are concrete encased as are secondary mains and services to commercial customers. Other secondary and service conduits are direct buried.
However, HECO has significant amounts of older distribution where the secondary or service conductors themselves are direct buried, and many have bare concentric neutrals. Consequently, HECO has experienced significant secondary and service failures with this cable.
When HECO experiences a failure in a direct buried secondary or service cable, they will dispatch a Primary Trouble Man (PTM), who will troubleshoot the problem and attempt to make a temporary repair. In some cases, the PTM will call out an Overhead C&M crew to make a temporary repair that involves the installation of an overhead jumper lashed to overhead facilities, such as the street light system. A PVC pipe will be used as a riser, and the jumper will extend from the pad mounted transformer through the riser overhead, and then to the customer’s meter base, “jumping” the failed underground cable and restoring service to the customer (see pictures below).
One challenge HECO faces is the timely scheduling of the permanent repair, which will involve running a conduit to replace the service or secondary cable section. As a result, these temporary jumpers may stay in place for a long time.
Technology

Figure 1:
Temporary Jumper Installation Note the riser (PVC Pipe) guyed to the transformer

Figure 2:
Temporary Jumper Installation Close up of OH wire egress from transformer in flexible pipe

Figure 3:
Temporary Jumper lashed to street light structure

Figure 4:
Temporary Jumper Installation Meter base attachment
7.6.19 - Three Phase Transformer Change Outs – Hot Cap Proc
7.6.19.1 - HECO - The Hawaiian Electric Company
Operations
Three Phase Transformer Change Outs – Hot Cap Procedure
People
“Hot capping” is a process that is performed by the Cable Splicers of the Underground Group at HECO, in combination with the PTM’s, when changing a three phase transformer. The term “hot cap” refers to the placement of a cap on a cable system connector, such as a splice, elbow, or T body, after separating the connector. After the cap is installed, the feeder is reenergized, thus the term “hot cap”. At HECO, the term “hot cap” refers to a three part (and three day) process used to change a three phase transformer that involves the installation of a hot cap.
The PTM’s perform the switching in three phase transformers required to de-load the feeder. The UG group performs the hot cap itself as well as the replacement of the transformer.
Process
HECO’s standard design for serving three phase customers with pad mounted three phase transformers is to run two primary feeders (12kV) to the transformer, with one being the normal feed and the other being a back up feed. The feeders are brought into a manhole or hand hole in front of the transformer where taps are fed into the transformer from the main feeder through separable connectors such as T – bodies.
The three phase transformers HECO uses contain an internal primary switch. (In locations where they have transformers without an internal switch, the design includes a separate switch.) When HECO must replace one of these three phase transformers, they implement a process called a “Hot Cap”, that enables them to isolate and replace the transformer with out interrupting service to customers (other than the customer for whom the transformer is being changed). As described above, the procedure is referred to as a hot cap because it involves the placement of a hot cap at one of the taps.
The Hot Cap procedure involves many switching steps, and is scheduled over a three day period.
Step One involves performing switching to unload the alternate feeder feeding the transformer to be changed. This involves going to each three phase transformer normally served by this feeder, and switching the load to an alternate feeder. After the feeder is unloaded, the feeder is opened, so that a crew can cut or separate the line going from the hand hole into the transformer, and cap it. The feeder is then re-energized – so the capped cable becomes a “hot cap”.
Step Two involves performing switching to unload the normal feeder serving the transformer so that it can be opened, de-energizing the transformer to be changed. To accomplish this, a PTM would go to every transformer served by this feeder and switch the load to an alternate feed. After this feeder is opened, and the transformer to be changed is deenergized, a crew would change the transformer. When the feeder is closed, the transformer would be energized, restoring service to the customer.
Step three involves performing switching to again unload the alternate feeder so that the hot cap can be repaired. After, more switching is performed to return the system to a normal configuration.
Technology
This process utilizes three phase transformers with internal primary switches and designs that utilized separable connectors.

Figure 1:
Picture of three phase transformer with internal primary switch
7.7 - Planning
7.7.1 - Asset Management
7.7.1.1 - AEP - Ohio
Planning
Asset Management
People
Asset management, including the prioritization of new service, refurbishment, repairs, and civil works, is performed by the AEP Network Engineering group in tight collaboration with other Distribution Services organizations that are part of the AEP parent company. The company employs two Principal Engineers and one Associate Engineer who serve as asset managers for the AEP Ohio networks in Columbus and Canton. These engineers are geographically based in downtown Columbus at its AEP Riverside offices, and are organizationally part of a Network Engineering group that provides direct engineering services to the AEP Ohio network, and consulting support services to the other AEP operating companies. Columbus-based Network Engineers work in collaboration with other AEP Distribution services organizations and the Network Engineering Supervisor. The Network Engineering group reports to the AEP Network Engineering Supervisor, who in turn reports Distribution Systems Planning Manager. Distribution Systems Planning reports to the Director of Engineering Services who in turn reports to the AEP Vice President of Customer Services, Marketing and Distribution Services.
AEP also has a Network Standards Committee, headed by the lead Network Engineering Supervisor in its downtown Columbus offices, and comprised of representatives from all AEP operating companies. This group works closely with the parent company’s Distribution Services organizations, and holds regular teleconference sessions on network findings, “lessons learned” in the field, and discusses potential network engineering solutions to common network planning and implementation issues. This committee oversees asset management activities within AEP Ohio.
Regular inspections of network assets, including manholes, vaults, transformers, network protectors, and duct lines are performed by AEP by a combination of resources. When assets are in need of maintenance, the inspections are used to determine the appropriate remediation of the finding, and the priority of the solution, whether it be deploying new assets or performing repairs. AEP Ohio has a field inspector position whose primary job is to perform asset inspections. This role is also performed by Crew Supervisors.
Process
A notable practice at AEP Ohio is its use of a comprehensive asset management system (Network Electric Equipment Database System - NEED) for organizing information about asset performance and prioritizing asset work. During the regular inspection process of its assets in the field, Crew Supervisors report any assets that need attention, such as crumbling vault concrete, leaking transformers, etc. These inspection results are logged into the AEP’s NEED, an electronic database of assets and asset conditions. The AEP Ohio Network Engineering group, in tight communication with the Network Standards Committee, has developed expected repair schedules that are triggered by the severity of the inspection findings. NEED is used to trigger inspection and maintenance sheets in accordance with these schedules.
Note that cable assets are also compiled in CYME SNA and exported to AEP’s geographic information system (GIS) system for access throughout AEP.
Technology
Inspections are logged into the AEP NEED database, a work management system.
7.7.1.2 - Ameren Missouri
Planning
Asset Management
People
Asset management for network equipment is the responsibility of multiple individuals at Ameren Missouri, as it does not have a distinct asset management organization. Rather, asset management duties are distributed among responsible individuals within Energy Delivery Technical Services and Energy Delivery Distribution Services.
Local Distribution Planning is responsible for making investment decisions based on their analyses of the implications of forecasted load on the system. Local distribution planning for both the network and non network underground infrastructure in St. Louis is the responsibility of the engineering group within the Underground Division. The Underground Division is led by manager, and consists of both engineering and construction resources responsible for the downtown infrastructure. Organizationally, the Underground Division is part of Energy Delivery Distribution Services, reporting to a VP.
Decisions about investment in network equipment such as transformers and network protectors are the responsibility of Distribution Operations, and are based on equipment condition as determined through inspection and maintenance findings. This group, led by a manager, reports organizationally to the Vice President of Energy Delivery Distribution Services. Distribution Operations is comprised of both the field resources (Distribution Service Testers) who perform network equipment inspections and conduct network equipment maintenance, and the engineering resources who analyze the information from the inspection activity and make decisions of whether to repair or replace network equipment based on the findings.
Decisions about investment in maintenance or repairs of structures such as manholes, faults, or duct banks are the responsibility of engineers responsible for civil and structural design within Energy Delivery Technical Services. This group is responsible for determining inspection approaches for structures, and for developing strategies for responding to inspection findings. In addition, this group develops standards for structure design and repair. For example, this group was responsible for changing Ameren Missouri’s vault standard to include requirements such as a thicker ceiling to meet a traffic rating requirement, and using larger grate openings.
Finally, Ameren Missouri has formed the “Underground Revitalization Department,” a team of engineers (all 4-yr degreed) focused on researching, evaluating, and developing plans for performing capital improvements to and revitalizing downtown St. Louis, including the network. Part of this group’s role includes addressing issues such as the development and update of planning criteria for the network, cable and network transformer replacement strategies, development of route diversity criteria, development of the criteria for manhole covers, and a criterion for conduit system replacement.
Process
The Underground Revitalization Department is taking a broad strategic view of Ameren Missouri’s network assets, and is serving as the prime asset manager through their work to develop revitalization plans. This five-man team is identifying problems with the current infrastructure, and using this to create a strategy for revitalizing the system balancing cost, practicality, reliability, and capacity.
They have formed nine strategy teams focused in the following areas:
-
Route Diversity
-
Distribution Automation and SCADA
-
Sectionalizing
-
Inspection and Maintenance
-
Cable Diagnostics
-
Manhole Covers
-
Conduit Systems
-
Cable Replacement
-
Transformer Replacement
Two further groups will be added in the future as the project enters the implementation phase:
-
Reducing Collateral Damage
-
MLK (new switching station) Cutover Strategy
The teams are developing strategies, as well as detailed plans for applying those strategies to the downtown infrastructure.
At the time of the practices immersion, all but two of the strategy teams had drafted their strategies, helping the underground group decide exactly what is required and exactly what improvements need to be made to the network. The improvements and upgrades to the system are expected to span ten years, but Ameren Missouri believes in developing all of the strategies at the outset, and training in – house people who will be involved with the process from the very start, and thus develop an intimate knowledge of the systems.
Ameren Missouri is moving to a condition-based approach for equipment replacement, following an assessment of the performance and condition of a line or component. Ameren Missouri has implemented a two-year inspection cycle for network vaults and a four-year cycle for network manholes. They have developed a draft criteria used to evaluate, manage, and prioritize replacement of network transformers and protectors within downtown St. Louis. These criteria are based on key considerations such as the transformer’s age, location, physical condition, loading, history with similar transformers styles, and oil quality. Note that at the time of the EPRI practices immersion these criteria were in draft form.
See Design – Network Revitalization for more information. for more information.
7.7.1.3 - CEI - The Illuminating Company
Planning
Asset Management
People
FirstEnergy has both a Corporate Energy Delivery Asset Management organization focused on company wide asset management issues and CEI regional individuals within their Engineering Services group focused on CEI asset issues. The Asset Management organization was formed at FirstEnergy in 2007 to focus on asset health and performance and to optimize investments. The group’s mission is to maximize the value of T&D asset investment by assessing the health and condition of the infrastructure, and developing strategies in alignment with corporate and business objectives. Regional asset management is performed by individuals within the regional Engineering Services organization.
The Corporate organization has a forward looking focus, identifying new methods and guidelines, and providing assistance to the field. The group is focused on three Asset Management sub processes – Capital Project Prioritization, Compliance Oversight, and Asset Health and Condition. A Senior Engineer within the Asset Health and Condition group is focused specifically on the underground asset health issues.
Regional Asset Management focuses on the specific challenges faced by each region. Until a recent company reorganization, regional Asset Management was a distinct department that reported directly to a Regional President. As part of the reorganization, FirstEnergy elected to weave regional asset management resources into the Engineering Services organization. Regional asset management individuals develop strategies for extending asset life, and include Circuit Reliability Coordinators (CRC’s) who perform field reliability audits. The initially focus of Asset Management has been primarily on the overhead distribution system. Asset Management plans to get more involved in underground asset management in the near future.
See Network Reliability Index - People
Process
One focus of the Asset Management group is asset health and condition. In this area, they are focused on the development of Health Manuals, the development of performance scorecards, and on business case analysis. They endeavor to stay current on industry trends, and are involved in industry organizations in an effort to bring back and apply best practices at FirstEnergy.
For example, they are investigating diagnostic testing methods for cable in order to develop diagnostic testing guidelines. In doing so, they have attended industry conferences and are involved with leading cable diagnostic initiatives underway at organizations such as the CDFI (NEETRAC), IEEE, and AEIC.
They have produced a draft Underground Health Manual that defines underground equipment types, provides a high level asset inventory, describes FirstEnergy preferred practices for the inspection and maintenance of underground assets, and describes methods for consistently performing and documenting reliability assessments and developing an underground health scorecard. See CEI Urban Network Practices Report (1015894) .
The Asset Management group has developed a “scorecard” for power transformers and is presently working on developing a scorecard that will rank underground feeders.
The corporate group also provides guidelines and templates to assist the regions in developing business cases for projects. These guidelines help the Regions to value projects so that they can better prioritize. The Corporate templates provide a guideline, but the regions have the ultimate say in project rankings as they may have local knowledge of reliability or other issues that rank one project more highly than another.
Technology
For business case development, FirstEnergy is utilizing a prioritization tool called the ECAT model, developed with the assistance of Navigant Consulting.
The tracking of individual facilities is maintained by the Region. Asset information is kept either in maps, GIS, or SAP depending on the asset type. For assets with a defined maintenance period (like manholes, network transformers and network protectors), the assets and the maintenance plans are housed in FirstEnergy’s SAP system. This system defines the maintenance period and “schedules” the maintenance by moving the work to the FirstEnergy scheduling system (CREWS).
For example – manholes are to be maintained once every five years. The Manhole records are housed in SAP, and have a maintenance plan assigned. As the maintenance of a particular group of manholes comes due, the SAP system will move the work to Crews, so that a scheduling employee can create a work request out of the CREWS system to complete the maintenance.
The completion of the maintenance work on underground distribution assets is tracked manually at CEI.
FirstEnergy presently has no complete Asset Register for recording and reporting distribution asset performance information. They are in the process of installing Cascade, a system that will house all inspection data and will interface with other key systems such as CREWS, their outage management system (Power On), etc. Cascade will track inspection and maintenance accomplishment and provide CEI with record of what field inspectors are finding. They will be able to perform inspections using hand held devices and the data collected will feed cascade.
The actual maintenance record for Substation assets will reside in Cascade. For distribution assets, the final maintenance record will reside in either SAP or their GIS system (to be determined).
To perform field assessments, the CRC’s are recording information using Panasonic “Tough Books”.
7.7.1.4 - CenterPoint Energy
Planning
Asset Management
People
CenterPoint Energy does not have a distinct network Asset Management organization. Rather, network asset management activities such as analysis of equipment performance, and asset investment planning and implementation are incorporated into CenterPoint’s Major Underground Organization.
7.7.1.5 - Con Edison - Consolidated Edison
Planning
Asset Management
People
Con Edison does not have a distinct network Asset Management organization. Rather, network asset management activities such as analysis of equipment performance, and asset investment planning and implementation are incorporated into Con Edison’s overall Network Organization.
7.7.1.6 - Duke Energy Florida
Planning
Asset Management
People
Power Quality, Reliability and Integrity (PQR&I) has responsibility for all Asset Management at Duke Energy Florida. Within that department, network assets throughout Florida are managed by three Asset Managers.
One Asset Manager, based in Clearwater, is assigned to managing network assets, including secondary cable, as well as other assets such as capacitors, regulators, electronic and hydraulic reclosers, and sectionalizers.
Another Asset Manager in PQR&I manages underground primary cable assets, including primary network cables, the cable testing program, single-phase and three-phase transformers, and transformer paint repair.
A third Asset Manager within PQR&I manages programs for replacement, repair, and inspection of switchgear and automated transfer switches (ATS).
Asset managers are not required to hold four-year degrees; however, all have extensive OJT and electrical engineering training.
In the past, switchgear, cable, and the network equipment were the responsibility of one Asset Manager. Currently, the management of network assets by the PQR&I Asset Management group is spread out over three Managers: one for cable assets, one focusing on switchgear, and another for all other network equipment. All three act as a Network Asset Management team, with complete communication and collaboration. Even though asset responsibility has been divided up, all three members have the capability of stepping in to help in any area in case of vacations, leave, etc.
The PQR&I Governance organization gives the Network Asset Managers the ability to shift funds between areas (switchgear, cable, and equipment, for example). If funds are underutilized in one area, they can be reallocated to another area in need. Governance can also step in and reallocate under-utilized funds from completely different operating units corporate-wide to fund areas of need.
Duke Energy Florida is utilizing a contractor to perform their cable replacements in Clearwater and St. Petersburg. The contractor crews are supervised by two Network Specialists to provide oversite and coordination to the contractor crew. The contractor performs all aspects of the work, including cable pulling. The contractor will obtain and hold clearances, though the work of executing the switching to obtain the clearance is performed by Duke Energy employees.
Process
Led by the Asset Manager responsible for primary cable systems, Duke Energy Florida conducts routine cable diagnostic testing to determine the integrity of its primary cables, utilizing the services of a cable diagnostic testing contractor. Cable testing is age-based – with cables selected for testing that are 25 years or older, or that are suspect based on performance. Duke Energy Florida tests 80 segments per month over a nine-month period per year. The diagnostic testing performed by the contractor is not feasible in all situations, depending on factors such as manhole placement, circuit configuration, circuit condition, or feeder operation. Cable replacement decisions are driven by diagnostic test results. Depending on test results, the PQR&I group will determine whether a cable has integrity and remaining life or needs replacement. If replacements need to be made, the other Asset Managers who deal with circuit components are consulted to identify equipment replacement needs on the identified circuits.
Duke Energy also performs routine cable replacements that are based on cable age and performance history, rather than on diagnostic testing results. This is the case in St. Petersburg, where older cables are being replaced based on age and performance history, as these cables were not appropriate candidates for diagnostic testing (because of significant branching of cable sections.) Note that the Integrity Engineer within PQR&I tracks cable outages even if customers are not affected. The PQR&I organization has decided that piece-meal repair or replacement of small sections of cable is not an efficient way to rehab aging cable systems as this approach generates many small and ultimately more expensive jobs. Rather, Asset Management seeks to replace whole sections of cable identified for replacement by age, performance history, or diagnostic test results.
At the time of the practices immersion, Duke Energy Florida had not tested the three feeders supplying the Clearwater network.
Asset Management is in the process of incorporating cable testing prior to energization of new cables into their program. The company believes this commissioning testing to be a good quality control check that can forestall outages.
In addition to cable replacement, the PQR&I Asset Management group also maintains listings of components targeted for replacement, including older T – Body (medium voltage 600 A separable connector) locations, and secondary mole locations. The Manager uses a spreadsheet to organize, prioritize and schedule replacement of these components, and seeks to incorporate the component replacements with associated cable replacements wherever possible. The costs of these repairs are included in the budget established for the cable replacement.
The asset management group has also targeted oil insulated underground primary switches for replacement, prioritizing these devices for replacement based on age and condition, impact on operations, and concerns for safety during operation. Duke Energy is replacing these oil-filled devices with solid dielectric vacuum switches.
Technology
Duke Energy Florida uses contractor cable testing that includes a checklist of over 170 cable conditions. The specific approach to diagnostics is proprietary.
7.7.1.7 - Duke Energy Ohio
Planning
Asset Management
People
Duke Energy has an Asset Management organization that includes a group referred to as Reliability and Integrity (R & I) Planning[1]. Within this group (R & I) there are resources focused on distribution integrity, looking at such things as inspection and maintenance approaches for assets of different type, and resources focused on reliability performance. This group is centered in Charlotte, with two resources, one Integrity resource and one Reliability resources focused on supporting Duke Energy Ohio, as well as other areas of the company.
The Asset Manager for Distribution Integrity collaborates closely with the network planning engineer (Part of the Distribution Planning organization), the network engineer, Dana Avenue construction supervisors, and the Asset Manager for Reliability. In addition, the asset management group works closely with the standards department.
Process
The Asset Manager for Distribution Integrity works very closely with the DANA Underground group to develop appropriate inspection and maintenance and rehabilitation activities for network equipment. The R & I asset managers serve as internal consultants to operating areas such as the Dana Underground group. They focus on getting the appropriate resources in place to allow the operating areas to “get on with their job". One area of initial focus for the asset manager for distribution integrity was to work with the construction group to identify the need for an engineering position focused on the network.
When the R & I group was formed their first task was to learn what activities were taking place at Dana Avenue. For example they looked at the inspections that were underway. One of the first activities they got involved with was looking at issues with spare parts of network equipment. They worked closely with a network engineer, network planning engineer, and Dana Avenue construction supervision to identify appropriate quantities of spare equipment for the network. They also assisted Dana Avenue with establishing an inventory record.
A key focus of the asset management group is collecting data about asset type, vintage, condition, and performance and assisting the operating area by developing recommended maintenance, inspection and equipment replacement strategies and justifying the cost of those programs.
Some examples of new programs and changes to programs made at Duke Energy Ohio with the input from asset management are transitioning from monthly to quarterly manhole inspections, investing in refurbishing approximately 25 manholes per year, adding Tan Delta VLF testing as a cable diagnostic technique, inspecting terminations, refurbishing network protectors (replacement and implementation of microprocessor controlled relays), and incorporating the use of infrared cameras in inspections.
The asset management organization has been instrumental to identifying and justifying budget dollars to invest in asset performance.
Technology
Duke has an asset information system. Within this system Duke can compare investments across the enterprise (Duke serves customers in five states). The system looks at such things as net present value, reliability, legal exposure, reputation, safety, and mandated programs. Duke is using an asset management system developed by Davies Consulting (Davies AIS system).
[1] In addition to R&I Planning, the Asset Management organization consists of Distribution Planning, Transmission Planning, and Portfolio Management.
7.7.1.8 - Energex
Planning
Asset Management
People
Energex has an Asset Management organization responsible for managing the network infrastructure to yield expected results (reliability, for example), and for making asset investment decisions. The Asset Management organization is led by an Executive General Manager, and includes organizations that support the management of assets including the Network Capital Strategy and Planning group, the Network Optimization group, the Data Services and Demand Management group, the Systems Engineering group, the Network Maintenance and Performance group, as well as the Metering, Safety and Environmental groups.
Process
Energex uses PAS 55 standards for the optimal management of physical assets. Energex uses a program called Condition Based Reliability Maintenance (CBRM), which seeks to develop a health index and risk score for all assets, and use that information to drive decisions such as maintenance approach and replacement criteria. The company utilizes a combination of asset age and condition identified through inspection and diagnostic testing to determine a health score.
The risk score examines operational performance and impacts on safety to identify a level of risk associated with each asset. The results of this program drive the company’s investment in refurbishment. Note that its program does not define specific actions based on scores. Rather, these indicators point Energex managers to scrutinize the performance of a particular asset class more closely. It is this additional scrutiny and investigation that results in action.
Once every five years, Energex approaches their regulator with their investment plans, including investments in system refurbishment driven by their CRBM program. Examples of some asset refurbishments driven by this program include:
-
Replacement of obsolete relays with microprocessor based relays
-
Replacement of oil circuit breakers with gas insulated breakers
-
Replacement of gas cables (transmission)
-
Rehabilitation of the pit and duct system in the Central Business District (CBD).
-
Based on problems with the older duct system, much of which was comprised of clay tile ducts, and given the rapid anticipated of load growth in the CBD, Energex embarked upon a five-year program to upgrade their pit (manhole) and duct (conduit) system. This program included:
-
Installation of new duct bank (5 x 3 ) in the electricity supply corridor - Energex implemented this program in conjunction with a city program to upgrade the pedestrian foot path, as the Energex duct system is located beneath the footpath.
-
Upgrade deteriorated pit locations, including civil work, and re-racking of conductors.
-
Energex has had difficulty applying this program to the 11 kV and low-voltage cable fleet population within the CBD, as the company does not have good records of asset type and vintage. Energex does not perform routine diagnostic testing of cables, other than troubleshooting (fault finding), and new cable commissioning tests (DC or AC hi-pot). The company does not have a cable replacement strategy for the cables within the CBD. Note that they utilize both PILC and XLPE cable in the CBD.
Technology
Energex uses Condition Based Risk Management System (CBRM) software from EA Technology to track the health and condition of assets throughout the underground system. The system assigns a health index and risk score for all the assets in each class, such as circuit breakers, transformers, etc. Length of time in service, test results, and any refurbishment work is input into the system. The system can “score” some assets based on aging mechanisms housed within the system that can be used to predict potential end-of-life. Actual refurbishment and replacement work is driven by the calculated health scores.
7.7.1.9 - ESB Networks
Planning
Asset Management
People
The Asset Management organization at ESB Networks consists of an Asset Investment Group, a Program Management Group, an Infrastructure Stakeholder Manager, an Assets & Procurement group, a Finance and Regulation Group, and an Operations Management group.
The Asset Investment group includes a Specifications Manager, and both generation and “Network” investment groups that perform the planning and design of ESB Networks T&D infrastructure.
The Network Investment groups are responsible for producing plans to invest in network assets that are “Least Cost and Technically Acceptable (LCTA).” ESB Networks Network representatives noted that they believed their company to be entering a period in which capital dollars will be constrained, and that developing optimum investment plans because critically important.
The Network Investment groups are set up geographically, with one group focused on the North, and the other focused on the South. This set up matches the organization structure of the construction organization, which is also split between north and south.
Process
The Network Investment groups plan and design the system. They analyze historic system loading and voltage performance, and consider anticipated load growth and new customer loading in developing investment plans. As with most planning organizations, they consider key system requirements around continuity of service, losses, power quality, operational switching arrangements, and environmental issues.
The Network Investment group performs regular reviews of their overall investment plans on five-year cycles, including the overall HV Network investment plan, the Dublin HV investment plan, as well as individual area plans (MV).
7.7.1.10 - Georgia Power
Planning
Asset Management
People
Network Assets are tracked and maintained by multiple groups a GA Power, including the engineering group, field workers, construction resources, and maintenance crews in the Underground Network group. The Network UG Engineering group, together with the Network Operations and Reliability group, Area Planning, and in consultation with Georgia Power senior leadership, is responsible for making investment decisions for the network systems, based on their analyses of the implications of forecasted loading on the system, contingency analysis, and assessment of system conditions as determined by inspection and maintenance activities.
Local distribution planning for the network underground infrastructure in Atlanta and other Georgia metropolitan areas, such as Savannah and Macon is the responsibility of the engineering group within the Network Underground Division. The Network Underground Division is led by the Network UG Manager, and consists of both engineering and construction resources responsible for the network infrastructures.
Decisions about investment in network equipment such as transformers and network protectors are the responsibility of Network Engineering group, and are based on equipment condition as determined through inspection and maintenance findings. This group reports organizationally to the Network UG manager, leader of the Network Underground division.
Projects of $2 million or less are brought before the Regional Distribution Council for approval. This group which meets monthly is comprised of the leaders of various Georgia Power Regional offices, and includes the Network UG manager. Any projects that require more funding (> $ 2 M) are sent to the vice president over the Network Underground group and upper management for review and funding approvals.
Network Operations and Reliability is comprised of both the field resources (field inspectors and field test engineers) that perform network equipment inspections and conduct network equipment maintenance, and the engineering resources that analyze the information from the inspection activity and make decisions of whether to repair or replace network equipment based on the findings. The Network Operations and Reliability group reports to the Network UG Reliability Manager.
Decisions about investment in maintenance or repairs of structures such as manholes, vaults, or duct banks are the responsibility of engineers responsible for civil and structural design within the Network Underground Engineering group. This group is responsible for determining inspection approaches for structures, and for developing strategies for responding to inspection findings. In addition, this group develops standards for structure design and repair. For example, this group was responsible for implementing the SWIVELOC™ manhole cover design to selected manhole locations (See Figure 1 and Figure 2.).

Figure 1:
SWIVELOC Installation

Figure 2:
SWIVELOC – underside of cover
Process
Asset information is housed in the Georgia Power GIS system, implemented about four years ago. The party responsible for the installation of the asset inputs the data into the asset record within the GIS system. For example, the Network Underground Test Technician responsible for commissioning a new protector installation is responsible for entering information about the protector into GIS. The GIS system tracks most network asset information, including manhole and vault drawings, nameplate information of the assets therein, and records of the inspection and maintenance activity performed at those locations.
If an individual at Georgia Power wants asset information on a particular vault, for example, he can look up the vault in GIS and can see information about the vault design, and all the nameplate information on transformers, types of protectors, etc. Because Georgia Power is on a five-year cycle for maintenance, crews are still identifying and recording serial numbers and other details associated with equipment to bring the asset register up to date.
Records are kept for all inspections as well, but if everything is found to be normal, only the name of the inspector, the location, and the date are retained in the Asset database. If there’s an exception, a note is entered into the GIS system that the location needs maintenance and that follow-up is required. Georgia Power does not keep photos as a standard procedure, as locations may change, be modified, and photographs may be misinterpreted or become quickly out of date.
Note that cable vintage is not being tracked in the asset data base. (With cable, vintage information is located on the cable itself; solid dielectric has date information on the outside, while lead has date information on the inside.)
Joints and splices are recorded in a separate Access database right now. These joint and splice records capture who prepared the joint and whether it is an EPR, lead or transition joint. The location of cable limiters are not directly recorded in the GIS but are shown on maps that are then imported into GIS. Protector maintenance and models, sizes, etc. are also input into the Access database, and then imported into GIS.
Technology
Georgia Power uses both an Access database and its GIS system (ESRI) to track equipment information, and a maintenance record. Information from the Access database, including protector information and joints and splices, are input or imported into the company’s GIS system from Access.
It is the responsibility of the construction, maintenance, and engineering staff to input information into the appropriate system(s) when equipment, maintenance, or other assets are put into service, inspected, or repaired. Maintenance and inspection crews gather information such as transformer template information as they inspect or visit undocumented assets during their routine duties.
A new inventory control system (“Maximo”) includes tracking of cable and materials available in the warehouse by a commodity number. Maximo is used for a broad range of functions, and there has been some discussion of whether it can also be used to issue, track and house maintenance records from inspections and trouble tickets.
7.7.1.11 - HECO - The Hawaiian Electric Company
Planning
Asset Management
People
Asset Management is a relatively new group at HECO, formed in late 2008. The group, led by an Asset Manager, was formed to coordinate many of the asset management activities in place among the various functions at HECO. These activities include asset performance assessment and evaluation, investment optimization, project selection and prioritization. The focus of this group includes all distribution, transmission, and substation assets.
The new group will be comprised of a manager and six slots for employees. The manager hopes to fill these slots with engineers, who will focus on different asset types (An engineer to manage transformer assets, for example). At the time of the EPRI immersion, HECO had filled one position, a person to focus on capital project prioritization. Since the immersion, HECO has filled an engineer position for asset manager for cables, with an initial focus on distribution cables. Asset Management works very closely with the Engineering department and the Technical Services Division.
Even after these positions are filled, the Asset Manager intends to the organization to be a virtual one, in that functional managers will continue to be involved in asset health assessment, project prioritization, and other collaborative activities. The Asset Manager specifically noted the need to collaborate with the C&M Planning group of the C&M Underground Division, who is capturing and recording asset health information from inspections, in determining the optimum inspection portfolio.
Process
One role of the Asset Management group at HECO is to prioritize capital projects. HECO performs an analysis on all capital projects with a cost greater than $100,000. This analysis involves using a scoring matrix to rank projects in 7 different categories and develop a relative weighting for each project. This weighting is used by management to determine which projects to include in the work plan. This is particularly useful for projects near the “cut line”, based on anticipated available funding.
Note that this approach applies only to projects greater than $100K. For projects less than $100K, HECO creates blanket orders. For budgeting of blanket orders, the previous year’s costs are simply increased by a fixed percentage to determine an estimated cost for the coming year.
HECO is not yet utilizing this type of weighting for Operations and Maintenance activities. The Operations and Maintenance budgets are developed by trending from previous year spends. Asset Management intends to move to a program driven maintenance budget.
Another role of Asset Management is to analyze the health and performance of assets and develop programs that invest in maintaining or extending the life of these assets in an optimum way. For example, HECO is presently studying cable performance and developing a cable replacement program. This study involves understanding what cable types they have in place, what the performance has been, and what the likely failure modes of these cable types are. Working with EPRI and with KEMA, HECO has developed models for 15kV URD cable failure performance based on their cable fleet’s historic performance, industry knowledge, and some innovative analysis techniques. These models can be used to predict future failure performance and make investment decisions. Using this information and with assistance from KEMA, HECO is presently developing a cable replacement strategy.
The Asset Manager noted that the “Asset Wall” created by the anticipated wave of increased failed cables represents one of his greatest concerns and challenges.
Asset Management is also reassessing certain practices in place at HECO to assure that they make sense moving forward. For example, in analyzing cable fleet performance, HECO has concluded that they will have to significantly increase the amount of cable they replace each year to maintain desired levels of system reliability. Using current practices, the costs of this additional replacement activity is significant. Asset Management is re-examining HECO’s current practice of using a jacketed, water block, tree retardant XLP insulated cable in a concrete encased conduit. For example, “Is encasing the conduit in concrete necessary?” “Perhaps placing it in a direct buried conduit is satisfactory”.
Asset Management will develop recommendations of what work (Inspection, Maintenance, Replacement, for example) is to be performed on assets of various types. The Asset Manager noted that they may develop more formalized service level agreements that document these expectations in future.
Technology
For business case development and project prioritization, HECO is utilizing an asset life cycle analysis tool developed by KEMA. KEMA is also assisting HECO with the data analysis and work plan development.
HECO does not yet have a complete Asset Register for housing information about assets. For substation equipment such as breakers and substation transformers, their asset register is fairly robust. They are recording substation information in a product called Ellipse by Mincom.
For distribution assets, HECO has not yet recorded any information about Underground assets in an “Asset Register” such as Ellipse. Distribution asset information is currently kept in their GIS and mapping systems.
7.7.1.12 - National Grid
Planning
Asset Management
People
National Grid has a strong focus on asset management. Organizationally, they have an Asset Management group led by a senior vice president. This group is comprised of Asset Strategy, Distribution Planning, Investment Management, Transformation (a business transformation group), and Engineering.
The Asset Strategy group is responsible for establishing high level policies and strategic direction.
The Distribution Planning group works between the Asset Strategy group and the implementation of their strategies, developing principles and standards that ultimately drive work procedures.
The Investment Management group provides the project justification and determines the priority for specific projects. All spending plans are developed based on project category, priority, budget class, available budget, and resources. Capital projects are ranked based on the measure of risk and the improvement opportunity associated with the project, identified by their single project prioritization scores. This group maintains a Corporate Risk Registry which is a ranked list of potential investments ordered by risk. Projects are assigned a priority number generated by a project risk/prioritization decision support matrix that assigns a project risk score based upon the estimated probability and consequence of a particular system event occurring. The project priority score takes into account key performance areas such as safety, reliability, environmental, and cost. The project priority score is a tool that helps investment management identify optimum projects for investment. Projects are added to a Corporate Risk Register, a ranked listing of potential investments ordered by risk.
Having a single score associated with each potential investment gives a common method to assess risk across the business. This provides transparency to the executive and allows the amount of risk being mitigated in each line of business to be compared and factored into the overall capital plan. It also provides important information to assist with regulatory dialogue and debate.
National Grid has been actively focused on developing and asset management centric culture. For example, they have implemented practices that conform to principles out lined in PAS55, the British Standards Institution’s (BSI) Publicly Available Specification for the optimized management of physical assets. This specification provides definitions and requirements for establishing and verifying an asset management for all types of physical assets. One example of a PAS 55 requirement adopted by National Grid is the practice of revisiting their procedures (such as Electric Operating Procedures (EOP’s)) on a three year cycle to assure they are current.
Process
Historically at National Grid, there had not been much maintenance visibility for distribution network assets. Network systems are inherently reliable based on their design. As with most utilities, the implementation of asset management processes at National Grid is more mature for substation assets than for distribution assets.
National Grid plans to roll critical distribution assets, such as network transformers and protectors, into the tool set they have established for managing substation assets. An example of this is their use of technologies such as the Cascade system to record information about and manage distribution assets.
National Grid has established an asset register for distribution assets. For most distribution assets, National Grid’s GIS system (Smallworld) serves as the asset register. For network assets however, Cascade will serve as the asset register, as the GIS system does not adequately represent the network infrastructure, National Grid is loading network protector and network transformer information into the asset register (Cascade).
National Grid has recently standardized its maintenance approach to network equipment, increasing the frequency of inspection from historical practice. One driver of this increased maintenance frequency is the need to gather more data such as loading information. Because National Grid has no remote monitoring on their network system (beyond the substation feeder breaker), the only opportunity they have to gather information about the equipment, whether condition information or loading information, is during field inspections. In general, network facilities in the Albany network are well-maintained. See Preventive Maintenance and Inspection for more detail on their approach.
The Distribution Planning group has developed a specific recommended strategy for upgrading the secondary network system, which includes the addition of remote monitoring, increased maintenance, and network transformer oil testing such as dissolved gas analysis. In developing this strategy, each network was studied to determine whether to keep the network, expand it, shrink it, or eliminate it. The specific investment strategy for each network would be dictated by this overarching direction. For example, remote monitoring might appropriately be implemented in networks slated for expansion, but might not be considered for networks planned for elimination.
A specific study of the network secondary distribution system serving Albany was performed as part of this process. The study included an analysis of thermal and voltage limits applied to the anticipated 2015 peak loading levels during normal, single and double contingency conditions. In addition this study analyzed the expected performance of the secondary network system for solid faults on secondary cables. Recommendations from this analysis include specific system reinforcements to meet anticipated peak loading levels and the application of cable limiters on each end of secondary mains and at secondary junctions.
The identification of secondary network system upgrades was prompted by an analysis performed by Distribution Planning to answer the question of whether outages to secondary network system, such as certain notable outages experienced by some other utilities, could potentially occur at National Grid. The analysis concluded that yes, the underlying issues that led to those other noteworthy outages, existed at National Grid and could potentially result in outages. The project to upgrade secondary networks has been added to the National Grid corporate risk register.
Process: Project Risk Scoring
Projects are assigned a prioritization score and added to the Corporate Risk Register, a ranked listing of potential investments ordered by risk. High scores correspond to high priority projects, and certain types of projects (e.g. diagnostic projects, and projects to comply with regulatory directives) are assigned a high priority score regardless of their risk impacts. The prioritization or risk score represents the risk that exists if a project is not completed, and thus a higher risk rating means a project is more urgent or useful.
The project prioritization score is based on an economic and impact-based measurement of three factors: Safety, Environment, and Reliability. The scores in these areas are calculated with the help of a decision support matrix, which accounts for the estimated probability of a particular system event, and the consequence of that event should it occur. A Microsoft Excel-based tool is used to aid the scoring process.
Overall Scoring Procedure
The first step is a classification process to identify project impact areas. A description of the project, along with the scope, justification and benefits is made, and the impact on safety, the environment and reliability is estimated. In most cases, the safety and environmental impacts of projects are lower than the reliability impacts.
Risk scoring is done according to the following principles. Both the cost (impact) and probability (likelihood) of a risk are important. An event that has a probability of happening only once every thousand years, but has a very high economic cost if it does, may end up with a lower risk score than a common event that costs much less per occurrence. For each category of risk (environment, safety, and reliability), impacts and likelihoods are estimated and used as indices in a matrix to calculate one blended risk score for each category (Table 1). The impact score is based on the monetary cost of a potential outcome, and there are seven levels from very low to very high (or one to seven). In terms of economic impact, levels are assessed on an exponential scale; the highest score outweighs the lower scores. Level seven represents an impact of greater than $40 million, whereas level one has an impact of less than $10000. A likelihood measurement is also assigned to one of seven numeric categories, corresponding to very low to very high likelihood, and can be considered the probability or projected time to failure. This is based on a probabilistic model considering the likelihood of failure in each year. So, for example, a constant probability of 25 percent per year can be considered a time to failure of four years.

Table 1:
Blended Risk Score Matrix
Impacts and likelihoods are used to look up the blended risk scores, which span values from 1 to 49. Values lower than 15 are considered low risk (green); 16 to 30 are medium risk (yellow); and greater than 40 are considered high risk (red).
The overall project priority score is the maximum of the safety, environmental, and reliability risk scores. This is considered preferable to using some kind of averaging scheme, as low risks in two areas should not be allowed to diminish the projected cost of a very high risk in one particular area. The impact score is assessed on an exponential scale, such that a high impact score in one category will almost always outweigh lower level impacts in other areas. Most projects are expected to have a single driver that dominates the risk assessment.
Impact assessment is based on the economic cost of an impact (and carbon emissions for environmental risks). Events with lower projected costs are assigned lower impact scores.
The likelihood score can be considered a projected time to failure and is based on probabilistic models and / or historic performance of the components involved.
In some cases, a failure of an asset considered in the primary project will only have an impact in cases where a secondary component also fails, such as a network distribution system with redundancy. In cases where a coincident event is required for the failure to have an impact, the combined probability (or time to failure) is calculated with the help of a table that takes as input the likelihoods of both the main asset and secondary asset failing. For example, if the primary component has an expected failure time of four years, but a secondary asset that is required for the impact has an expected time to failure of 25 years, the combined likelihood score is lowered to account for the secondary failure required.
As described already, project prioritization scores are entered into the Corporate Risk Registry to assist with decision making by the Investment Management group. Some projects may be considered mandatory, such as projects to comply with targets set by regulators. Mandatory projects are assigned a project priority score of 49 (the maximum) regardless of other risk measurements. Some example scores for real-world projects are shown in Table 2. These project prioritization scores are entered into project funding requests, along with other pertinent details.

Table 2:
Project Prioritization Scores with Impacts and Likelihoods
Assessing the impacts and risks for a project can be less than straightforward, especially in cases where the project is non-homogeneous. As an example, a rehabilitation project on a New York sub-transmission line, which was in generally poor condition, had a minor subset of poles that were in very poor condition and thus had a very high replacement priority. The whole project could be assigned a high risk score reflecting the worst subset of assets (the subset of poles), and thus funding the entire project, or it could be scored differently by recognizing the risk of the overall project could be reduced by just replacing the worst condition assets now. This would let the remaining assets stand alone with a lower risk score and be prioritized accordingly.
National Grid continues to develop the project prioritization process. Some questions and improvements being assessed include revisiting the combination of environmental, safety, and reliability scores. Currently, the maximum score is taken as the overall project prioritization score. However, there may be a better way to combine them numerically to reflect the combined risk. Another option being considered is to simplify the risk assessment process by assigning all projects in the same category with a category-based project prioritization score. In this way, all projects of the same scope and type (for example, all spacer cable replacement programs) would be assigned the same project prioritization score.
Technology
National Grid is loading network protector and network transformer information into Cascade, which will serve as the asset register.
National Grid uses a system called Computapole to record maintenance and inspection information. National Grid intends to migrate this information to Cascade.
National Grid utilizes a prioritization decision support matrix that is used to determine project risk by weighing the anticipated probability and consequence of a particular event occurring. For example, an asset failure could be scored based on the probability or time to failure, and the consequences if indeed that asset would fail. Microsoft Excel-based tools are used for calculating the blended risk scores and deriving the combined prioritization score based on the reliability, safety, and environmental risk categories.
PeopleSoft project funding request forms contain entries for the project prioritization score, which is factored into the funding requests. “Power Plant” software also takes project prioritization scores, along with the category from which it was derived (reliability, safety, or environment).
7.7.1.13 - PG&E
Planning
Asset Management
People
PG&E has effectively implemented an asset management process for network equipment. They have assigned a specific person as the “Manager of Networks”, part of the Distribution Engineering and Mapping organization. This asset manager is responsible for determining the investment, maintenance and replacement strategies for network assets including network transformers, network switches, and network protectors. Note that the asset management of cables and cable accessories is the responsibility of a different asset manager at PG&E, located within Distribution Standards.
The manager of networks is both an electrical engineer, and an attorney. He collaborates closely with the network planning engineer (Reliability and Planning), cable experts within Standards, and the Maintenance and Construction Electric Network group, the organization responsible for the execution of the asset strategies developed by the Manager of Networks.
EPRI observed strong working relationships between the manager of networks, and other key PG&E resources focused on network management. The manager of networks was visible and known to the field force, periodically meeting with field crews to review topics of interest.
The manager of networks has a well documented asset strategy for managing network assets. See Attachment A.
Process
PG&E has implemented asset management processes for network equipment. The asset manager is the asset owner, and is responsible for making decisions about assets and developing appropriate investment plans. These plans are then given to the maintenance and construction electric networks group to implement.
The asset manager has developed a life cycle plan that includes strategies for PG&E’s networks. These strategies are described in asset management lifecycle plan document. See Attachment A. The document includes general strategies for replacement of network equipment, maintenance, safety, and other strategies such as training and workmanship, accountability, network information tracking, organization design, and continuous improvement.
The strategy document further details the projects and programs have been implemented by PG&E to support the strategies. Examples of specific work being performed in the network in support of these strategies include:
-
Installing a state of the art fiber optic SCADA monitoring system to be used for establishing a real-time monitoring and condition based maintenance system. This system will include “self-healing” fiber optics to support the new SCADA system and provide for operational control, improved low-side protection and safer clearance procedures.
-
Replacement of deteriorated network protectors, transformers and other major components.
-
Use of dry type transformers in high rise buildings, where possible, or natural ester oil in explosion resistant transformers where dry type units cannot be used.
-
Installation of a new manhole cover system designed to improve safety and reduce risk of collateral component and infrastructure damage.
-
Continued improvement of the SAP based maintenance system to provide for a more efficient and consistent maintenance program for the networks.
- The SAP system provides tracking and data recording, automated trigger of follow-up maintenance based on oil testing, automated updates to a centralized asset register, automatic generation standard metrics and reports
-
Development of a condition based maintenance program to complement the SAP system.
-
Recognizing that condition based maintenance programs are more mature in substation applications, the asset manager is planning to model the condition based maintenance approach being used in substations at PG&E for network assets. The condition based maintenance system is a comprehensive monitoring and tracking system that will add the following functionality into the SAP based system:
-
Integrates data from disparate data sources (for example, data from the oil sampling program presently being tracked on spreadsheets).
-
Moves from the use of manual checklists to mobile electronic data pads that check crew work and activities as it is being performed.
-
System will perform complex algorithms using asset characteristics, calculation parameters, maintenance performance history and operational events. As an example, these algorithms can tell the crews to replace the incoming lead cable leads on a primary transformer termination chamber versus just changing out the oil based on historical oil sampling and replacement information.
-
Execute various workflow scenarios while providing full integration with SAP based maintenance and the asset registry. This will also relieve some of the administrative and clerical work associated with entering data and will help to reduce data entry errors.
-
Trend laboratory data and other data for analysis including oil diagnostic testing, EC notifications, individual repair items, etc.
-
-
-
Implementation of a maintenance programs designed to meet the strategies described above and ensure regulatory compliance
- Maintenance strategies including annual oil sampling/pressure testing, network protector maintenance, vault maintenance, SCADA maintenance, and oil replacements.
Technology
Information about network systems is housed in two data repositories, PG & E’s SAP system, and their “Network Historian”.
The SAP system serves as an asset register, keeping information about assets including what was maintained, and who maintained it, and triggering maintenance orders based on predetermined criteria.
The network historian is an internally developed software application that provides the asset manager review of the condition of the network based on information monitored by the remote monitoring (SCADA) system. The network historian contains information such as historic loading, and network protector status, used by both the asset manager and planning engineers.
As PG&E implements a new SCADA system on their networks, the network historian will be the repository of the additional monitored information. The condition based maintenance functionality being implemented in their SAP system for network equipment will utilize data stored in the network historian. The asset manager is currently reviewing internal needs to identify the specific data, and data views that will be necessary in the network historian.
7.7.1.14 - Portland General Electric
Planning
Asset Management
People
PGE employs a Manager of Strategic Asset Management and Geo-Spatial Information, who oversees a department responsible for all aspects of asset management, including the downtown network. The department uses reliability reporting and analytics, undertakes root cause analyses for the transmission and distribution (T&D) systems, and provides support for the Outage Management System.
The Strategic Asset Management Team:
- Includes an engineer focusing on reliability reporting and data analytics management of strategic assets
- Supports and manages the OMS, especially the OMS model. The department’s focus covers asset management, reliability, and analytics.
- Performs reliability and root cause analyses, as well as supports the asset models derived from health indexing of condition-based assets
The network issues are spread among a team of people, with no single individual responsible only for the network. The three Distribution Engineers covering the underground network work with the organization to provide technical data about the system. They are overseen by the Eastern District Central Supervisor, who reports to the Manager of Distribution and T&D Standards.
PGE also has a number of Internal Subject Matter Experts with in-depth knowledge of particular assets and systems. An experienced employee with a good understanding of assets and components supervises the storeroom.
PGE initiated a PAS55 program for asset management and contracted with third-party experts to assist them in developing asset management processes and a Microsoft Excel-based risk analysis model.
Process
Strategic Asset Management Program
PGE originated the Strategic Asset Management Program in 2013 to address concerns about aging assets within the company and reduce associated risk exposures. PGE performed a PAS55 assessment and now conforms with ISO 55001 standards.
Defining Risk: The process led to the development of a strategy and highlighted the need to provide a consistent definition for the nature of “risk,” because it was defined differently in different areas of the company. The company wanted to apply risk in a consistent fashion that was accurate and applicable to T&D. The standard definition for risk that PGE uses is:
The likelihood or probability of failure of a component multiplied by the consequence (of the failure)
In general, risk can be conveyed as points or in dollars. PGE opted to classify risk in terms of dollars, which led to a shift in departmental emphasis towards proactive investments in system assets. Across the enterprise, the utility has developed risk models that shape the majority of capital investments currently undertaken. Initially, the models focused on core asset management tasks, such as identifying assets that needed replacement. Lately, PGE is developing new tools to help determine different risk mitigation activities such as shifting loads and installing automation (see Figure 1).

Figure 1:
Strategic asset management, risk assessment methodology
PGE developed the initial risk assessment models in Excel spreadsheets, for which the utility sought advice from an external consultant. The main intention was to create a transparent and flexible system rather than a “black box.”
Likelihood of Failure: The likelihood of failure is based on the type of asset, and PGE has developed failure curves for each asset type and individual asset. The data also includes condition information for assets, and the company is developing health indices for each asset according to age. PGE uses this methodology for each of the vital assets in the T&D system, including substation transformers, components, and materials including cables, switches, and breakers. Importantly, PGE evaluates every individual asset rather than developing aggregate figures. For example, when calculating the risk for a specific network protector, the age and condition are usually known. If this data is not available, it is sourced from industry information and cross-checked with Internal Subject Matter Experts.
Consequence: For every risk, PGE calculates the consequences by assessing the ramifications of a number of potential scenarios for each failure type. For example, although the majority of network protector failures may not pose severe consequences, one case could lead to a catastrophic failure. PGE assigns a dollar value to each scenario and, for each event, cost is calculated by:
- Cost for PGE to replace the asset
- Direct outage cos,
- Customer costs including:
- Customer-affected costs, depending on the type of customer, length of outage, and customer loads. This is aggregated to calculate a dollar value.
- Interruption and duration costs are applied to the calculation. For example, an interruption for a residential customer could cost $7.00 initially, but cost a further $4.00 per hour if the outage is prolonged.
This cost is then multiplied by the probability, to derive a risk dollar value for the asset in question. To develop this model and the costs, PGE used a study that Pacific Gas & Electric (PG&E) performed in 2012 [1], and an ICE study that Lawrence Berkeley Laboratory performed.
Overall, the risk models are used to support decisions rather than act as tools for making decisions. One of the major challenges found when evaluating the network with these asset models is that, in most cases, when there is an outage on the network, there is no customer outage or interruption because of the contingency built into the network design. Therefore, any modeling based on customer outage and the severity of such incidents is slightly compromised by the fact that the network is very reliable and has multiple contingencies. This is similar to the PGE transmission system, which is also very reliable with multiple contingencies.
In Figure 2, the orange line shows the risk for an existing asset, while the dashed blue line shows the annualized cost of replacing the asset. Therefore, in some cases, coping with the increased risk is preferable until it becomes cheaper to replace the asset. Undertaking this kind of modeling requires a range of different talents and expertise covering engineering, operations, and economics.

Figure 2:
Deciding when to replace an aging asset
Additional Parameters: PGE is trying to capture additional, less-tangible parameters, such as safety, and incorporate them into the model. Refinements will incorporate injuries, including work-related injuries caused by dealing with certain types of equipment.
PGE is revisiting the key drivers for asset health and trying to gain a better understanding of how to convert age and condition into an index, and highlight key metrics/indices that help engineers understand trends over time. It is also important to understand that tests for some asset types give results that require immediate action, while some results influence long-term asset management.
Network Asset Management: The asset management program remains under development for the network system, and PGE is unsure if it has enough information to build an accurate model. In addition, floods and earthquakes need to be taken into consideration as part of the model. For all radial assets, the number of customers served is known. For the network model, the total load for a spot served by the network is used, allowing the model to calculate the likelihood the network will fail at that point.
Change Management: To introduce the new asset management system,PGE developed a change management program to implement the program smoothly. This new approach to asset management has been well accepted outside the network system. The approach is slowly being accepted on the network where, for example, engineers have pointed out that the network’s substations carry high risks. The model clarifies the two aspects of risk, namely the probability and the consequence, giving a better picture of the overall risk and preventing engineers from becoming too focused on only one aspect.
Portfolio Management Model: The asset management model will be developed alongside a Portfolio Management Model that will include:
- Political/regulatory specifications
- Environmental considerations
- Safety aspects
- Implementing a remote monitoring system
- Replacing network protectors. In the last five years, the company has replaced slightly more than one third of the network protectors with an all “dead-front” design (Eaton CM52) for safety reasons.
- Lead cable replacement in targeted for high-risk vaults.
Non-Asset Risk: The risk assessment model has also been applied to non-asset risk, such as interruptions that vegetation, public intervention, and human error cause. This will enable PGE to fully understand the full breadth of the risks and accept that failing assets/equipment are not the only causes and drivers of risk.
Risk and Replacement Programs: At present, PGE has not used the system for any specific replacement programs on the network. PGE has emphasized other areas of the company and will further refine the model before it will suit the network. In addition, other programs are already focusing on the network. For example, the detailed root cause assessment – the Performance Improvement Assessment (PIA) – has driven the lead cable replacement program.
Network Improvements: In the last 10 years, PGE has invested in bolstering the network, including:
PGE uses a model to underpin a proactive replacement program for reinforcing the civil infrastructure of vaults and manholes, including the replacement of manhole lids. In addition to the modeling, findings from vault inspections and from equipment testing, such as oil sampling, drive asset replacements and upgrades.
Technology
2020 Vision Program: PGE has initiated the 2020 Vision Program, which is comprised of several projects to transform the existing technology into a more integrated platform. It will streamline the number of applications and vendors used to leverage technology and improve work processes. Part of this includes developing a single work and asset management system, which will include:

Figure 3:
2020 Vision Program
- Maximo Mobile and Scheduling
- Geospatial Information System and Graphic Work Design replacement (GIS/GWD)
- Outage Management System replacement (OMS).
- Maximo for Utilities 7.5
- Geographic Information System (GIS) – ESRI ArcGIS
PGE’s asset management program uses IBM’s Maximo for Utilities 7.5 system, which supports asset management processes for T&D utilities. Maximo can be integrated with a number of systems, including fixed-asset accounting, mobile workforce management solutions, and graphical design systems. The Maximo Spatial system is compatible with map-based interfaces, such as ESRI ArcGIS, and follows J2EE standards.
Maximo for Utilities supports operations across a number of areas, including integrated fixed-asset accounting. The Spatial Asset Management module includes a map-based interface to track assets and locate work order and/or service request locations . The PowerPlan Adapter is a corporate-level suite intended to facilitate accounting during operations. The system automates asset lifecycle management and supports compliance monitoring.
To support asset management, engineers use ArcFM, which is built upon ESRI’s ArcGIS system and is linked to the Maximo system. GIS is used to map assets and circuits, and can be linked to the customer information system and other enterprise applications. The maps provided with ArcGIS include facility maps, circuit maps, main line switching diagrams, and a service territory map .In 2017/18, PGE will investigate processes for transferring ArcGIS/ArcFM information into CYME, which will require a software development from the vendor, Schneider Electric.
7.7.1.15 - San Diego Gas and Electric
Planning
Asset Management
San Diego Gas and Electric Tee Modernization Program
Summary
To illustrate how asset management can help utilities channel resources to the right areas, this case study examines how San Diego Gas & Electric (SDG&E) addressed performance issues with Tee-body connectors. Faced with systemic failures in these components, the utility used risk management techniques to create a predictive model and a cost-effective replacement policy.
The program drew upon the utility’s existing risk-based approach to strategic asset management, using enterprise system data and analysis to refine maintenance and replacement programs. SDG&E already used this approach when developing a cable replacement program for unjacketed cables with high failure rates, and the lessons learned provided a good foundation for solving the issues with Tee-bodies.
Tee-body connectors are a relatively minor component used extensively on SDG&E’s underground distribution system. In manholes and hand holes, some units started to fail, causing extensive outages that proved difficult and time consuming for crews to repair. Accordingly, SDG&E developed a model to aid in identifying candidates for replacement, and a consequent program that replaced high risk Tee-bodies as well as installed Cooper Load Break Connectors (CLEER 600A connectors) in vulnerable locations.
Overview of SDG&E
A subsidiary of Sempra Energy, San Diego Gas and Electric (SDG&E) is a regulated utility that distributes electricity and natural gas to 3.6 million customers. Alongside 873,000 natural gas customer meters, SDG&E serves 1.4 million electricity customer meters including 1.27 million residential customers, 158,000 commercial customers, and 46,000 street light customers. To provide services to its customers, the utility employs over 4,000 people.
The utility’s service territory of 4,100 square miles (10,600 square kilometers) stretches across San Diego and southern Orange County, in California. The system includes 134 distribution substations and 225,697 poles, with 10,558 circuit miles located underground and 6,527 overhead. Most of the utility’s distribution circuits operate at 12kV, with the remaining 4kV systems presently undergoing conversion.
Strategic Asset Management Strategy (SAM)
At 62%, SDG&E’s ratio of underground to overhead systems is much higher than other Californian investor owned utilities. This can lead to higher costs such as, for example, traffic control for manhole maintenance, or the extra labor needed to troubleshoot problems on the underground. The higher cost associated with managing underground systems elevates the need to assure prudent and cost-effective investment. Consequently SDG&E has deployed an asset management program that maximizes investments by targeting resources where most needed.
SDG&E’s Strategic Asset Management (SAM) program uses ISO 55000 standards, with a specialized team responsible for implementing the program across the business. The utility’s evolving asset management approach will facilitate governance, analytics, and data management across all business units. The integrated strategy includes planning, design, construction, and maintenance, and uses a life cycle strategy for assets within each asset family covering record keeping, replacement strategies, and performance indicators.
Asset families represent a broad grouping of assets, such as “distribution underground or overhead transmission”. Each asset family is comprised of asset classes, such as distribution underground cables or distribution underground transformers, both part of the distribution underground family.
For each asset class, SDG&E has developed an asset ownership hierarchy, where specific people, usually directors, are assigned strategic oversight for the asset class. This structure is part of the overarching policy for planning, design, and construction across the company, promoting consistency and integration.
SDG&E’s asset management program uses a risk-based approach to prioritize remedial actions. Each asset class has a life cycle strategy that defines the records to be kept about asset and supporting systems, the maintenance and replacement approach, and performance monitoring and measures. SDG&E is required to report risk mitigation strategies with the California Public Utilities Commission (CPUC).
SDG&E’s growing asset management program promises to deliver cost effective risk mitigations and provide the maximum value to ratepayers.
Software
At the heart of its asset management strategy, SDG&E uses an enterprise system and database to manage information and produce outputs that can be used to quantify risk. The utility’s Enterprise Risk Management System (ERM), presently SAP, holds most of the data, and the system meshes with the GIS mapping and financial systems.
Last year, SDG&E performed a gap analysis of the existing systems, including GIS, financial systems, and the SAP enterprise resource planning software, to determine how these systems could support the developing asset management system and maintain data integrity. The analysis recommended three upgrades that would support future asset management:
Enterprise Asset Management (EAM): Provide a data lake and platform that integrates all key data from the various systems, especially the critical data needed for decisions.
Asset Performance Management System (APM): Offers a tool to help analysts understand asset health, performance, and condition.
Asset Investment Prioritization Tool (AIP): Prioritize and rank investments based on strategic factors such as safety, reliability, and the regulatory environment.
Corrective Maintenance
SDG&E’s strategic asset management program helps engineers determine if maintenance practices, especially for corrective maintenance, are optimal. The program, as it evolves, will help the utility assess which programs will be cost effective and provide maximum impact with respect to lifecycle costs, regulatory requirements, reliability, and integrating future technologies. The ISO 55000 framework will help SDG&E shift its focus from “how to do” to “what to do”, and identify the risks and opportunities for a particular action, while improving the value of assets.
At present, SDG&E asset managers develop risk scores for certain asset types such as poles, cables, and cable accessories such as Tee-bodies. These risk scores are developed by looking at various asset characteristics such as vintage, manufacturer and performance history, and are used to prioritize investments. The effectiveness of corrective maintenance can be assessed by understanding and quantifying the impacts of corrective maintenance investment on asset risk as determined by the risk scores. At present, circuit risk scores used to prioritize investment are relatively simple, as they are static and not updated in real time to capture new events. As the asset management system evolves, the utility will develop a dynamic risk management tool that uses machine learning to draw inferences and predict risk in real time. SDG&E will move towards models developed in-house rather than “black box” models provided by external consultants.
Unjacketed Cables
When first faced with the issue of failing Tee-bodies, SDG&E’s engineers could draw upon the lessons learned from its very successful cable replacement program. In the 1980s and 1990s, the utility saw a spate of cable failures affect unjacketed cables installed in the 1960s and 1970s. Accordingly, the utility set up a program to mitigate this issue by collecting cable data information from the field and cross referencing with purchase records and other records to determine the extent of this cable type on the system. With the support of a consultant, SDG&E assessed the data and established the failure rates for in service unjacketed cables according to cable vintage. Initially, the utility performed the analysis in Excel before creating a comprehensive cable failure database that they continue to populate with new data. Throughout the 1990’s, SDG&E focused on proactively replacing unjacketed cables, with a particular emphasis on replacing 750 Al and 1000 Al unjacketed cables along feeder mains, which had been significant contributors to SAIDI.
While the cable replacement program produced significant improvements in SAIDI, underground cable failure rates again increased in the early 2000s. Further analysis showed that jacketed cables installed between 1977 and 1983 were responsible, even though they were not the oldest cables on the system. Because engineers were not fully sure where this cable type was installed, they developed a database that assembled information gathered from the field, from work order information extracted from existing databases, and from information identified and entered from older paper records. This database was used to prioritize the cable replacement program. The new cable replacement program proved very effective and failure rates fell significantly.
When SDG&E began to experience failures of Tee-body connectors used on the underground system, it leveraged its experience and approach with cable replacement to address the problem.
Problem/Challenges with Tee Bodies
Despite SDG&E’s very successful cable replacement project, the utility began to experience outages on its underground distribution system due to failures of 600 amp Tee-body connectors fitted across the system. Although Tee-bodies are relatively simple components, a failure can result in an entire circuit outage, with a large impact on overall reliability.
Tee-body units can cause high SAIDI outages because they are usually located within manholes and hand holes. These can be difficult to access, and are often flooded and require a pumping truck, making it difficult for crews to locate and rectify any problems. Because SDG&E has over 140,000 handholes and 3,000 manholes on its system, the utility needed a targeted, cost-effective program based upon risk to address replacement of this component.
Solution/Model Description
The Tee Modernization Program (TMP)
SDG&E, aware of the reliability problems posed by the units, initiated the Tee-body Modernization Project. Initially, this project assessed a number of options, such as changing the Tee-body design or using different components to replace the Tee-body. After developing a capital project and budget to assess the issue, SDG&E asked NEETRAC to perform a root cause analysis. The study produced varied reasons for failure, and the fact that Tee-bodies are “minor” components and rarely tracked in detail, made failure rate analyses difficult. The study identified number of potential issues:
- Missing bleed wires,
- Eroded/missing copper foil wrapped around the connector, probably due to age and/or flooding,
- Failure of the double ended connector plug,
- Problems with workmanship and installation practices.
See Figure 1.

Figure 1:
600 A Separable Connector (Tee-body) Cutaway
Of these, the double-ended connector plug joining multiple Tee-bodies, known as the “football”, proved to be the main cause. Early versions of this connector plug used an epoxy material in the center that was found to be prone to cracking, especially if crews used the incorrect torque during installation. SDG&E switched to a molded unit in 2012, which is center-torqued and less prone to failure, but numerous epoxy versions remain on the system.
See Figure 2.

Figure 2:
(Left) Connector plug (Epoxy material). (Right) Connector plug (molded unit)
To solve the Tee-body problem, SDG&E proposed:
Replacing the epoxy footballs with molded footballs, Installing Cooper Load Break Connectors (CLEER 600A connectors) in selected locations.
Developing a Predictive Model
Using its asset management approach, SDG&E implemented a model-driven risk analysis for determining candidate Tee-bodies for replacement, allowing engineers to assess the most effective way to mitigate the issue and prioritize which units to replace.
Initially, SDG&E devised a “heat map”, a visual depiction on a map of where all Tee-body failures occurred since 2002. The map depicts all relevant historical information and includes:
- Flooding information for manholes, Location information, Available fault current in substations. Engineers rarely tracked Tee-bodies (a minor component) with the same granularity as larger components, and the GIS system does include the level of detail that would indicate the specific location of Tee-bodies, or supporting information such as vintage or type. The scarcity of data meant that analysts used outage reports and equipment failure reports to develop an Excel based model to evaluate risk and prioritize replacements.
Teradata Analysis
For the next stage of the process, SDG&E engaged an analytics specialist, Teradata , to review the problem and propose a root cause. Teradata drew data from SDG&E’s work order history, installation history, and outage history to develop a “best guess” age for the Tee-bodies.
Teradata also developed a “Hazard Value”, which predicted the chances that an individual Tee-body will fail and cause an outage. Teradata’s model used a machine learning process to determine this value and included two assumptions:
If a particular manhole contains a failed Tee-body, then adjacent circuits in the same manhole are more likely to undergo a Tee-body failure.
Locational predictions are important, because a cluster of Tee-body failures in a given area means that Tee-bodies of a similar age in close proximity are more likely to fail, as they are likely of similar vintage and exposed to similar conditions.
SDG&E learned a lot from this initial analysis and discovered that many of the Tee-body failures occurred at locations between the substation breaker and the first interruption device. Initially, engineers suspected that this could be because these components see high fault currents, and that this might increase the degradation rate.
SDG&E’s Unified Model
Although Teradata’s model proved useful, SDG&E wanted to create a model that blended the data from Teradata with their own data. To achieve this, the utility developed a multi -attribute risk model that considered both the predictor (probability) and the consequence of Tee-body failure for each circuit under analysis.
See Figure 3.

Figure 3:
Tee-body Risk Analysis Model
Modeling Predictors
The probability factors, or predictors, used in the model contain the following elements:
- Number of 600A Tee Failures
- Number of 600A Cable Failures
- Number of 200A Connector Failures
- Number of 200A Cable Failures
- Bus Fault Current
In addition, the utility included the two Teradata-developed factors:
- Average “Best Guess” Age of Tee-body
- Average “Hazard Value”
The values for failures by circuit were drawn from the equipment failure report database. For each of the predictive factors, the model uses normalized values. To create the normalized values, the model divides the original value by the system average do develop a “per unit” value.
Modeling Consequences
Assessing risk uses a matrix expressing a function of the probability of an event and the consequences of the event. With risk-based approaches, assessing both the probability of a failure and the consequences of the failure are equally important.
For the model, SDG&E uses a normalized consequence figure with two values:
Normalized Customer Minutes: For every location on a circuit, if an outage occurred, what are the total customer minutes expected? This number is generated by looking at historical average customer minutes of interruption at each location for every given outage. If everything else is equal, a circuit accumulating more customer minutes is generally more difficult to repair and carries a higher risk.
Normalized Customer Count: This describes the number of customers on a circuit, because a circuit heavily loaded with customers delivers larger consequences and higher SAIDI when an outage occurs.
In order to produce the final “Total Risk Score” for Tee-bodies on each circuit, the model uses the weighted sum of the various predictors multiplied by the weighted sum of the consequence values.
See figure 4.

Figure 4:
'Total Risk Score' Formula
The “Total Risk Score” allows SDG&E to rank projects and determine where remedial action will prove most effective. The model also allows users to adjust the various weightings, over time, as the utility gathers more data and root cause information.
Model Performance
The model has performed well. SDG&E used a validity evaluation to assess its risk predictions, comparing the locations of actual Tee-body failures with the risk scores produced by the model. Engineers who performed the validation categorized any location which was predicted in the top 25% highest risk as a “true” prediction, anything in the top 25-50% as a “near” prediction, and the remainder as a “miss”.
SDG&E also tested the hazard scores and age values produced by Teradata, especially Teradata’s prediction that Tee-bodies of approximately 12 years of age were more likely to fail (even more likely than older units). Engineers assessed the average age of failed Tee-bodies at locations which received a high-risk score in the model and found that they were, on average, 11 years old. This suggests that results of the Teradata prediction are reasonably accurate, and the utility is further exploring the data.
Age may well be an important factor behind failure, and because the utility has no records of age for the Tee-bodies, they will continue to use Teradata’s “predicted” age value. SDG&E is also refining the data gained from the outage management system and will continue to amend the model as new issues emerge, as part of the dynamic, machine-learning process.
The Model in Practice
With the model in place, SDG&E’s engineers developed a plan to convert the predictions into practice. The utility looked at the circuit rankings and selected suspect circuits, using the predicted age and hazard values, before using a “scoping” process to inspect the highest risk locations. Crews begin their inspections at the substation and follow the primary cable, assessing which Tee-bodies are present in each manhole/hand hole.
With scoping complete, engineers complete a pre-design review, where employees/contractors look at manholes and assess the feasibility of installing a replacement Tee-body or a CLEER device. Because the highest risk failures occur before the first interruption device, causing a full circuit outage, SDG&E emphasizes replacement of higher risk Tee-bodies in these manholes. In select locations, crews will replace Tee-bodies and with CLEER device that provides additional operational flexibility (see below).
To support information gathering and provide additional data, SDG&E developed a Tee Modernization Program Field Reporting form for the pre-design inspection. The electronic form helps crews provide information about the condition of manholes and Tee-bodies, such as whether the manhole was flooded or the Tee-body overheated. In short, SDG&E can collect more data to refine and enhance the model as part of the dynamic asset management process. As part of the Tee Modernization Program, SDG&E ensures that internal crews (non – contractor) perform a proportion of the work to ensure that they develop the right skills and knowledge to maintain and replace units.
CLEER Devices
SDG&E is selectively replacing Tee-bodies with a Cooper Load Break Connector (CLEER 600A connector) . CLEER devices installed in manholes achieve two main purposes:
- They replace the Tee-bodies,
- They allow easier sectionalizing and support better operability of the circuit
These connectors:
- Are rated as loadbreak switches
- Have fault-closure capability
- Do not require any unbolting of connections to operate
- Provide a visible break and visible ground connection.
See Figure 5.

Figure 5:
Cooper CLEER
SDG&E is installing CLEER devices as Tee-body replacements in selected locations to increase operational flexibility. At present, SDG&E is not using the CLEER units to break load. The devices enable crews to isolate faulted circuit sections and restore circuits quickly without having to disassemble 600 amp Tee-bodies.
Engineers noted that selected manhole locations must be large enough to accommodate the device. SDG&E avoids installing the CLEER devices in manholes with existing switches, because these locations don’t require the additional operating flexibility provided by the CLEER device.
They material cost of the CLEER device is about six times more than Tee-bodies, but the labor unit costs to install and to “operate” are significantly less. Crews can install a new T-connector and CLEER device in about two hours, as opposed to over six hours for a set of Tee-bodies.
For asset management, CLEER devices have their own mapping symbol on the GIS, making it much easier to track the devices and analyze their performance. Engineers are assessing a handhole version of the CLEER device that can operated from outside the hole.
Future plans/next steps
SDG&E intends to inspect 50 – 70 structures per year, totaling approximately 200 T- body devices. They are intentionally limiting the number of replacements while they test their model and enhance its capabilities.
For example, the model’s next version will include the number of customers per protective zone rather than the total number of customers on a particular circuit. In addition, based on experience with the model, SDG&E experts now believe that the 12kV substation bus fault current input into the model is not a significant contributor to the risk prediction and will exclude it from the amended model.
The risk-based approach to asset management and corrective maintenance is working well across the system, and is helping SDG&E target resources where most needed. With the use of a model-based predictive system, the utility is overcoming the complexities posed by the large number of assets on its distribution system.
7.7.1.16 - SCL - Seattle City Light
Planning
Asset Management
People
Organization
Network Planning at Seattle City Light is performed by the Network Design Department, which is part of Energy Delivery Engineering. See Attachment A: SCL - Org Chart . The Network Design Department focuses exclusively on the planning and design of SCL’s networks.
Although SCL does have a separate planning group that performs distribution planning activities for SCL’s non-network distribution system, this group does not do the planning associated with the network. All cable ratings, load flow and voltage studies, master load flow analysis, assignment of feeders to load additions, area studies, etc. associated with the network are performed by the Network Design Department staff.
(Note that SCL is currently implementing an Asset Management organization. At the time of this writing, SCL had not yet decided whether certain tasks currently performed by the Network Engineering group will be moved into the Asset Management organization.)
The Network Design Department is made up of a System Group (eight engineers) and a Services Group (eight engineers). These engineers do all of the planning and engineering for the network (the System Group), as well as interface with network customers for load additions, new loads, etc. (the Services Group). The individuals in this group are four-year degreed engineers. The senior level engineer position at SCL requires a PE license. The engineers at SCL are represented by a collective bargaining agreement (IBEW).
Technology
Network Maps and Asset Records
SCL utilizes a home-developed system called NetGIS. NetGIS is their repository for network asset records, and also the product they use to produce network maps. NetGIS is not a full, graphical GIS system with electric connectivity. Rather, it enables SCL to produce CAD maps, and to maintain records associated with each network vault. Note that their load flow analysis product is not tied in with NetGIS.
More specifically, SCL personnel can obtain maps from the system, and can click onto a vault to obtain a description of the equipment contained in the vault including:
-
Splice type and information
-
Ductbank configuration
-
Civil information
-
Ground points
-
Busbar
When a change is made to the network, the GIS section updates the network feeder maps in NetGIS.
7.7.2 - Cable Rating
7.7.2.1 - AEP - Ohio
Planning
Cable Rating
People
Cable rating is performed by the AEP Network Engineering, which is organizationally part of the AEP parent company. Network Engineering includes two Principal Engineers and one Associate Engineer who perform network planning and engineering, including cable rating, for the Columbus and Canton urban underground networks. These engineers are geographically based in downtown Columbus at its AEP Riverside offices. Columbus-based Network Engineers perform cable ratings in collaboration with AEP Distribution and the Network Engineering Supervisor. The Network Engineering group reports to the AEP Network Engineering Supervisor, who in turn reports Distribution Systems Planning Manager. Distribution Systems Planning reports to the Director of Engineering Services who in turn reports to the AEP Vice President of Customer Services, Marketing and Distribution Services.
AEP also has a Network Standards Committee, headed by the lead Network Engineering Supervisor in its downtown Columbus offices, and comprised of representatives from all AEP operating companies. This group works closely with the parent company’s Distribution Services organizations, and holds regular teleconference sessions on network findings, “lessons learned” in the field, and discusses potential network engineering solutions to common network planning and implementation issues. This committee will discuss and recommend cable ratings modeling approaches to be applied to AEP networks.
Process
AEP Ohio Network Engineers use the published thermal ratings of primary and secondary cables available from the manufacturers as a basis for cable rating models. These ratings tables contain thermal capabilities consistent with normal and emergency temperatures and are input into CYMECAP for further analysis. According to the AEP Network Planning Criteria guide, “the tables use the methods of J.H. Neher and M.H. McGrath. These tables also contain impedance data to be used in computer studies and to support network plans. To insure consistency, only data from these tables is to be used in network planning studies.” These methods are incorporated in the CYMCAP tool used by AEP Ohio Engineers.
The Network Engineers also analyze other factors to determine the thermal resistivity, including the type of backfill, duct line configuration, and results from thermal resistivity measurements. Thermal resistivity information is also entered into the CYMCAP software, which generates adjusted cable ratings for the region.
Technology
Cable ratings are based on published charts from manufacturers and the AEP parent company. This data, along with local variables that can affect the ratings, such as soil type, is used in CYMECAP to arrive at ratings curves. This modeling provides accurate ratings for use in the field for AEP Network Engineers. The CYMCAP cable rating module is used for both primary and secondary feeder ratings (see Figure 1).

Figure 1:
CYMCAP software module for rating cable thermal resistance
[Source:CYME International T&D ]
7.7.2.2 - Ameren Missouri
Planning
Cable Rating
People
Responsibility for producing tables that provide cable ampacity ratings at Ameren Missouri lies with Distribution Planning and Asset Performance. This group, led by a manager, is staffed with four-year degreed engineers, and includes the Standards Group as well as a planning engineering Group. Organizationally, Distribution Planning and Asset Performance is part of Energy Delivery Technical Services, reporting to a vice president.
Local distribution planning of both the network and non-network underground infrastructure in St. Louis is the responsibility of the engineering group within the Underground Division. The Underground Division is led by manager, and consists of both engineering and construction resources responsible for the downtown infrastructure. The engineers in this group are responsible for applying the company’s standards, derating cables appropriately based on their duct bank configuration when performing designs.
Ameren Missouri has produced tables that provide cable ampacity ratings for various types of cable based on size, type, and duct bank configuration. These tables are maintained by the Standards Group.
Process
Ameren Missouri has generated tables that provide cable ampacity ratings for various types of cables based on duct bank configuration. These cable ratings provide guidance to field engineers to derate the cable to a certain level based on field conditions, such as the duct bank configuration.
The cable ratings are fairly conservative. The tables were developed by the Standards Group 15 to 20 years ago, and are not routinely revisited.
Technology
The information in the cable ampacity tables presently used at Ameren Missouri was generated by hand, and using an Ameren Missouri cable rating program.
7.7.2.3 - CEI - The Illuminating Company
Planning
Cable Rating
People
The Planning and Protection Section uses manufacturer published ratings for cables in performing loading studies. Depending on the situation, they may use adjusted ratings that are provided by either the Underground / LCI Section of Engineering Services group or by the corporate Design Standards group.
In the past, CEI had developed and published specific cable ratings for cables of various types and in various scenarios (Normal ratings for winter and summer, emergency ratings, ratings in various duct bank configurations, etc.). In addition, the corporate Standards group also publishes cable ampacities lists with de-rating factors based on duct bank configuration. The Dispatch office keeps a copy of these ratings.
CEI does not periodically revisit and update the ratings list without some indication of a change in conditions. The current practice at CEI is to re-rate cables on an “as need” basis. This re-rating is performed by either the Underground / LCI Supervisor within the CEI Engineering Services department or a Senior Engineer within the corporate Design Standards group.
Process
CEI has documents that provide cable ratings for each feeder. For example, when CEI moved to the use of EPR cables, they computed the cable ampacities of EPR cables for various duct configurations. Note that FirstEnergy has made a decision not to de-rate cables in cable risers (above ground).
CEI does not systematically perform calculations and update cable ratings on their cables based on system conditions and configuration. Instead, their Engineering department will perform cable rating calculations in response to a particular project need. For example, “I need another 20 amps, can I get it?” In response to such a request, either an engineer in the Underground / LCI section of the Engineering Services group, or an engineer within the corporate Design Standards group will perform the cable rating calculations.
Technology
When a specific calculation is needed, cable ampacity ratings are computed manually by the Underground / LCI Section of Engineering Services using the Neher-McGrath method. The corporate Design Standards group is utilizing a Cable Ampacity Software package to assist in performing cable rating calculations.
7.7.2.4 - CenterPoint Energy
Planning
Cable Rating
People
At CenterPoint, cable rating is performed by the Electric Distribution Planning department (Planning group). This group is not part of the Major Underground group organizationally. One planning resource, an Engineering Specialist, is assigned full time to work in Major Underground, in a matrixed arrangement.
The Planning group is comprised of 21 total resources, including 2 Lead Engineers. Each of the Lead engineers has about 6 -8 people reporting to them. These folks are either 4 year degreed engineers, or technical experts. CenterPoint aims to have a balance between Engineers and Technicians.
CenterPoint encourages its engineers to obtain their PE license. The PE license is required to become a Senior Engineer.
Process
In 2004, the Engineering department of the Major Underground group engaged a contractor to perform an analysis of CenterPoint feeder ampacities and produce updated ampacity tables for their 12kV and 35kV cables.
-
The study included a review of CenterPoint’s distribution duct banks to identify duct sections that are most likely to have high cable temperatures. In general, the duct bank sections that were selected had a high number of feeders in the same duct bank and / or a relatively deep installation depth.
-
The method involved installing sensors and fiber optic cables within selected duct banks to perform temperature measurements to verify the accuracy of calculations performed within cable ampacity programs. Measurements were taken at 18 different duct bank sections on two different occasions (the last weeks of July and August). The temperature monitors recorded temperatures of a vacant duct at one meter intervals between manholes.
-
The contractor also performed an analysis of hourly load data for the feeders in the duct bank to determine and correlate the daily peaks and load /loss factors to the distributed temperature measurements. This information was then used to perform cable ratings calculations on other feeders.
-
The contractor produced a detailed report of CenterPoint Feeder ampacity tables.
The Planning group does perform a global recalculation of the cable ratings on a regular basis. They will review a circuit rating with respect to adding new load or pulling in a new feeder on an as needed basis. They will also perform analysis in response to feedback from the field that certain areas may be getting hot, or from information about feeder loading gathered from their substation monitoring system. A feeder that is “near the limit” may warrant a careful look at the duct bank configuration and analysis of the cable ampacity.
CenterPoint noted that they have had little experience of burned up cables due to overload.
Technology
When a specific calculation is needed, cable ampacity ratings are computed by the Planning group using CymE CAP cable rating software.
7.7.2.5 - Con Edison - Consolidated Edison
Planning
Cable Rating
People
Rating of cables for network feeders and network cable sections is performed by the Network Engineering and Planning group. Responsibilities of this group include Energy Services, Distribution Engineering, Operations Services, Marketing and Sales, Planning and Analysis, and D.C. Elimination.
Process
Distribution network feeder and cable section ratings are calculated by using the Con Edison Poly-Voltage Load Flow (PVL) system. The system considers the impacts of soil type and temperature. The system does not automatically consider the proximity of electrical facilities to steam mains.
Technology
Load Flow System – Poly-Voltage Load Flow (PVL)
Con Edison utilizes a distribution load flow application called Poly-Voltage Load Flow (PVL). The PVL application is actually a suite of applications that was developed in house over a 20-year period of continued development. In addition to aiding engineers in performing load flow analyses, the PVL system is used to build feeder and transformer models, develop network transformer ratings, develop network feeder and cable section ratings, model area substation outages, and identify short-circuit duty at customers sites, etc.
7.7.2.6 - Duke Energy Florida
Planning
Cable Rating
People
Cable Ratings for cables used by Duke Energy Florida are published and maintained by its Standards Group. Network Planners and Designers used these published ratings to determine cable loading limits.
Process
Duke Energy Florida’s standard feeder cable for non-network applications is 1000MCM Al XLPE. For network feeders (in Clearwater), their standard size is 4/0 CU XLPE, with pockets of 750MCM AL XLPE in place in some areas.
When planning additions or refurbishments, designers adhere to the Cable Ratings.
Standards arrives at its ratings using manufacturers’ specifications and through testing of sample cables. All Duke Energy Florida Engineering personnel have access to the standard ratings through CYMCAP. Additionally, CYMCAP is run to determine case-specific cable ratings if the cable is constructed differently than manufacturers’ specifications, or there are characteristics of the cable run that may impact the cable rating (such as multiple cables in a duct bank).
Technology
The Standards Group maintains Cable Ratings in CYMCAP, available to all Engineers.
7.7.2.7 - Duke Energy Ohio
Planning
Cable Rating
People
Cable rating for network feeders is the responsibility of the network planning engineer.
Process
For planning, Duke Energy Ohio uses standalone, 90° loading limits. The planning engineer noted that for radial systems the 90° loading limits work well because the other equipment has similar equivalent ratings. Moreover, radial feeder duct banks aren’t that crowded.
Duke Energy Ohio uses the CYMCAP cable ampacity calculation software. The planning engineer has access to CYMCAP studies for primary cables produced by previous planners. The planning engineer is presently evaluating the results from the earlier studies to determine the appropriate cable rating for network feeders. CYMCAP will be used to update ratings for feeders that have changed since the prior studies.
Secondary cables have been rated by hand calculations by prior planning engineers.
Technology
Duke Energy Ohio uses the CYMCAP cable ampacity calculation software.
The planning engineer maintains a file of cable ratings for network feeders.
For radial feeders, Duke publishes both the normal rating in emergency rating of the feeders on the feeder maps. For network feeders, feeder ratings are not published on the maps.
7.7.2.8 - Energex
Planning
Cable Rating
People
Cable rating is performed by engineers within the Network Capital Strategy and Planning Group, part of the Asset Management organization. The Network Capital Strategy and Planning Group is led by a group manager.
Process
Energex has performed studies to determine cable ratings for feeders supplying their CBD. These cable ratings consider factors such as anticipated operating temperatures, soil conditions, and duct back configuration. Energex cable ratings are published in a database of ratings, called the ERAT system, and also included in the tables associated with their load flow tools. For example, all cable ratings are housed within the DINIS load flow product used for analysis of their 11 kV primary system feeding the CBD.
Energex does not normally de-rate cables in performing its normal designs. However, in special situations, the company may perform cable ratings analysis using CYMCAP [1] to identify situation specific ratings.

Figure 1:
Sample Energex cable rating criteria for XLPE cables
Technology
Cable ratings are housed within the DINIS load flow product used for analysis of their 11 kV primary system feeding the CBD. In special situations, Energex may perform cable ratings analysis using CYMCAP to identify situation specific ratings.
[1] CYMCAP, Cable Ampacity Calculation software, from CYME, a Cooper Power Systems company.
7.7.2.9 - ESB Networks
Planning
Cable Rating
People
Cable rating at ESB Networks networks is performed by planning engineers within the Network Investment groups – two groups responsible for planning network investments in the North and South. Organizationally, the Network Investment groups, both north and south, are part of the Asset Investment organization. In addition to the Network Investment groups, the Asset Investment organization is also comprised of a Generation Investment group and a Specifications group, each led by a manager. The Asset Investment group is part of Asset Management.
Cable rating is performed by planners, with one planner focused on HV planner and four focused on MV planning. Most of these individuals are degreed engineers, but some are “Technologists,” who have developed their expertise through field experience.
Cable planning standards and criteria are developed jointly between the Asset Investment group and the Strategy Manager, which is part of the Finance and Regulation group within Asset Management.
Process
The Dublin MV underground network is operated at 10 kV. The 10 kV system is supplied from either a 38 kV system or from a 110 kV system. ESB Networks has 31 38:10kV stations, and 7 110 kV:10kv stations.
ESB Networks takes a highly planned approach to rating cabling throughout its network. Ratings are documented in the company’s Cable Manual for use by planners and by maintenance personnel. Each cable type receives not only a standard rating but also summer and winter peak ratings. The ESB Networks rating system also takes into consideration factors such as the number of feeders, clearances based on circuit / duct configuration, and any likelihood of thermal bottlenecks.
Ratings include the following factors:
-
Soil thermal resistivity
-
90 ° C maximum operating temperature
-
Burial depths of 0.45 m for LV, 0.75m for MV, and 0.9 m for HV
-
A 5 ° C winter rating and a 15 ° C summer rating
-
150 mm spacing of circuits between ducts
Solid paper cable is rated at 65 ° C operating temperature and fluid-filled cable at 85 ° C. All cable is buried in ducts at minimum depths, but may be buried lower depending on soil conditions. If there is an inquiry concerning a load, the engineer must consult with the planning group to assure the proper cabling is used for the load it will carry. This ensures that cabling used is within ESB Networks-documented design limits.
In selecting cable size, ESB Networks assesses factors such as long-term economic loading to justify cable size, short circuit capacity and any likely derating factors, such as bunching of cables in the vicinity of substations, burial depth, crossing bad ground, and crossing other cables. (See Figures 1, 2, and 3).

Figure 1:
ESB Networks derating profile

Figure 2:
Cable derating factors

Figure 3:
ESB Networks circuit spacing standards
Cable selection criteria include the following factors:
-
Current rating
-
Voltage drop
-
Short circuit rating
-
Mechanical strength
-
Cost of losses
-
Lifecycle costs over 25 years
Note that due to the high concentration of salt in the air, corrosion of cable is a great concern for ESB Networks. The company is actively seeking best practices in corrosion mitigation. ESB Networks asks its cable suppliers to provide at least a five-year cable warranty that covers corrosion.
Technology
ESB Networks has a comprehensive cable rating manual (“Cable Book”), which includes cable-rating illustrations. The manual is available online for ESB Networks personnel. ESB Networks also uses CYME Power Engineering® software for cable-rating information.
7.7.2.10 - Georgia Power
Planning
Cable Rating
People
Planning of the network underground infrastructure in Atlanta and other metro underground systems (Savannah, Macon, and et al.) is the responsibility of the Area Planners assigned to these metro areas and the Network UG engineering group within the Network Underground Division. The Network UG Engineering group, within the Underground Network Division, is led by a Manager, and is comprised of engineers and technicians responsible for the network. Engineers within this group work with Area planners, and with principal engineers who are part of the Underground Network Division to plan the network system, including cable rating.
Process
Much of the cable rating and cable selection is a direct result of Georgia Power duct line configurations. In many urban areas, Georgia Power has been constrained to using lead cable due to smaller duct lines already in place, but the emergence of reduced-diameter EPR cable has made it possible to replace failed 300 mcm PILC with 350 mcm EPR Georgia Power has not entirely stopped installing PILC, however, as it has been highly reliable. They use 300 MCM three-conductor paper/lead compact sector lead cable in many places (See Figure 1 and Figure 2); in other areas they EPR insulated cables. In some cases of lead cable failures, Georgia Power may replace it with EPR.

Figure 1:
PILC Cable, sector shaped conductors

Figure 2:
PILC Cable, joint preparation
Historically, cable ratings were developed manually by a Principal Engineer within the Network UG Engineering group. Cable rating charts were developed based on standards from cable rating books, as well as system specific characteristics such as soil type. For example, in Savannah, where there is a great deal of sand that may dry up in summer months, ratings are adjusted based on anticipated high duct line temperatures. The engineering group has taken sample measurements from there to make more accurate cable ratings. The system-wide goal is a peak of no more than 90 percent of rating. If a system is at 91 percent of rating, for example, it is watched closely. When it approaches 97-98 percent, it usually receives immediate funding.
Georgia Power is in the process of implementing modeling software (CYMCAP) that is highly flexible and accounts for a number of variables in its cable-rating sub-module, including duct bank design, cable design, soil and backfill, and temperature. Nonetheless, they still retain both historical and objective system observations to augment their cable ratings before any deployment. Secondary cables can also be rated and modelled in the system.
Technology
Cable ratings are based on manually developed charts by the Underground Network engineering group. Georgia Power is increasingly using CYMDIST and the CYMCAP cable rating module for cable rating, including the secondary, as well as augmenting the software modeling with field samples and system observations.
7.7.2.11 - HECO - The Hawaiian Electric Company
Planning
Cable Rating
People
The Distribution Planning Division uses manufacturer published ratings for cables in performing loading studies. The Technical Services Division, within the Engineering Department performs cable rating calculations.
Depending on the situation, HECO may require the calculation of normal and emergency cable ratings in a certain duct bank configuration. Should the Planning group require a cable rating calculation, they will provide the information (duct bank configuration, for example) to the Technical Services Division who will perform the cable rating calculations.
The System Operator has a list of emergency cable ratings for 46kV and 138kV lines, but not for the lower primary voltage lines.
Process
HECO has documents that provide cable ratings for each feeder as part of its standards book. These ratings include normal and emergency ratings. HECO does not periodically revisit and update the ratings list without some indication of a change in conditions. Because HECO uses a standard duct bank configuration upon which the ratings are based, the tables do not need to be updated very often.
The current practice at HECO is to re-rate cables on an “as needed” basis, such as a specific project where the duct bank configuration may be modified, or the addition of load to a cable near its limit.
Technology
The Technical Services Division is utilizing USAmp + Cable Rating Software, by USi to assist in performing cable rating calculations.
7.7.2.12 - National Grid
Planning
Cable Rating
People
Cable ratings are performed by the field engineers that work in the distribution planning area. For example, the field engineer who focuses on New York’s Eastern division, including Albany, would be the engineer to perform cable ratings for the Albany network.
National Grid uses historic cable ratings published in tables, and uses these numbers for routine situations. On a case-by-case basis, field engineers may calculate cable ratings where they believe conditions might limit the available capacity of a particular cable.
Process
Cable ratings for network infrastructure are reviewed as part of an overall analysis of the network, performed on a five year basis at National Grid. Field engineers will model the system to identify potential areas of impact. Planning engineers use a conservative loading level as a threshold for these studies – normally well below the rated thermal limits of the cable - and identify areas where this may be exceeded. Part of this process may include an analysis of cable ratings on a case-by-case basis where the particular configuration of cables suggest the need to specifically re-rate a cable or cable section (such as proximity to a steam main, for example).
Technology
National Grid Albany uses a cable rating software called USAmp + by USi to aid them in calculating cable ratings in complicated situations. Note that in these situations, the field engineer may enlist the services of other National Grid engineers who are experienced with the software to perform the calculations.
7.7.2.13 - PG&E
Planning
Cable Rating
People
The PG&E Standards department publishes tables that show cable ampacity ratings. These tables include ratings for various conductor configurations and load factors[1] .
[1] Defined by PG&E, for the purpose of cable rating, as the ration of peak loading to average loading.
Process
PG&E calculates cable ratings by looking at both heat dissipation based on the conductor configuration, and on load factor. For example, they will provide a cable rating for a conductor configuration of six equally loaded conductors (6 ELC); that is, a cable that has six other cables surrounding it all having the same loading. Similarly, they will show cable ratings that factor in heat dissipation based on fewer cables surrounding the cable. The higher the ELC, the lower the rated capacity of the cable.
PG&E also considers the load factor. For example, they will publish a cable rating at a 75% load factor; that is, they assume that the cable carries peak load 75% of the time, and is not heavily loaded the remainder of the time. PG&E will also publish cable rating values for different load factor levels. The lower the load factor, the higher the rated capacity of the cable.
The planning engineer uses the cable rating to ascertain what loading the network can support, and to make planning decisions, such as when to reinforce the infrastructure.
Technology
PG&E is presently implementing the CYMCAP cable ampacity calculation software. Historically, they have worked from tables to develop cable ratings.
7.7.2.14 - Portland General Electric
Planning
Cable Rating
People
Network Engineering develops and maintains the standards for the network, and these are then forwarded to the Standards Department. For example, Network Engineers developed the cabling rating standards for the network. Distribution Network Engineers assume responsibility because the Standards Department lacks the necessary network expertise. Distribution Engineers also provide the loading information used to create CYME and PSSE models.
The Manager of Distribution Engineering and T&D Standards oversees the Standards Department, and their emphasis is the overhead and underground residential distribution (URD) systems rather than the network system. The group underwent recent reorganization recently and employs one technical writer and four standards engineers.
Process
Cables: PGE generally uses flat strap EPR 500 MCM copper medium-voltage cables in its network, as three triplexed conductors fit into its 3.5 in. (8.9 cm) diameter clay conduits. In certain applications, the company uses a reduced insulation 750 MCM copper cable that fits into 4 in. (10.2 cm) conduits. For taps into a network vault, PGE typically uses 1/0 copper cables. PGE has lead cable installed in both its network primary and secondary. The company has a proactive effort underway to replace primary lead cables with EPR insulated cables in its network primary.
Engineers use modeling tools to keep track of cable ratings. PGE uses CYMCAP to determine cable ratings, and the Transmission and Distribution Planning and Standards Department have developed peak cable rating guidance. The company uses these standards to specify the allowable normal and emergency loading for all cables on the network. PGE is improving its processes for documenting and standardizing equipment and procedures on the network, including cable ratings.
To isolate areas of the distribution system where cables may be overloaded, Planning Engineers use CYMEDIST for the radial system and PSSE for the network. Using base case models and seasonal loading data, under different contingencies, engineers can ensure that lines do not exceed 67% of their normal seasonal thermal rating on the radial system, which translates to two-thirds of the normal capacity for a standard feeder. On the network, base loadings specify that no line should be loaded at more than 88% on the network. PGE prioritizes any areas of concern for equipment upgrades[1].
Distribution Temperature Sensing (DTS): In PGE’s DTS pilot, the company installed real-time line sensors on six network feeders to provide temperature readings for underground cables at two-second intervals. Because temperature influences capacity, the sensors may show where system upgrades may be required. In addition, the system could allow PGE to locate hotspots that indicate a potential cable failure. PGE has included the DTS in the new substation intended to begin operation in 2018-2019[2].
Technology
PGE uses CYMCAP to calculate ampacity and temperature rises for power cables, helping planners and designers maximize performance. The system models steady-state and transient cable ratings. CYMCAP uses Neher-McGrath and IEC-60287 methods, and provides a graphical representation for most power cable types. The library contains cable data and supports updates. The system recognizes a variety of installation practices, including direct burial, thermal backfill, ducts, and duct banks. The library also includes databases with load curves and different heat sources.
The transient thermal analysis can calculate the ampacity, temperature, or time taken to reach a certain temperature. It can use user-defined load profiles for circuits and handle multiple cables for every installation, with circuits loaded simultaneously or one-by-on[3]. PGE also uses CYME and PSSE to model base case scenarios on the radial and network systems, which allows planners to determine where cable loadings may exceed recommended levels.
- Derek Harris. 2014. PGE Stephens Network System Split Report, internal document.
- Smart Grid Report. Portland General Electric, Portland, OR: 2017. http://edocs.puc.state.or.us/efdocs/HAQ/um1657haq16327.pdf (accessed November 28, 2017).
- CYME. “Power Cable Ampacity Rating.” CYME.com. http://www.cyme.com/software/cymcap/ (accessed November 28, 2017).
7.7.2.15 - SCL - Seattle City Light
Planning
Cable Rating
People
Organization
Network Planning at Seattle City Light is performed by the Network Design Department, which is part of Energy Delivery Engineering. See Attachment A: SCL - Org Chart. The Network Design Department focuses exclusively on the planning and design of SCL’s networks.
Although SCL does have a separate planning group that performs distribution planning activities for SCL’s non-network distribution system, this group does not do the planning associated with the network. All cable ratings, load flow and voltage studies, master load flow analysis, assignment of feeders to load additions, area studies, etc. associated with the network are performed by the Network Design Department staff. (Note that SCL is currently implementing an Asset Management organization. At the time of this writing, SCL had not yet decided whether certain tasks currently performed by the Network Engineering group will be moved into the Asset Management organization.)
The Network Design Department is made up of a System Group (eight engineers) and a Services Group (eight engineers). These engineers do all of the planning and engineering for the network (the System Group), as well as interface with network customers for load additions, new loads, etc. (the Services Group). The individuals in this group are four-year degreed engineers. The senior level engineer position at SCL requires a PE license. The engineers at SCL are represented by a collective bargaining agreement (IBEW).
Culture
The Network Engineering group has a close working relationship with the Civil and Electrical construction and maintenance groups within the Area Field Operations – Network Department and the Distribution Operations Department. EPRI observed high levels of mutual respect between these groups, and high confidence by the field organizations in the planning and design decisions made by the Network Design Department.
SCL has remained committed to the network engineering department staffing levels, hiring new engineers into the network area to fill vacancies. SCL has no formal training program for network engineers. However, network engineers are sent to special classes on network equipment, etc. as part of their ongoing development.
Process
SCL rates cables at 90 ˚ C; that is, they develop a cable ampacity rating that limits the conductor heating to 90 ˚ C. SCL does not develop an emergency or 24-hour rating for feeders. They plan their system to the 90 ˚ C limit. SCL develops feeder specific ratings based on field conditions. Using software, they develop ampacity ratings for circuits that consider factors such as cable type, duct bank configuration, soil resistivity, proximity of foreign utilities, design temperature (90 ˚ C), load factor (80%), etc. SCL performs both a summer and winter analysis. The summer ratings, which are the most conservative, are typically used for planning purposes.
SCL re-rates cables any time conditions in the field change that could affect cable rating, including the addition of another parallel circuit, the addition of a foreign utility such as a steam line, a new cable in the duct bank, etc. The specific cable ratings are entered into the load flow software for planning analysis.
Technology
SCL has been using a mid-1990s cable rating computer product called USAmp developed by USi. Within this software, SCL maintains a file containing cable specifications. The software enables planning engineers to specify the Rho (ρ – resistivity) based on the use of concrete duct bank, the diameter and wall thickness of the duct bank, pertinent dimensions such as the distance between conductors and between conductors and the wall of the duct bank, and other components such as the load factor and design temperature. The software generates cable ratings that are used for planning. SCL is currently using a cable rating product developed by CymE. SCL will also be using ETAP, which performs cable rating as well.
7.7.2.16 - References
EPRI Underground Distribution Systems Reference Book (Bronze Book)
7.7.2.17 - Survey Results
Survey Results
Planning
Cable Rating
Survey Questions taken from 2015 survey results - Planning
Question 33 : To what level of circuit loading (in % rated circuit capacity) do you design for normal conditions?

Question 34 : To what level of circuit loading (in % rated circuit capacity) do you design for a contingency situation?

Survey Questions taken from 2012 survey results - Summary Overview
Question 1.12 : Average primary circuit loading under no contingencies? (In percent of circuit rating)

Question 1.13 : Average primary circuit loading under the worst contingency that is planned for? (Percent of circuit rating)

7.7.3 - Cable Replacement Strategy
7.7.3.1 - AEP - Ohio
Planning
Cable Replacement Strategy
Network Revitalization
People
Network revitalization, improvements, and refurbishment are planned by the AEP Ohio Network Engineering group in tight collaboration with its parent company. The company employs two Principal Engineers and one Associate Engineer to perform all network design and planning activities for the Columbus and Ohio urban underground networks. These engineers are geographically based in downtown Columbus at its AEP Riverside offices, and organizationally part of the parent company Distribution Services organization. The Network Engineering group reports to the AEP Network Engineering Supervisor, who ultimately reports the AEP Vice President of Customer Services, Marketing and Distribution Services.
AEP also has a Network Standards Committee, headed by the lead Network Engineering Supervisor in its downtown Columbus offices, and comprised of representatives from all AEP operating companies. This group works closely with the parent company’s Distribution Services organizations, and holds regular teleconference sessions on network findings, “lessons learned” in the field, and discusses potential network engineering solutions to common network planning and implementation issues. This committee can and does recommend system revitalization, improvements, and refurbishments for the AEP Ohio networks to the parent company. After approval from the AEP parent company, AEP Ohio Network Engineering and the AEP Network Engineering Supervisor plan the revitalization projects and oversee their completion.
Process
AEP Ohio has a number of on-going network revitalization and refurbishment projects in the works, including the following:
- Replacement of Secondary Cable
After incidents involving fire in manholes caused by faulty secondary cables in 2014, the parent company, AEP, determined that an investigation team should look into the incident and report its findings. The investigation included the following:
-
On-the-ground inspection of cables in duct lines by camera
-
Scientific modeling of the existing secondary cable and its loads
-
Load flow models to identify cables that are overloaded or nearly fully loaded
-
Examination of failed secondary cable at AEP Ohio, as well as outside testing by third-party consultant
The summary report of these investigations determined that the secondary styrene butyl cable was the cause of the fire due to cracked insulation. Network engineering analysis found that its insulation breaks down due to overheating and may produce combustible gases. Network Engineering has performed load analyses that have identified the cable runs most at risk and are a priority in the replacement process.
The summary report in AEP Ohio served as a basis for examination of all network grid systems in the AEP operating companies. It was found that other locations may need to rehabilitate secondary cabling as well.
In response, AEP formed a Project Management Team to initiate and lead a program to inspect and replace selected secondary cables throughout the AEP system.
AEP Ohio and all AEP network operating groups have prioritized the secondary cable replacement according to conditions (see Figure 1).

Figure 1:
AEP mitigation and prioritization strategy for secondary cable replacement
The cable replacement project, totaling $300 million for all of AEP, will result in replacement of nearly 202,600 circuit feet of secondary cable in AEP Ohio. System-wide, AEP will replace in excess of 900,700 circuit feet of secondary cable. This massive undertaking also led AEP to reinforce its existing network inspections to aggressively perform the following throughout the AEP operating companies:
-
Visually inspect every manhole and vault
-
Note not only secondary cable conditions, but also note conditions of every other network component in the manhole and vault, including transformers, switches, primary cables, etc.
-
Record all inspections of manholes and vaults into the system-wide asset tracking database called NEEDS (Network Electrical Equipment Database System)
To help drive the system-wide inspections and spur replacements and repairs, a Gantt chart and a system dashboard were put in place and updated weekly to track the progress of the inspections and replacements program (see Table 1 and Figure 2).

Table 1:
Portion of weekly dashboard report on secondary network inspections. (See Appendix D for a sample of the entire spreadsheet)

Figure 2:
Sample of Gantt chart for AEP Operating Companies’ inspection and rehabilitation schedule
Secondary butyl and other cable (such as cloth PILC and older durasheath XPLE) are being replaced with 750 EAM insulated cable. The 750 EAM cable was chosen by the engineers because it fits in the current duct lines and has the capacity and thermal rating required by the network. The older butyl cable was rated at 70 degrees C, whereas the 750 EAM is rated at 90 degrees C (see Figure 3).

Figure 3:
750 EAM secondary replacement cable rated at 90 degrees C
In addition, AEP Ohio has found that secondary lead cable in its system, when hot, can cause fires that threaten other cables in the duct lines. Therefore, lead cables are also scheduled for replacement under this revitalization and refurbishment project (see Cable Replacement).
Network Protectors
All 480 volt network protectors in AEP Ohio are scheduled for upgrades to Eaton model CM52 protectors as well as older 216 volt units. Many have already been installed. The CM52 offers greater safety, flexibility, and data collection and operation via the new fiber-optic SCADA system, also under deployment (see Design - Network Protector Design ). All network protectors have microprocessor based relays.
Fire Protection
Eaton High Thermal Event Systems are being deployed on high value 480 volt spot networks located in building vaults. If a fire is detected, the system automatically trips, isolating the affected transformer or bus before fire can spread.
SCADA Fiber-Optic Cables
The entire SCADA communications network is being upgraded to a double-loop, fully-redundant fiber-optic cable network. The new SCADA network cable is fast, lightweight, and fault tolerant (see Remote Monitoring).
Network Transformers
AEP Ohio is updating all its transformers to dry type units without an integrated primary switch as older systems come out of service. These newer transformers will require less maintenance for AEP Ohio. The network unit will include a wall-mounted solid dielectric vacuum switch to separate the transformer from the primary
Technology
AEP Ohio uses CYMCAP and CYME SNA modules for its cable ratings, load analyses, and network circuit modelling. Its NEED database tracks all system serialized assets and their conditions as recorded by inspections. NEED also includes civil asset information such as underground vault and manhole structures.
7.7.3.2 - Ameren Missouri
Planning
Cable Replacement Strategy
People
Ameren Missouri has a formal cable replacement program. The program is focused mainly on replacing a faulty URD cable, and takes advantage of techniques such as directional boring.
A criterion for replacement of cables in the urban underground system is under development by the Underground Revitalization Department. This criterion will provide for the testing, replacement, maintenance and improved utilization of cable systems within downtown St. Louis, and will include plans for non-jacketed and jacketed PILC cable cloth covered secondary cable, and 15 kV solid dielectric cables. The strategy will also include guidelines for 15 kV bolted separable splices.
Ameren Missouri has not historically performed routine diagnostic testing of network cables (other than fault location testing and some proof testing after cable repair). They have joined the Cable Diagnostic Focused Initiative (CDFI), and have recently performed some cable diagnostic tests working with the CDFI to evaluate test methods.
Process
Draft Asset Strategies for various cable types are under development at Ameren Missouri. The following table, excerpted from the Draft Ameren Missouri Cable Replacement Criteria, summarizes their proposed strategy for each cable type.

Figure 1:
Current Asset Plan
7.7.3.3 - CEI - The Illuminating Company
Planning
Cable Replacement Strategy
(Predictive Cable Failure Initiative)
People
The Predictive Cable Failure Initiative is a FirstEnergy wide effort led by the corporate Distribution Planning and Protection department. The group is made up of representatives from FirstEnergy operating companies, including CEI, and is charged with developing recommendations for cable testing, maintenance and replacement approaches at First Energy that optimize investment, and reliability.
Process
The group has analyzed cable performance and has identified eight key factors that can be used to assess cable failure risk. They have researched various cable diagnostic alternatives, and have documented the costs and benefits of various testing alternatives. They have laid out what a full cable testing program would look like, including an estimate of costs and system impacts.
The group is in the process of developing a final recommendation.
7.7.3.4 - Duke Energy Florida
Planning
Cable Replacement Strategy
People
Duke Energy Florida has a formal primary cable replacement program in place, which includes replacement of cables for both network and non-network feeders. The replacement program is a two-year program, with a goal to replace 60,000 feet of older cable per year in the South Coastal Region.
The cable replacement is being performed by contractor crews (six people), who are performing the complete installation, including cable pulling and cable splicing. The crew is on a two-year contract, working on 35-40 cable pulling locations that involve network infrastructure. The contractors provide all equipment, such as cable pulling gear, heavy trucks, etc. The crews start the workday at a remote mustering point, and report to a Duke Energy Network Specialist who has been temporarily upgraded to serve as a contractor supervisor. Because of the size of the project, it is also being managed by the Resource Management group, who meets twice per month with the contractor for progress updates.
In addition to the cable replacement program, Duke Energy Florida network crews are replacing secondary mole connections throughout the Clearwater network system for network hardening. Duke Energy Florida has proactively targeted replacement for older mole connections in manholes prone to long periods of time underwater. Duke Energy Florida has found that these secondary cable mole connections are subject to bloating and cracking over time.
Process
One driver for the cable replacement program was that the company had experienced a high amount of faults on older cables due to a deterioration of the metal center plug used at T-body connections. The engineering group decided to replace the metal body center plugs and cable to harden the underground network system. Figure 1 shows a typical center plug with a metal ring used on the Duke Energy Florida network system.

Figure 1:
Center plug with metal ring
Historically, Duke Energy Florida’s cable design called for the use of T-bodies (600A separable connectors) for both straight as well as Y and H splices, so that cables could be easily separated for fault locating, maintenance and for future system enhancements. Historically, the center plugs used in the T-bodies were designed with an exposed metal ring which was prone to deterioration with age and with prolonged submersion in water. Figure 2 shows a crack on a failed center plug with a metal ring.

Figure 2:
Crack in failed center plug
Recognizing they had a high concentration of cables with the T bodies with the suspect center plug component in downtown St. Petersburg, and that the cables were of an older vintage (early 1980s) nearing the end of the cable life, Duke Energy Florida elected to perform a targeted cable replacement, rather than solely replace the center plugs associated with T bodies. Figure 3 shows the replacement center plugs currently being installed. Figure 4 shows a close up of the Elastimold center plug without an exposed metal body.

Figure 3:
Replacement center plugs

Figure 4:
Close-up, replaced plug, no metal exposed
Duke Energy Florida noted that it is virtually impossible to just replace the center plugs, because before unbolting and parting the cable, their process calls for spiking the cable to confirm that it is de-energized, thus damaging additional infrastructure that must be replaced. When they encounter a vault or manhole that contain T-bodies with the older center plugs, they will not enter the hole while the cable is energized. They will schedule for replacement, sectionalizing to de energize and isolate the section, before performing replacement with new components.
Duke Energy Florida has already identified approximately 43 locations with T-body connections with the older style center plugs to be replaced. At most of these locations, the T-bodies are submerged. Their experience has shown failures often occur after the water is removed. The primary reason for the failure is because the water serves to pass the electrical stresses across the center plug. After the water is removed, the plugs tend to fail because of additional electrical stress on the plug.
Duke Energy Florida is also performing a further assessment in the other portions of its service territory to identify other cable populations that may also be built with T-bodies with the metal ringed center plug component, in order to determine whether to expand the replacement program.
Technology
Duke Energy Florida is installing Elastimold K651CP connecting plugs as replacements for the older metal body T plugs previously used. The Elastimold K651CP is a deadbreak connector that can be removed when the cable is energized to facilitate work on the connected cable.
7.7.3.5 - Duke Energy Ohio
Planning
Cable Replacement Strategy
People
Duke invests in cable replacement of poor performing feeders and of PILC feeder sections.
A priority list is developed by the Asset Manager, based on cable diagnostic test results.
Process
The list of circuits to be changed out is driven by test results. Tan delta testing may produce results that suggest that the cable system may be prone to failure (significant dielectric loss or change in measure losses). From those test results, crews will perform an investigation of the feeder, using TDR to find the problems, and popping manhole lids to investigate, and identify condition.
For lead feeders, Duke will target the entire feeder for replacement.
7.7.3.6 - Energex
Planning
Cable Replacement Strategy
People
Energex has an Asset Management organization responsible for managing the network infrastructure to yield expected results (reliability, for example), and for making asset investment decisions, such as cable replacement. The Asset Management organization is led by an Executive General Manager, and includes organizations that support the management of assets including the Network Capital Strategy and Planning group, the Network Optimization group, the Data Services and Demand Management group, the Systems Engineering group, the Network Maintenance and Performance group, as well as the Metering, Safety and Environmental groups.
Process
Energex uses PAS 55 standards for the optimal management of physical assets. Energex uses a program called Condition Based Reliability Maintenance (CBRM), which seeks to develop a health index and risk score for all assets, and use that information to drive decisions such as maintenance approach and replacement criteria. The company utilizes a combination of asset age and condition identified through inspection and diagnostic testing to determine a health score.
The risk score examines operational performance and impacts on safety to identify a level of risk associated with each asset. The results of this program drive the company’s investment in refurbishment. Note that its program does not define specific actions based on scores. Rather, these indicators point Energex managers to scrutinize the performance of a particular asset class more closely. It is this additional scrutiny and investigation that results in action.
Energex has had difficulty applying this program to the 11 kV and low-voltage cable fleet population within the CBD, as the company does not have good records of asset type and vintage. Energex does not perform routine diagnostic testing of cables, other than troubleshooting (fault finding), and new cable commissioning tests (DC or AC hi-pot). Thus, the company does not have a cable replacement strategy for the cables within the CBD.
Note that they utilize both PILC and XLPE cable in the CBD.
Technology
Energex uses Condition Based Risk Management System (CBRM) software from EA Technology to track the health and condition of assets throughout the underground system. The system assigns a health index and risk score for all the assets in each class, such as circuit breakers, transformers, etc. Length of time in service, test results, and any refurbishment work is input into the system. The system can “score” some assets based on aging mechanisms housed within the system that can be used to predict potential end-of-life. Actual refurbishment and replacement work is driven by the calculated health scores.
7.7.3.7 - ESB Networks
Planning
Cable Replacement Strategy
People
Much of the cable installation and replacement in the ESB Networks underground network is performed by contractors. In the past, graduate student engineers were used on line work, but this has become far less frequent in recent years. Otherwise, cable replacement and installation is performed by Network Technicians, who work on all cable voltages.
ESB Networks has a four-year apprentice training program for attaining the journeyman Network Technician position. Network Technicians who worked as cable jointers work closely with both the Training group and the Asset Management groups at ESB Networks. Network Technicians readily bring information about problems with particular cable joints back to these groups.
The Training and Underground Networks group within the Assets & Procurement organization share the process of performing forensic analysis of failed joints and in preparing the failed component summary reports. Within both groups, ESB Networks has significant cable/cable accessory expertise. Both groups work closely with Network Technicians to ensure that they understand the science of cable joints and have an appreciation for the importance to long-term joint reliability of performing the proper steps associated with cable joint preparation.
Process
ESB Networks has installed significant amounts of MV (10-kV and 20-kV) cables over the past 10 years. Thirty-four percent of the total in-service MV cable has been installed in the past few years. Most of this installation has been outside of Dublin, in both rural and urban areas. Figure 1 shows the total amount of installed MV cable from 2000 to 2012.

Figure 1:
Installed MV cable
ESB Networks has also installed significant amounts of LV cables – used for their LV network mains. Thirty-seven percent of the total in-service LV network cables have been installed within the past seven years (statistic includes replacement of cables). Figure 2 shows the total amount of installed LV cable from 2000 to 2012.

Figure 2:
Installed LV cables
Technology
ESB Networks has embarked on a five-year cable replacement program and is spending €11.4M on replacing oil filled cables and terminations due to higher than acceptable failure rates in recent years. The company is also replacing lead cable by retrofitting 38 kV PILC cables with XLPE, especially within the business district.
ESB Networks’ approach in developing its replacement plan includes determining ESB Networks’ overall risk profile, comparing age versus performance of cables older than 65 years. In all, ESB Networks will replace 18 km of cables that are the critical feeds for the city. ESB Networks estimates this replacement will reduce the risk of failures by approximately 50 percent. As part of its replacement program, ESB Networks is also targeting older (pre-1982) XLP insulated cables, as this cable had been experiencing an average of eight faults per 100 km.
7.7.3.8 - Georgia Power
Planning
Cable Replacement Strategy
Cable Replacement
People
Georgia Power utilizes a combination of PILC cable and EPR insulated cable in its Atlanta network. They continue to use lead cable in some locations where they may be limited by conduit size, or locations where they may require a Y splice in a limited space. However, the company is increasing its use of EPR cable for new installations where practical.
Note: in Savannah, Georgia Power has replaced its lead secondary cable with EPR insulated cable.
Cable replacement is supervised by a senior engineer in the Network Underground group. Senior Cable Splicers within the group perform any needed cable replacement.
The Georgia Power Network Underground group has not historically performed routine diagnostic testing of network cables other than fault location testing and some proof testing after cable repair. Therefore, cable is replaced on an as-needed basis as determined by inspection, cable failure, or on recommendation of the supervising engineer.
Process
Because of its durability and space constraints in older duct lines Georgia Power is maintaining the use of lead cables in its four-inch duct lines and wherever it is currently performing well (See Figures 1 through 3.). If a lead cable fails in a larger duct or a manhole with room to accommodate newer EPR cable splicing, the group will replace the lead with EPR insulated cables and accessories. (Georgia Power engineers noted that an EPR-type Y-splice at 20kV takes up virtually all the wall space in the manhole at most locations, and thus reduces their flexibility for future expansion. A lead Y splice is far more compact.)

Figure 1:
Lead cable joints

Figure 2:
Lead cable joint preparation

Figure 3:
Lead secondary cables – Atlanta
The Network Underground group is concerned that there is only one domestic source for its lead cable, and thus may become more aggressive in the future in replacing lead, particularly if a smaller form-factor EPR proves reliable (See figure 4.).

Figure 4:
EPR secondary cables – ring bus, Savannah
Technology
Georgia Power‘s lead cable system is extremely reliable. They establish performance goals for cable in terms of cable failures per year. For example, the goal for 2013 was to have no more than 23 cable failures. Cable failure performance is tied in with the overall performance management process at Georgia Power.
The utility industry is moving away from the use of lead-covered cables because of limited availability, environmental concerns, and complex splicing and terminating requirements. GPC’s Network Underground group is actively researching and testing other cable types as a replacement for lead. They are using more solid-dielectric cable at medium and low voltage. New and improved cold-shrink splices and terminations are being evaluated and will accelerate the move toward solid-dielectric cable.
7.7.3.9 - HECO - The Hawaiian Electric Company
Planning
Cable Replacement Strategy
(Cable Replacement Strategy Development)
People
A large portion of HECO’s service territory is served with 15 kV underground distribution. HECO has several different types of cable in the ground, including PILC, HMWPE, and XLPE. Like most utilities, the earliest installations of the XLPE cable were installed around 1970 and are nearing the end of their life.
Prior to the recent implementation of an Asset Management organization, asset management activities were being performed by various departments including the Technical Services Division within Engineering. Engineers within the Technical Services Division have been involved in an effort to determine what the optimum cable replacement strategy should be based on the historic and predicted failure of cables of different vintages and types.
HECO engaged the support of EPRI in conducting a study to improve their ability to perform quantitative analysis of the URD 15kV cable fleet in order to develop business cases and asset management strategies surrounding this cable. The specific objectives of the study were:
-
Improve quantitative cable fleet management ability
-
Develop asset management based fleet analytics
-
Maximize value of available data
-
-
Gain better understanding and clarify strategic view of future resource needs
-
Provide results useful for development of business cases and asset management strategies to support budgeting process
See Attachment - A
Process
HECO’s historic approach has been a reactive one based on an assessment of the reliability of feeders / feeder sections. Annually, engineers within the Technical Services Division would review the historical reliability performance of feeders, looking at things such as major outages, breaker trips, and number of customers affected to identify the worst performing underground feeders. On those feeders, the engineers would then “dig deeper”, looking at “cable cards” upon which is recorded the details of the outages experienced on the feeders. From this analysis, the engineers within Technical Services would develop either diagnostic strategies, such as performing VLF testing on suspect cable sections to better understand the condition of the cable insulation weaknesses, or replacement strategies.
HECO is currently in the process of developing a more formal strategy for cable replacement. This effort is being led by Asset Management and supported by KEMA.
7.7.3.10 - National Grid
Planning
Cable Replacement Strategy
People
National Grid has developed a formal primary underground cable replacement strategy that includes primary network cables. The strategy does not apply to URD cables, underground primary cables serving pad mounted transformers, or to sub-transmission cables. The intent of National Grid’s strategy is to eliminate all primary underground cable more than 60 years old from the system within fifteen years.
Process
National Grid does not have a central repository of age data for primary underground cable. However, in New York, they do have plant accounting records and limited age data stored at local levels.
From this information, National Grid performed an analysis in 2008 that revealed that approximately half of the in-service primary underground cable was more than 20 years old, and nearly eight percent was more than 60 years old.
In establishing a strategy for addressing aging underground primary cable, National Grid examined several scenarios, each based on setting a target for the maximum allowed age of underground primary cable installed, and then determining the annual replacement level required to achieve a condition of zero cable older than the target age within a fixed period of time. The scenario selected was to use an upper age limit of 60 years as a target.
Using the 60 year age target, they considered three replacement rates: an “aggressive” rate, requiring 10 years to achieve no cable older than target; a “moderate” rate, requiring 15 years to achieve no cable older than target; and a “sustained” rate, requiring 20 years to achieve no cable older than target. They selected the moderate rate program, requiring an annual replacement of approximately 90 miles per year.
In projecting the costs of the program, National Grid developed estimated costs per mile to install cable in existing duct, and estimates to install cable and duct.
7.7.3.11 - PG&E
Planning
Cable Replacement Strategy
People
PG&E does not have a formal cable replacement program for their network system. Rather, they have implemented diagnostic testing of network feeders and will replace bad cable sections revealed by the testing.
Most of the primary system supplying the 12kV network is PILC, and is highly reliable. PG&E replaces lead cable with lead cable, other than in areas where they must transition to dead front equipment terminations. The 750 copper EPR with the flat strapped neutral is sometimes used as replacement for PILC cable where duct size is limited.
For their 35KV networks, which utilize XLPE cables, PG&E is replacing failed cable sections with EPR insulated cable.
7.7.3.12 - Portland General Electric
Planning
Cable Rating
People
PGE has a proactive cable replacement program aimed at replacing PILC primary network cables with EPR insulated cables.
Three Distribution Engineers focus on both the networks and non-network infrastructure in the CORE. The engineers provide technical data and perform risk assessments used for the Strategic Asset Management Program, which evaluates the economic benefits of programs, such as cable replacement.
The CORE underground falls within the Portland Service Center (PSC). The resources focused on the CORE are responsible for both non-network (radial) underground and network systems. The CORE resources perform cable replacement.
Process
The PILC network cable replacement program is part of an initiative called the Performance Improvement Assessment (PIA), which utilizes detailed root-cause analyses performed by the Network Engineers to drive actions to improve performance. The scope of the program is to replace all current lead primary feeders with EPR insulated cables. PGE is focusing on replacing primary cables before moving towards a proactive secondary lead cable replacement program planned for the future. PGE often performs lead cable replacement at night because of city restrictions on closing the streets during the day.
As part of its Strategic Asset Management Program, in 2013, PGE developed an economic lifecycle model to evaluate cable, using data gathered by crews over the past 40 years. This supported a model that used the correlation between age and insulation type, which recommended a program of replacement and/or injecting XLPE cable.
PGE assessed that targeted cable replacement would improve reliability by removing a significant risk posed by aging cable. As part of a strategic asset management program, PGE’s model evaluated approximately 11,300 conductor miles (18,185 km) of cable and determined which sections were most likely to experience failure. After this, the model determined which areas would cause the most disruption according to loading and/or customer numbers. In total, PGE has replaced 203 conductor miles (327 km) of cable.
Note that the use of the economic lifecycle model described above has not yet been applied to network cables. Because the replacement of lead cables in the network was already occurring from the PIA, the Strategic Asset Management Group deferred inclusion of an analysis of network cables in the economic lifecycle model though it still plans to include it in the program.
PGE does not presently perform any routine diagnostic cable testing on the network. In the past, they have performed some diagnostic testing on primary network cables crossing the river. Before commissioning new cable or returning a de-energized primary circuit to service, crews perform a direct current (DC) high potential (hipot) test. Very low frequency (VLF) testing is performed on the getaway cables at substations. PGE is not performing a tan delta test.
Technology
For connecting lead cable to EPR, PGE uses Raychem Transition Splices. Although the company prefers pulling EPR all the way, that is, fully replacing the lead cable with EPR insulated cable, the Raychem splices are used if this is not possible.
Before cutting a cable, crews test it using a device called a hummer to verify its de-energized state. If the cable is energized, the device will “hum” significantly. Note that use of the hummer is not foolproof. PGE relies on a combination of maps, tags, and the hummer device to identify de-energized cables. The standard work practice is to cut a cable remotely by placing a “guillotine” cutter on the cable and activating it from outside the vault.

Figure 1:
A 'hummer' to verify the de-energized state of a cable
7.7.3.13 - Survey Results
Survey Results
Operations
Cable Replacement Strategy
Survey Questions taken from 2018 survey results - Asset Management survey
Question 26 : Are you implementing targeted replacement programs for any of the following equipment?


Question 27 : If Yes, are any of your replacement programs Aged based, such as replacing all transformers >50 years old?


Question 28 : If Yes (to question 26), are any of your replacement programs Design based, such as replacing all high rise fluid filled transformers with dry type units, or replacing a certain type of cable?


Survey Questions taken from 2018 survey results - Manhole Event Preparedness and Response
Question 18 : Are you implementing targeted replacement programs for any of the following equipment? (check all that apply)


Question 19 : Are any of your targeted replacements driven by equipment that is beyond a particular age?


7.7.4 - Circuit Modeling
7.7.4.1 - AEP - Ohio
Planning
Circuit Modeling
People
The circuit modeling and analysis of network feeders for AEP Ohio is performed by the AEP Ohio Network Engineers, which is part of the Network Engineering group within AEP Distribution. Note that this group also provides consultative support to network planners at the other AEP operating companies.
Process
The Network Engineers, working with AEP Distribution, maintain circuit models of all circuits and network feeders within the AEP Ohio underground systems in CYME. The planning process involves running load flows to compare system loading to the feeder ratings and to evaluate the implications to the system of anticipated new forecasted loading. Forecasts from the parent company look 10 years ahead, and include historic peak loads and anticipated/planned new projects with significant input from the AEP Ohio Engineers who have specific information concerning new projects planned in their area. The calculated monthly load flows are also reviewed by AEP Distribution Planners to better provide forecasting of loads.
Downtown Columbus is a stable network. The AEP Ohio Engineers plan on maintaining its existing network and adding additional capacity to the downtown using radial distribution. Most planning activity is focused on improving the existing network with refurbishment and modernization projects.
Engineers model the system, and perform analyses to understand anticipated requirements. For both circuits and network feeders, planning engineers will perform Single and Double Contingency Configuration studies. From this analysis, planning engineers determine where reinforcement is necessary to be able to reliably serve customers in the Double Contingency Configuration that is standard in AEP Ohio’s Columbus network.
Technology
AEP Distribution provides circuit and distribution information to AEP Ohio. Then, load flow and secondary network analysis is performed in CYME® Secondary Grid Network Analysis (SNA) software system (see Figure 1). The AEP Ohio Network Engineering group also uses kWh data captured through remotely monitored meters and uses sophisticated algorithms to convert this data to identify peak loads on the network. This peak load information is shared with AEP Distribution monthly. With this captured data and the CYME circuit analysis software, AEP Ohio Network Engineers have a solid basis for Circuit and Load Flow modeling on their networks.

Figure 1:
CYME load flow analysis software used by AEP Distribution to aid in Circuit Modelling for AEP Ohio
7.7.4.2 - Ameren Missouri
Planning
Circuit Modeling
People
Network planning, including modeling and analyzing network feeders, is performed by the Engineering group within the Underground Division. The Underground Division, led by manager, consists of both engineering and construction resources responsible for the downtown infrastructure. The Engineering group is led by supervising engineer, and is comprised of Engineers and Energy Services Consultants (commonly referred to as Estimators) who deal with planning, design, and service issues. The engineers are four-year degree positions. Energy Services Consultants have a combination of years of experience and formal education, including two year and four year degrees. The engineers are nonunion employees; the Estimators are in the union.
Process
The network engineers maintain circuit models of all network feeders within the DEW load flow product.
The planning process involves running load flows to compare system loading to the feeder ratings and to evaluate the implications to the system of anticipated new forecasted loading. Engineers model the system, and perform analyses to understand anticipated requirements.
For network feeders, planning engineers will perform contingency studies, modeling networks with each primary feeder out of service to identify areas of needed reinforcement to supply the network in a contingency.
For radial feeders, planning engineers will perform contingency studies (N-1 planning) to assure that they can pick up customers with reserve feeders within the emergency ratings of the transformer and cables. More specifically, they model the distribution system with one feeder out of service, simulating customers connecting to reserve feeders. From this analysis, planning engineers determine where reinforcement is necessary to be able to reliably serve customers in a contingency situation.
Technology
Ameren Missouri uses the Distribution Engineering Workstation (DEW) load flow product to model their network system. This software, developed by EPRI, and Electrical Distribution and Design, Inc (EDD), a company affiliated with Virginia Tech University, is an open architecture application that contains 20 analysis and design calculations applicable to distribution systems.
For networks, this model is manually populated and maintained by the planning engineers. For radial circuits, DEW imports information and attributes from Ameren Missouri’s GIS system, and imports load information from a transformer load management (TLM) system.
The model includes a graphic representation of the primary, secondary, and network unit. For example, when modeling the feeder out of service, DEW will model all the protectors opening.
Note that at the time of the practices immersion, Ameren Missouri had assembled a list of desired enhancements to the DEW product.
7.7.4.3 - CEI - The Illuminating Company
Planning
Circuit Modeling
People
The CEI Planning department develops circuit models to perform various circuit analyses. The CEI Planning department is comprised of 4-5 Planners and 2-3 Protection Engineers. All members of the group are four year degreed engineers.
Process
When a new load is anticipated to connect to the system, the Planning engineer will model the new load by attaching the load to the appropriate node in the circuit model, and running a normal configuration load flow as well as several contingency scenarios. The results of this analysis will generate system reinforcement project ideas that are sent to Engineering for design.
Technology
For Network analysis, CEI utilizes a load flow product called PSLF – Positive Sequence Load Flow Software, by GE Energy.
For performing short circuit calculations, CEI is utilizing the CAPE software from Electrocon International.
FirstEnergy is in the process if moving from using Windmill load flow software to CYME load flow software. They ultimately intend to apply CYME to network analysis.
7.7.4.4 - CenterPoint Energy
Planning
Circuit Modeling
People
Circuit Modeling at CenterPoint is performed by the Electric Distribution Planning department (Planning group). This group is not part of the Major Underground group organizationally. One planning resource, an Engineering Specialist, is assigned full time to work in Major Underground, in a matrix arrangement.
The Planning group is comprised of 21 total resources, including 2 Lead Engineers. Each of the Lead engineers has about 6 -8 people reporting to them. These folks are either 4 year degreed engineers, or technical experts. CenterPoint aims to have a balance between Engineers and Technicians.
CenterPoint encourages its engineers to obtain their PE license. The PE license is required to become a Senior Engineer.
Process
The Planning group has modeled their entire distribution system, including the network. They run GIS extracts to obtain background maps, transformer sizes, etc., and import into their modeling software. They also import circuit loading information from SCADA and demand information from large customers. Planners also have access to real time information from CenterPoint’s remote monitoring system.
When a new load is anticipated to connect to the system, the Planning engineer will model the new load by attaching the load to the appropriate node in the circuit model, and running a normal configuration load flow as well as several contingency scenarios. The network model is used to plan for contingency situations, revealing potential overloads both in primary feeders, and in the networked secondary system.
Where possible, they use specific measured demand data in their models. Where specific transformer loading information is not available, they will apportion load measured at the circuit level along the circuit based on transformer capacity.
The results of this analysis will generate system reinforcement project ideas that are sent to Engineering within Major Underground for design.
Technology
CenterPoint is using the CymE Power Systems Analysis Framework (PSA) software suite. CenterPoint has recently implemented CymE’s network modeling software.
CenterPoint engineers noted that much of the work they do involves custom modeling to analyze the economics of various options.
Planners will compare information from their real time monitoring system to values produced by their analysis software to validate their models.
CenterPoint is in the process of installing automated meters at all distribution locations (a 5 year initiative) that will provide measured (15 minute) load information from all metered locations. They plan to integrate this information into their model.
The Planning group noted that in the future, as “smart systems” are implemented at CenterPoint, a new, Distribution Management System (DMS) controller may “do the modeling” of circuits. In any case the Planning engineers will be tightly integrated into this process.
See Network Planning - Technology
7.7.4.5 - Con Edison - Consolidated Edison
Planning
Circuit Modeling
People
Circuit Models are developed by the Network Engineering group using Con Edison’s Poly-Voltage Load Flow (PVL) software.
Con Edison has formed a PVL users group that meets bi monthly to discuss issues associated with the PVL. The PVL Users group is made up of approximately 50 people from both the regions and corporate, including network model maintenance people, designers, supervisors, engineers, engineering managers, and support personnel. Approximately 15 members attend any one meeting.
Process
To perform load flows, circuit models are brought into PVL from the mapping systems.When the circuit information is brought into PVL, the new information overlays the existing circuit model already in the system. Once the model is brought into PVL, all users use the same model. When a circuit is brought into PVL, people responsible for model maintenance ensure that the PVL model has electrical connectivity and is in synch with the mapping system.
Load flows are conducted for a variety of reasons.
-
Planning engineers run base case load flows, N-1 cases, and N-2 cases. For each contingency, the PVL output tells you what is overloaded in tabular and graphical formats.
-
Planning engineers use PVL to assist in short-range and long-range planning. For example, the system is used to analyze conceptual projects to split existing networks into smaller networks
-
For new business, engineers run the existing case, and then re-run it with the new business load added to understand the loading and voltage implication of the new load.
-
Region Engineering runs feeder loading studies in advance of the summer to identify anticipated overload conditions.
-
The system is also used to understand the loading implications of different restorations scenarios in an outage.
Technology
Load Flow System – Poly-Voltage Load Flow (PVL)
Con Edison utilizes a distribution load flow application called Poly-Voltage Load Flow (PVL). The PVL application is a suite of applications that was developed in house over a 20-year period of continued development. In addition to aiding engineers in performing load flow analyses, the PVL system is used to build feeder and transformer models, develop network transformer ratings, develop network feeder and cable section ratings, model area substation outages, and identify short-circuit duty at customers sites, etc.
PVL can use real-time readings from transformer vaults (gathered through Con Edison’s Network Remote Monitoring System [RMS]) for building the network load model. If needed, demands can be spotted at customer service points, using information such as customer kWh consumption and real-time transformer readings.
The PVL system can also perform cable section ratings. The system considers the impacts of soil type and temperature. The system does not automatically consider the proximity of electrical facilities to steam mains.
Operators are able to take advantage of the functionality of PVL through a real-time version known as AutoWOLF, which takes the base model and applies real-time conditions. For example, real-time transformer loading information would populate the model from RMS system. Knowledge of open feeders would populate the model from SCADA. When a circuit locks out, AutoWOLF automatically runs the system peak case, the current case, and the projected peak case, so that that information is available to an operator. The operator can look at the loading on the other feeders and try to determine which feeders to watch.
7.7.4.6 - Duke Energy Florida
Planning
Circuit Modeling
People
Network planning at Duke Energy Florida, including modeling and analyzing network feeders, is performed by the Network Planning group, which is organizationally part of the Power Quality, Reliability, and Integrity Group (PQR&I), led by a Director of PQR&I for Duke Energy Florida.
To perform planning work, the Network Planning group divides the Duke Energy Florida territory into four separate zones. The cities of Clearwater and St. Petersburg, part of the South Coastal Region, are included in one of the four zones. Every zone is assigned a Lead Planning Engineer and Senior Planning Engineer, who are responsible for all distribution planning activities within the zone.
Engineers/Planners in these zones work on Reliability as well as Planning. Because Duke Energy Florida has seen minimal capacity demand growth in its urban underground grid, Engineers in the PQR&I group spend much of their time planning reliability and infrastructure upgrades.
All Planners have four-year degrees in Electrical Engineering, a requirement for the position.
Process
The Planning Engineers maintain circuit models of all network feeders. The planning process involves running load flows to compare system loading to the feeder ratings and to evaluate the implications to the system of anticipated new forecasted loading.
Load growth on the Clearwater network has been flat. St. Petersburg has seen some load growth, with most new loads being serviced by a primary and reserve feeder scheme with an automated transfer switch.
Planning Engineers model the system and perform analyses to understand anticipated requirements. For network feeders, Planning Engineers will perform contingency studies, modeling networks with each primary feeder out of service to identify areas of needed reinforcement to supply the network in a contingency. In locations where customers are service by a primary and reserve feeder scheme, engineers will model the distribution system with one feeder out of service, simulating customers connecting to reserve feeders. From this analysis, Planning Engineers determine where reinforcement is necessary to be able to reliably serve customers in a contingency situation.
Technology
Network Planners use CYME Power Engineering software to perform load flow calculations on primary feeders. The underlying circuit models were originally built from manual circuit maps, and then updated with required details to perform load flows. Note that Duke Energy Florida does have its network primary feeders modeled in its GIS system, but is not importing these circuit models into CYME for the purpose of updating and performing load flow analysis on network feeders, as the network feeder configuration does not change much year-to-year. Rather, the network circuit feeder model is already loaded in CYME and is updated with peak loading information from the Feeder Management System.
Duke Energy Florida does not use software to model their network secondary. Rather, they perform real-time monitoring of secondary loading using a Sensus (Telemetrics) remote monitoring system that provides information from the vault, aggregated at the Network Protector relay. Within the Network Group, information such as secondary loading is monitored twice per day.
Duke Energy has implemented a Florida Primary and Secondary Network Improvement Plan, which has identified network modeling ability (secondary) as a key gap. As a consequence of this effort, they have initiated an effort to update their existing electronic files of secondary network information and will select an appropriate planning and load modeling tool for the future. In addition, they are working on developing a sustainability plan to assure that up-to-date secondary models are maintained.
7.7.4.7 - Duke Energy Ohio
Planning
Circuit Modeling
People
Historically, the planning Department models the network using spreadsheets. This model includes ties between customer loads and secondary bus sections within specific manholes.
More recently, Duke Energy Ohio is using SKM power tool up as a planning tool to model the network system. Information from the spreadsheets is manually entered into the SKM tool to perform load flow analysis, and run “what if” scenarios.
Process
The planning engineer has focused recently on bringing this model up to date. The model includes the street grid, including transformers by location, and including transformer sizing and impedance. The model has been updated to include new cables that Duke has recently changed. The model also contains updated loading information, including the loading of particular buildings. This loading information comes from several sources. Larger commercial customers have demand meters. Load readings are housed in the Duke energy billing system and for larger customers (over 300 KW) the customer provides a phone line and loading information flows back to the company’s billing system through the phone lines.
The planning engineer has also utilized the services of a co-op student to comb through the billing system and identify customer loading set off of the street grid.
Note that the updating of the network model is a manual process, updated once every three years. The model does not automatically import information from Duke Energy Ohio’s GIS system. (the network secondary system is currently not modeled in Duke’s GIS system). A longer term goal of the Planning Engineer would be to have the ability to automatically update the system model for analysis from the GIS with the push of a button.
Technology
Duke Energy Ohio is using SKM power tool up as a planning tool to model the network system. The SKM power tools product enables them to model secondary load flows.
The data for the model is housed and maintained in an Excel spreadsheet by the Network Planning Engineer.
7.7.4.8 - Energex
Planning
Circuit Modeling
People
Circuit modelling is the responsibility of the Network Capital Strategy and Planning Group, part of the Asset Management organization. The Network Capital Strategy and Planning Group is led by a group manager.
Process
Engineers and designers within the Planning Group use automated systems to model current and anticipated load flows in normal and contingency situations, to identify necessary enhancements to the distribution system.
Technology
For transmission planning, Energex is using PSSE (Siemens). For its 33-kV system, Energex uses PSS Sincal by Siemens. For the 11 kV system, Energex uses DINIS by Fujitsu to calculate load flow. Load flow products include automated tools to apply forecasts and calculate thermal and voltage issues. Energex also uses CYMCAP by Cyme International in its cable ratings area to account for parallel cable and varied duct configurations, etc.
7.7.4.9 - ESB Networks
Planning
Circuit Modeling
People
Distribution planning, including modeling and analyzing feeders, is performed by planning engineers within the Network Investment groups – responsible for planning network investments in the North, and the other for planning in the South. Organizationally, the Network Investment groups, both north and south, are part of the Asset Investment organization. In addition to the Network Investment groups, the Asset Investment organization is also comprised of a Generation Investment group and a Specifications group, each led by a manager. The Asset Investment group is part of Asset Management.
Planning is performed by one HV planner and four MV planners. Most of these individuals are degreed engineers, but some are “Technologists,” who have developed their expertise through field experience.
Planning standards and criteria are developed jointly between the Asset Investment group and the Strategy Manager, which is part of the Finance and Regulation group within Asset Management.
Process
Planning engineers perform circuit modeling and analysis, including loading studies, contingency analysis, voltage drop analyses, harmonic and flicker analyses, and motor start analyses for the ESB Networks MV (10-kV and 20-kV) distribution systems. For analysis of their MV system, ESB Networks utilizes SynerGEE, with circuit models established from their GIS system.
In their design, ESB Networks uses an extensive LV secondary system, fed from larger three-phase transformers. In analyzing the LV system, planning engineers seek to maximize the allowable voltage drop on the secondary system, and minimize the voltage of the MV system. As a rule of thumb, ESB Networks allows up to a seven percent drop in the secondary voltage on the secondary fed from the MV underground primary system. ESB Networks Network engineers noted that they usually encounter demand/capacity constraints before encountering voltage problems on the secondary. Note that the LV system is not modeled in SynerGEE,
Technology
For performing circuit modeling and analysis, ESB Networks is using SynerGEE to model their MV primary feeders and 38-kV systems. Note that ESB Networks has modeled their feeders in a GIS database, and uses this information to build the circuit models within SynerGEE.
For analyzing their 38-kV meshed transmission system supplying Dublin, and for modeling their 110-kV transmission system, engineers are using PSS Sincal.
For performing analysis of its extensive LV secondary system, ESB Networks uses a home-grown Excel spreadsheet tool. This tool includes a voltage drop calculator.
7.7.4.10 - Georgia Power
Planning
Circuit Modeling
People
Network planning, including modeling and analyzing network feeders, is performed by the engineering group within the Network Underground organization within Georgia Power. The Underground group, led by the Network Underground Manager, consists of both engineering and construction resources responsible for the network underground infrastructure at Georgia Power. The Engineering group, led by the Network Underground Engineering Manager, is comprised of Engineers and Engineering Representatives concerned with the planning, design, and any service issues. The engineers are four-year degreed positions, while Engineering Representatives have a combination of years of experience and formal education, including two-year and four-year degrees.
In addition to the engineers within the Network Underground Engineering group, the Network Underground group has two Principal Engineers who report to the Network UG Manager.
The Network Underground group also works closely with Area Planning Engineers. Organizationally, Area Planners sit outside the network Underground group, but have a dotted line reporting to engineers within the Network Underground group.
Process
The network engineers maintain circuit models of all network feeders within the Georgia Power underground systems. The planning process involves running load flows to compare system loading to the feeder ratings and to evaluate the implications to the system of anticipated new forecasted loading. Forecasts typically look three years ahead, and include historic peak loads and anticipated/planned new projects. Downtown Atlanta is now a relatively stable network. Most planning is focused on selected metro Atlanta projects such as expansion of the network in Buckhead where they are experiencing higher demand, and on accommodations for the new football stadium.
Engineers model the system, and perform analyses to understand anticipated requirements. For network feeders, planning engineers will perform contingency studies, modeling networks with each primary feeder out of service to identify areas of needed reinforcement to supply the network in a contingency.
They model the distribution system with one feeder out of service, simulating customers connecting to reserve feeders. From this analysis, planning engineers determine where reinforcement is necessary to be able to reliably serve customers in a contingency situation.
Technology
The underlying circuit models were originally built from scratch from a basic sketch of the network, and then filled in with details. Georgia Power then used its GIS system model as a base, traced it, and then manually entered the data into its CYME program. Note that Georgia Power elected to manually enter data in to CYME rather than import from their GIS. The reason for this decision was to be able to attain one-foot accuracy for cable lengths on both the primary and secondary circuits.
Using the CYMDIST load flow routine, Georgia Power can model primary system flows and meshed flows in the secondary. Georgia Power is also obtaining actively updating the accuracy of the models, validating with information from its newer meter data information systems where they are installed.
7.7.4.11 - HECO - The Hawaiian Electric Company
Planning
Circuit Modeling
People
The Distribution Planning Division performs circuit analysis at HECO. The Distribution Planning Division is part of the System Integration Department. This group performs all distribution planning at 46kV and below.
The group is led by a Principal engineer and is comprised one lead distribution engineer, and 5 planning engineers who do all of the distribution planning work for the island of O’ahu.
Process
HECO is currently in the process of installing a load flow software product to model circuits and perform analysis. Historically, HECO has not modeled circuits using a geographic tool. Instead, they have analyzed circuits by using loading information from different points along a circuit recorded on Excel spreadsheets.
Technology
HECO historically has not used a load flow software product to model circuits. They are in the process of installing SynerGEE, a load flow software product from GL Industrial Services. This product will interface with HECO’s GIS system and be able to import up to date circuit models. This software will facilitate their ability to perform contingency analysis. They are targeting year end (2009) for implementation of this software.
7.7.4.12 - National Grid
Planning
Circuit Modeling
People
At National Grid, network planning is performed by the Distribution Planning Organization, led by a Director. Organizationally, the Distribution Planning Organization is part of Distribution Asset Management, and is comprised of resources in both a central location (Waltham Massachusetts), and distributed throughout National Grid. About two thirds of the organization is centralized, with the remaining third decentralized.
The Distribution Planning department is comprised of Field Engineers who report to managers of Field Engineering for both New York and New England, Capacity Planning resources also reporting to a manager, and engineer personnel who have broad system responsibilities.
The Distribution Planning department is comprised of capacity planning resources, engineer personnel who have broad system responsibilities, and field engineers who report to managers of Field Engineering for both New York and New England.
The planning engineers who focus on the Albany network include a field engineer who works in the Albany office and focuses primarily on both radial and network underground systems for National Grid’s New York Eastern Division, and an engineer situated in Waltham, who has network engineering responsibilities across the system. These engineers have responsibility for both network planning and network design.
Both of these engineers are four-year degreed engineers, and are not represented by a collective bargaining agreement (exempt).
National Grid has up-to-date standards and guidelines for the network infrastructure. In addition they have up-to-date planning criteria that address network planning.
Process
National Grid has SCADA installed to monitor loading at the substation. They are able to obtain historic 15 minute interval load data as measured at the substation.
Planning engineers use this information as well as information from National Grid’s customer information system (CSS) to develop distribution feeder models. Customers within the CSS system are flagged as network customers. This identification as a network customer brings up certain fields to the aid engineers in assigning that customer to the appropriate buss within the secondary network system. The information from CSS is exported to a spreadsheet that is used by engineers to create the network system models.
Planning engineers have created models for the majority of the National Grid networks.
Technology
National Grid planning engineers use the PSSE power flow product to model and perform power flow analysis of the network system, and use a product called Aspen to perform fault analysis. (The Aspen product is also used by the System Protection group at National Grid.)
Note that the PSSE power flow product provides steady-state analysis. It cannot model network protectors (for example, back feed through the protectors).
In non-network areas, National Grid uses CymDist as a modeling tool, which has been integrated with their GIS system. National Grid has not applied this to the network system, as their GIS system does not model a meshed system.
7.7.4.13 - PG&E
Planning
Circuit Modeling
People
Network planning, including modeling and analyzing network feeders, is performed by the Planning and Reliability Department. This department is led by a Principal Engineer, who is also the department supervisor. This group does distribution planning for both the network and non-network systems. Eight engineers comprise this department. Six focus on the radial system, and two focus on the network system.
For network systems, the two planning engineers are responsible for distribution planning. Both network planning engineers are four year degreed engineers.
The planning engineers are represented by a collective bargaining agreement (Engineers and Scientists of California).
Process
The network engineer maintains circuit models of all network feeders within the EasyPower load flow product.
When a new customer, such as a high-rise building, desires connection to the PG&E network system, it files an application for service with the Service Planning Department. This department is responsible for gathering and validating loading information. They are also familiar with the electrical system, and can determine whether or not the new customer will be served by the network or radial system.
The network planning engineer will perform a low flow analysis to understand the impact on the system of the additional load in both the normal case and the contingency (n-1) case, in order to determine how to serve the load. For example, if adding the new load (and associated capacity) to the grid aids the overall grid in a contingency situation, engineers may decide to add the load to the grid. Conversely, if not, they may leave the customer on a spot network.
Technology
PG&E uses the EasyPower[1] load flow product from ESA to model their network system. This model is manually populated and maintained by the Planning engineer. This product allows for modeling of primary and secondary load flows. The EasyPower models are not tied in with PG&E’s GIS system. The planning engineer reports being satisfied with this planning tool. Note that PG&E uses a different load flow product for analyzing its radial system (PG&E EDSA system).
At the time of this immersion, PG&E was implementing the CYMEDIST (by CYME) load flow product for performing analysis of their radial system. In a subsequent phase of their project, they plan to implement the use of CYMEDIST as their network planning tool as well. A challenge for them will be the conversion of data from EasyPower to CYMEDIST.
7.7.4.14 - Portland General Electric
Planning
Circuit Modeling
People
Several groups are involved in circuit planning for the network system. For PGE, the Transmission and Distribution (T&D) Planning organization oversees the planning process for network and non-network systems,and performs contingency analyses with CYME and PSSE. APlanning Engineer with a four-year degree in engineering covers the PSC.
Three Distribution Engineers that work on the underground network provide the system operating information used to create and update models in CYME and PSSE. The Distribution Engineers are not based in the PSC service center or CORE group, and are overseen by the Eastern District Central Supervisor. The Planning Department is responsible for producing the “Weak Link Report,” which covers both the radial and network system and shows system peak loadings in summer and winter.
Because external projects drive much of the planning on PGE systems, the utility employs Service & Design Project Managers (SDPMs). SDPMs have a defined role and work almost exclusively on externally-driven projects, such as customer service requests, and liaise with new customers when designing services. Because the network includes many commercial customers with high energy demands, the Major Account Representatives responsible for the network provide any information about potential load changes from customers.
Process
Load Growth Studies: PGE performs load growth studies on the network when there is a specific need due to anticipated changing loads and customer demand. A Major Account Representative informs these studies and reports any anticipated changes to the load that a customer will undertake.
Reporting:The Planning Department creates bi-annual reports on the network loading, the “Weak Link Report,” which covers both the radial and network system. The report examines the system peak loading for the summer and winter, with network data sourced from the substations. PGE does not use the monitoring data that is currently received from the network protectors for modeling or planning. It is only used for operations.
PSSE Load Modeling Software: For the network system, PGE uses the Siemens PSSE modeling software for both the primary and secondary network models. Planners collaborate with Distribution Engineers to obtain the most up-to-date model in PSSE, including manually entering loading information. The load data is derived from the customer meters, and gathering and entering this information is a labor-intensive process. PGE’s network load is relatively flat, but the utility is anticipating an increase in the next few years due to an expansion of the retail sector in the downtown area.
Technology
PGE uses a number of information technology (IT) systems to model the system. For the radial system, PGE uses CYME/CYMDIST to model the system for both planning and reliability analyses. To model the network system, engineers use Siemens PSSE software for the primary and secondary network, using data from customer meters to develop a base case and highlight where normal and peak loading exceeded recommended limits.
Because PSSE is unable to monitor single-phase loads and cannot model loops, PSC will add the secondary network to CYME, using the GIS system to model and display loops. For mapping, PGE uses ArcFM on top of ArcGIS. The company is presently working with the ArcFM vendor to enable its use with CYME.
7.7.4.15 - SCL - Seattle City Light
Planning
Circuit Modeling
People
Network Planning at Seattle City Light is performed by the Network Design Department, which is part of Energy Delivery Engineering. The Network Design Department focuses exclusively on the planning and design of SCL’s networks.
The Network Design Department is made up of a System Group (eight engineers) and a Services Group (eight engineers). These engineers do all of the planning and engineering for the network (the System Group), as well as interface with network customers for load additions, new loads, etc. (the Services Group). The individuals in this group are four-year degreed engineers. The senior level engineer position at SCL requires a PE license. The engineers at SCL are represented by a collective bargaining agreement (IBEW).
Process
To perform load flows and voltage analyses, SCL engineers can call up a feeder, enter the changes, and solve the case. The output report is tabular, not graphic. The output indicates the load flow and voltage at each node.
Technology
SCL uses a load flow and voltage drop analysis software package developed in house (legacy software). The software is nodal but not graphical.
7.7.4.16 - Practices Comparison
Practices Comparison
Planning
Circuit Modeling

2015 Survey Results


Older Survey Results (2012)


7.7.4.17 - References
EPRI Underground Distribution Systems Reference Book (Bronze Book)
7.7.4.18 - Survey Results
Survey Results
Planning
Circuit Modeling
Survey Questions taken from 2015 survey results - Planning
Question 47 : Do you use software to perform network circuit analysis? (load flow studies, voltage drop analysis, etc)

Question 48 : If yes, are you using the software for…

Question 50 : In your network system analysis, do you model operation of network protectors due to reverse flows in your system?

Survey Questions taken from 2012 survey results - Planning
Question 3.15 : Do you use software to perform network circuit analysis? (Load flow studies, voltage drop analysis, etc)

Question 3.16 : If Yes, are you using the software for?

Question 3.17 : If you are using load flow software, please indicate which software product(s) you are using.

Question 3.18 : How do you collect network load data for modeling purposes?

Question 3.20 : In your network system analysis, do you model operation of NP’s due to reverse flows in your system?

Survey Questions taken from 2009 survey results - Planning
Question 3.10 : Do you use software to perform network circuit analysis? (Load flow studies, voltage drop analysis, etc) (This question is 3.15 in the 2012 survey)

Question 3.11 : If Yes, are you using the software for? (This question is 3.16 in the 2012 survey)

Question 3.14 : If you are using load flow software, please indicate which software product(s) you are using. (This question is 3.17 in the 2012 survey)

7.7.5 - Contingency Planning
7.7.5.1 - AEP - Ohio
Planning
Contingency Planning
People
Network planning at AEP Ohio, including contingency planning of the network, is performed by its Network Engineering group in tight collaboration with its parent company. The company employs two Principal Engineers and one Associate Engineer to facilitate network underground contingency planning for the Columbus and Canton urban underground networks. These planners are geographically based in downtown Columbus at its AEP Riverside offices. The Network Engineering group reports to the AEP Network Engineering Supervisor, who in turn reports Distribution Systems Planning Manager. Distribution Systems Planning reports to the Director of Engineering Services who in turn reports to the AEP Vice President of Customer Services, Marketing and Distribution Services.
AEP also has a Network Standards Committee, headed by the lead Network Engineering Supervisor in its downtown Columbus offices, and comprised of representatives from all AEP operating companies. This group works closely with the parent company’s Distribution Services organizations, and holds regular teleconference sessions on network findings, “lessons learned” in the field, and discusses potential network engineering solutions to common network planning and implementation issues.
Process
The network contingency planning process involves running load flows to compare system loading under first and second contingencies to the feeder ratings and identify and resolve any anticipated violations. AEP uses CYME and its SNA (secondary grid network analysis) module for performing network load analysis for the AEP Ohio group.
Reliable contingency operations depend on a thorough and thoughtful network design. One unique and long-standing practice employed by AEP Ohio’s underground network group is its use of N-2 network reliability in Columbus. As outlined in the Network Planning Criteria guide (see Attachment C) , Columbus operates in a Double Contingency Configuration (N-2). Adhering to these criteria, AEP Ohio urban networks in Columbus are designed to be served by up to six network feeders sourced from a single network station. The feeders must come from at least three low voltage buses, with no more than two network feeders per bus. These low voltage station buses are connected in a complete ring with closed tie circuit breakers between all buses. Multiple station transformers are connected so that a minimum of two transformers operate in parallel during operation. A third unit is used as a ready reserve hot spare. Circuit breakers are then used to automatically remove any faults from service without impacting normal operations. This provides N-2 service to all existing customers in the downtown region. All stations have a minimum of three transformers, some with as many as five or six.
AEP Ohio is not actively seeking to expand its network underground system, nor is it attempting to shrink its underground system. The Columbus urban area has four separate networks – North, South, Vine, and West – supplied from three substations. Each network is supplied from 138 kV/13.8 kV Δ -Y network transformers. All four networks are served by six feeders at 13.8 kV – each group of six originating from a single substation. There is no overlap in these networks. Each is built to N-2 reliability. In Columbus, the Vine network primarily serves spot networks in a high-rise area of downtown (Vine station), with some mini-grids at 480 V. The other three networks (North, South, and West) serve a mix of grid (216 V) and spot loads. Canton has one network supplied at 23 kV.
Technology
All network underground contingency plans are based on the company’s Network Planning Criteria guide from the AEP parent company, available in hard copy and online.
AEP uses the CYME SNA (secondary grid network analysis) module for performing network load analysis, including contingency analysis for the AEP Ohio group.
7.7.5.2 - Ameren Missouri
Planning
Contingency Planning
People
Distribution planning, including contingency planning of the network, at Ameren Missouri is performed by resources in several groups.
Area planning for the distribution system is the responsibility of Distribution Planning and Asset Performance. This group, led by a manager, is staffed with four-year degreed engineers, and includes the Standards Group as well as a planning engineering Group. Organizationally, Distribution Planning and Asset Performance is part of Energy Delivery Technical Services, reporting to a vice president.
Local distribution planning of both the network and non-network underground infrastructure in St. Louis is the responsibility of the engineering group within the Underground Division. This division is led by manager, and consists of both engineering and construction resources responsible for the downtown infrastructure. The engineering group is led by supervising engineer, and is comprised of Engineers and Energy Services Consultants (commonly referred to as Estimators) who deal with planning, design, and service issues. The engineers are four-year degree positions. Energy Services Consultants have a combination of years of experience and formal education, including two year and four year degrees. The engineers are nonunion employees; the estimators are in the union. Organizationally, the Underground Division is part of Energy Delivery Distribution Services, reporting to a VP.
Finally, Ameren Missouri has formed the “Underground Revitalization Department,” a team of engineers (all 4-yr degreed) focused on researching, evaluating, and developing plans for performing capital improvements to and revitalizing downtown St. Louis, including the network. This group’s role includes addressing issues such as the development and updating of network planning criteria. At the time of the practices immersion, the revitalization team had developed a series of planning criteria documents, including criteria for contingency planning. Organizationally, the Underground Revitalization Department is part of the Underground Division.
Process
Ameren Missouri designs its networks to N-1. However, Ameren Missouri plans for a substation bus outage and, if they lose any one bus, they may lose two feeders supplying a given network. The system is designed to handle this particular N-2 contingency.
The planning process involves running load flows to compare system loading to the feeder ratings and to evaluate the implications of anticipated new forecasted loading. Engineers model the system, and perform analyses to understand anticipated requirements. For network feeders, planning engineers will perform contingency studies, modeling networks with each primary feeder out of service to identify areas of needed reinforcement to supply the network in a contingency.
For radial feeders, planning engineers will perform contingency studies (N-1 planning) to assure that they can pick up customers with reserve feeders within the emergency ratings of the transformer and cables. More specifically, they model the distribution system with one feeder out of service, and the models simulate customers connecting to reserve feeders. From this analysis, planning engineers determine places where reinforcement is necessary to be able to reliably serve customers in a contingency situation.
The revitalization team has developed draft planning criteria that includes:
-
System: Bus outage will not result in any customer outages that cannot be restored by reserve feeder switching, either by manual switching operations or automatic transfer equipment
-
System: N-2 for grid network (primary feeders)
-
System: N-1 for spot networks
-
System: N-1 for radial circuits, any time of year
-
Single contingency: Loss of all cables in manhole, all load can be picked up with exception of load supplied directly from manhole OR maximum of 6 MVA of radial load
-
Single contingency: The loss of any single network transformer in a spot network shall not result in any outages to customers
-
Single contingency: Loss of all cables in any duct bank, all load can be picked up with exception of load supplied directly from duct bank (ducts peeling off to a customer) OR maximum of 6 MVA of radial load
Note that at the time of the practices immersion, this criterion was under consideration at Ameren Missouri.
Technology
Ameren Missouri uses the DEW load flow product to model their network system. For networks, this model is manually populated and maintained by the planning engineers. The model includes a graphic representation of the primary, secondary, and network unit. For example, when modeling the feeder out of service, DEW will model all the protectors opening. Note that at the time of the practices immersion, Ameren Missouri had assembled a list of enhancements they desire to the DEW product.
For radial circuits, DEW imports information and attributes from Ameren Missouri’s GIS system, and imports load information from a transformer load management (TLM) system.
7.7.5.3 - CEI - The Illuminating Company
Planning
Contingency Planning
People
Network Contingency Planning at CEI is performed by the Planning and Protection Section of the Engineering Services Department (CEI Planning Group). The group is part of the CEI Engineering Services department, and is led by a supervisor who reports to the Engineering Manager. The group is responsible for all distribution planning and protection, from 36kV and below. The CEI Planning Group is comprised of 4 Planners and 3 Protection Engineers. All members of the group are four year degreed engineers. The Planning Supervisor noted that he prefers candidates for the CEI Planning Group to have their Professional Engineer (PE) license.
Process
CEI’s standard network contingency planning is N-1; that is, they plan the network system such that all the system components, including primary feeders, secondary cable mains and taps, and transformers are sized to be able to carry the load within “specified thermal and voltage limits” during peak conditions when any single network feeder is out of service. Contingency planning criteria for network systems is described in the First Energy Underground Network Design Practice, 11-350. See Attachment A.
Regional Engineering Services is responsible to review new service load additions of 100kW or greater to assure that secondary cable sections and network transformation are sufficient during both normal and contingency situations.
The Planning and Protection Section does not regularly revisit and update their network load models and review potential contingency situations, as the network is very lightly loaded, and its configuration remains relatively unchanged. They will revisit these models in particular instances, where changes are anticipated to the system.
The Planning and Protection Section does regularly (annually) revisit and update their load models and review potential contingency situations for their Non network systems. Their planners divide the service territory into sections, with each planner having responsibility for particular substations. Planners will update their circuit models and perform load flow studies to understand and identify system reinforcement needs. This information is also fed into a corporate model that looks at the larger loading picture.
In CEI’s non – network, radially fed 11kV ducted conduit system, N-1 reliability is provided through the use of a “spare feeder” that feeds into larger customers and is available as a back up in case of the loss of one of the main feeders. In some cases, an automatic throw over scheme exists between the normal and spare feeder. CEI has one spare feeder backing up every six normally fed feeders into larger customers in downtown Cleveland. See “11kV Non – network Service to Large Customers ” for a more detailed discussion of this design.
In CEI’s 4kV radial distribution system, N-1 reliability is provided through manual tie points between feeders. In the event of a feeder outage, customers are restored through manual sectionalizing.
Technology
For Network analysis, CEI utilizes a load flow product called PSLF – Positive Sequence Load Flow Software, by GE Energy.
Note that FirstEnergy is in the process if installing CYME load flow software. They ultimately intend to apply CYME to network analysis; however, its functionality in this area is still being evaluated.
7.7.5.4 - CenterPoint Energy
Planning
Contingency Planning
People
Contingency planning at CenterPoint is performed by the Electric Distribution Planning department (Planning group). This group is not part of the Major Underground group organizationally. One planning resource, an Engineering Specialist, is assigned full time to work in Major Underground, in a matrix arrangement.
The Planning group is comprised of 21 total resources, including 2 Lead Engineers. Each of the Lead engineers has about 6 -8 people reporting to them. These folks are either 4 year degreed engineers, or technical experts. CenterPoint aims to have a balance between Engineers and Technicians.
CenterPoint encourages its engineers to obtain their PE license. The PE license is required to become a Senior Engineer.
Process
CenterPoint’s distribution system is designed to N-1. When performing contingency planning for the loss of a substation transformer, they will assume that the strongest unit in the station fails. They will also reduce the rating of the remaining bank(s) by 5% in anticipation of some phase imbalance in a contingency configuration.
CenterPoint’s normal design configuration provides adequate capacity to carry load in a single contingency. For situations where a substation transformer is highly loaded, CenterPoint has implemented programming at certain stations that will swap loads to alternate sources in the case of the loss of a substation transformer, helping them to defer the investment to increase transformer capacity. This programming moves loads among transformers within a station and from station to station to provide service continuity in a contingency situation during peak periods by optimizing the distribution of load among transformers.
See Distribution Automation Control in Contingencies
For the underground system, CenterPoint’s approach to contingency planning exceeds their written criteria in that they plan for the loss of an entire station, not just the loss of one bank in the station. CenterPoint cited one instance where they built overhead 35kV ties to a particular key station to assure that they had adequate tie ability in anticipation of the catastrophic loss of that sub.
CenterPoint also uses portable substations and maintains an inventory of spare transformers.
The Electric Distribution Planning group does regularly (annually) revisit and update their load models and review potential contingency situations for their system. Planners will update their circuit models and perform load flow studies to understand and identify system reinforcement needs. CenterPoint will annually produce a 5 year construction budget that includes a list of the proposed feeder reinforcements, transformer additions, etc.
In CenterPoint’s non – network, radially fed 12kV and 35kV ducted conduit system, N-1 reliability is provided through the use of an “emergency feeder” that feeds into larger customers and is available as a back up in case of the loss of one of the main feeders. In some cases, an automatic throw over scheme exists between the normal and emergency feeder. In some cases CenterPoint has split the customer’s load such that each portion is normally fed by a different feeder.
In addition, N-1 reliability is provided through manual tie points between feeders. In the event of a feeder outage, customers are restored through sectionalizing.
Technology
For contingency analysis, CenterPoint is using CymE Power Systems Analysis Framework (PSA) software suite. They also recently implemented CymE’s CYMDIST (SNA), Secondary Network Analysis module.
CenterPoint is using Smart Cascade and Smart Distribution Automation Control System (DACS) to be able to move load from one sub transformer to another as part of a single contingency situation. (Note that this technology is not being used in substations with dedicated underground circuits.)
CenterPoint is also using an automated capacitor system that turns capacitors on an off based on actual loads and readings. (Note that this technology is not being used in substations with dedicated underground circuits.)
7.7.5.5 - Con Edison - Consolidated Edison
Planning
Contingency Planning
(Planning for Contingencies)
Process
Electric facilities in the borough of Manhattan, by law, must be underground. Also by law, the design criterion is N-2; that is, the system must be able to withstand the failure of any two components during peak periods, without resulting customer outages. Note that the Queens, Brooklyn, and the main sections of the Bronx are also designed to N-2. The rest of the Con Edison system is designed to N-1.
Technology
Load Flow System – Poly-Voltage Load Flow (PVL)
Con Edison utilizes a distribution load flow application called Poly-Voltage Load Flow (PVL). The PVL application is actually a suite of applications that was developed in house over a 20-year period of continued development. In addition to aiding engineers in performing load flow analyses, the PVL system is used to build feeder and transformer models, develop network transformer ratings, develop network feeder and cable section ratings, model area substation outages, and identify short-circuit duty at customers sites, etc.
To perform load flows, circuit models are brought into PVL from the mapping systems. The secondary system is kept in one mapping (GIS) system (different from location to location), and the primary feeders are kept in another mapping (GIS) system. Con Edison reflects all system changes on its mapping systems. Feeder maps within Manhattan are updated in 24 hours as changes occur. Secondary side maps are not updated as quickly, but are very frequently updated. These GIS systems are maintained by the mapping organization.
When the circuit information is brought into PVL, the new information overlays the existing circuit model already in the system. Once the model is brought into PVL, all users use the same model. When a circuit is brought into PVL, people responsible for model maintenance ensure that the PVL model has electrical connectivity and is in synch with the mapping system.
Load flows are conducted for a variety of reasons.
-
Planning engineers run base case load flows, N-1 cases, and N-2 cases. For each contingency, the PVL output tells you what is overloaded in tabular and graphical formats.
-
Planning engineers use PVL to assist in short-range and long-range planning. For example, the system is used to analyze conceptual projects to split existing networks into smaller networks
-
For new business, engineers run the existing case, and then re-run it with the new business load added to understand the loading and voltage implication of the new load.
-
Region Engineering runs feeder loading studies in advance of the summer to identify anticipated overload conditions.
-
The system is also used to understand the loading implications of different restorations scenarios in an outage.
PVL can use real-time readings from transformer vaults (gathered through Con Edison’s Network Remote Monitoring System [RMS]) for building the network load model. If needed, demands can be spotted at customer service points, using information such as customer kWh consumption and real-time transformer readings.
The PVL system can also perform cable section ratings. The system considers the impacts of soil type and temperature. The system does not automatically consider the proximity of electrical facilities to steam mains.
Operators are able to take advantage of the functionality of PVL through a real-time version known as AutoWOLF, which takes the base model and applies real-time conditions. For example, real-time transformer loading information would populate the model from RMS system. Knowledge of open feeders would populate the model from SCADA. When a circuit locks out, AutoWOLF automatically runs the system peak case, the current case, and the projected peak case, so that that information is available to an operator. The operator can look at the loading on the other feeders and try to determine which feeders to watch.
During emergency conditions, Con Edison assigns engineers assigned to the control room to monitor system loading. During normal conditions, the operators monitor the system themselves.
Con Edison has formed a PVL users group that meets bi monthly to discuss issues associated with the PVL. The PVL Users group is made up of approximately 50 people from both the regions and corporate, including network model maintenance people, designers, supervisors, engineers, engineering managers, and support personnel. Approximately 15 members attend any one meeting.
7.7.5.6 - Duke Energy Florida
Planning
Contingency Planning
People
Network Planning at Duke Energy Florida, including contingency planning of the network, performed by Planning Engineers who are organizationally part of the Power Quality, Reliability, and Integrity Group (PQR&I). This group is led by a Director of PQR&I for Duke Energy Florida.
In addition, contingency studies are performed by the Grid Management group, organizationally aligned with the Distribution Control Center, and responsible for establishing contingency plans and restoration plans.
To perform planning work, the Network Planning group divides the Duke Energy Florida territory into four separate zones. The cities of Clearwater and St. Petersburg, part of the South Coastal Region, are included in one of the four zones. Every zone is assigned a Lead Planning Engineer and Senior Planning Engineer, who are responsible for all distribution planning activities within the zone, including contingency planning, to assure that the network system will operate reliably with the loss of any one feeder during peak load conditions (N-1).
Engineers/Planners in these zones work on Reliability as well as Planning. Because Duke Energy Florida has seen minimal capacity demand growth in its urban underground grid, Engineers in the PQR&I group spend much of their time planning reliability and infrastructure upgrades.
All Planners have four-year degrees in Electrical Engineering, a requirement for the position.
Process
Because Duke Energy Florida has seen minimal capacity demand growth in its urban underground grid, Engineers in the PQR&I group spend much of their time focusing on reliability and infrastructure upgrades. Capacity studies, for both normal and contingency conditions, are triggered by new load additions.
Part of Duke Energy Florida’s process for assuring adequate capacity in peak load conditions under a first contingency is their network planning criteria which requires that downtown feeders supplying the network or that are part of a primary / reserve feeder loop scheme are designed to carry no more than 6MW. This planning criteria provides reserve capacity in urban areas of Duke Energy Florida to be able to supply N-1 reliability. In contrast, radial feeders outside of the downtown area may be loaded to 12MW.
Technology
Network Planners use CYME Power Engineering software to perform load flow calculations on primary feeders.
Duke Energy Florida does not use software to model their network secondary. Rather, they perform real-time monitoring of secondary loading using a Sensus (Telemetrics) remote monitoring system that provides information from the vault, aggregated at the Network Protector relay. Within the Network Group, information such as secondary loading is monitored twice per day.
7.7.5.7 - Duke Energy Ohio
Planning
Contingency Planning
People
Distribution planning, including contingency planning for the network underground system, is performed by the Distribution Planning department.
Duke Energy Ohio has assigned an engineer within the Distribution Planning group to focus on the network.
The engineer who focuses on network planning, is a four year degreed engineer. This engineer works very closely with the engineering department and the construction department to plan the network.
Process
Duke Energy Ohio’s networked system is designed to n-1. That is, the system is designed to ride through the failure of any one component during a system peak.
Part of the planning process at Duke is for the Planning Engineer to model the system with anticipated loading, and then model the impact of the loss of key components in the system; that is, assure that the system can carry the anticipated peak loading in an N-1 contingency. From this analysis, the Engineer will identify system improvement opportunities to meet Duke’s N-1 planning criteria requirement.
Duke is presently compiling a listing of older and damaged equipment that require repair or replacement, so that they can proactively anticipate the loss of this equipment. From this analysis, the Planning Engineer, working with the Construction department, has recommended changes to the spare equipment inventory, including network transformers and network protectors, so that Duke can react quickly to the loss of a piece of equipment. Duke Energy Ohio’s has a targeted spare pool of 10% (one unit of every type for each ten installed).
Duke Energy Ohio does not have a written contingency plan that describes the specific actions to take with the loss of a feeder.
Technology
Duke Energy Ohio is using SKM PowerTools up as a contingency planning tool for the network[1] .
The planning engineer has focused recently on bringing this model up to date. The model includes the street grid, including transformers by location, and including transformer sizing and impedance. The model has also been updated to include new cables that Duke has recently changed.
The model also contains updated loading information, including the loading of particular buildings. This loading information comes from several sources. Larger commercial customers have demand meters. Load readings are housed in the Duke energy billing system and for larger customers (over 300 KW) the customer provides a phone line and loading information flows back to the company’s billing system through the phone lines.
The Load modeling system is used to perform “what if” scenarios, to understand the impact of the system in a contingency, and to identify areas for system reinforcement.
[1] Note that outside the network, Duke is using the SynerGEE system analysis product.
7.7.5.8 - Energex
Planning
Contingency Planning
People
Contingency planning is performed by the Network Capital Strategy and Planning Group, which is part of the Asset Management organization. The Network Capital Strategy and Planning Group is led by a group manager.
Process
For the distribution network, planning engineers conduct an annual review of the substations supplying the medium-voltage infrastructure (110- kV:11 kV stations supplying the Central Business District (CBD)). This analysis includes a study of the substations and the 11 kV feeders to identify anticipated deficiencies in capacity, voltage levels, and fault levels in a contingency situation. Energex engineers perform over 800 contingency studies per year focused on this system, looking at all possible N-1 scenarios annually.
Energex plans to N-2 for its 110-kV transmission feeders, and plans to N-1 for its transmission substations and medium-voltage distribution system.
Energex’s contingency planning approach for the 11 kV feeders is to only load them to no more than 75 percent of the rated capacity of the feeder. This enables them to go “from four to three,” meaning that they can carry the load from the loss of any one feeder by transferring the load to three other feeders.
Note that for the three feeder 11 kV meshed network that services the downtown CBD, the loading on any one feeder is held to 66 percent, so that, in the case of the loss of any one feeder, any load on that feeder can be carried by the other two. See Network Design for more information on Energex’s three feeder 11 kV meshed network.
Technology
Energex performs load studies as part of its contingency planning process using the SINCAL[1] and DINIS[2] automated tools.
[1] PSS®SINCAL, a Siemens product.
[2] Distribution Network Information System (DINIS), a Fujitsu product.
7.7.5.9 - ESB Networks
Planning
Contingency Planning
People
Distribution planning, including contingency planning, at ESB Networks Networks is performed by planning engineers within the Network Investment groups – one responsible for planning network investments in the North, and the other for planning in the South. Organizationally, the Network Investment groups, both north and south, are part of the Asset Investment organization. In addition to the Network Investment groups, the Asset Investment organization is also comprised of a Generation Investment group and a Specifications group, each led by a manager. The Asset Investment group is part of Asset Management.
Planning is performed by one HV planner and four MV planners. Most of these individuals are degreed engineers, but some are “Technologists” who have developed their expertise through field experience.
Planning standards and criteria are developed jointly between the Asset Investment group and the Strategy Manager, which is part of the Finance and Regulation group within Asset Management.
Process
Planners design the system to N-1, with most supplies having a “forward feed” (preferred) and a “standby feed” (reserve). The planning process involves running load flows to compare system loading to the feeder ratings and to evaluate the implications of anticipated incremental forecasted loading. Planners (engineers and technologists) model the system, and perform analyses to understand anticipated requirements, including contingency studies (N-1 planning) to assure that the company can pick up customers with standby feeders within the emergency ratings of their transformers and cables (long-term cyclical overloads of no more that from 125-150 percent of rating, and short-term (emergency) loading of no more than 150-180 percent of rating). From this analysis, planners determine what reinforcement is necessary to be able to reliably serve customers in a contingency situation.
Technology
For performing MV (10 and 20 kV) and for some 38-kV circuit studies, ESB Networks is using SynerGEE (GL Group). The company has tied this tool to its GIS database.
7.7.5.10 - Georgia Power
Planning
Contingency Planning
People
Network planning at Georgia Power, including contingency planning of the network, is performed by resources in several groups. The company has both Area Planning and Distribution Planning. Area Planners are responsible for different network areas in the state, such as Atlanta, Savannah, Macon, Augusta, Athens, Valdosta, and Columbus and are responsible for the substations in those areas to make sure the transformers have the capacity to handle projected loads. Area Planners evaluate Contingency Reserves for N-1 reliability of the network. For example, if Georgia Power has three transformers at a substation, with one bank serving the network, then one of the responsibilities of an Area Planner is to insure that if a network bank fails for whatever reason, then the other two transformers have the capacity to instantaneously pick up the full load of the failed network bank. This guarantees a high level of customer reliability.
Distribution planning associated with network feeders is performed by engineers located within the network underground group. They are responsible for feeder planning, including contingency planning of the networks. In delivering N-1 reliability, they assure that the networks can operate reliably with the loss of any one feeder on the peak day. They also perform studies to assure the robustness of the secondary infrastructure. Distribution (network) planners work closely with the Area planners.
Process
Part of the process for assuring reliable contingency operations involves de-ratings of system components based on studies to determine where heat build-up is the highest. These de-rated values for components, such as cables in ducts, provide a conservative starting point for contingency analysis.
Engineers will utilize the CYMDIST modeling program to develop location specific models of various duct bank configurations, loads, cable and equipment sizes and types. Contingency analysis involves modeling the loss of any one component and analyzing the implications on the remaining system, and identifying places where remediation may be necessary.
Contingency planning is based on N-1. It is not the Area Planner’s job to insure there is enough capacity in the event of multiple transformer failures at a substation, (an N-2 or greater condition). In the unlikely event that multiple transformers are down, Georgia Power can cut distribution, split the network, or take other proactive measures.
One unique long standing practice employed by Georgia Power is to re-rate substation transformers based on loading and individual test results for determining reserve contingency. By examining test criteria and the particular characteristics of a given transformer, as well as the load profile on that particular transformer, Georgia Power may find the transformer capable of peak loads of 115 to 130 percent of nameplate ratings. The company then knows they have that, more realistic reserve capacity in an emergency. Note that this re-rating depends in part on the transformer having opportunities to cool down, so it may not be applicable to transformers serving constant heavy loads.
Overall, the Atlanta urban network is not heavily loaded, and the company has even seen a drop in demand during the economic downturn as buildings in the downtown area are vacated. Most network segments are loaded to about 70 percent of capacity.
Georgia Power is not actively seeking to shrink its network underground system. In fact, in addition to Buckhead, Georgia Power is adding network transformers at three other substations. If the company sees the need for more capacity that requires expansion of the network, the company adds it. For example, in downtown Savannah, a historical district that cannot have its buildings demolished or removed, a number of new shops, condos and businesses are opening up, so load is increasing there.
Technology
Georgia Power has recently acquired CYMDIST to model the entire secondary and primary grid. The program is designed for planning studies and simulating the behavior of electrical distribution networks under different operating conditions and scenarios. It includes several built-in functions that are required for distribution network planning, operation and analysis. The model Georgia Power has developed is extremely accurate including cable systems, cable ratings, cable capacities and specifications. The Area Planner keeps detailed spreadsheets, continually updated, on upcoming and ongoing projects. The Georgia Power GIS system also tracks network statistics, so that if a particular network segment reaches a threshold, it is tagged for the Area Planner and Network Engineering group. Typically Georgia Power prefers to keep capacities in the 70 to 90 percent range, and any transformer or network segment exceeding 90 percent is prioritized and tagged for the Area Planner and engineering for more capacity.
7.7.5.11 - HECO - The Hawaiian Electric Company
Planning
Contingency Planning
People
Contingency planning at HECO is performed by Distribution Planning Division. The Distribution Planning Division is part of the System Integration Department. This group performs all distribution planning at 46kV and below.
The group is led by a Principal engineer and is comprised one lead distribution engineer, and 5 planning engineers who do all of the distribution planning work for the island of O’ahu. All of the engineers in the group are four year degreed engineers.
Process
HECO’s distribution system is designed to N-1; that is, they plan their system such that all the system components, including primary feeders, secondary cable mains and taps, and transformers, are sized to be able to carry the load within specified thermal and voltage limits during peak conditions when any single component is out of service.
All three phase distribution transformers in their radial distribution system are fed by two primary feeders, a normal and alternate feeder that can carry the load in the event of the loss of the primary feeder. All single phase underground designs are looped, such that load can be picked up from an alternate direction in the event of an outage.
HECO is using a modular substation philosophy, with a typical substation using a small (10 mVA) transformer with two circuits fed out of the sub. With the loss of a substation transformer, the system is designed that the loading can be shifted (through manual sectionalizing) and supported by adjacent stations in peak periods. In addition, HECO has two mobile subs (one 5 MVA and one 10 MVA), and three spare 10 MVA units.
HECO has over 250 10 MVA units on their system.
HECO will perform studies annually to assure that the remaining components in a contingency scenario can carry the load without exceeding the emergency rating of the component.
Technology
HECO historically has not used a load flow software product to aid them in distribution planning. They gather and record feeder loading and transformer loading information using an EXCEL spreadsheet. Load flows for contingency analysis are calculated manually.
HECO is in the process of installing SynerGEE, a load flow software product from GL Industrial Services. This product will interface with HECO’s GIS system and be able to import up to date circuit models. This software will facilitate their ability to perform contingency analysis. They are targeting year end (2009) for implementation of this software.
7.7.5.12 - National Grid
Planning
Contingency Planning
People
National Grid’s Distribution Planning Organization, led by a Director, performs network planning, including contingency planning. Organizationally, the Distribution Planning Organization is part of Distribution Asset Management, and is comprised of resources in both a central location (Waltham Massachusetts), and distributed throughout National Grid. About two thirds of the organization is centralized, with the remaining third decentralized.
The distribution planning department is comprised of capacity planning resources, engineer personnel who have broad system responsibilities, and field engineers who report to managers of Field Engineering for both New York and New England
The planning engineers who focus on the Albany network include a field engineer who works in the Albany office and focuses primarily on both radial and network underground systems for National Grid’s New York Eastern division, and an engineer situated in Waltham, who has network engineering responsibilities across the system. These engineers have responsibility for both network planning and network design.
Both of these engineers are four-year degreed engineers, and are not represented by a collective bargaining agreement (exempt).
National Grid has up-to-date standards and guidelines for the network infrastructure. In addition they have up-to-date planning criteria that address network planning.
Process
The National Grid Albany network is designed to N-2. That is, it is designed to ride through the failure of any two components during a system peak with only minor overloads to network transformers, primary feeders and secondary mains.
National Grid has SCADA installed to monitor loading at the substation. They are able to obtain historic 15 - minute interval load data as measured at the substation. Planning engineers use this information as well as information from National Grid’s customer information system to develop distribution feeder models. Customers / customer load are assigned to certain network busses to model the system. Engineers model the system at peak load, at 90% of peak load, and in both the n-1 and n-2 contingency situations.
Distribution planning analysis includes analysis of both potential thermal overloads and voltage issues. When assessing loading impacts of devices such as transformers, National Grid uses 120% of nameplate for single contingency and 140% of nameplate for double contingency.
The network in Albany is summer peaking. Typically, planning studies for the network are performed in the spring and may project anticipated system loading multiple years in the future. In addition, the analysis may also include a fault current analysis to understand the ability of the system to properly clear faults.
For the Albany network system, field engineers have performed analyses of contingency situations in the network to understand and to provide emergency plans and guidelines to the Regional Control Center of the ability of the system to handle various load levels in a contingency. These guidelines, for example, would indicate at various load levels, the capability of the system to carry the load with certain feeders out of service. (For example, at “x” % loading, the network system could sustain the loss of “y” number of primary feeders without having to shed load. National Grid has documented this analysis, and will perform network drills annually to rehearse emergency operating procedures in the network.
Technology
National Grid planning engineers use the PSSE power flow product to model and perform power flow analysis of the network system, and use a product called Aspen to perform fault analysis. (The Aspen product is also used by the System Protection group at National Grid.)
Note that the PSSE power flow product provides steady-state analysis. It cannot model network protectors (for example, back feed through the protectors).
In non-network areas, National Grid uses CymDist as a modeling tool, which has been integrated with their GIS system. National Grid has not applied this to the network system, as their GIS system does not model a meshed system.
7.7.5.13 - PG&E
Planning
Contingency Planning
People
Network planning, including contingency planning, is performed by the Planning and Reliability Department. This department is led by Principal Engineer, who is also the department supervisor. This group does distribution planning for both the network and non-network systems. Eight engineers comprise this department. Six focus on the radial system, and two focus on the network system.
For network systems, the two planning engineers are responsible for distribution planning, including contingency analysis.
One of the two network engineers is relatively new to the department, and was assigned to receive training from the lead network engineer. Both network planning engineers are four year degreed engineers. They are represented by a collective bargaining agreement (Engineers and Scientists of California).
Process
PG&E’s network system is designed to n-1. That is, the system is designed to ride through the failure of any one component during a system peak, with only minor overloads to transformers, primary feeders and secondary mains during peak periods.
The planning process involves running load flows to compare system loading to the feeder ratings and to evaluate the implications to the system of anticipated new loading. This analysis is performed for both base case and for contingencies. For each network, a contingency study is run for each feeder supplying the network; that is, the planning engineer will model each circuit as being out of circuit, and rerun their load flows to identify overloads / circuit weaknesses in a contingency. (Six different contingency models are run, one for each primary feeder supplying a network).
Network planning, including contingency planning, is based on a peak load analysis, recognizing that the peak is only representative of loading for a few days each year. Planning engineers obtain monthly peak loads from the SCADA Historian[1] and compare this to feeder ratings. Engineers may enter the SCADA readings into the load flow model and recalculate to see if there are any overloads. Alternately, they may simply compare the monthly peak values to previous peak load readings and circuit ratings. Also, planning engineers will ascertain the validity of any projected new load estimates, and run load flows to understand the implications of the added load.
Designing for the peak provides conservatism to the planning process. Planning engineers report that actual loading is always lower than loading projected by their load flow models, as these models are based on peak values and do not account for load diversity.
If the calculated circuit loading exceeds 110% of the either the circuit’s normal or emergency capacity ratings, the planning engineer will consider the circuit to be overloaded and recommend design changes to ameliorate the overload condition. PG&E uses the 110% level based on the fact that their load flow model uses all peak load values and thus doesn’t account for diversity. So, rather than reacting to modeled loads over the 100% rated values of circuits, they add the additional 10% since they know their models are conservative.
Technology
PG&E uses the EasyPower load flow product from ESA to model their network system. This model is manually populated and maintained by the planning engineer. The planning engineer reports being satisfied with this planning tool.
Note that PG&E is presently implementing the CYMEDIST (by CYME) load flow product for performing analysis of their radial system. In a subsequent phase of their project, they plan to implement the use of CYMEDIST as their network planning tool as well. A challenge for them will be the conversion of data from EasyPower to CYMEDIST.
[1] PG&E’s SCADA provides three phase amp readings on all network feeders. Also, they have the ability to monitor loading on all network transformers through CT monitoring installed on the transformer secondary (at the NP). This information is housed in the PG&E SCADA Historian.
7.7.5.14 - Portland General Electric
Planning
Contingency Planning
People
People
Several groups are involved in contingency planning for the network system, although most operate across the enterprise. Overall, PGE’s network includes multiple redundancies within the system and is very reliable.
Across PGE, the Transmission and Distribution (T&D) Planning organization oversees the planning process for network and non-network systems, as well as performs contingency analyses with CYME and PSSE. Aplanning engineer with a four-year degree in engineering covers the PSC.
Three Distribution Engineers also work on the underground network, and they provide the system operating information used to create and update models in CYME and PSSE. The Distribution Engineers are not based in the PSC service center or CORE group, and are overseen by the Eastern District Central Supervisor.
The Planning Department is responsible for producing the “Weak Link Report,” which covers both the radial and network system and shows system peak loadings in summer and winter
Process
PSSE Load Modeling Software
For the network system, PGE uses the Siemens PSSE modeling software for both the primary and secondary network models. Planners collaborate with Distribution Engineers to obtain the most up-to-date model in PSSE, including manually entering loading information. The load data is derived from the customer meters, and gathering and entering this information is a labor-intensive process. PGE’s network load is relatively flat, but the utility is anticipating an increase in the next few years due to an expansion of the retail sector in the downtown area[1].
Reporting: To support contingency planning, the Planning Department creates bi-annual loading reports, known as the “Weak Link Report,” which covers both the radial and network systems. The report examines the system peak loading for the summer and winter, using network data sourced from the substations to identify anticipated weak spots (areas of overload or voltage issues). At present, monitoring data received from the network beyond the station is not used for modeling or planning, and is reserved for operations.
Reliability Metrics: At PGE, reliability reporting uses SAIDI, SAIFI, and MAIFI to assess feeder performance, and feeder classification is used to determine the number and duration of outages for a particular customer. Network feeders are classified as urban, urban feeders and transformers are designed to the N-1 contingency, and these have high reliability.
Technology
PGE uses a number of information technology (IT) systems to model the system and plan for contingencies. PGE uses CYME/CYMDIST to assess the reliability benefits of projects on the radial system, and planners use the software to develop a base case and evaluate the system under N-0 and N-1 contingencies. For modeling the network system, engineers use Siemens PSSE software for the primary and secondary network, using data from customer meters to develop a base case and highlight where normal and peak loading exceeded recommended limits.
Because PSSE is unable to monitor single-phase loads and cannot model loops, PSC will add the secondary network to CYME, using the GIS system to model and display loops. For mapping, PGE uses ArcFM on top of ArcGIS. The company is presently working with the ArcFM vendor to enable its use with CYME.
PGE uses an Enterprise Resource Planning ERP system called PowerPlan, which has an Oracle attachment named “Pace.” This system provides canned financial data about projects. Other technologies used for planning include SharePoint, Field View, the PGE Engineering Portal, PI ProcessBook, and the T&D Database.
- Derek Harris. 2014. PGE Stephens Network System Split Report, internal document.
7.7.5.15 - SCL - Seattle City Light
Planning
Contingency Planning
People
Network Planning at Seattle City Light is performed by the Network Design Department, which is part of Energy Delivery Engineering. The Network Design Department focuses exclusively on the planning and design of SCL’s networks.
Although SCL does have a separate planning group that performs distribution planning activities for SCL’s non-network distribution system, this group does not do the planning associated with the network. All cable ratings, load flow and voltage studies, master load flow analysis, assignment of feeders to load additions, area studies, etc. associated with the network are performed by the Network Design Department staff. (Note that at the time of the EPRI practices immersion, SCL was implementing an Asset Management organization. At the time of this writing, SCL had not yet decided whether certain tasks currently performed by the Network Engineering group will be moved into the Asset Management organization.)
The Network Design Department is made up of a System Group (eight engineers) and a Services Group (eight engineers). These engineers do all of the planning and engineering for the network (the System Group), as well as interface with network customers for load additions, new loads, etc. (the Services Group). The individuals in this group are four-year degreed engineers. The senior level engineer position at SCL requires a PE license. The engineers at SCL are represented by a collective bargaining agreement (IBEW).
Process
SCL’s network system is designed to maintain N-1 load capability at peak load.
SCL has defined and documented network design criteria for Feeder Loading, Electrical System Construction, and Civil Construction (see below).
Network Design Criteria for Feeder Loading
-
Load feeders to maintain N-1 load capability at peak load.
-
Limit feeder imbalance to 20% at N-0.
-
Keep load current within constraints determined by loadflow and ampacity studies for existing plant.
-
Keep load current within constraints determined by loadflow and ampacity studies for new construction.
-
Account for diversity factor during feeder loading analysis.
Network Design Criteria for Electrical System Construction
-
Allow no more than two mainstem cables from any one sub-network per MH or street vault. There may be mainstem cables from other sub-networks present (subject to the same restriction) as well as branch cables.
-
Allow no more than four lateral feeders from any one sub-network per MH or street vault. This may change as a result of studies for ampacity evaluations of feeder laterals with high loads or near steam lines.
-
Size new mainstem feeders to match substation capacity, with allowances for feeder imbalance and reliability.
-
Require two half-lapped layers of arc-resistant tape to each primary feeder in MHs and street vaults.
-
Limit DC Hi-pot testing of 15-kV class cables to a maximum of 26 kV DC and 28-kV class cables to a maximum of 47 kV DC.
-
Use VLF testing for newer cable testing if separable from older cable sections. Note: This particular requirement has not yet been implemented. SCL is still examining the merits of VLF testing for cable
-
Do not allow construction of new 480-volt secondary grid networks.
-
Use limiters on both ends of all secondary bus ties.
Network Design Criteria for Civil Construction (Street Facilities)
-
All duct banks shall be encased in concrete.
-
All new system duct banks shall have 5-inch diameter conduits for system cables.
-
Steel ducts are required for shallow construction.
-
Every effort shall be made to install new duct banks a minimum of 15 feet away from any steam logs. If new duct banks will be within 15 feet, a cable ampacity analysis is required to determine potential mitigation actions.
-
If a duct bank must cross a steam log, insulation must be applied per SCL construction guideline NDK 150.
-
Fluidized thermal backfill (FTB) or controlled density fill (CDF) may be used to backfill around encased service ducts.
-
Use only fluidized thermal backfill (FTB) around encased system ducts.
Technology
SCL uses a load flow and voltage drop analysis software package developed in house (legacy software). The software is nodal but not graphical.
7.7.5.16 - Survey Results
Survey Results
Planning
Contingency Planning
Survey Questions taken from 2015 survey results - Summary Overview and Planning (Question 35)
Question 9 : Within your organization, do you have a distinct network engineering and network planning groups?

Question 35 : To what level of contingency do you plan your network?

Survey Questions taken from 2012 survey results - Planning
Question 3.2 : To what level of contingency do you plan your network?

Question 3.19 : Do you perform contingency analysis; that is, review loading and voltage with each feeder out of service? Do you perform contingency analysis; that is, review loading and voltage with each feeder out of service?

Survey Questions taken from 2009 survey results - Planning
Question 3.3 : To what level of contingency do you plan your network? (This question is 3.2 in the 2012 survey)

7.7.6 - Distributed Generation
7.7.6.1 - AEP - Ohio
Planning
Distributed Generation
(Distributed Cogeneration on the Network)
People
Network planning, including modeling and analyzing the requests to apply distributed generation to the network, is performed by the AEP Ohio Network Engineering group in tight collaboration with its parent company. The company employs two Principal Engineers and one Associate Engineer to perform network design at AEP Ohio for the Columbus and Canton urban underground networks. These engineers are geographically based in downtown Columbus at its AEP Riverside offices, and are organizationally part of the parent company. Columbus-based Network Engineers collaborate closely with the AEP Distribution Services organizations and the Network Engineering Supervisor. The Network Engineering group reports to the AEP Network Engineering Supervisor, who in turn reports Distribution Systems Planning Manager. Distribution Systems Planning ultimately reports to the AEP Vice President of Customer Services, Marketing and Distribution Services.
Process
Requests for distributed generation at network locations are studied and evaluated on a case by case basis. There has been little or no demand for distributed generation within the Columbus and Canton networks, aside from an occasional use of solar panels to chop peak demand for certain customers. At this point no network customers are feeding excess generation into the AEP Ohio system.
For its network, the unofficial policy of AEP Ohio is to not import power from customers onto the network, as the current network design would not tolerate incoming current. DG feeding into the grid could cause protectors to open on low load or on backflow, affecting grid reliability. At the time of the EPRI practices immersion, AEP Ohio had not yet developed a formal policy for adding distributed generation on any of its network systems.
The company is working on preliminary studies to incorporate distributed generation on the network. After engineering and feasibility studies, small pilot or test implementations may be deployed at carefully controlled network stations.
7.7.6.2 - Ameren Missouri
Planning
Distributed Generation
People
System protection for both the network and non – network infrastructure serving Ameren Missouri, including system protection implications of distributed generation (DG) to the system, is performed by engineers within the System Protection Group. This group is part of Substation and Relay Maintenance, a group within Energy Delivery Technical Services at Ameren Missouri. This group provides system protection for the entire company, including power plant protection, transmission and distribution.
The System Protection Group, led by a Supervising Engineer, is comprised of 4-year degreed electrical engineers. System Protection engineers are non-union employees at Ameren Missouri.
While Ameren Missouri has received a significant number of requests to attach solar DG to their system, none of these requests have been in their network. At the time of the EPRI practices immersion, Ameren Missouri had not yet developed a policy for adding DG on the network system.
Process
Customers desiring interconnection to Ameren Missouri’s network system must work with Ameren Missouri to develop custom protection schemes that properly detect and isolate faults, and work harmoniously with the existing Ameren Missouri protection and control schema. These protection schemes can be quite complex, and involve communications between the customer and the company System Protection Group.
The state of Missouri requires Ameren Missouri to connect DG of 100 KW or less to their system. The customer must provide a visible disconnect, and must adhere to all standards associated with inverter devices. Ameren Missouri believes their current network system can absorb small amounts of distributed generation, though they have not received any requests.
Ameren Missouri is more concerned about DG additions to spot networks, as these installations can create potential protection issues, such as tripping protectors on reverse power. These installations may require changes in protector settings such as the addition of a time delay on the instantaneous trips setting. Spot network DG requests require strong communications between the customer and System Protection Group.
Note that Ameren Missouri has not yet developed a formal policy for DG on the network.
7.7.6.3 - CEI - The Illuminating Company
Planning
Distributed Generation
People
To date, CEI has had no experience with distributed generation requests on its downtown secondary network. However, FirstEnergy, company-wide, has been receiving many inquires (about four per day) about the connection of distributed generation to its system. Their experience is that about one request received in every two week period moves forward.
In response to these requests, FirstEnergy has formed a system wide team led by the corporate Distribution Planning and Protection group to develop the regulatory and technical requirements for an interconnection policy for distributed generation.
Process
FirstEnergy’s stance towards distributed generation is to be as receptive as they can be, while developing a formal policy that describes FirstEnergy policy and defines regulatory, protection and other technical requirements. This policy document, currently under development, will include connection requirements drawings for use by customers.
FirstEnergy desires to make the application process simple for customers, and to make reasonable efforts to accommodate customer requests to interconnect.
7.7.6.4 - CenterPoint Energy
Planning
Distributed Generation
People
To date, CenterPoint has not had any requests for distributed generation to connect with its 208 V secondary networks. They do have one solar connection to a spot network.
Company-wide, CenterPoint has been receiving inquires about the connection of distributed generation to its system. In response to these requests, CenterPoint has a group that focuses on interconnection requests that come into the company. These interconnection requests are addressed on a case by case basis.
Process
The CenterPoint interconnection group receives the request to interconnect and processes the application for connection to assure that the potential generator complies with the terms of both the CenterPoint interconnection agreement and PUC interconnection agreement. All requests for connection to underground distribution facilities are sent to the Major Underground Engineering Technical Group, who assists the DG group in designing enhancements to the protective scheme to accommodate the interconnection.
Note that from a planning perspective, CenterPoint treats distributed generators as non-firm generation.
7.7.6.5 - Duke Energy Florida
Planning
Distribution Generation
People
Requests for installing distribution generation on the Duke Energy Florida system are managed by the PQR&I Distribution Protection Automation and Control group.
Duke Energy Florida does have written guidelines for responding to customer requests to install distributed generation, but these guidelines do not specifically address requests for installing in a network location.
Process
At the time of the immersion, Duke Energy Florida had not received any requests for DG on their low voltage meshed system or on their spots.
7.7.6.6 - Duke Energy Ohio
Planning
Distributed Generation
People
Duke Energy has a System Protection group that performs protective device coordination on the network. One engineer within the group has become the distributed generation (DG) expert for Duke Energy Ohio, and responds to DG requests and establishes the appropriate system protection schema. This individual has also been instrumental in establishing DG policy and interconnection agreements.
The DG Engineer is currently training a second engineer to respond to distributed generation requests.
The DG Engineer works closely with the Network Engineer on DG issues within the network. This work includes sizing fuses and establishing settings for network protector relays in special situations. (Note that most network protector locations utilize standard relay settings.)
Process
At the time of the EPRI Immersion, the Duke Energy Ohio network system had one location (a 480V spot) where Duke had made changes to the electronic relaying settings at a network protector because of a distributed generation customer (backup generation application). At this location the customer can self generate but does not feed back into the Duke Energy Ohio system.
The DG Engineer decided on changes to the relaying of the network protector at this location – adding a little longer delay, so that the NP’s can ride through a small back feed, allowing the customer to close back into Duke’s system without an interruption.
7.7.6.7 - Energex
Planning
Distributed Generation
People
Distributed generation is subsidized by the Australian government through the AEMC. Consequently, Energex has experience significant growth in the number of residential and commercial customers who have adopted the use of the cogeneration, both in the CBD and outlying areas.
Process
As an example, Energex has experienced an exponential growth in the use of roof top photovoltaic (PV) systems by its customers as a result of government-subsidized rebates on solar panels, and a favorable rate to customers for selling power back into the grid. (The generated power is used by the customer, and customers can also sell excess power back into the grid.)
Technology
Energex has over 700 MW of PV connected (of a total load of about 3000 MW), a relatively high penetration of distributed PV. Energex’s penetration of solar jumped from 1000 PV systems to 200,000 systems based on a subsidy (rebate by the government for individual roof top solar panels) over the last four to five years. The company has experienced rapid expansion of PV, connecting approximately 3000 kW per month.
Energex noted that the addition of rooftop solar generation has introduced multiple technical challenges, including additional complexity in distribution planning, and a significant increase in power quality complaints (See Rapid Response).
One concern at Energex is the potential for an increase in customer installations of micro-turbines given the declining cost of natural gas (as a fuel). The utility needs to make certain customers are not overloading its systems with surplus energy and causing system instabilities. Until the utility has a way to reliably accommodate turbine-generated co-distribution, it is asking customers to forestall turbine installation. One technology Energex is examining closely is advancements in premises-based batteries, which would help solve system overloads and provide real benefit to both turbine users and its growing base of PV customers.
7.7.6.8 - ESB Networks
Planning
Distributed Generation
(Distributed Cogeneration on the Network)
People
Cogeneration planning on the network, particularly wind farm intermittent power generation, is performed by planning engineers within the Network Investment groups – one responsible for planning network investments in the North, and the other for planning in the South. Organizationally, the Network Investment groups, both north and south, are part of the Asset Investment organization. In addition to the Network Investment groups, the Asset Investment organization is also comprised of a Generation Investment group and a Specifications group, each led by a manager. The Asset Investment group is part of Asset Management.
Planning is performed by one HV planner and four MV planners. Most of these individuals are degreed engineers, but some are “Technologists,” who have developed their expertise through field experience.
Planning standards and criteria are developed jointly between the Asset Investment group and the Strategy Manager, which is part of the Finance and Regulation group within Asset Management.
Process
ESB Networks currently distributes 2 GW in Ireland through wind farms. The generation is available about 100 days per year. The goal of ESB Networks is to provide 20 percent of its available energy from these wind farms by 2020, conforming with a government renewable energy initiative requiring 20% of energy from renewables by 2020.
ESB Networks facilitates independent power producers (IPPs) but does not encourage or discourage connection. Decisions are solely based on network ability. The licensee buys and builds the site and can operate a network of wind generators. In preparation for any new installations, ESB Networks holds kick-off meetings with the licensee(s) for the purpose of providing technical expertise, technical protection issues, and safety associated with wind farm construction and operation. In certain situations, ESB Networks prefers that these farms are in proximity to its existing 110-kV stations, and the licensee can build the network up to the ESB Networks 110-kV node.
Because wind and thus wind generation output tends to peak at night when ESB Networks doesn’t have the demand for this generation, they are dealing with some resultant operational issues, such as stability issues, and high voltages on the medium voltage system.
Technology
Specifications for wind farm construction for owners/operators can be found online via the web. Wind farms purchase materials from an ESB Networks-approved list posted online, which is updated on a regular basis.
7.7.6.9 - Georgia Power
Planning
Distributed Generation
(Distributed Cogeneration on the Network)
People
Network planning, including modeling and analyzing the use of distributed generation, is performed by the engineering group within the Network Underground organization within Georgia Power. The Underground group, led by the Network Underground Manager, consists of both engineering and construction resources responsible for the network underground infrastructure at Georgia Power. The Engineering group, led by the Network Underground Engineering Manager, is comprised of Engineers and Technicians concerned with the planning, design, and any service issues. The engineers are four-year degree positions.
The Network Underground group also works closely with Area Planning Engineers. Organizationally, Area Planners sit outside the network Underground group, but have a dotted line reporting to engineers within the Network Underground group. Area Planners have a combination of years of experience and formal education, including two-year and four-year degrees. All are non-union employees.
Process
Requests for distributed generation at spot network locations are studies and evaluated on a case by case basis.
For the network, it is Georgia Power’s unofficial policy to not import power from customers onto the network secondary grid, although they suspect some will or do. The primary concern is that importing energy on the secondary might affect protector performance and/or reliability. For example, the Georgia Power secondary grid is lightly loaded, and DG feeding into the grid could cause protectors to open on low load or on backflow, affecting secondary grid reliability. At the time of the EPRI practices immersion, Georgia Power had not yet developed a formal policy for adding distributed generation on any of its network systems.
7.7.6.10 - HECO - The Hawaiian Electric Company
Planning
Distributed Generation
People
To date, HECO has little distributed generation connected to their system. When they do get requests to interconnect, their practice has been to hire a consultant to perform the interconnection study.
Process
HECO has had little experience with distributed generators requesting interconnection to their distribution system. Most of the interconnection requests they have had historically have been on their transmission system. They do have some small PV generators on their distribution, but these do not export to the grid.
HECO has developed performance standards, and power purchase agreement standard forms for interconnection requests, but these were developed primarily for transmission interconnections. These forms must be updated to accommodate distribution system requests.
To date, HECO has had no requests to connect DG to their network system.
7.7.6.11 - National Grid
Planning
Distributed Generation
People
National Grid has a Distribution Generation Services group that handles requests for interconnection to the distribution system, including the network. At the time of the writing of this report, National Grid was in the process of updating their procedures for interconnection of distributed generation to the distribution system.
In general, if the interconnection requests are small, the Distribution Generation Services group will respond directly to the customer. For larger requests, the distribution generation services group may engage the services of field engineers within Distribution Planning to perform impact studies. For these larger interconnection requests, an engineering team may be formed comprised of field engineers, distribution planning engineers, generation services personnel, and protection engineering personnel.
Requests to connect to the network involve analysis by field engineers to understand the potential requirements for safety equipment, protective relaying, metering and telemetry. This analysis includes determining the maximum allowed generator capacity on the network to avoid negative impacts, such as reverse power flows.
Process
National Grid’s documented interconnection procedure recognizes that interconnection to secondary network grids or secondary spot networks is an emerging topic which “(i) poses some issues for the Company, (ii) is not yet supported by any national engineering standard or practice, (iii) requires additional time for engineering analysis, and (iv) has the potential to cause the power flow on network feeders to shift (reverse) causing network protectors within the network grid to trip open”.
To ensure network safety and reliability, National Grid has not historically allowed synchronous and induction generators to interconnect to network systems. Inverter-based generators may be allowed on a case-by-case basis at the discretion of the company. The results of this analysis may allow interconnections with restrictions to avoid negative impacts on the secondary network system such as limited DG output relative to facility load, reverse power control measures, and transfer trip schemes.
7.7.6.12 - PG&E
Planning
Distributed Generation
People
PG&E has an Interconnection Services group that deals with issues associated with the connection of DG to the PG&E system. This group has well documented procedures and guidelines for interconnection of both rotating machine and inverter based generation to the PG&E system, including the network.
Interconnection services works closely with the network engineers within the Reliability and Planning group on DG issues within the network. This work includes sizing fuses and establishing settings for network protector relays in special situations.
Process
Customers who desire to interconnect to PG&E’s network system must work with PG&E to develop custom protection schemes that properly detect and isolate faults, and work harmoniously with the existing PG&E protection and control schema. These protection schema can be quite complex, and involve communications between the customer and company protection.
For example, for connection of new distributed generation to PG&E’s secondary spot network, the following requirements must be met [1] :
-
All of the network protectors on the Secondary Spot Network shall be replaced with Cutler Hammer CM52 network protectors equipped with MPCV relays.
-
Older style protectors (CM-22, MG-8, and CMD) may remain, provided that the network protector relays are replaced with MPCV relays or other PG&E-approved relays, capable of at least two set points, one with a time delay, and shall meet the following conditions:
- The Generator(s) plus the associated bus and/or cable to the main switch has a transient and sub-transient X/R ratio of nine (9) or less for all operating scenarios;
- Synchronization of each generator shall be supervised by a PG&E-approved Sync Check relay;
- In non-fault conditions, the generator breaker must operate in 1.5 minutes or less;
- Breakers separating all generation must open immediately without any intentional time delay under system fault conditions
-
Division’s Planning Engineer shall review network protector relays on the adjacent lines for relay coordination. If relay coordination’s are inadequate, the old relays must be replaced.
-
DG Producer will provide all necessary technical requirements as specified in Rule 21, including the protective device settings and frequency/voltage settings.
-
DG Producer will meet the minimum import requirements set forth below:
- The DG may not operate parallel operation unless a minimum number of network protectors are closed. The DG must trip instantaneously when the number of closed network protectors falls below the following the value [select appropriate value from this table]:
| Quantity of Network Protectors in Vault | Minimum Number of Closed Protectors Required in Order for DG to Operate |
| 2 | 2 |
| 3 | 2 |
| 4 | 2 |
| 5 | 3 |
When the number of closed protectors drops to 50% or lower then the generator must instantaneously trip.
-
A minimum import setting of ten percent (10%) of the nameplate rating of the largest single network transformer serving the PG&E secondary spot network bus where the DG is installed. Minimum import protection to be accomplished using a redundant PG&E-approved underpower (Device 37) relay or reversed power flow relay (Device 32). A meter with kVA summation of multiple services from the spot network bus is allowed on the common spot network bus through one or more Generators. If PG&E’s meters do not support summation and protection requirements, DG Producer shall be responsible for the cost of providing meters capable of supporting summation. If the minimum import is not met, the Generator(s) must trip within 15 cycles to ensure that the Generator(s) trip prior to the network protectors. Redundant protection of the net import minimum power must be provided.
-
A contact must be available on the existing network protectors to provide open/close status to the DG Producer’s trip devices via a GE C-30 controller or PG&E approved controller. The cost for controller along with the installation and operating and maintenance costs of the relay/controller will be borne by the DG Producer. The DG Producer shall install and terminate rigid grounded 2-inch conduit, and a pair of wires from the trip device to inside the transformer vault. The location of conduit core shall be reviewed and approved by PG&E.
-
DG Producer will provide 24VDC source from their battery with charging system for GE C-30 controller or PG&E approved controller.
-
PG&E will do the installation of GE C-30 relay/controller or PG&E approved controller in the property owner’s transformer vault. See attached schematic.
For example, normally set network protector relays are set to open on reverse current. Thus, a standard relay set cannot be used with distributed generation. The schema must include a feedback system from the customer’s generation to understand the generator output, and be able to change the control of the protector to account for the generation. In a fault, the SCADA system must be able to detect the fault and then send a signal to the protector to open so that it doesn’t enable the generator to reverse feed back into the fault.
Each situation must be addressed individually.
[1] Excerpted from PG&E Electric T&D Capacity, Reliability, UG Asset Bulletin, Bulletin Number: 2004PGM-10, dated 11/01/2004.
7.7.6.13 - Portland General Electric
Planning
Distributed Generation
People
On the network, the Net Metering group and the Interconnection group oversee requests for distributed generation (DG). A Key Customer Manager (KCM) may refer customers wishing to install DG. PGE has nine KCMs reporting to the Manager of the Business Group. Generally, they are geographically distributed, and one KCM oversees network customers. Distribution Engineering and the System Protection Group handle particularly complicated requests and assess the technical requirements and difficulties.
Process
Like most utilities, PGE is experiencing an increasing number of requests to add DG to its system, including the network. For larger systems of over 50 kW, PGE may allow installations on the radial system. For the network, PGE limits customer -owned generations to less than 50 kW. Oregon statutes allow DG of up to 5% of the maximum load on spot networks. If a customer served by a spot network wants to install solar panels, for example, the KCM contacts PGE’s Interconnection Group.
PGE has a Net Metering Department, but requests for larger generation facilities are passed on to the Engineering Group. For example, in a case where a government entity wanted to add a solar array on top of a building, Distribution Engineering and System Protection worked out what was possible.
PGE is presently drafting an interconnection guideline that would cover the area network and specify how to accommodate DG on a network system. This is subject to the current Oregon statute, which stipulates that systems cannot exceed 10% of the off-peak minimum loading. Once this 10% is exceeded, no additional solar generation can be added.
The Oregon PUC sets Oregon’s interconnection standards for DG, which are based upon the Mid-Atlantic Distributed Resources Initiative (MADRI) standard. The PUC has developed interconnection procedures and application processes for non-net metered systems up to 10 MW and for systems of more than 20 MW. The latter is based on Federal Energy Regulatory Commission (FERC) regulations. At present, there are no standard processes for installations between 10 MW and 20 MW [1].
Distribution Resource Plan (DRP): PGE’s DRP identifies how and where DG can improve service and reliability within the context of a wider drive to incorporate renewable energy. PGE has undertaken a process of identifying any constraints on the system, by assessing the hosting capacity for each feeder and estimating how much DG can be installed safely.
Due to the lack of useful data across the electric distribution industry, PGE will continue long-term studies and pilots into DG at a feeder level[2]. In terms of standards:
- Customer generators must install and maintain a net metering facility complying with IEEE standards
- Customer generators must maintain and install a manual disconnect switch that is accessible to utility workers
- For facilities of lower than 600 volts, manual disconnects may not be required if an inverter of appropriate size is installed[3]
Technology
PSSE and CYMDIST support the modeling of, and effects of, DG on a system.
- P. Scheaffer. Interconnection of Distributed Generation to Utility Systems: Recommendations for Technical Requirements, Procedures and Agreements, and Emerging Issues. The Regulatory Assistance Project, Montpelier, VT: 2011. http://www.raponline.org/wp-content/uploads/2016/05/rap-sheaffer-interconnectionofdistributedgeneration-2011-09.pdf (accessed November 28, 2017).
- Smart Grid Report. Portland General Electric, Portland, OR: 2017. http://edocs.puc.state.or.us/efdocs/HAQ/um1657haq16327.pdf (accessed November 28, 2017).
- Oregon Public Utilities Commission, 2008, The Oregon Administrative Rules contain OARs filed through October 15, 2008,
7.7.6.14 - References
EPRI Underground Distribution Systems Reference Book (Bronze Book)
Chapter Section 4.14 - Closed Transition Switching and Distributed Generation
7.7.6.15 - Survey Results
Survey Results
Planning
Distributed Generation
Survey Questions taken from 2012 survey results - Distributed Generation
Question 9.1 : Do you allow inverter based generation to connect to the 208Y/120-volt area network?

Question 9.2 : If yes, What is the maximum allowed size for the inverter based generation at any given service?

Question 9.3 : Do you allow the inverter based generation to feed real power back into the secondary of the area network under unfaulted conditions?

Question 9.4 : Do you place any limits on the total amount of inverter based generation that can be connected to any given area network? If so, how is that defined?

Question 9.5 : Do you allow induction generators to connect to the 208Y/120-volt area network?

Question 9.6 : If yes, What is the maximum allowed size for the induction generation at any given service?

Question 9.7 : Do you allow the induction generator to feed real power back into the secondary of the area network under unfaulted conditions?

Question 9.8 : Do you place any limits on the total amount of induction generation that can be connected to any given area network? If so, how is that defined?

Question 9.9 : Do you allow synchronous generators to connect to the 208Y/120-volt area network?

Question 9.10 : If you do allow distributed generators to connect to your network, do you have a written guideline that defines the interconnection requirements?

Question 9.11 : Do you allow time delay tripping of network protectors that are supplying 208Y/120-volt area networks?

Question 9.12 : Are there any administrative codes, rules, regulations, etc established by Public Utility Commissions, Boards of Public Utilities, etc. that cover the connection of co generation to area networks in your service territory?

Survey Questions taken from 2009 survey results - Distributed Generation
Question 9.1 : Do you allow inverter based generation to connect to the 208Y/120-volt area network?

Question 9.2 : Do you allow induction generators to connect to the 208Y/120-volt area network? (This question is 9.5 in the 2012 survey)

Question 9.3 : Do you allow synchronous generators to connect to the 208Y/120-volt area network? (This question is 9.9 in the 2012 survey)

Question 9.4 : If you do allow distributed generators to connect to your network, do you have a written guideline that defines the interconnection requirements? (This question is 9.10 in the 2012 survey)

Question 9.5 : Do you allow time delay tripping of network protectors that are supplying 208Y/120-volt area networks? (This question is 9.11 in the 2012 survey)

Question 9.6 : Are there any administrative codes, rules, regulations, etc established by Public Utility Commissions, Boards of Public Utilities, etc. that cover the connection of co generation to area networks in your service territory? (This question is 9.12 in the 2012 survey)


7.7.7 - Distribution Automation Control in Contingencies
7.7.7.1 - CenterPoint Energy
Planning
Distribution Automation Control in Contingencies
People
Contingency planning at CenterPoint is performed by the Electric Distribution Planning department (Planning group). This group is not part of the Major Underground group organizationally. One planning resource, an Engineering Specialist, is assigned full time to work in Major Underground, in a matrix arrangement.
Technology
CenterPoint’s normal design configuration provides adequate capacity to carry load in a single contingency. For situations where a substation transformer is highly loaded, CenterPoint has implemented programming at certain stations[1] that will swap loads to alternate sources in the case of the loss of a substation transformer, helping them to defer the investment to increase transformer capacity. This programming moves loads among transformers within a station and from station to station to provide service continuity in a contingency situation during peak periods by optimizing the distribution of load among transformers. The programming uses two systems developed by CenterPoint.
The first, called “Smart Cascade”, uses a substation standard relay scheme, and swaps loading between substation transformers within a station in an alternate configuration by open and closing selected bus breakers. With Smart Cascade active, if one transformer in a three transformer substation is out of service, feeders that are normally fed by that transformer will be rolled to selected bus sections to optimize the transformer loading. These selected bus sections may be different than the normal default in a contingency without Smart Cascade activated.
The second, called the “Distribution Automated Control System (DACS)”, swaps load between stations using radio controlled (900 MH) automated switches located on the distribution system. With DACS active, a feeder or feeder section may be rolled to an alternate substation in a contingency situation to relieve the loading on its normally fed substation transformer.
Note that the Smart Cascade and DACs systems are not active at all times. These systems are automatically “armed” when substation transformer loading moves to 95% of nameplate. At 85% loading, the system sends alarms / pages notifying selected CenterPoint personnel of the high loading. During lower load periods, Smart Cascade and DACS are not active, as CenterPoint’s normal substation and feeder configuration can carry the load adequately in a contingency.
The implementation of this system has enabled CenterPoint to defer the installation of additional substation transformers. Planning engineers can load the transformers a little higher in a normal configuration, because they have the ability to quickly shift some load elsewhere in a contingency.
See System Protection - Technology
See Contingency Planning - Process
[1] Note that the technologies described in this section are not used in substations with dedicated underground circuits.
7.7.8 - Intermittent Supply Forecasting
7.7.8.1 - Energex
Planning
Intermittent Supply Forecasting
Process
Energex has a photovoltaic monitoring research project underway focused on gathering data to be able to better forecast power supplied by intermittent solar panel supplies, to determine battery storage requirements.
The project is focused on approximately 150 solar panel-equipped customers. The monitoring system is bringing back “one minute” data from the grid. So far Energex has amassed six terabytes of information for its study. The project includes the allocation of batteries for storage at the pilot sites, and will include battery monitoring.
Working with researchers, the Energex team is attempting to come up with network forecasting of intermittent supply, which is quite useful for battery storage.
Technology
The team is investigating a system that integrates solar panels with an intelligent inverter and a battery. By remote control, Energex could send parameters to the device for demand management and voltage management for the utility, and the customer could receive information and capability to change parameters to minimize his bill.
7.7.9 - Load Forecasting
7.7.9.1 - AEP - Ohio
Planning
Load Forecasting
People
Load forecasting is performed by the AEP Network Engineering, which is organizationally part of the AEP parent company. Network Engineering includes two Principal Engineers and one Associate Engineer who perform network planning and engineering activities, including load forecasting for the Columbus and Canton urban underground networks of AEP Ohio. These engineers are geographically based in downtown Columbus at its AEP Riverside offices. Columbus-based Network Engineers perform load forecasting working in collaboration with AEP Distribution and the Network Engineering Supervisor. The Network Engineering group reports to the AEP Network Engineering Supervisor, who in turn reports Distribution Systems Planning Manager. Distribution Systems Planning reports to the AEP Vice President of Customer Services, Marketing and Distribution Services through the Director of Engineering Services.
AEP also has a Network Standards Committee, headed by the lead Network Engineering Supervisor in its downtown Columbus offices, and comprised of representatives from all AEP operating companies. This group works closely with the parent company’s Distribution Services organizations, and holds regular teleconference sessions on network findings, “lessons learned” in the field, and discusses potential network engineering solutions to common network planning and implementation issues.
Process
AEP Distribution (part of the parent company) uses CYME and its SNA (secondary grid network analysis) module for initial network load analysis for the AEP Ohio group. Load forecasting is then made by AEP Ohio in Columbus and Canton based on both CYME SNA data from AEP Distribution and local peak load analysis. Local peaks are created from collected monthly meter records in its service area. From these records, engineers use algorithms to calculate total kilowatts (demand) from captured kilowatt-hour meter data, and then identify peak loads. Each engineer in the planning process reviews this load information regularly for any increased loads and adjusts the load flow accordingly. Engineers also have access to larger customer load information in the downtown area. For timelier and even more accurate load information, the AEP Ohio Network Engineering group is considering the use of smart meters in the downtown Columbus area for assistance in load analysis and forecasting.
A separate system, maintained by the AEP Distribution Systems Planning group, provides the local Network Engineering group with timely information on the larger loads coming into the AEP Ohio network underground area. There is distribution planning engineer within this group responsible for updating this system with forecasts for all circuits.
The AEP planning group can provide the Network Engineering group load forecasts for all circuits. Using this data on circuits, the local load information calculated from captured meter data, and forecasted growth rates for network feeders, the Network Engineering group can then provide ten-year network forecasts for its Columbus and Canton systems.
The planning process involves running load flow analyses to compare anticipated system loading to the feeder ratings and to identify thermal and voltage violations to the planning criteria in both normal and contingency situations.
Technology
AEP Distribution provides load flow analysis and other secondary network analysis data to the AEP Ohio Network Engineering group from its CYME® Secondary Grid Network Analysis (SNA) software system (seeFigure 1). The AEP Ohio Network Engineering group also uses kWh data captured through automated meters and uses sophisticated algorithms to convert this data to identify peak loads on the network. With this captured data and the CYME analysis from AEP Distribution, AEP Ohio Network Engineers have a solid basis for Load Forecasting.

Figure 1:
CYME SNA load flow analysis software used by AEP Distribution to aid in load forecasting for AEP Ohio
7.7.9.2 - Ameren Missouri
Planning
Load Forecasting
People
Planning engineers within the Underground Division Engineering group are responsible for distribution planning, including feeder load forecasting for the network systems.
The Engineering group within the Underground Division, led by a Supervising Engineer, is comprised of Engineers and Energy Services Consultants (commonly referred to as Estimators) who deal with planning, design, and service issues. The engineering positions are four-year degreed positions. Energy Services Consultants have a combination of years of experience and formal education, including two year and four year degrees. The engineers are nonunion employees; the Estimators are in the union.
Process
The planning process involves running load flows to compare system loading to the feeder ratings and to evaluate the implications to the system of anticipated new forecasted loading.
This forecasted loading is based on a number of factors. Engineers will consider known projects that will add load to the system, estimated future load additions from vacant lots to be developed, and general growth rates. Engineers project five years into the future when performing load forecasting.
Engineers will temperature adjust their load forecasts based on an algorithm developed by corporate engineering that considers the probability of exceeding a given temperature based on historic weather experience.
The planning engineers gather system peak information from information recorded by SCADA. Ameren Missouri has remote monitoring of all network feeders as well as the ability to monitor loading on all network units through a remote monitoring system installed in their network.
Technology
Ameren Missouri uses the DEW load flow product to model their network system. For networks, this model is manually populated and maintained by the planning engineers. The model includes a graphic representation of the primary, secondary, and network unit. For example, when modeling the feeder out of service, DEW will model all the protectors opening. Note that at the time of the practices immersion, Ameren Missouri had assembled a list of desired enhancements to the DEW product.
For radial circuits, DEW imports information and attributes from Ameren Missouri’s GIS system, and imports load information from a transformer load management (TLM) system.
7.7.9.3 - CEI - The Illuminating Company
Planning
Load Forecasting
People
CEI Load Forecasting is performed by the Planning and Protection Section of the Engineering Services Department (CEI Planning Group). The group is part of the CEI Engineering Services department, and is led by a supervisor who reports to the Engineering Manager. The group is responsible for all distribution planning and protection, from 36kV and below. The CEI Planning Group is comprised of 4 Planners and 3 Protection Engineers. All members of the group are four year degreed engineers. The Planning Supervisor noted that he prefers candidates for the CEI Planning Group to have their Professional Engineer (PE) license.
The Regional Planning and Protection group is supported by a corporate Planning and Protection group. This group, the Corporate Planning and Protection group, has recently issued an updated Distribution System Planning Criteria document that defines the load forecasting process.
Process
Note: Because the network is so lightly loaded, CEI is not performing load forecasting on network feeders. However, much of the urban load in Cleveland is being served by non network feeders that are annually reviewed for loading.
A load forecast is calculated annually for each distribution substation power transformer and circuit exit. The forecast is calculated by reviewing historic peak loading recorded from substation inspection and SCADA information. This information and overall growth factors are entered into a system called Load Forecasting and Data Management System (LFDMS) to create historic peak load patterns for each transformer and circuit exit. CEI weather adjusts these peaks to normalize them from “abnormal” weather conditions to “normal” weather conditions using an 80 / 20 probability adjustment that assumes that 80% of summers were cooler than the peak, and 20% were hotter based on a calculation of the cumulative cooling degree days for the peak days. The process for performing this calculation is detailed in their Distribution System Planning Criteria document.
Technology
CEI is using a system called Load Forecasting and Data Management System (LFDMS) to record forecasting information and to create historic peak load patterns for each transformer and circuit exit.
Ultimately, FirstEnergy would like to be able to import information into LFDMS directly from CYME.
7.7.9.4 - CenterPoint Energy
Planning
Load Forecasting
People
Distribution load forecasting at CenterPoint is performed by the Electric Distribution Planning department (Planning group). The load forecasting process is documented - see Attachment A
The Distribution Planning group is comprised of 21 total resources, including 2 Lead Engineers. Each of the Lead engineers has about 6 -8 people reporting to them. These folks are either 4 year degreed engineers, or technical experts. CenterPoint aims to have a balance between Engineers and Technicians.
In addition the Planning group has a lead engineer specialist, who leads a computer support group comprised of 6 resources. These folks work with systems such as CymE, Microstation, LD Pro, etc.
Note that one planning resource, an Engineering Specialist, is assigned full time to work in Major Underground, in a matrix arrangement.
CenterPoint encourages its engineers to obtain their PE license. The PE license is required to become a Senior Engineer at CenterPoint.
Process
CenterPoint develops load forecasts for distribution planning purposes. These load forecasts account for uncertainty by using conservative assumptions including:
-
The forecast assumes a 102 F degree peak day temperature (CenterPoint system peaks usually occur in August.)
-
The forecast assumes any MW reduction from energy efficiency plans will be small and scattered
-
Other assumptions as defined in The Distribution and Transmission Planning Load Forecast Process document ( See Attachment A). Distribution Planning acquires new load inputs on a continuous basis throughout the year from area Service Centers for residential and small commercial customers and from the Key Accounts group for large distribution customers. The projected new loads may be adjusted based on historical trends or based on knowledge of the load profiles of similar customers. The projected new loads are then totaled by substation and input into a spreadsheet by year.
A growth factor is added to each substation area based on historical trends (CenterPoint has 49 years of loading history). Typically, this growth factor ranges from 0% in low growth areas to 7% in high growth areas. Planners may subtract anticipated load loss due to interconnections or energy efficiency programs.
The previous year’s actual summer peak loads for each substation are input into the spreadsheet and are added to the new projected loads to develop the load forecast for the next year by substation. The distribution load forecast is typically finalized in the fourth quarter of the year.
Once the load forecast is developed for a station, planners would then determine whether or not they need to address the substation capacity or the circuit capacity. In these cases a Planning engineer could perform an area study to optimize the distribution of loads between stations.
The Planning group annually revises the five year load forecast based on known and anticipated load projections.
Technology
CenterPoint is using spreadsheets and CymE load flow software to perform analysis.
7.7.9.5 - Con Edison - Consolidated Edison
Planning
Load Forecasting
Process
Load Forecasting — Ten-Year Electric Peak Load Forecast Description
Annually, the service area electric peak load forecast is developed for each of the major sectors of the economy, which includes commercial, residential, and governmental. The forecast predicts the maximum summer electric peak demand for the system.
The commercial forecast reflects three generic variables for the short- and long-term outlook: business conditions, economic conditions, and energy prices. The commercial forecast also reflects the impact of short-range construction activities within Con Edison’s service territory. The commercial sector accounts for approximately half of Con Edison’s[1] peak load.
The residential forecast is based on projections of the number of households, number of appliances, household occupancy, and coincident use of appliances. Air conditioning load is the most important contributor to the residential load. The residential sector accounts for about one-third of the Con Edison’s[2] peak load.
The governmental load is derived using information by customer class based on new business activities.
Key Drivers of the Electric Peak Load Forecast
-
Known Construction Projects - Known new projects predominantly include business activities such as planned construction projects or construction already under way. Projects are tracked to capture the effect on the electric peak load.
-
Economy - The economic factors used in the forecasting process are the New York City private nonmanufacturing employment metric and the U.S. Gross Domestic Product (GDP). Private nonmanufacturing employment includes all employment except government and manufacturing. GDP is the broadest measure of the economy’s health.
- The economic outlook that underlies Con Edison’s forecast recognizes the service area’s place in the world economy. The forecast assumes that New York City will continue to compete for national and international business throughout the forecast period with the same degree of success that it has had in recent decades.
-
Consumer Behavior - Consumer response to hot weather through air conditioning usage is the main driver of the residential peak load on a hot summer afternoon. Since air conditioning load makes up 75% of the residential peak load, Con Edison captures information on air conditioning usage and number of units through various surveys.
-
Technology - Improvements in equipment efficiency are captured for major appliances, such as air conditioners and refrigerators. These improvements are reflected in the electric peak load forecast.
-
Government Large infrastructure projects undertaken by the city, state, or federal governments are included in the peak load forecast.
Temperature Variable (TV) Used in Load Forecasting
What It Is
The temperature variable (TV) is a reference point that Con Edison uses in designing their electric transmission and distribution systems. The TV is used in calculating and forecasting future system loads, taking into account extreme summer weather conditions — sustained high temperatures and humidity over a three-day period — that they would expect to see in the metropolitan New York area in one of every three years.
What It Isn’t
As a reference point, the TV factor is a starting point for preparing for the effects of weather on electric loads, similar to the way in which building codes are starting points for designing and equipping homes and office buildings. It does NOT attempt to calculate or design for the worst weather Con Edison would expect to see in their region, nor does it serve as an “upper limit” design criterion for electric system components. Because Con Edison designs and builds the components of their transmission and distribution systems with significant “margin,” or conservatism, these systems have a great deal of aggregate resiliency. This means that the systems, including the distribution networks, can generally handle temperatures and consequent loads higher than those factored into the TV.
How It’s Calculated
The reference TV for Con Edison’s service area is a factor of 86° using Central Park weather. For Orange & Rockland Utilities (O&R), it is 85° using White Plains weather. In more easily understood terms, a TV factor of 86° is equivalent to a temperature and humidity Heat Index of 105° — an extremely high level at which the National Weather Service advises taking precautions against sunstroke, heat cramps, and heat exhaustion.
Specifically, the summer TV factor is calculated as a weighted average of the highest three-hour temperature (called dry-bulb) and humidity (called wet-bulb) readings each day between 9 AM and 9 PM. (Please note, dry-bulb temperature is the one familiar to most people, being the value used in all media weather pronouncements.) This temperature and humidity data helps determine the discomfort level of Con Edison’s customers, and their associated use of air conditioning.
Since heat “buildup” over a hot spell of a few days’ duration significantly increases air conditioning use and stress on Con Edison’s electric system, the formula for calculating the system TV on a daily basis incorporates three days’ worth of data. The current day’s weather is weighted at 70%, the previous day’s at 20%, and two days before at 10%. A factor of 86° for Con Edison equates to a condition that generally occurs in one of every three years.
How It Has Fared Through History
The TV reference factor has been in use as a planning tool for many years in Con Edison. A Con Edison review of data going back to 1953, when they started keeping relevant records, indicates that the TV factor of 86° or above is achieved approximately in one of every three years.
How Con Edison Compares to the Industry and the Region
Using a TV factor as a reference point is a standard planning practice throughout the utility industry. In fact, Con Edison is more conservative than most. They design to a standard that assumes “worse” and more prolonged weather than many other utilities, government agencies, and regional power pools.
Ten-Year Area Substation and Sub-transmission Feeder Load Relief Programs
Area substation transformer ratings (including breakers, bus, etc.) are calculated by Substation Equipment and Field Engineering. Transmission and Sub-transmission feeder ratings are calculated by Transmission Feeders Engineering.
Area substation transformer ratings and sub-transmission feeder ratings are calculated using appropriate first or second contingency ratings, and the capabilities of the area substations and sub-transmission feeders and load pockets are derived.
This data is then dovetailed with the ten-year independent load forecast, and the area substation load and capability tables are developed. Options are identified for needed load relief, including increased capability, transfer of load and/or peak demand reduction by DSM.
Through an iterative process with regional distribution engineering, the recommended load relief plan is developed and published as the substations and sub-transmission feeder load relief program. This program is a major feed into the five-year capital budget plan.
Technology
Load Flow System – Poly-Voltage Load Flow (PVL)
Con Edison utilizes a distribution load flow application called Poly-Voltage Load Flow (PVL). The PVL application is actually a suite of applications that was developed in house over a 20-year period of continued development. In addition to aiding engineers in performing load flow analyses, the PVL system is used to build feeder and transformer models, develop network transformer ratings, develop network feeder and cable section ratings, model area substation outages, and identify short-circuit duty at customers sites, etc.
To perform load flows, circuit models are brought into PVL from the mapping systems. The secondary system is kept in one mapping (GIS) system (different from location to location), and the primary feeders are kept in another mapping (GIS) system. Con Edison reflects all system changes on its mapping systems. Feeder maps within Manhattan are updated in 24 hours as changes occur. Secondary side maps are not updated as quickly, but are very frequently updated. These GIS systems are maintained by the mapping organization.
When the circuit information is brought into PVL, the new information overlays the existing circuit model already in the system. Once the model is brought into PVL, all users use the same model. When a circuit is brought into PVL, people responsible for model maintenance ensure that the PVL model has electrical connectivity and is in synch with the mapping system.
Load flows are conducted for a variety of reasons.
-
Planning engineers run base case load flows, N-1 cases, and N-2 cases. For each contingency, the PVL output tells you what is overloaded in tabular and graphical formats.
-
Planning engineers use PVL to assist in short-range and long-range planning. For example, the system is used to analyze conceptual projects to split existing networks into smaller networks
-
For new business, engineers run the existing case, and then re-run it with the new business load added to understand the loading and voltage implication of the new load.
-
Region Engineering runs feeder loading studies in advance of the summer to identify anticipated overload conditions.
-
The system is also used to understand the loading implications of different restorations scenarios in an outage.
PVL can use real-time readings from transformer vaults (gathered through Con Edison’s Network Remote Monitoring System [RMS]) for building the network load model. If needed, demands can be spotted at customer service points, using information such as customer kWh consumption and real-time transformer readings.
The PVL system can also perform cable section ratings. The system considers the impacts of soil type and temperature. The system does not automatically consider the proximity of electrical facilities to steam mains.
Operators are able to take advantage of the functionality of PVL through a real-time version known as AutoWOLF, which takes the base model and applies real-time conditions. For example, real-time transformer loading information would populate the model from RMS system. Knowledge of open feeders would populate the model from SCADA. When a circuit locks out, AutoWOLF automatically runs the system peak case, the current case, and the projected peak case, so that that information is available to an operator. The operator can look at the loading on the other feeders and try to determine which feeders to watch.
During emergency conditions, Con Edison assigns engineers assigned to the control room to monitor system loading. During normal conditions, the operators monitor the system themselves.
Con Edison has formed a PVL users group that meets bi monthly to discuss issues associated with the PVL. The PVL Users group is made up of approximately 50 people from both the regions and corporate, including network model maintenance people, designers, supervisors, engineers, engineering managers, and support personnel. Approximately 15 members attend any one meeting.
7.7.9.6 - Duke Energy Florida
Planning
Load Forecasting
People
Load forecasting is performed by the Planning Engineers, responsible for capacity planning, and who are organizationally part of the Power Quality, Reliability, and Integrity Group (PQR&I). This group is led by a Director of PQR&I for Duke Energy Florida.
Process
Because Duke Energy Florida has seen minimal capacity demand growth in its urban underground grid, Engineers in the PQR&I group spend much of their time focusing on reliability and infrastructure upgrades.
Capacity studies, for both normal and contingency conditions, are triggered by new load additions. When there is a call for any significant new load in the urban underground centers, Network Planners will model the impact of a proposed new load on the network using CYME®, looking at both normal conditions and contingencies. In addition, for large load additions, and for longer-term forecasting, planning will utilize a feeder load allocation program (FLAP). Planners input anticipated annual percent load increase expectations and known spot load additions into this system, and it will return an overall expected load forecast.
Network loading in Clearwater has remained flat. Duke Energy Florida is experiencing moderate load growth in St. Petersburg.
Technology
Network Planners use CYME Power Engineering software to perform load flow calculations on primary feeders.
The FLAP (feeder load allocation program) is used to develop load forecasts. When larger service loads are planned, this system will incorporate the impact of significant anticipated load additions on the overall forecast.
7.7.9.7 - Duke Energy Ohio
Planning
Load Forecasting
People
Load forecasting is performed by the network planning engineer. The load growth in downtown Cincinnati for the past six years has been flat, according to the planning engineer.
A weather adjustment factor is provided by the Customer Market Analysis group, a corporate group organization that does total system peak load forecasting for Duke Energy Ohio. Recent history shows a flat load growth on the network with and without weather normalization applied.
Process
System peak information is gathered by the Planning Engineer from information recorded through SCADA and stored in an OSI PI Historian.
Duke Energy Ohio has remote monitoring of about 50 to 60% of the substations within Cincinnati, primarily the larger stations. Each month, mobile operators visit all the substations and read and record the loading. (Note that both of the substations that supply the network are visited weekly by mobile operators to perform network protector drop tests.)
Every network feeder has the ability to supply amp readings back to the EMS system. Duke also has remote indication on total network power (megawatts, amps, VARs). All information read by the EMS system is saved in an OSI PI Historian.
The planning engineer has access to EMS data on his desktop. Consequently, he has good information on network loading based on the historical load information housed within the PI server. Note that, by design, the Network engineer within Engineering does not have access to the EMS and must coordinate with the Planning engineer to gather this information. This “check and balance” requires these two engineers to work in partnership to analyze the network system.
The planning engineer forecasts the load by “discrete input.” He takes the known loading and adds in anticipated new loads by feeder, by phase and by transformer.
Information about new loading comes from various sources. The planning engineer often tracks the proposals of new loads coming in. Much of the time, new load information is provided from the engineering department who deals with new customer requests. Sometimes new load information comes in the form of a request for a fault current. At other times, the planning engineer will be involved in an early planning meeting about a potential new load.
Several announced projects to be served from the network indicate the likelihood of increased load in the coming years. Once load growth is confirmed, the planning engineer has the capability to produce a trended load forecast.. The Planning engineer noted that his experience of downtown loads is that they vary less as a function of temperature than do other system loads (suburban and rural).
7.7.9.8 - Energex
Planning
Load Forecasting
People
Load forecasting is performed by engineers within the Network Capital Strategy and Planning Group, part of the Asset Management organization. The Network Capital Strategy and Planning Group is led by a group manager.
Process
For planning purposes, Energex develops a load forecast that considers historic loading as a function of temperature and humidity, and forecasts peak loading. For planning, Energex applies a probability that actual weather conditions will exceed those used in the forecast. For normal condition planning, Energex uses a 10 percent probability that forecasted peak conditions will be exceeded (1 in 10 years). For contingency planning purposes, Energex uses a 50 percent probability that during a contingency, those peak loads will be experienced. Forecasts are articulated in the DAPR.
Technology
Energex uses three load flow packages, including one for the transmission side of the business (PSSE), and SINCAL and DINIS on the underground network to simulate the impacts of forecasted summer and winter loads on all Energex feeders.
7.7.9.9 - ESB Networks
Planning
Load Forecasting
People
Load forecasting at ESB Networks networks is performed by planning engineers within the Network Investment groups – one responsible for planning network investments in the North, and the other for planning in the South. Organizationally, the Network Investment groups, both north and south, are part of the Asset Investment organization. In addition to the Network Investment groups, the Asset Investment organization is also comprised of a Generation Investment group and a Specifications group, each led by a manager. The Asset Investment group is part of Asset Management.
Planning is performed by one HV planner and four MV planners. Most of these individuals are degreed engineers, but some are “Technologists” who have developed their expertise through field experience.
Planning standards and criteria for load forecasting are developed jointly between the Asset Investment group and the Strategy Manager, which is part of the Finance and Regulation group within Asset Management.
Process
Planners look at previous peak demands in winter and summer months for forecasting purposes. Load forecasting has been problematic in recent years as ESB Networks has seen a drop in new customers. During the 1990s, relocation of many overseas companies to Ireland saw a rapid increase in demand for power, but that demand has fallen off. Nevertheless, forecasting must be performed to maintain operational efficiency and to inform its five-year asset review process, which is overseen by regulators. Load forecasting is reviewed on a monthly basis. The result of these efforts is a comprehensive five-year asset investment plan for meeting their service level targets.
The ESB Networks underground network has expanded by 100 percent over the last ten years. The organization expects further capacity expansion as wind farm projects, currently underway, come fully online in the near future. As a part of its load forecasting ESB Networks is also taking into account the need for replacing aging assets that would affect the reliability and availability of service in the urban underground.
As a customer quality target, ESB Networks requires customer voltages to remain at +/- 5% of nominal in normal situations, and +/- 10% of nominal in standby (contingency) situations. Load forecasting and system planning criteria also call for long-term cyclical overloads of no more that from 125-150 percent of rating for equipment, with a short-term loading of no more than 150-180 percent.
Technology
ESB Networks maintains yearly peak demand records and cable loading ratings for reference in its planning and GIS software. It uses a home-grown Excel spreadsheet for LV load drop calculations. Special Load Reading data (SLR) is captured bi-annually through ESB Networks’ SCADA network. Demand trends are tracked and reported in monthly meetings.
7.7.9.10 - Georgia Power
Planning
Load Forecasting
People
Load forecasting is performed by the Area Planner for new projects based on information from the Senior Engineers in the Network Underground division of Georgia Power. Senior Engineers and Area Planners are four-year degreed, non-union personnel. There is considerable communication between Area Planners, Senior Network Underground Engineers, and Georgia Power upper management in forecasting and planning loads in major metro areas served by the utility. Area Planners forecasting loads on the network plan on at least a three-year horizon with historical, engineering data, and marketing project forecasts to aid them.
Process
The planning process involves running load flow analyses to compare system loading to the feeder ratings and to evaluate the implications to the system of anticipated new forecasted loading.
Network planning is based on a peak load analysis, using the previous summer’s peak (GA Power is normally a summer peaking company), recognizing that the peak is only representative of loading for a few days each year. In developing the load forecast, engineers consider known projects, estimated future load additions from new projects already in the pipe-line, and general growth rates. Engineers may also temperature-adjust their load forecast based on models developed by the engineering staff.
Engineers model the system, and perform analyses to understand anticipated requirements. For network feeders, planning engineers perform contingency studies, modeling networks with each primary feeder out of service to identify areas of needed reinforcement to supply the network in a contingency. Area Planning engineers perform contingency studies (N-1 planning) to assure they can pick up customers with reserve feeders within the emergency ratings of the transformer and cables. More specifically, they model the distribution system with one feeder out of service, simulating customers connecting to reserve feeders. From this analysis, planning engineers determine where reinforcement is necessary to be able to reliably serve customers in a contingency situation.
Area Planners and Senior Engineers target no more than a 90 percent cable and/or transformer load; when either condition is imminent, Area Planners are informed and plans are made to increase capacity. Peak loads that sample highest average loading over a multi-year period are taken into account.
Technology
Georgia Power uses a GIS system, generic models based in CYMDIST, and spreadsheet data to track loads and provide guidance for planning. When loads approach 90 percent capacity, the affected grid is flagged in the system for Area Planners and action is taken to increase the network capacity, off-load to another network, or build another network. It should be noted that Georgia Power is not shrinking its network and is committed to increasing the network footprint where loading and customer demand dictate.
7.7.9.11 - HECO - The Hawaiian Electric Company
Planning
Load Forecasting
People
HECO Load Forecasting is performed by the Distribution Planning Division. The Distribution Planning Division is part of the System Integration Department. This group performs all distribution planning at 46kV and below.
Process
A load forecast is calculated annually for each distribution substation power transformer and circuit exit. The forecast is calculated by reviewing historic peak loading from the previous year recorded from substation inspections. This peak is combined with projected new loading information gathered provided by the Customer Installations Department (CID) to determine the load forecast.
The weather on O’ahu is fairly predictable from one year to the next. HECO noted that its actual experience of peak loading in a given year is normally fairly close to the forecast. This enables them to utilize the most recent year’s peak as a starting point without applying probabilistic methods to predicting the peak in the coming year. HECO’s peak usually occurs in either August or September.
Because HECO has limited application of SCADA, feeder loading forecasts are developed by apportioning the monitored substation loading over the feeders based on periodic feeder loading measurements called “Tong Tests”. Tong Tests are amp readings taken on each feeder four times per year – one winter, one summer, one day and one night measurement. These measures are used to forecast and model the feeder loading for analysis.
7.7.9.12 - National Grid
Planning
Load Forecasting
People
Load forecasting for network feeders is performed by the Distribution Planning department, led by a Director. This group also does distribution planning for both the network and non-network systems.
Load forecasting for network feeders is based on an overall system forecast developed by a National Grid load forecasting group, a corporate organization.
Process
Forecasting at the distribution level is an annual process. Distribution Planning receives a load forecast from a corporate group at National Grid who develops the load forecast. This forecast is built on several components, including historic loading going back 30 years, known anticipated spot loads in excess of 1 MW, and the forecasted economic outlook. The latter uses county level econometric data, that serve to predict energy requirements based on local economic variables, such as employment rates, The forecasting department obtains some key variables from external organizations such as Moody’s. Note that the forecasted summer peak demand growth rate also factors in the impacts of demand side management programs, anticipated to reduce the growth in peak demand by .3% per year over the next four years.
The Load Forecasting group has a weather normalization process that considers temperature and humidity over a three-day period. From this process, they develop provide to Distribution Planning three forecasts: a 50-50 forecast (normal) , a one in 10 year forecast, and the one in 20 year forecast. These probabilities provide planning engineers the likelihood of achieving peak loads in excess of the forecast values. For distribution planning, planning engineers use the most conservative forecast, the one in 20 year forecast.
Planning engineers take the summer peak forecast and apply that to the feeder level.
While National Grid’s approach to developing an overall forecast is fairly sophisticated, their ability to forecast at the feeder level is less so. This is in part because they lack remote monitoring and recording and thus base feeder forecasts on recorded meter readings that may not reflect the most current circuit configurations.
Overall, National Grid New York is experiencing about a one percent load growth, though the load growth in the network has been rather flat. Both commercial and industrial loading is declining with residential loading increasing at about two percent annually. The annual load factor is declining.
Technology
National Grid planning engineers use the PSSE power flow product to model and perform power flow analysis of the network system. For non network feeders they are using CymeDist which is integrated with their GIS system.
7.7.9.13 - PG&E
Planning
Load Forecasting
People
Load forecasting for network feeders is performed by the Planning and Reliability Department. This department is led by a Principal Engineer, who is also the department supervisor. This group does distribution planning for both the network and non-network systems. Eight engineers comprise this department. Six focus on the radial system, and two focus on the network system.
For network systems, the two planning engineers are responsible for distribution planning, including feeder load forecasting.
Both network planning engineers are four year degreed engineers. They are represented by a collective bargaining agreement (Engineers and Scientists of California).
Process
The planning engineer forecasts the load by “discrete input.” He takes the known loading and adds in anticipated new loads by feeder.
System peak information is gathered by the planning engineer from information recorded by SCADA and stored in the SCADA Historian. In projecting peak loading, engineers will use five years of loading history to account for periodic variations in load.
Planning engineers obtain monthly peak loads from the SCADA historian and compare this to feeder ratings. Engineers may enter the SCADA readings into the load flow model and recalculate to see if there are any overloads. Alternately, they may simply compare the monthly peak values to previous peak load readings and circuit ratings. Also, planning engineers will ascertain the validity of any projected new load estimates, and run load flows to understand the implications of the added load.
PG&E has remote monitoring of all network feeders. Also, they have the ability to monitor loading on all network transformers through CT monitoring installed on the transformer secondary (at the NP exit cables). This information is housed in the PG&E SCADA Historian.
The planning engineer has access to the SCADA Historian on his desktop. Consequently, he has good information on network loading based on the historical load information housed within the historian.
Technology
PG&E uses the EasyPower load flow product from ESA to model their network system. This model is manually populated and maintained by the Planning engineer. The planning engineer reports being satisfied with this planning tool.
Note that PG&E is presently implementing the CYMEDIST (by CYME) load flow product for performing analysis of their radial system. In a subsequent phase of their project, they plan to implement the use of CYMEDIST as their network planning tool as well. A challenge for them will be the conversion of data from EasyPower to CYMEDIST.
7.7.9.14 - Portland General Electric
Planning
Load Forecasting
People
Across PGE, the Transmission and Distribution (T&D) Planning organization oversees load forecasting for network and non-network systems. A Planning Engineer with a four-year degree in engineering covers the PSC. Three Distribution Engineers also work on the underground network, although they are not based in the PSC service center or CORE group. They are overseen by the Eastern District Central Supervisor and are responsible for updating the PSSE models covering the secondary network.
Other organizations involved in load forecasting include the Planning Group, which provides the “Weak Link Report,” which covers both the radial and network system and shows system peak loadings in summer and winter. Because the network includes many commercial customers with high energy demands, the Major Account Representatives responsible for the network provide any information about potential load changes from larger customers.
Process
Load Growth Studies: PGE does not conduct routine load growth studies on the network and only performs analyses when there is a specific need due to changing loads and customer demand. When needed, PGE uses system wide load growth studies, with updates from the major account representative who reports any anticipated changes to the load that a customer will undertake.
Reporting: The Planning Department creates bi-annual reports on the network loading, the “Weak Link Report,” which covers both the radial and network system. The report examines the system peak loading for the summer and winter, with network data sourced from the substations. The monitoring data that is currently received from the network is not used for modeling or planning; it is only used for operations.
PSSE Load Modeling Software: For the network system, PGE uses the Siemens PSSE modeling software for both the primary and secondary network models. Planners collaborate with Distribution Engineers to obtain the most up-to-date model in PSSE, including manually entering loading information. The load data is derived from the customer meters, and gathering and entering this information is a labor-intensive process. PGE’s network load is relatively flat, but the utility is anticipating an increase in the next few years due to an expansion of the retail sector in the downtown area.
PGE used PSSE to develop a sequence when splitting the Stephens Substation secondary network into two four-feeder configurations. System planners used PSSE modeling software to perform load analyses using peak demand data drawn from metered accounts on the network. The company used PSSE to assign appropriate nodes to the metered accounts, and the load was scaled to match a coincidental summer peak loading patterns.
PGE used this to develop a base case scenario with the loadings and voltage on lines, equipment, and buses for the Stephens network. Planners were able to ensure that no line would be loaded more than 100%, no grid transformers would be loaded more than 140%, and no spot network transformers would be loaded more than 130% during peaks. Base loadings specified that no line should be loaded more than 88% and that no transformer should be loaded more than 70%. Where outages would see equipment potentially exceed the loadings, PGE identified equipment upgrades [1].
Load Reduction and New Customers: As a wider philosophy, PGE is trying to maintain the network and reduce loads where possible. If a new customer enters the system on the periphery of the network system, they are usually added to the radial system rather than the network. The reason for this approach is that networks are expensive to maintain and build, so network access is reserved for customers with connections lying well within the network.
Customers on the periphery can request an alternative service to ensure reliability, which includes a service agreement and payment for the contingency service and the reserve capacity needed. This can also depend upon the load, with the enhanced service provided free for customers requiring over 18 MW loads. Customers with loads under 4 MW pay only for the feeder, and customers with 4-18 MW demands pay for the substation capacity.
Technology
To model the network system, engineers use Siemens PSSE software for the primary and secondary network, using data from customer meters to develop a base case and highlight where normal and peak loading exceeded recommended limits.
Because PSSE is unable to monitor single-phase loads and cannot model loops, PSC will add the secondary network to CYME, using the GIS system to model and display loops. For mapping, PGE uses ArcFM on top of ArcGIS. The company is presently working with the ArcFM vendor to enable its use with CYME.
- Derek Harris. 2014. PGE Stephens Network System Split Report, internal document.
7.7.9.15 - Survey Results
Survey Results
Planning
Load Forecasting
Survey Questions taken from 2015 survey results - Planning
Question 49 : How do you collect network load data for modeling purposes? (check all that apply)

Survey Questions taken from 2012 survey results - Planning
Question 3.17 : If you are using load flow software, please indicate which software product(s) you are using.

Question 3.18 : How do you collect network load data for modeling purposes?

Survey Questions taken from 2009 survey results - Planning
Question 3.14 : If you are using load flow software, please indicate which software product(s) you are using.

7.7.10 - Load Relief
7.7.10.1 - Ameren Missouri
Planning
Load Relief
People
Resources in several groups perform distribution planning of the network at Ameren Missouri.
Area planning for the distribution system is the responsibility of Distribution Planning and Asset Performance. This group, led by a manager, is staffed with four-year degreed engineers, and includes the Standards Group as well as a Planning Engineering Group. Organizationally, Distribution Planning and Asset Performance is part of Energy Delivery Technical Services, reporting to a vice president.
Local distribution planning of both the network and non-network underground infrastructure in St. Louis is the responsibility of the engineering group within the Underground Division. This division is led by manager, and consists of both engineering and construction resources responsible for the downtown infrastructure. The engineering group is led by supervising engineer, and is comprised of Engineers and Energy Services Consultants (commonly referred to as Estimators) who deal with planning, design, and service issues. The engineers are four-year degree positions. Energy Services Consultants have a combination of years of experience and formal education, including two year and four year degrees. The engineers are nonunion employees; the estimators are in the union. Organizationally, the Underground Division is part of Energy Delivery Distribution Services, reporting to a VP.
Process
Ameren Missouri’s St. Louis service territory contains four individual secondary network grids, each sourced by separate substation. Each of the networks is designed to N-1[1] . However, Ameren Missouri plans for a substation bus outage and, if they lose any one bus, they may lose two feeders supplying a given network. The system is designed to handle this particular contingency – an N-2 situation.
The planning process involves running load flows to compare system loading to the feeder ratings and to evaluate the implications to the system of anticipated new forecasted loading. Network planning is based on a peak load analysis, recognizing that the peak is only representative of loading for a few days each year. In developing the load forecast, engineers will consider known projects, estimated future load additions from vacant lots to be developed, and general growth rates. Engineers will also temperature adjust their load forecast based on an algorithm developed by corporate engineering.
Engineers model the system, and perform analyses to understand anticipated requirements. For network feeders, planning engineers perform contingency studies, modeling networks with each primary feeder out of service to identify areas of needed reinforcement to supply the network in a contingency. For radial feeders, planning engineers perform contingency studies (N-1 planning) to assure they can pick up customers with reserve feeders within the emergency ratings of the transformer and cables. More specifically, they model the distribution system with one feeder out of service, simulating customers connecting to reserve feeders. From this analysis, planning engineers determine where reinforcement is necessary to be able to reliably serve customers in a contingency situation.
Technology
Ameren Missouri uses the DEW load flow product to model their network system. For networks, this model is manually populated and maintained by the planning engineers. The model includes a graphic representation of the primary, secondary, and network unit. For example, when modeling the feeder out of service, DEW will model all the protectors opening. Note that at the time of the practices immersion, Ameren Missouri has assembled a list of enhancements they desire to the DEW product.
For radial circuits, DEW imports information and attributes from Ameren Missouri’s GIS system, and imports load information from a transformer load management (TLM) system.
[1] Note that at the time of the immersion, Ameren Missouri had drafted planning criteria that includes an N-2 design for the grid network primary feeders, and N-1 design for spot networks, and an N-1 design for radial feeders. This draft has not yet been adopted by Ameren Missouri.
7.7.10.2 - CEI - The Illuminating Company
Planning
Load Relief
People
The Planning and Protection Section performs annual studies of primary feeder loading to anticipate areas of overload and recommend remediation. These annual studies are limited to the non – network portion of the system.
Process
Because the load in the Cleveland network is forecasted to continue to decline, CEI does not perform annual analysis of network feeders other than to annually monitor peak loading and assure that the load continues to be well below the distribution network feeder capability. Consequently, CEI does not develop network feeder load relief plans.
For the radial underground distribution feeders, CEI annually compares the most recent historical peak distribution feeder loads against forecasted loads developed using their load flow software. It is from this analysis that CEI identifies load relief projects.
CEI aims to relieve all anticipated primary cable overloads through their regional planning process.
Technology
For Network analysis, CEI utilizes a load flow product called PSLF – Positive Sequence Load Flow Software, by GE Energy.
For non-network analysis, CEI is changing from Windmill to CYME. They ultimately intend to apply CYME to network analysis; however, its functionality in this area is still being evaluated.
7.7.10.3 - CenterPoint Energy
Planning
Load Relief
People
Load Relief plans at CenterPoint are developed by the Electric Distribution Planning department (Planning group).
The Distribution Planning group is comprised of 21 total resources, including 2 Lead Engineers. Each of the Lead engineers has about 6 -8 people reporting to them. These folks are either 4 year degreed engineers, or technical experts. CenterPoint aims to have a balance between Engineers and Technicians.
In addition the Planning group has a lead engineer specialist, who leads a computer support group comprised of 6 resources.
CenterPoint encourages its engineers to obtain their PE license. The PE license is required to become a Senior Engineer.
Process
The Planning group annually revises the five year load forecast based on known and anticipated load projections. (See Load Forecasting )
For substations, Planners input working loads into their models at a substation level. They gather loading information, anticipated new loads and load growth rates from the service centers and load it into a model for developing a forecast. Once the load forecast is developed for a station, planners would then determine whether or not they need to address the substation capacity or the circuit capacity.
Planning Engineers annually perform an analysis of the impacts of anticipated loading on every circuit and substation on the system. From this analysis, they identify areas where changes must be made to address overload situations. In some cases a Planning engineer will perform an area study to optimize the distribution of loads between stations. In others, individual feeder reinforcement projects are developed.
Technology
CenterPoint is using spreadsheets and CymE load flow software to perform analysis. They recently implemented CymE network modeling software. Planners perform circuit analysis to anticipate areas of overload, in both normal and contingency situations. From this, load relief projects are identified.
7.7.10.4 - Con Edison - Consolidated Edison
Planning
Load Relief
Process
Network Distribution Feeder Load Relief Programs
Distribution network feeder loads and ratings are calculated in parallel with the substation and sub-transmission feeder program. The most recent historical peak distribution feeder loads are compared against the network model results (using Con Edison’s circuit modeling tool [PVL]), and any differences are reconciled. The ten-year independent load forecast is applied to the feeders – identified significant additions (i.e., specific new business projects) are injected on the feeders that will serve them, and the remaining load growth is apportioned across the remaining feeders. Feeder ratings and the driving contingency conditions are calculated, and the feeder capabilities are developed.
It is from this analysis that Con Edison conceptualizes new load relief projects. Options are identified for needed network feeder load relief, dovetailing with the area substation load relief options discussed above. Through an iterative process between the Regional Distribution Engineering organization and Transmission Planning, the options are reviewed, and a recommended plan is decided upon.
Con Edison aims to relieve all anticipated primary cable overloads (won’t go above 100% loading), as determined by their analyses. Feeder relief is almost considered nondiscretionary for network feeders, because Con Edison does not have the same flexibility to transfer load as they do in the radial (non-network) parts of the system.
Load relief projects are designed between September and December, so that they can be built between January and June, prior to the upcoming summer loading season. Upcoming summer ratings reflect this work and are published.
Network Transformer and Secondary Mains Load Relief Programs
Network transformer and secondary mains relief follows an identical process as primary feeder relief. The same ten-year independent load forecast and the same network models are run. Transformer and main ratings and the driving contingency conditions are calculated, and the capabilities are developed. In addition to this, any transformer with recorded telemetry (Con Edison’s Remote Monitoring System [RMS]) from any historic peak period indicating capability issues are studied and relieved upon confirmation. All options are reviewed by the regional engineering department and once the plan is accepted, the project is issued to and completed by both the construction and construction management groups.
Technology
Load Flow System – Poly-Voltage Load Flow (PVL)
Con Edison utilizes a distribution load flow application called Poly-Voltage Load Flow (PVL). The PVL application is actually a suite of applications that was developed in house over a 20-year period of continued development. In addition to aiding engineers in performing load flow analyses, the PVL system is used to build feeder and transformer models, develop network transformer ratings, develop network feeder and cable section ratings, model area substation outages, and identify short-circuit duty at customers sites, etc.
To perform load flows, circuit models are brought into PVL from the mapping systems. The secondary system is kept in one mapping (GIS) system (different from location to location), and the primary feeders are kept in another mapping (GIS) system. Con Edison reflects all system changes on its mapping systems. Feeder maps within Manhattan are updated in 24 hours as changes occur. Secondary side maps are not updated as quickly, but are very frequently updated. These GIS systems are maintained by the mapping organization.
When the circuit information is brought into PVL, the new information overlays the existing circuit model already in the system. Once the model is brought into PVL, all users use the same model. When a circuit is brought into PVL, people responsible for model maintenance ensure that the PVL model has electrical connectivity and is in synch with the mapping system.
Load flows are conducted for a variety of reasons.
-
Planning engineers run base case load flows, N-1 cases, and N-2 cases. For each contingency, the PVL output tells you what is overloaded in tabular and graphical formats.
-
Planning engineers use PVL to assist in short-range and long-range planning. For example, the system is used to analyze conceptual projects to split existing networks into smaller networks
-
For new business, engineers run the existing case, and then re-run it with the new business load added to understand the loading and voltage implication of the new load.
-
Region Engineering runs feeder loading studies in advance of the summer to identify anticipated overload conditions.
-
The system is also used to understand the loading implications of different restorations scenarios in an outage.
PVL can use real-time readings from transformer vaults (gathered through Con Edison’s Network Remote Monitoring System [RMS]) for building the network load model. If needed, demands can be spotted at customer service points, using information such as customer kWh consumption and real-time transformer readings.
The PVL system can also perform cable section ratings. The system considers the impacts of soil type and temperature. The system does not automatically consider the proximity of electrical facilities to steam mains.
Operators are able to take advantage of the functionality of PVL through a real-time version known as AutoWOLF, which takes the base model and applies real-time conditions. For example, real-time transformer loading information would populate the model from RMS system. Knowledge of open feeders would populate the model from SCADA. When a circuit locks out, AutoWOLF automatically runs the system peak case, the current case, and the projected peak case, so that that information is available to an operator. The operator can look at the loading on the other feeders and try to determine which feeders to watch.
During emergency conditions, Con Edison assigns engineers assigned to the control room to monitor system loading. During normal conditions, the operators monitor the system themselves.
Con Edison has formed a PVL users group that meets bi monthly to discuss issues associated with the PVL. The PVL Users group is made up of approximately 50 people from both the regions and corporate, including network model maintenance people, designers, supervisors, engineers, engineering managers, and support personnel. Approximately 15 members attend any one meeting.
7.7.10.5 - Duke Energy Florida
Planning
Load Relief
People
Studies to forecast loading and to identify projects to relieve projected areas of overload are performed by the Planning Engineers, responsible for capacity planning, and who are organizationally part of the Power Quality, Reliability, and Integrity Group (PQR&I). This group is led by a Director of PQR&I for Duke Energy Florida.
Process
Because Duke Energy Florida has seen minimal capacity demand growth in its urban underground grid, Engineers in the PQR&I group spend much of their time focusing on reliability and infrastructure upgrades.
Capacity studies, for both normal and contingency conditions, are triggered by new load additions. When there is a call for any significant new load in the urban underground centers, Network Planners will model the impact of a proposed new load on the network using CYME®, looking at both normal conditions and contingencies. In Clearwater, Network linemen also have access to real-time secondary load data on network transformers through Sensus® monitoring. In addition, for large load additions, and for longer-term forecasting, planning will utilize a feeder load allocation program (FLAP). Planners input anticipated annual percent load increase expectations and known spot load additions into this system, and it will return an overall expected load forecast.
Actions to be taken based on anticipated load growth are based on an engineering analysis and are not informed by a written planning criteria. Note that at the time of the immersion, Duke Energy was in the process of consolidating historic Duke Energy and Progress Electric planning approaches into a system planning criteria, expected to be complete mid-2017. Network loading in Clearwater has remained flat. Duke Energy Florida is experiencing moderate load growth in St. Petersburg.
Technology
Network Planners use CYME Power Engineering software to perform load flow calculations on primary feeders.
The FLAP (feeder load allocation program) is used to develop load forecasts. When larger service loads are planned, this system will incorporate the impact of significant anticipated load additions on the overall forecast.
7.7.10.6 - Duke Energy Ohio
Planning
Load Relief
People
Distribution planning, including identifying areas requiring load relief in the network underground system, is performed by the planning department.
Duke Energy Ohio has assigned an engineer within the planning group to focus on the network. Note that this department also deals with substation and overhead distribution planning.
The engineer, who focuses on network planning, is a four year degreed engineer. This engineer works very closely with the Distribution Design (customer project) department and the Construction and Maintenance department to plan the network.
Process
Duke Energy Ohio’s network system is designed to n-1. That is, the system is designed to ride through the failure of any one component during a system peak.
In performing planning, the planning engineer takes load information and adds it to a spreadsheet that tracks loading by secondary grid, by customer service location, and by secondary bus. Information about new load additions comes to the planning engineer from various sources. Most of the time, information about new load additions comes from the customer project organization. Sometimes the planning engineer is informed about a particular project through participation in an early planning meeting, or through a fault current request.
The planning engineer will look at the loading trend over the past five years and compare the present conditions to the peak loading conditions over the past five years. Generic primary cable ratings are used in determining the available capacity. Through this analysis, the planning engineer will identify improvement opportunities in the system to meet anticipated loads and to address areas that may be overloaded.
Technology
Duke Energy Ohio is using SKM PowerTools up as a planning tool for the network[1] .
The planning engineer has focused recently on bringing this model up to date. The model includes the street grid, including transformers by location, and including transformer sizing and impedance. The model has also been updated to include new cables that Duke has recently changed.
The model also contains updated loading information, including the loading of particular buildings. This loading information comes from several sources. Larger commercial customers have demand meters. Load readings are housed in the Duke energy billing system and for larger customers (over 300 KW) the customer provides a phone line and loading information flows back to the company’s billing system through the phone lines.
The Load modeling system is used to perform “what if” scenarios, to understand the impact of the system in a contingency, and to identify areas for system reinforcement for load relief.
[1]Note that outside the network, Duke is using the SynerGEE system analysis product.
7.7.10.7 - Energex
Planning
Load Relief
People
Planning is performed by the Network Capital Strategy and Planning Group, part of the Asset Management organization. The Network Capital Strategy and Planning Group is led by a group manager.
Process
The planning process includes a five-year rolling look at the system that includes an annual analysis of anticipated demands on every circuit, substation and substation transformer. Analyses include both normal loading and contingency loading situations. Demand is calculated on every circuit, station, and substation transformer in the Energex system.
When a planning engineer identifies a deficiency, he nominates a project to correct the problem. This nomination involves a high-level description of the work to correct the problem as well as a rough indication of the costs.
7.7.10.8 - ESB Networks
Planning
Load Relief
People
Distribution planning at ESB Networks is performed by planning engineers within the Network Investment groups – one responsible for planning network investments in the North, and the other for planning in the South. Organizationally, the Network Investment groups, both north and south, are part of the Asset Investment organization. In addition to the Network Investment groups, the Asset Investment organization is also comprised of a Generation Investment group and a Specifications group, each led by a manager. The Asset Investment group is part of Asset Management.
Planning is performed by one HV planner and four MV planners. Most of these individuals are degreed engineers, but some are “Technologists” who have developed their expertise through field experience.
Planning standards and criteria are developed jointly between the Asset Investment group and the Strategy group, which is part of the Finance and Regulation group within Asset Management.
Process
Planners engineer the system to N-1, with most supplies having a “forward feed” (preferred) and a “standby feed” (reserve). The planning criteria for MV distribution requires customer voltages to remain at +/- 5% of nominal in normal situations, and +/- 10% of nominal in a standby (contingency) situations. Planning criteria also call for long-term cyclical overloads of no more than from 125-150 percent of rating for equipment, with a short-term loading of no more than 150-180 percent.
At the time of the practices immersion, ESB Networks has a program underway to convert their 10-kV distribution system to 20 kV. This conversion effort is underway outside of Dublin where the benefits of conversion are more readily realized. Note that the MV primary system serving the city of Dublin is operated at 10 kV.
Technology
For performing MV (10 and 20 kV) and for some 38-kV circuit studies, ESB Networks is using SynerGEE (GL Group). The company has tied this tool to its GIS database. For HV analyses (38 kV and 110 kV), ESB Networks is utilizing PSS® Sincal from Siemens.
7.7.10.9 - Georgia Power
Planning
Load Relief
People
Distribution Planners are responsible for loading of both distribution and network primary feeders, and work closely with the network Area Planners. Area Planners are responsible for planning upgrades of substations on the urban networks, while the Distribution Planners are responsible for planning upgrades of the primary feeders, including modifications for circuit load relief. The two groups work closely together. Both groups – Area Planners and Distribution Planners – work with the Network Underground design engineers during the design phase.
Planning of upgrades to the secondary grid is done by principal engineers in the Network Underground department.
Process
Although Area Planners are not responsible for the network loading, they are responsible for the load on the transformers. Therefore, the Area Planners must know the configuration and cable load of the entire urban network. Area Planners evaluate contingency reserve capacity to maintain N-1 reliability of the network. For example, if Georgia Power has three transformers at a substation, and one of the transformers supplies the Network, then one of the responsibilities of an Area Planner is to insure that if the Network Bank fails, for whatever reason, the other two transformers have enough reserve capacity to pick up the full load of the failed network bank. This guarantees a high level of customer reliability. As a result of this strategy, network substations are sized accordingly, so that they have enough capacity to handle any network segment with only two transformers regardless of the peak load.
The network planning process involves running load flows to compare system loading to the feeder ratings and to evaluate the implications to the system of anticipated new forecasted loading. Network planning is based on a peak load analysis, recognizing that the peak is only representative of loading for a few days each year. In developing the load forecast, engineers will consider known projects, estimated future load additions from areas under development, such as downtown Savannah and Buckhead, and general growth rates. Engineers will also temperature adjust their load forecast based on previous historical data of high-peak temperatures, averaged over a number of years. Area Planners look four years ahead, forecasting the need for more capacity based on impending projects and demographic demands, such as the newly planned baseball stadium in Atlanta.
Area Planners trigger network planning changes based on the data they have, including the aforementioned load forecasts. In addition, Area Planners meet with senior engineers, marketing, and distribution engineers, every five to six months. The group examines proposed customer projects that are in the pipeline and determines whether the projects will be distribution (radial) based or network-based. The frequency of the meetings is a direct result of the number of projected projects and the likelihood they will come to completion.
Technology
Georgia Power has recently acquired CYMDIST to model the entire secondary and primary grid (See Figure 1). The program is designed for planning studies and simulating the behavior of electrical distribution networks under different operating conditions and scenarios. It includes several built-in functions that are required for distribution network planning, operation and analysis. The model Georgia Power has developed is extremely accurate including cable systems, cable ratings, cable capacities and specifications. The Area Planner keeps detailed spreadsheets, continually updated, on upcoming and ongoing projects. The Georgia Power GIS system also tracks network statistics, so that if a particular network segment reaches a threshold, it is tagged for analysis by the Area Planner and Network design groups. Typically Georgia Power prefers to keep capacities in the 70 to 90 percent range, and any transformer or network segment exceeding 90 percent is prioritized and tagged for the Area Planner and engineering for more capacity.

Figure 1:
CYMDIST 7 Distribution Network simulation software with Network Editor
7.7.10.10 - HECO - The Hawaiian Electric Company
Planning
Load Relief
People
The Distribution Planning Division performs annual studies of primary feeder loading to anticipate areas of overload and recommend remediation. These annual studies apply to both the network and non- network feeders.
The Distribution Planning Division is part of the System Integration Department. This group performs all distribution planning at 46kV and below.
Process
For radial underground distribution feeders, HECO annually compares the most recent historical peak distribution feeder loads against forecasted loads. Because HECO has limited application of SCADA, feeder loading forecasts are developed by apportioning the monitored substation loading over the feeders based on periodic feeder loading measurements called “Tong Tests”. Tong Tests are amp readings taken on each feeder four times per year – one winter, one summer, one day and one night measurement. These measures are used to forecast and model the feeder loading for analysis.
From this analysis, HECO identifies feeders / feeder sections where the forecasted load is projected to overload the feeder. It is from this analysis that HECO identifies load relief projects.
HECO aims to relieve all anticipated primary cable overloads through their planning process.
Technology
HECO historically has not used a load flow software product to aid them in distribution planning. They gather and record feeder loading and transformer loading information using an EXCEL spreadsheet. Load flows for contingency analysis are calculated manually.
HECO is in the process of installing SynerGEE, a load flow software product from GL Industrial Services. This product will interface with HECO’s GIS system and be able to import up to date circuit models. This software will facilitate their ability to perform contingency analysis. They are targeting year end (2009) for implementation of this software.
7.7.10.11 - National Grid
Planning
Load Relief
People
A key focus of the Distribution Planning organization is identifying areas requiring load relief in the network underground system.
At National Grid, network planning is performed by the Distribution Planning Organization, led by a Director. Organizationally, the Distribution Planning Organization is part of Distribution Asset Management, and is comprised of resources in both a central location (Waltham Massachusetts), and distributed throughout National Grid (Field Engineers).
Centrally located resources include Capacity Planning resources who reporting to a manager, and engineering personnel, who have broad system planning and engineering responsibilities, Regionally located resources include Field Engineers who report to managers of Field Engineering for both New York and New England, About two thirds of the Distribution Planning organization is centralized, with the remaining third decentralized.
In general, short term planning activity (current year), including the identification of areas requiring load relief, is led by the field engineers located in the various regions. Longer term analyses (future years) is led by the central planners
The planning engineers who focus on the Albany network include a field engineer who works in the Albany office and focuses primarily on both radial and network underground systems for National Grid’s New York Eastern division, and an engineer situated in Waltham, who has network engineering responsibilities across the system. These engineers have responsibility for both network planning, including load relief, and network design.
National Grid has up-to-date standards and guidelines for the network infrastructure. In addition they have up-to-date planning criteria that address network planning.
Process
The planning process involves running load flows of distribution system models to compare present and anticipated loading to the feeder ratings and to evaluate the implications to the system. Planning engineers use 15 minute interval load information from SCADA as well as information from National Grid’s customer information system to develop distribution feeder models. Customers / customer load are assigned to certain network busses to model the system. Engineers model the system at peak load, at 90% of peak load, and in the n-1 and n-2 contingency situations. Peak load forecasts are developed for each feeder from overall system load forecasts. Overall, National Grid New York is experiencing about a one percent load growth, though the load growth in the network has been rather flat. Both commercial and industrial loading is declining with residential loading increasing at about two percent annually. The annual load factor is declining.
Distribution planning analysis includes analysis of both potential thermal overloads, requiring load relief, and voltage issues.
The network in Albany is summer peaking. Typically, planning studies for the network are performed in the spring and may project anticipated system loading multiple years in the future. In addition, the analysis may also include a fault current analysis to understand the ability of the system to properly clear faults. Note that while modeling and analysis for non network feeders occurs annually at National Grid, modeling and analysis of network feeders is not performed every year, and typically involves a multiple year projection of loading.
National Grid’s process for reinforcing system is that after performing the analysis planning engineers recommend capital improvements to the system. Major capital improvements, in excess of $1 million, flow to a distribution capital investment group, an internal committee that reviews and approves funding for major investments. Capital expansions under $1 million follow an internal National Grid level of signature authorization (LOSA) procedure.
Technology
National Grid planning engineers use the PSSE power flow product to model and perform power flow analysis of the network system, and use a product called Aspen to perform fault analysis. (The Aspen product is also used by the System Protection group at National Grid.)
Note that the PSSE power flow product provides steady-state analysis. It cannot model network protectors (for example, back feed through the protectors).
In non-network areas, National Grid uses CymDist as a modeling tool, which has been integrated with their GIS system. National Grid has not applied this to the network system, as their GIS system does not model a meshed system.
7.7.10.12 - PG&E
Planning
Load Relief
People
A key focus of the network planning engineer is identifying areas requiring load relief in the network underground system.
Network planning is performed by the Planning and Reliability Department. This department is led by a Principal Engineer, who is also the department supervisor. This group does distribution planning for both network and non-network systems. There are eight engineers that comprise this department. Six focus on the radial system, and two focus on the network system.
For network systems, the two planning engineers are responsible for distribution planning. Both network planning engineers are four year degreed engineers.
The planning engineers are represented by a collective bargaining agreement (Engineers and Scientists of California).
Process
PG&E’s network system is designed to n-1. That is, the system is designed to ride through the failure of any one component during a system peak, with only minor overloads to transformers, primary feeders and secondary mains during peak periods.
The planning process involves running load flows to compare system loading to the feeder ratings and to evaluate the implications to the system of anticipated new loading. Network planning is based on a peak load analysis, recognizing that the peak is only representative of loading for a few days each year. Planning engineers obtain monthly peak loads from the SCADA historian[1] and compare this to feeder ratings to identify locations that potentially overloaded. Engineers may enter the SCADA readings into the load flow model and recalculate to see if there are any overloads. Alternately, they may simply compare the monthly peak values to previous peak load readings and circuit ratings. Also, planning engineers will ascertain the validity of any projected new load estimates, and run load flows to understand the implications of the added load.
Designing for the peak provides conservatism to the planning process. Planning engineers report that actual loading is always lower than the loading projected by their load flow models, as these models are based on peak values and do not account for load diversity.
The planning process is used to identify areas requiring load relief. If the calculated circuit loading exceeds 110% of the either the circuit’s normal or emergency capacity ratings, the planning engineer will consider the circuit to be overloaded and recommend design changes to ameliorate the condition. PG&E uses the 110% level based on the fact that their load flow model uses all peak load values and thus doesn’t account for diversity. So, rather than reacting to modeled loads over the 100% rated values of circuits, they add the additional 10% since they know their models are conservative. They do this analysis for both base case and for contingency situations. (Six different contingency models are run, one for each primary feeder supplying a network).
Through this analysis, the planning engineer will identify improvement opportunities in the system to meet anticipated loads and to address areas that may be overloaded.
Technology
PG&E uses the EasyPower load flow product from ESA to model their network system. This model is manually populated and maintained by the Planning engineer. The planning engineer reports being satisfied with this planning tool.
Note that PG&E is presently implementing the CMEDIST (by CYME) load flow product for performing analysis of their radial system. In a subsequent phase of their project, they plan to implement the use of CYMEDIST as their network planning tool as well. A challenge for them will be the conversion of data from EasyPower to CYMEDIST.
[1] PG&E’s SCADA provides three phase amp readings on all network feeders. Also, they have the ability to monitor loading on all network transformers through CT monitoring installed on the transformer secondary (at the NP). This information is housed in the PG&E SCADA Historian.
7.7.10.13 - SCL - Seattle City Light
Planning
Load Relief
People
Organization
Network Planning at Seattle City Light is performed by the Network Design Department, which is part of Energy Delivery Engineering. See Attachment A. The Network Design Department focuses exclusively on the planning and design of SCL’s networks.
Although SCL does have a separate planning group that performs distribution planning activities for SCL’s non-network distribution system, this group does not do the planning associated with the network. All cable ratings, load flow and voltage studies, master load flow analysis, assignment of feeders to load additions, area studies, etc. associated with the network are performed by the Network Design Department staff. (Note that SCL is currently implementing an Asset Management organization. At the time of this writing, SCL had not yet decided whether certain tasks currently performed by the Network Engineering group will be moved into the Asset Management organization.)
The Network Design Department is made up of a System Group (eight engineers) and a Services Group (eight engineers). These engineers do all of the planning and engineering for the network (the System Group), as well as interface with network customers for load additions, new loads, etc. (the Services Group). The individuals in this group are four-year degreed engineers. The senior level engineer position at SCL requires a PE license. The engineers at SCL are represented by a collective bargaining agreement (IBEW).
Culture
The Network Engineering group has a close working relationship with the Civil and Electrical construction and maintenance groups within the Area Field Operations – Network Department and the Distribution Operations Department. EPRI observed high levels of mutual respect between these groups, and high confidence by the field organizations in the planning and design decisions made by the Network Design Department.
SCL has remained committed to the network engineering department staffing levels, hiring new engineers into the network area to fill vacancies. SCL has no formal training program for network engineers. However, network engineers are sent to special classes on network equipment, etc. as part of their ongoing development.
Process
SCL conducts a master load flow analysis twice per year using “extracts” from their monitored loading data after the summer and winter of each year. This master load flow analysis is performed on all network feeders. The analysis is performed by the Load Flow Engineer within the Network Design Department. This process is one of the drivers of reconductoring projects.
(Note: many feeders are analyzed more than twice per year because of load increases – see feeder assignment process discussion in next paragraph.)
SCL also performs a feeder load analysis as part of their Feeder Assignment process in response to anticipated new load. The term “Feeder Assignment” means determining which feeder or feeders will serve a new network load. A Network Services engineer requests the feeder assignment based on a new or supplemental load need. The System Engineer within the Network Design department performs an analysis to determine the best scenario for serving the new load. This analysis includes ensuring that the network design criteria are met, and that any feeder imbalance is restricted to less than 20%. (Note that about 80% of new load is served as a spot network, rather than tapping the existing network secondary.) See Attachment B.
When SCL performs a load flow analysis, they start off with the worst case (no accounting for diversity). They then re-run the case after applying a diversity factor.
Technology
Load Flow and Voltage Drop
SCL uses a load flow and voltage drop analysis software package developed in house (legacy software). The software is nodal but not graphical. To perform load flows and voltage analyses, SCL engineers can call up a feeder, enter the changes, and solve the case. The output report is tabular, not graphic. The output indicates the load flow and voltage at each node.
7.7.10.14 - Survey Results
Survey Results
Planning
Load Relief
Survey Questions taken from 2012 survey results - Planning
Question 3.17 : If you are using load flow software, please indicate which software product(s) you are using.

Survey Questions taken from 2009 survey results - Planning
Question 3.14 : If you are using load flow software, please indicate which software product(s) you are using. (This question is 3.17 in the 2012 survey)

7.7.11 - Network Planning
7.7.11.1 - AEP - Ohio
Planning
Network Planning
(Distribution Network Planning / Planning Criteria)
People
Planning for the areas of this urban underground network immersion study, AEP Columbus and Canton, Ohio, is performed in Columbus by the AEP Network Engineering group, which is organizationally part of the AEP parent company. The company employs two Principal Engineers and one Associate Engineer to perform network underground planning for the Columbus and Canton urban underground networks. These planners are geographically based in downtown Columbus at its AEP Riverside offices. While the Columbus-based Network Engineers are responsible for network planning for all of Columbus and Canton, they work closely with distribution planners in the AEP Ohio system, such as Gahanna. The Network Engineering group reports to the AEP Network Engineering Supervisor, who in turn reports Distribution Systems Planning Manager. Distribution Systems Planning reports to the Director of Engineering Services who in turn reports to the AEP Vice President of Customer Services, Marketing and Distribution Services.
AEP also has a Network Standards Committee, headed by the lead Network Engineering Supervisor in its downtown Columbus offices, and comprised of representatives from all AEP operating companies. This group works closely with the parent company’s Distribution Services organizations, and holds regular teleconference sessions on network findings, “lessons learned” in the field, and discusses potential network engineering solutions to common network planning and implementation issues.
The AEP Network Engineering group oversees the distribution and network planning for Columbus and Canton, Ohio. In Columbus, AEP maintains N-2 reliability, including the substation, grid networks, and spot networks. This N-2 reliability is notable, as most urban underground network systems operate at an N-1 level. N-2 resiliency means that the system is planned to be able to carry peak load even with the loss of any two components. For example, N-2 insures that if any two transformers go down, additional transformation is available for picking up the network load and maintaining service. At spot network locations in Columbus, AEP uses a minimum of three transformers sized so that anyone can carry the load in the building in the event of the loss of the other two. Substations supplying the network utilize a ring bus design, and consist of three transformers, with one used as a ready reserve hot spare unit.
The Columbus Network Engineering group is responsible for analyzing the loading of both distribution and network primary feeders, and therefore works closely with the AEP Network Engineering Supervisor and the Distribution Systems Planning group who are responsible for distribution planning for the entire AEP system and its operating centers. Planning of upgrades to the secondary grid is also performed by the Network Engineering group in close collaboration with the AEP Network Engineering Supervisor and the parent company. The group oversees the planning of new customer service, rehabilitation of network systems, and relocation of any network service.
Process
Network Engineers must know the configuration and system loading of the entire urban network to provide N-2 reliability. For example, when achieving N-2 reliability, it is one of the responsibilities of Network Engineers to insure that networks be provided three or more independent transmission sources. Each high voltage transmission line should follow an independent route and originate from separate remote sources. As a result of this strategy, network substations are sized accordingly, so that they have enough capacity to handle any network segment regardless of the peak load and N-2 contingencies. All substations have at least three transformers; any one transformer can carry the network load if two go out.
The network planning process involves running load flows to compare system loading to the feeder ratings and to evaluate the implications to the system of anticipated new forecasted loading. AEP Distribution uses CYME and its SNA (secondary grid network analysis) module for initial network load analysis for the AEP Ohio group. Network planning by AEP Ohio in Columbus and Canton is then based on CYME SNA data and local peak load analysis. Local peaks are derived from monthly meter records in its Columbus-Canton service areas. Engineers use algorithms to calculate peak kilowatts (demand) from captured kilowatt hour meter data and populate spreadsheets accordingly. Each engineer in the planning process reviews this load information regularly for any increased loads and adjusts the load flow accordingly. Engineers also have access to larger customer load information in the downtown area. For timelier and even more accurate load information, the AEP Ohio Network Engineering group is considering the use of smart meters in the downtown Columbus area for assistance in performing real-time load analysis.
A separate system, maintained by the AEP distribution planning group, provides the local Network Engineering group with timely information on circuit based load forecasts, including specific anticipated loads that will be added to the AEP Ohio network underground area. Forecasts are amended based on the actual metering algorithm information and load forecasts for new projects and anticipated new service, such as new public and private building and construction in the urban areas. Using this data on circuits and local load information, the Network Engineering group can model projected circuit loading for its Columbus and Canton systems.
AEP Ohio distribution networks are designed to be served by up to six network feeders from a single network station. The feeders must come from at least three secondary voltage buses, with no more than two network feeders per bus (see Figure 1). The substation secondary voltage buses are connected in a complete ring with closed tie circuit breakers between all buses. Multiple station transformers are connected so that a minimum of two transformers operate in parallel during normal operation. Circuit breakers are then used to automatically remove any faulted bus sections from service without impacting normal operations. This provides N-2 service to all existing customers in the downtown region. All stations have a minimum of three transformers, with some having as many as five or six.

Figure 1:
Network Substation - Ring Bus Design with hot spare
AEP Ohio is not actively focused in either increasing or decreasing the size of its networks. Demand for network service remains steady, yet some newer customers have opted for radial distribution to cut their costs.
The Columbus urban area has four separate networks – North, South, Vine, and West – supplied from three substations. Each network is supplied from 138 kV/13.8 kV Δ -Y network transformers. All four networks are served by six feeders at 13.8 kV – each group of six originating from a single substation. There is no overlap in these networks. Each is built to N-2 reliability. In Columbus, the Vine network primarily serves spot networks in a high-rise area of downtown (Vine Station), with some mini-grids at 480 V. The other three networks (North, South, and West) serve a mix of grid (216 V) and spot loads. Canton has one network supplied at 23 kV.
Technology
The AEP Network Engineering group performs load flow analysis and other secondary network analysis data using the CYME® Secondary Grid Network Analysis (SNA) software system. The AEP Ohio Network Engineering group also uses kW-per-hour data captured through remote meters and uses sophisticated algorithms and analysis to convert this data to report peak loads on the network. With this captured data and the CYME analysis, AEP Ohio Network Engineers have a solid basis for distribution/network planning.
7.7.11.2 - Ameren Missouri
Planning
Network Planning
People
Resources in several groups perform distribution planning of the network at Ameren Missouri.
Area planning for the distribution system is the responsibility of Distribution Planning and Asset Performance. This group, led by a manager, is staffed with four-year degreed engineers, and includes the Standards Group as well as a Planning Engineering Group. Organizationally, Distribution Planning and Asset Performance is part of Energy Delivery Technical Services, reporting to a vice president.
Local distribution planning of both the network and non-network underground infrastructure in St. Louis is the responsibility of the engineering group within the Underground Division. This division is led by manager, and consists of both engineering and construction resources responsible for the downtown infrastructure. The engineering group is led by supervising engineer, and is comprised of Engineers and Energy Services Consultants (commonly referred to as Estimators) who deal with planning, design, and service issues. The engineers are four-year degree positions. Energy Services Consultants have a combination of years of experience and formal education, including two year and four year degrees. The engineers are nonunion employees; the estimators are in the union. Organizationally, the Underground Division is part of Energy Delivery Distribution Services, reporting to a VP.
Finally, Ameren Missouri has formed the “Underground Revitalization Department,” a team of engineers (all 4-yr degreed) focused on researching, evaluating, and developing plans for performing capital improvements to and revitalizing downtown St. Louis, including the network. Part of this group’s role includes addressing issues such as the development and update of planning criteria for the network. At the time of the practices immersion, the revitalization team had developed a series of planning criteria documents, including criteria for loading, route diversity, sectionalizing, and application of automation. In addition, they had developed recommended requirements for cable replacement, and conduit system design and replacement. Organizationally, the Underground Revitalization Department is part of the Underground Division.
Process
Ameren Missouri’s St. Louis service territory contains four individual secondary network grids, each sourced by separate substation. Three of the substations are sourced by overhead transmission at 138KV, and one station is fed at 35 kV. Each substation uses a ring bus design. Note that one of the substations is older and out of phase with the other three. Ameren Missouri intends to retire this station and has proposed a plan to build a new substation in a different location.
The four individual secondary network grids are 216 / 125V grids, each served from one of the four substations. Two of the network grids are fed by eight feeders at 13.8 KV, one is fed by seven feeders at 13.8 KV, and one is fed by six feeders at 13.8 K. Ameren Missouri runs only dedicated network feeders; that is, they do not mix radial primary circuits and network primary circuits.
Each of the networks is designed to N-1[1] . However, Ameren Missouri plans for a substation bus outage and, if they lose any one bus, they may lose two feeders supplying a given network. The system is designed to handle this particular contingency – an N-2 situation. The four networks are loaded as follows: 1 at 17 MVA, one at 16 MVA, 1 at 30 MVA, and 1 at 22 MVA.
Ameren Missouri does serve customers via spot networks, most at 277/480V.
Much of the in-service primary cable is PILC. PILC cable was used as the standard up until the late 80s, when Ameren Missouri switched to EPR insulated cables as its current standard.
Ameren Missouri has considerable clay tile ducts installed. These are smaller ducts and many are crumbling. A noteworthy practice implemented by Ameren Missouri was the development of a thinner wall EPR insulated cable, which enables them to take advantage of the existing smaller ducts system (see cable design). Ameren Missouri’s current standard is PVC.
Until the recent economic downturn, St. Louis enjoyed healthy growth rate. Since the downturn, however, load growth has been stagnant, and load on the secondary network system declining. However, Ameren Missouri has seen some modest residential growth in old buildings in the downtown area that are being converted to lofts.
Ameren Missouri customers in the network are charged standard residential rates, consistent with the rates charged to radial customers. Note that a significant number of downtown customers take primary metered service from Ameren Missouri, supplied by a preferred and reserve (alternate) feeder. Ameren Missouri’s primary metered rate is, of course, different than their secondary metered rate.
Customers who request smaller 208V services will usually be connected to the secondary network grid. Customers who request 480 V service or larger 208 V services will normally receive either a pad mounted transformer installation or an indoor substation, supplied by two radial feeders. Padmounted services are usually not practical in the congested parts of downtown St. Louis. Thus, the most common design type for larger loads in downtown St. Louis is via an indoor substation.
The indoor substation (also called “Indoor Room”) typically consists of a preferred and reserve feeder with a tie switch between the two. Note that while Ameren Missouri does serve existing customers via 480V spot networks, new loads are not supplied by a spot network.
In a primary metered service to an indoor room, Ameren Missouri provides two primary supplies coming into the customer. These feed into switches, either fuses or breakers, as chosen by the customer, and can be manually or automatically (auto transfer) operated. After the breakers, the lines feed into the primary metering gear, and then onto the customer’s switchgear or transformation. Note that all equipment, except cable and meters, are owned by the customer, including the primary switches that precede the primary metering point.
In a secondary metered situation, Ameren Missouri provides the switches and transformation that precede the metering point. Ameren Missouri would provide either a preferred and reserve feeder, or a two preferred feeder design.
Customers do not pay additional fees for reserved capacity. Ameren Missouri assures there is adequate reserve capacity through its contingency planning process.
The planning process involves running load flows to compare system loading to the feeder ratings and to evaluate the implications to the system of anticipated new forecasted loading. Network planning is based on a peak load analysis, recognizing that the peak is only representative of loading for a few days each year. In developing the load forecast, engineers will consider known projects, estimated future load additions from vacant lots to be developed, and general growth rates. Engineers will also temperature adjust their load forecast based on an algorithm developed by corporate engineering.
Engineers model the system, and perform analyses to understand anticipated requirements. For network feeders, planning engineers perform contingency studies, modeling networks with each primary feeder out of service to identify areas of needed reinforcement to supply the network in a contingency. For radial feeders, planning engineers perform contingency studies (N-1 planning) to assure they can pick up customers with reserve feeders within the emergency ratings of the transformer and cables. More specifically, they model the distribution system with one feeder out of service, simulating customers connecting to reserve feeders. From this analysis, planning engineers determine where reinforcement is necessary to be able to reliably serve customers in a contingency situation.
Technology
Ameren Missouri uses the DEW load flow product to model their network system. For networks, this model is manually populated and maintained by the planning engineers. The model includes a graphic representation of the primary, secondary, and network unit. For example, when modeling the feeder out of service, DEW will model all the protectors opening. Note that at the time of the practices immersion, Ameren Missouri has assembled a list of enhancements they desire to the DEW product.
For radial circuits, DEW imports information and attributes from Ameren Missouri’s GIS system, and imports load information from a transformer load management (TLM) system.
[1] Note that at the time of the immersion, Ameren Missouri had drafted planning criteria that includes an N-2 design for the grid network primary feeders, and N-1 design for spot networks, and an N-1 design for radial feeders. This draft has not yet been adopted by Ameren Missouri.
7.7.11.3 - CEI - The Illuminating Company
Planning
Network Planning
(Distribution Network Planning / Planning Criteria)
People
Network Planning at CEI is performed by the Planning and Protection Section of the Engineering Services Department (CEI Planning Group). The group is part of the CEI Engineering Services department, and is led by a supervisor who reports to the Engineering Manager. The group is responsible for all distribution planning and protection, from 36kV and below. The CEI Planning Group is comprised of 4 Planners and 3 Protection Engineers. All members of the group are four year degreed engineers. The Planning Supervisor noted that he prefers candidates for the CEI Planning Group to have their Professional Engineer (PE) license, but this is not a requirement.
At any one time, the CEI Planning Group may have two or three “rotational” employees working in the department for a six month period. The FirstEnergy rotational program for engineers places newer engineering employees in four different locations and assignments for six months each over a 2 year period. Rotational engineers are part of the FirstEnergy corporate organization and are placed in rotational assignments of varying types across the FirstEnergy system. At the conclusion of their rotational assignments, employees are placed in permanent positions that match their interests and aptitudes with the Company’s needs. The CEI Planning Group Supervisor noted that this program has enabled him to identify strong candidates for his group, and to expose and train all rotational employees assigned to his department in planning and protection practices.
FirstEnergy also has a corporate Distribution Planning and Protection organization responsible for providing governance and standardization to regional planning and protection groups. This group has recently produced a company wide Distribution System Planning Criteria Document.
Process
CEI’s aim is to not increase the load on the existing secondary network system; however they will add small loads to the network if conditions warrant. The addition of these loads is not a concern as the network is lightly loaded due to loss of business in the downtown Cleveland area. Their rationale for not continuing to load the network is a concern over the condition and capacity of the secondary cables. The Planning and Protection Section Supervisor noted that they have removed some “easy to remove” load from the perimeter of the network.
CEI’s standard network planning is n-1; that is, they plan the network system such that all the system components, including primary feeders, secondary cable mains and taps, and transformers are sized to be able to carry the load within “specified thermal and voltage limits” during peak conditions when any single network feeder is out of service.
Regional Engineering Services is responsible to review new service load additions of 100kW or greater to assure that secondary cable sections and network transformation are sufficient during both normal and contingency situations.
Because FirstEnergy companies operate underground systems that developed independently before they were a part of FirstEnergy, their designs reflect different planning, design and operating philosophies. FirstEnergy has recently produced a company - wide criteria Distribution System Planning Criteria document. (See Attachment 1 ). This document is applicable to CEI’s conventional distribution underground systems (13.2 and 4.3 KV), but not to their network system or their 11 kV sub-transmission system. The Criteria document presents planning topics briefly, and can be used as a handy guide for planning engineers. CEI plans to add sections to this Planning Criteria document, including a section on secondary network system planning.
One engineer speculated that were they to rebuild the service to the downtown today, they would likely not use a secondary network system, but rather, an alternative such as a primary network with auto throw-over switches to provide n-1.
Technology
For Network analysis, CEI utilizes a load flow product called PSLF – Positive Sequence Load Flow Software, by GE Energy.
For performing short circuit calculations, CEI is utilizing the CAPE software from Electrocon International.
Note that FirstEnergy is in the process if installing CYME load flow software. They ultimately intend to apply CYME to network analysis; however, its functionality in this area is still being evaluated.
7.7.11.4 - CenterPoint Energy
Planning
Network Planning
(Distribution Network Planning / Planning Criteria)
People
At CenterPoint, Distribution Planning, including network planning, is performed by the Electric Distribution Planning department (Planning group). Organizationally, this group is part of the Distribution Engineering Electric Distribution Engineering group. Note that the Planning group is not part of the Major Underground group, but assigns resources to support Major Underground.
The Planning group is not centralized. Rather, the Planning group assigns planning resources to individual regions and to support departments, such as Major Projects, or URD Design, so that the planners are physically close to the other groups they work with.
The Planning group is comprised of 21 total resources, including 2 Lead Engineers. Each of the Lead engineers has about 6 - 8 people reporting to them. These people are either 4 year degreed engineers, or technical experts. CenterPoint aims to have a balance between Engineers and Technicians. The department manager noted that the Planning group positions are often entry level engineering positions, and these engineers end up leaving the department for other opportunities.
In addition the Planning group has a Lead Engineer Specialist, who leads a computer support group comprised of 6 resources. These folks work with systems such as CymE, Microstation, LD Pro, etc.
CenterPoint estimates that about 1.5 full time equivalent resources focus on planning work for the Major Underground Group. One planning resource, an Engineering Specialist, is assigned full time to work in Major Underground. He is a “matrix” employee, with a dotted line reporting relationship to Major Underground. CenterPoint believes that positioning an individual into the Major Underground group has led to efficient communications, and strong working relationships. This individual is the “eyes and ears” for the Planning group in Major Underground. He does the bulk of the planning work in the “dedicated [1] ” underground system, and works closely with the Major Underground engineers to perform network system analyses.
CenterPoint encourages its engineers to obtain their PE license. The PE license is required to become a Senior Engineer.
Process
CenterPoint uses both 12kV and 35 kV as primary distribution voltages. CenterPoint began converting parts of its system to 35 kV in the early 1970’s in anticipation of significant load growth.
The decision of whether to build infrastructure at 12 or 35kV in a given area is based on economics. In general, 35kV distribution is built into areas of medium to high load growth. 12kV distribution is used in areas of stable load growth, and at locations close to the Gulf, which are more susceptible to contamination. In areas of stable load growth, CenterPoint has no plans to convert their 12kV system to 35kV.
CenterPoint is not planning to expand the 12kV system in downtown Houston area. However, they will serve smaller loads (<1500kVA) on the 12kV system where appropriate.
CenterPoint’s standard service is a radial service. In dedicated underground areas they will typically run a main feeder and an emergency feeder with either a manual or automatic throw over tie. Large loads sometimes require splitting load between two feeders.
CenterPoint avoids using 35kV distribution in Galveston and in other points close to the water because of concerns over contamination due to salt water. Contaminated 35KV distribution is more susceptible to flashover than is 12kV, without making costly design and equipment changes. (Increased distances, dead front equipment, etc) Consequently, CenterPoint had decided to standardize on 12kV distribution in these areas.
The network system (120/208 grid) is supplied at 12kV. Spot networks are also supplied at 12kV. Radial loads are supplied at either 12 or 35kV. Most new large loads are served on the 35kV system, with a main feeder and an emergency feeder.
CenterPoint has five 208V networks served by 6-9 12kV feeders each, sourced from three substations. CenterPoint also supplies spot networks in Galveston, fed from two area substations.
The protection scheme for all totally underground circuits at both 12 and 35kV is a single shot to lock out.
Technology
CenterPoint is using the CymE Power Systems Analysis Framework (PSA) software suite. CenterPoint has recently implemented the CymE network modeling module. CenterPoint engineers noted that much of the work they do involves custom modeling to analyze the economics of various options. See Circuit Modeling for more information.
[1] The term “dedicated” underground at CenterPoint refers to three phase infrastructure is located entirely underground in their ducted manhole system. A “dedicated” network feeder does not mean that the feeder serves only a network; rather, it refers to a feeder that is entirely fed underground. In fact, at CenterPoint, feeders that supply the underground network also supply radial load along the way.
7.7.11.5 - Con Edison - Consolidated Edison
Planning
Network Planning
(Distribution Network Planning / Planning Criteria)
Process
Planning for Contingencies
Electric facilities in the borough of Manhattan, by law, must be underground. Also by law, the design criterion is N-2; that is, the system must be able to withstand the failure of any two components during peak periods, without resulting customer outages. Note that the Queens, Brooklyn, and the main sections of the Bronx are also designed to N-2. The rest of the Con Edison system is designed to N-1.
Load Forecasting — Ten-Year Electric Peak Load Forecast Description
Annually, the service area electric peak load forecast is developed for each of the major sectors of the economy, which includes commercial, residential, and governmental. The forecast predicts the maximum summer electric peak demand for the system.
The commercial forecast reflects three generic variables for the short- and long-term outlook: business conditions, economic conditions, and energy prices. The commercial forecast also reflects the impact of short-range construction activities within Con Edison’s service territory. The commercial sector accounts for approximately half of Con Edison’s[1] peak load.
The residential forecast is based on projections of the number of households, number of appliances, household occupancy, and coincident use of appliances. Air conditioning load is the most important contributor to the residential load. The residential sector accounts for about one-third of the Con Edison’s[2] peak load.
The governmental load is derived using information by customer class based on new business activities.
Key Drivers of the Electric Peak Load Forecast:
-
Known Construction Projects Known new projects predominantly include business activities such as planned construction projects or construction already under way. Projects are tracked to capture the effect on the electric peak load.
-
Economy The economic factors used in the forecasting process are the New York City private nonmanufacturing employment metric and the U.S. Gross Domestic Product (GDP). Private nonmanufacturing employment includes all employment except government and manufacturing. GDP is the broadest measure of the economy’s health.
- The economic outlook that underlies Con Edison’s forecast recognizes the service area’s place in the world economy. The forecast assumes that New York City will continue to compete for national and international business throughout the forecast period with the same degree of success that it has had in recent decades.
-
Consumer Behavior
Consumer response to hot weather through air conditioning usage is the main driver of the residential peak load on a hot summer afternoon. Since air conditioning load makes up 75% of the residential peak load, Con Edison captures information on air conditioning usage and number of units through various surveys.
-
Technology Improvements in equipment efficiency are captured for major appliances, such as air conditioners and refrigerators. These improvements are reflected in the electric peak load forecast.
-
Government Large infrastructure projects undertaken by the city, state, or federal governments are included in the peak load forecast.
Temperature Variable (TV) Used in Load Forecasting
What It Is
The temperature variable (TV) is a reference point that Con Edison uses in designing their electric transmission and distribution systems. The TV is used in calculating and forecasting future system loads, taking into account extreme summer weather conditions — sustained high temperatures and humidity over a three-day period — that they would expect to see in the metropolitan New York area in one of every three years.
What It Isn’t
As a reference point, the TV factor is a starting point for preparing for the effects of weather on electric loads, similar to the way in which building codes are starting points for designing and equipping homes and office buildings. It does NOT attempt to calculate or design for the worst weather Con Edison would expect to see in their region, nor does it serve as an “upper limit” design criterion for electric system components. Because Con Edison designs and builds the components of their transmission and distribution systems with significant “margin,” or conservatism, these systems have a great deal of aggregate resiliency. This means that the systems, including the distribution networks, can generally handle temperatures and consequent loads higher than those factored into the TV.
How It’s Calculated
The reference TV for Con Edison’s service area is a factor of 86° using Central Park weather. For Orange & Rockland Utilities (O&R), it is 85° using White Plains weather. In more easily understood terms, a TV factor of 86° is equivalent to a temperature and humidity Heat Index of 105° — an extremely high level at which the National Weather Service advises taking precautions against sunstroke, heat cramps, and heat exhaustion.
Specifically, the summer TV factor is calculated as a weighted average of the highest three-hour temperature (called dry-bulb) and humidity (called wet-bulb) readings each day between 9 AM and 9 PM. (Please note, dry-bulb temperature is the one familiar to most people, being the value used in all media weather pronouncements.) This temperature and humidity data helps determine the discomfort level of Con Edison’s customers, and their associated use of air conditioning.
Since heat “buildup” over a hot spell of a few days’ duration significantly increases air conditioning use and stress on Con Edison’s electric system, the formula for calculating the system TV on a daily basis incorporates three days’ worth of data. The current day’s weather is weighted at 70%, the previous day’s at 20%, and two days before at 10%. A factor of 86° for Con Edison equates to a condition that generally occurs in one of every three years.
How It Has Fared Through History
The TV reference factor has been in use as a planning tool for many years in Con Edison. A Con Edison review of data going back to 1953, when they started keeping relevant records, indicates that the TV factor of 86° or above is achieved approximately in one of every three years.
How Con Edison Compares to the Industry and the Region
Using a TV factor as a reference point is a standard planning practice throughout the utility industry. In fact, Con Edison is more conservative than most. They design to a standard that assumes “worse” and more prolonged weather than many other utilities, government agencies, and regional power pools.
Ten-Year Area Substation and Sub-transmission Feeder Load Relief Programs
Area substation transformer ratings (including breakers, bus, etc.) are calculated by Substation Equipment and Field Engineering. Transmission and Sub-transmission feeder ratings are calculated by Transmission Feeders Engineering.
Area substation transformer ratings and sub-transmission feeder ratings are calculated using appropriate first or second contingency ratings, and the capabilities of the area substations and sub-transmission feeders and load pockets are derived.
This data is then dovetailed with the ten-year independent load forecast, and the area substation load and capability tables are developed. Options are identified for needed load relief, including increased capability, transfer of load and/or peak demand reduction by DSM.
Through an iterative process with regional distribution engineering, the recommended load relief plan is developed and published as the substations and sub-transmission feeder load relief program. This program is a major feed into the five-year capital budget plan.
Network Distribution Feeder Load Relief Programs
Distribution network feeder loads and ratings are calculated in parallel with the substation and sub-transmission feeder program. The most recent historical peak distribution feeder loads are compared against the network model results (using Con Edison’s circuit modeling tool [PVL]), and any differences are reconciled. The ten-year independent load forecast is applied to the feeders – identified significant additions (i.e., specific new business projects) are injected on the feeders that will serve them, and the remaining load growth is apportioned across the remaining feeders. Feeder ratings and the driving contingency conditions are calculated, and the feeder capabilities are developed.
It is from this analysis that Con Edison conceptualizes new load relief projects. Options are identified for needed network feeder load relief, dovetailing with the area substation load relief options discussed above. Through an iterative process between the Regional Distribution Engineering organization and Transmission Planning, the options are reviewed, and a recommended plan is decided upon.
Con Edison aims to relieve all anticipated primary cable overloads (won’t go above 100% loading), as determined by their analyses. Feeder relief is almost considered nondiscretionary for network feeders, because Con Edison does not have the same flexibility to transfer load as they do in the radial (non-network) parts of the system.
Load relief projects are designed between September and December, so that they can be built between January and June, prior to the upcoming summer loading season. Upcoming summer ratings reflect this work and are published.
Network Transformer and Secondary Mains Load Relief Programs
Network transformer and secondary mains relief follows an identical process as primary feeder relief. The same ten-year independent load forecast and the same network models are run. Transformer and main ratings and the driving contingency conditions are calculated, and the capabilities are developed. In addition to this, any transformer with recorded telemetry (Con Edison’s Remote Monitoring System [RMS]) from any historic peak period indicating capability issues are studied and relieved upon confirmation. All options are reviewed by the regional engineering department and once the plan is accepted, the project is issued to and completed by both the construction and construction management groups.
Conduit Size Restriction
One challenge that Con Edison faces is trying to expand capacity given the space limitations of and damage to existing duct bank systems. In some locations, spare ducts may be crushed or blocked. In others, the size of the spares may not be adequate to pull through the necessary cable to meet loading.
For example, in a design where 750 MCM cable is called for, Con Edison may have to consider running double 500’s because the 750 cannot fit in the 4-inch spare conduit.
The Brooklyn Operation Center noted that about 10% of their ducts are crushed. In Manhattan, the number of crushed ducts is significantly higher, at 45 – 50%.
In some cases, Con Edison bifurcates the feeders; that is, breaks the feeder into two sections outside the station in order to adjust to the limited space considerations and add reliability. In this design, Con Edison installs SF 6 switches with fault indication outside the station, protecting each leg of the bifurcated feeder. In a feeder lockout, this enables them to isolate the faulted section and pick up the rest of the load. (See the pictures below)


Technology
Load Flow System – Poly-Voltage Load Flow (PVL)
Con Edison utilizes a distribution load flow application called Poly-Voltage Load Flow (PVL). The PVL application is actually a suite of applications that was developed in house over a 20-year period of continued development. In addition to aiding engineers in performing load flow analyses, the PVL system is used to build feeder and transformer models, develop network transformer ratings, develop network feeder and cable section ratings, model area substation outages, and identify short-circuit duty at customers sites, etc.
To perform load flows, circuit models are brought into PVL from the mapping systems. The secondary system is kept in one mapping (GIS) system (different from location to location), and the primary feeders are kept in another mapping (GIS) system. Con Edison reflects all system changes on its mapping systems. Feeder maps within Manhattan are updated in 24 hours as changes occur. Secondary side maps are not updated as quickly, but are very frequently updated. These GIS systems are maintained by the mapping organization.
When the circuit information is brought into PVL, the new information overlays the existing circuit model already in the system. Once the model is brought into PVL, all users use the same model. When a circuit is brought into PVL, people responsible for model maintenance ensure that the PVL model has electrical connectivity and is in synch with the mapping system.
Load flows are conducted for a variety of reasons:
-
Planning engineers run base case load flows, N-1 cases, and N-2 cases. For each contingency, the PVL output tells you what is overloaded in tabular and graphical formats.
-
Planning engineers use PVL to assist in short-range and long-range planning. For example, the system is used to analyze conceptual projects to split existing networks into smaller networks
-
For new business, engineers run the existing case, and then re-run it with the new business load added to understand the loading and voltage implication of the new load.
-
Region Engineering runs feeder loading studies in advance of the summer to identify anticipated overload conditions.
-
The system is also used to understand the loading implications of different restorations scenarios in an outage.
PVL can use real-time readings from transformer vaults (gathered through Con Edison’s Network Remote Monitoring System [RMS]) for building the network load model. If needed, demands can be spotted at customer service points, using information such as customer kWh consumption and real-time transformer readings.
The PVL system can also perform cable section ratings. The system considers the impacts of soil type and temperature. The system does not automatically consider the proximity of electrical facilities to steam mains.
Operators are able to take advantage of the functionality of PVL through a real-time version known as AutoWOLF, which takes the base model and applies real-time conditions. For example, real-time transformer loading information would populate the model from RMS system. Knowledge of open feeders would populate the model from SCADA. When a circuit locks out, AutoWOLF automatically runs the system peak case, the current case, and the projected peak case, so that that information is available to an operator. The operator can look at the loading on the other feeders and try to determine which feeders to watch.
During emergency conditions, Con Edison assigns engineers assigned to the control room to monitor system loading. During normal conditions, the operators monitor the system themselves.
Con Edison has formed a PVL users group that meets bi monthly to discuss issues associated with the PVL. The PVL Users group is made up of approximately 50 people from both the regions and corporate, including network model maintenance people, designers, supervisors, engineers, engineering managers, and support personnel. Approximately 15 members attend any one meeting.
7.7.11.6 - Duke Energy Florida
Planning
Network Planning
People
Network Planning at Duke Energy Florida is organizationally part of the Power Quality, Reliability, and Integrity Group (PQR&I), which is led by a Director of PQR&I for Duke Energy Florida.
To perform planning work, the Network Planning group divides the Duke Energy Florida territory into four separate zones. The cities of Clearwater and St. Petersburg, part of the South Coastal Region, are included in one of the four zones. Every zone is assigned a Lead Planning Engineer and Senior Planning Engineer, who are responsible for all distribution planning activities within the zone.
Engineers/Planners in these zones work on Reliability as well as Planning. Because Duke Energy Florida has seen minimal capacity demand growth in its urban underground grid, Engineers in the PQR&I group spend much of their time planning reliability and infrastructure upgrades.
All Planners have four-year degrees in Electrical Engineering, a requirement for the position.
Duke Energy Florida has no written planning criteria specific to secondary network systems.
Process
Duke Energy Florida supplies a true low voltage meshed secondary grid system with three primary feeders in Clearwater, as well as spot network locations in both Clearwater and St. Petersburg. In both St. Petersburg and Clearwater, much urban underground infrastructure is designed in a loop scheme using non-network feeders, and automatic transfer switches (ATS) at major customer sites to provide a primary and reserve feeder supply.
Planners use specific criteria to guide enhancements to underground systems to meet anticipated load growth and additions. However, due to the different underground designs used across the service area, there are differing standards depending on location. For example, non-network primary feeders surrounding downtown St. Petersburg and Clearwater are specified to carry no more than 12 MW each, while downtown feeders that supply the networks, or are part of a primary / reserve feeder loop scheme, are designed to carry no more than 6MW. This planning criteria provides reserve capacity in urban areas of Duke Energy Florida to be able to supply N-1 reliability.
Planning Engineers plan and design both network and non-network systems. For example, in Clearwater the network load is low, and demand growth is flat. Therefore, there are no new grid or network expansion plans underway. However, the planning group is active in adding non-network load to the systems in both Clearwater and St. Pete.
Historically, in Clearwater, Duke Energy Florida had added non-network load to three network feeders, creating reliability and operational challenges. Beginning in 2013, the company embarked on a multi-year improvement project to remove non-network loads from three of the primary feeders, with the aim of having these three feeders “dedicated” to supplying the network. Much of the non-network load is being added to the fourth feeder using underground radial designs (URD transformers, for example), which will serve as a radial (non-network) feeder going forward.
In St. Pete, the company removed its downtown network grid years ago, with only spot network locations remaining. Note that in some locations, existing spot network locations are supplied with feeders that are also part of its loop scheme – these locations create some operational challenges with planned feeder outages. Most of downtown St. Petersburg is serviced with a looped feeder scheme using ATS switches. Any new loads are designed with a primary / reserve feeder supply. For St. Petersburg, load limits are 12MW, with 6MW per feeder in the downtown area. Note that downtown St. Petersburg, unlike many other areas in Duke Energy Florida ’ s service territory, is seeing new demand due to high-rise construction.
When there is a call for any new network service in the four zones, Network Planners model the impact of a proposed new load on the network using CYME®. They perform primary load flow modeling, looking at both normal conditions and contingencies.
In Clearwater, Network linemen also have access to real-time secondary load data on network transformers through Sensus® monitoring. Sensus data is checked twice a day — morning and evening. If there are anomalous changes observed at any location, a crew is dispatched to check the limiters on the suspect secondary feeder.
In the case of large load additions, and for longer-term forecasting, planning will utilize a feeder load allocation program (FLAP). Planners input anticipated annual percent load increase expectations, as well as known spot load additions, as this program will return an overall forecast.
Actions to be taken based on anticipated load growth are based on an engineering analysis and are not informed by a written planning criteria. Note that at the time of the immersion, Duke Energy was in the process of consolidating historic Duke Energy and Progress Electric planning approaches into a system planning criteria, expected to be complete mid-2017.
Technology
Network Planners use CYME Power Engineering software to perform load flow calculations on primary feeders.
Duke Energy Florida does not use software to model their network secondary. Rather, they perform real-time monitoring of secondary loading using a Sensus (Telemetrics) remote monitoring system that provides information from the vault, aggregated at the Network Protector relay. Within the Network Group, information such as secondary loading is monitored twice per day.
The FLAP (feeder load allocation program) is used when larger service loads are planned, as this system will incorporate the impact of significant anticipated load additions on the overall forecast.
7.7.11.7 - Duke Energy Ohio
Planning
Network Planning
(Distribution Network Planning / Planning Criteria)
People
Distribution planning for the network underground system is performed by the Distribution Planning Organization. Distribution Planning is part of Duke Energy’s Power Delivery Engineering. Duke has one Distribution Planning organization focused on its Carolina utilities, and one focused on its Midwest utilities, including Duke Energy Ohio. Within the Distribution Planning Midwest organization, one engineer has been assigned the responsibility to focus on Duke Energy Ohio network planning.
The engineer who focuses on network planning is a four year degreed engineer. This engineer works very closely with the engineering department and the Construction & Maintenance department at Dana Avenue to plan the network.
Process
Duke Energy Ohio’s networked system is designed to n-1. That is, the system is designed to ride through the failure of any one component during a system peak, with only minor overloads to transformers, primary feeders and secondary mains during peak periods.
No scheduled outages are allowed during the summer peak load periods. Maintenance work is normally performed between September and May. If scheduled outages are required during the summer months, they are usually scheduled at night or on Saturdays and Sundays.
The downtown network in Cincinnati is fed by two substations each supplying two main street grids. Note that Duke Energy primary feeders are normally 400 MCM conductors. Substation getaway cables are either 650 CU PILC or 750 flat strap EPR cable in the first section, then 400 MCM for the rest of the feeder.
On the primary side, the planning engineer presently has information about the loading on the primary conductors. Every network feeder is monitored, providing amps, power (MW) and VARS back to the EMS system. The EMS data is saved on a PI server. The planning engineer can access the EMS information on his desktop. The planning engineer has access to good historical information on network loading saved on the PI server.
In performing planning, the planning engineer takes customer load information and adds it to a spreadsheet. The spreadsheet is used by the Planning Engineer to build connectivity between customer meters (loads) and the appropriate secondary network bus section. The spreadsheet enables the Planning Engineer to easily modify the data and perform statistical analyses. Information from the spreadsheets is manually loaded into their network planning tool.
Loading information is aggregated by manhole bus and vault for input into the network model. The planning engineer tracks large new load proposals. Information about new load additions comes to the planning engineer from various sources. Most of the time, information about new load additions comes from the customer project organization. Sometimes the planning engineer is informed about a particular project through participation in an early planning meeting, or through a fault current request.
The load on the network has been flat over the past five years. The planning engineer selects the highest peak for each grid for the last five years and adjusts the model load to meet this peak value. Through this analysis, the planning engineer will identify improvement opportunities in the system to meet anticipated loads. The planning engineer noted that he does not believe that the network and buildings within the network respond to weather the way other loads outside the network do. (Once summer conditions arrive, the load remains proportionally higher than on other areas even with changes in temperature.)
Technology
Duke Energy Ohio is using SKM Power Tools as a network planning tool. Modeling information, such as the connectivity between customer meters (loads) and the appropriate secondary network bus section are entered into the SKM tool.
The planning engineer has focused recently on bringing this model up to date. The model includes the street grid, including transformers by location, and including transformer sizing and impedance. The model has been updated to include new cables that Duke has recently changed. The model also contains updated loading information, including the loading of particular buildings.
This loading information comes from several sources. Larger commercial customers have demand meters. Load readings are housed in the Duke energy billing system and for larger customers (over 300 KW) the customer provides a phone line and loading information flows back to the company’s billing system through the phone lines. The loads of smaller customers, without demand metering, are estimated by the Planning engineer from kWH history.
The planning engineer has utilized the services of a co-op student to audit through the billing system and identify and assign customer loading served off of the street grid to the spreadsheet model (assigning customer loads to a specific secondary bus section).
Model and loading information from the spreadsheets is entered into the SKM power tools product enabling the planning engineer to model secondary load flows.
Note that the updating of the network model is a manual process. The model does not automatically import information from Duke Energy Ohio’s GIS system. Note that Duke Energy Ohio’s GIS system, while modeling primary network feeders, does not model the secondary or tie customers to the secondary network.
A longer term goal of the Planning Engineer would be to have the ability to automatically update the system model for analysis from the GIS with the push of a button. At the time of the immersion, Duke Energy Ohio was in the process of obtaining and implementing a new GIS system.
7.7.11.8 - Energex
Planning
Network Planning
(Distribution Network Planning / Planning Criteria)
People
Planning is performed by the Network Capital Strategy and Planning Group, part of the Asset Management organization. The Network Capital Strategy and Planning Group is led by a group manager.
Process
The planning team works on the development plan, looking at a 10-15 year horizon. The major product of this endeavor is the Distribution Annual Planning report (DAPR), a regulatory required document (Required by the National Electricity Rules of Australia). Energex is required to produce and submit a DAPR annually.
This particular report identifies or forecasts the upcoming limitations of the system.
The planning process is highly regulated, and governed by a set of national electricity rules in Australia.
The work of developing the DAPR includes applying a set of planning criteria to the analysis of the system, and, based on forecasted loading, predicting upcoming system limitations, both thermal and voltage.
The planning process includes a five-year rolling look at the system that includes an annual analysis of anticipated demands on every circuit, substation and substation transformer. Analyses include both normal loading and contingency loading situations. Demand is calculated on every circuit, station, and substation transformer in the Energex system.
When a planning engineer identifies a deficiency, he nominates a project to correct the problem. This nomination involves a high-level description of the work to correct the problem as well as a rough indication of the costs.
7.7.11.9 - ESB Networks
Planning
Network Planning
(Distribution Network Planning / Planning Criteria)
People
Distribution planning at ESB Networks is performed by planning engineers within the Network Investment groups – one responsible for planning network investments in the North, and the other for planning in the South. Organizationally, the Network Investment groups, both north and south, are part of the Asset Investment organization. In addition to the Network Investment groups, the Asset Investment organization is also comprised of a Generation Investment group and a Specifications group, each led by a manager. The Asset Investment group is part of Asset Management.
Planning is performed by one HV planner and four MV planners. Most of these individuals are degreed engineers, but some are “Technologists” who have developed their expertise through field experience.
Planning standards and criteria are developed jointly between the Asset Investment group and the Strategy group, which is part of the Finance and Regulation group within Asset Management.
Process
ESB Networks has a carefully thought out process for reviewing their planning standards, developing investment plans, and packaging these plans for the price review process that exists within the regulatory agency in Ireland. The planning standards and company investment plans are reviewed and updated every five years. Also, necessary changes to the planning standards are brought forth at monthly management team meetings. The result of these efforts is a comprehensive five-year asset investment plan for meeting their service level targets.
Planners engineer the system to N-1, with most supplies having a “forward feed” (preferred) and a “standby feed” (reserve). The planning criteria for MV distribution requires customer voltages to remain at +/- 5% of nominal in normal situations, and +/- 10% of nominal in a standby (contingency) situations. Planning criteria also call for long-term cyclical overloads of no more than from 125-150 percent of rating for equipment, with a short-term loading of no more than 150-180 percent.
At the time of the practices immersion, ESB Networks has a program underway to convert their 10-kV distribution system to 20 kV. This conversion effort is underway outside of Dublin where the benefits of conversion are more readily realized. Note that the MV primary system serving the city of Dublin is operated at 10 kV.
Technology
For performing MV (10 and 20 kV) and for some 38-kV circuit studies, ESB Networks is using SynerGEE (GL Group). The company has tied this tool to its GIS database. For HV analyses (38 kV and 110 kV), ESB Networks is utilizing PSS® Sincal from Siemens.
7.7.11.10 - Georgia Power
Planning
Network Planning
(Distribution Network Planning / Planning Criteria)
People
Resources in several groups perform distribution planning of the network at Georgia Power. The company has both Area Planning and Distribution Planning. Area Planners are responsible for different areas of the state, such as Atlanta, Savannah, Macon, Augusta, Athens, Valdosta and Columbus and are responsible for the substations in those areas to make sure they have the capacity to handle projected future loads, and contingency situations (N-1). These Area Planners are geographically based both in Atlanta and the southern part of Georgia. Those outside of Atlanta work in offices closest to the areas they are responsible for, while three Area Planners are based out of the company’s downtown Atlanta offices and are responsible for the Atlanta Metro area and a few networks in Macon and Augusta.
Projects of $2 million or less are brought before the Regional Distribution Council for approval. Any projects that require more funding are sent to upper management for review and funding approvals.
Distribution Planners are responsible for loading of both distribution and network primary feeders, and work closely with the network Area Planners. Area Planners are responsible for planning upgrades of substations on the urban networks, while the Distribution Planners are responsible for planning upgrades of the primary feeders. The two groups work closely together. Both groups – Area Planners and Distribution Planners – work with the Network Underground design engineers during the design phase.
Planning of upgrades to the secondary grid is done by principal engineers in the Network Underground department.
Process
Although Area Planners are not responsible for the network loading, they are responsible for the load on the transformers. Therefore, the Area Planners must know the configuration and cable load of the entire urban network. Area Planners evaluate contingency reserve capacity to maintain N-1 reliability of the network. For example, if Georgia Power has three transformers at a substation, and one of the transformers supplies the Network, then one of the responsibilities of an Area Planner is to insure that if the Network Bank fails, for whatever reason, the other two transformers have enough reserve capacity to pick up the full load of the failed network bank. This guarantees a high level of customer reliability. As a result of this strategy, network substations are sized accordingly, so that they have enough capacity to handle any network segment with only two transformers regardless of the peak load.
In Georgia Power’s network design, all network feeders are dedicated to the network, which is a leading practice. Feeders supplying any one network are sourced from the same substation bus. Only in a rare, emergency case would Georgia Power attempt to temporarily supply non network load from network feeders. The preferred plan is to always have dedicated network feeders for each network.
The only exception to this case is the city of Atlanta rapid transit system, MARTA. Here Georgia Power puts a distribution feeder on the network bus. The MARTA system is all in duct line, however, and is well protected, so the chance of exposure to an outage or disruption is minimized.
Georgia Power predominantly has network-only substation transformers reserved especially for the network grid, and distribution-only substation transformers for the radial or overhead distribution. There are a few that are mixed (supplying both network and non-network load) – but these are the exceptions. Network substation transformers do not tie to radial distribution anywhere else in the field. There has been some work done to install ties between network primary feeders to be used only in emergencies. These ties are manual at this time, and the network underground group is moving toward automatic ties. There is no intent to tie network sub transformers to the distribution side as it would affect planning and network operation throughout the system.
The network planning process involves running load flows to compare system loading to the feeder ratings and to evaluate the implications to the system of anticipated new forecasted loading. Network planning is based on a peak load analysis, recognizing that the peak is only representative of loading for a few days each year. In developing the load forecast, engineers will consider known projects, estimated future load additions from areas under development, such as downtown Savannah and Buckhead, and general growth rates. Engineers will also temperature adjust their load forecast based on previous historical data of high-peak temperatures, averaged over a number of years. Area Planners look four years ahead, forecasting the need for more capacity based on impending projects and demographic demands, such as the newly planned baseball stadium in Atlanta.
Area Planners trigger network planning changes based on the data they have, including the aforementioned load forecasts. In addition, Area Planners meet with senior engineers, marketing, and distribution engineers, every five to six months. The group examines proposed customer projects that are in the pipeline and determines whether the projects will be distribution (radial) based or network-based. The frequency of the meetings is a direct result of the number of projected projects and the likelihood they will come to completion. For example, it was projected that the Buckhead area would experience tremendous growth, and the Area Planners and Georgia Power anticipated the need for another substation in that area that would serve a new network grid; however, the economy faltered and the project was put on hold. It is only now, after an economic recovery that the substation is back on track for construction and completion. In general, when an area planner anticipates hitting 90 percent of the rating of the substation transformer in their planning outlook, they develop load relief projects. Because of the time required to get a project completed, planners start looking into solutions when the transformer is 80 percent loaded.
One of the notable practices at Georgia Power is its highly organized and consistent approach to cable and duct line placement (See Figure 1.). (See Network Design, Peachtree Racking in this report). Georgia Power’s design calls for primary feeders to be located in the bottom ducts, with secondary feeders located in the top duct lines.

Figure 1:
Peachtree racking example
The Atlanta urban area has 35 networks. Some of them have secondary grids (street mains) and spot networks, while others have only spot networks.. Each is fed by three to six feeders with a primary voltage of 20kV. There is one small 12kV network in Atlanta. Georgia Power uses both ring-bus and split-bus substation designs, depending on the existing infrastructure, as both Atlanta and Savannah have older network systems in place. In other networks outside Atlanta, other voltages are supported, mostly due to legacy installations as well.
The secondary grid in Atlanta is 120/208V. While some utilities, such as SCL, run a true 480V grid, Georgia Power does not maintain any 480V grids. Georgia Power does have many 480V spot networks, however. The typical design includes multiple transformers located within a customer vault, supplied by network feeders, to supply a large customer (a high rise, for example). The Georgia Power terminology for a spot network service is a “vault service”. Note: Georgia Power may also use the term “overhead spot network” to denote locations where they supply a true spot network service from two overhead systems, typically in cases where a customer wants the reliability of a networked system, but where no network feeders are available.
A fairly common non-network design offered by Georgia Power includes supplying service with a primary feeder and alternate feeder with an automatic transfer switch between the two. A standard PMH transfer is used (not a fast transfer).
In some downtown areas, only network service is available. In other areas, only radial distribution service is available. A few areas have both network and non-network service available, and the customer can choose.
Georgia Power does not charge different rates for a network service and a non-network service, but new network customers may have to pay a capital contribution. Also they acknowledge that the upfront costs to the customer for a network service are higher due to factors such as the need for more area, higher rated service equipment, etc.
In the case of distribution customers that are supplied from two energy sources, they may or may not pay for reserve capacity. For example, in the past Georgia Power has used a “flip-flop” scheme for nursing homes, in which the backup feed is used only when needed. Now, if the feed is dedicated solely to one customer, the customer typically pays for that reserve capacity.
When pricing out the upstream reserve capacity charge, engineers must take into consideration whether it will be delivered by overhead line, underground, or a “flip-flop” configuration. Each delivery mechanism has a separate cost associated with it, and is put into the pricing calculations. If the customer is paying upfront costs, Georgia Power factors in both primary and secondary installations, mainly to cover its costs and future maintenance.
In the case of street main service, where there is little or no installation overhead but a decrease in available capacity, Georgia Power has factored in a “cost to serve” into the customers rate. This is especially true in Savannah, Georgia and other areas where downtown renovations and revitalization is placing greater demands on the grid and its maintenance.
Customers in a network area who request 208V services will usually be connected to the secondary network grid if one is present. Customers who request 480V network service may be served by a spot network in a below-grade or above-grade vault Above-grade vaults are usually not practical in the congested parts of downtown Atlanta unless the customer can provide vault space in their building. Thus, the most common design type for larger loads in downtown Atlanta is via an indoor vault with a 480V secondary spot network.
The indoor transformer vault contains two or more transformers. The vault is built by the customer based on Georgia Power guidelines. Before the transformers are mounted and energized, Georgia Power engineers inspect the customer vault to make sure it meets their functional requirements.
Georgia Power provides two or more primary supplies coming into the customer vault. One notable practice of Georgia Power is to fully insulate the secondary collector busses, which are 2000 MCM, 600 V copper, with a full EPR jacket (See Figure 2 and Figure 3.).

Figure 2:
Secondary collector bus with EPR insulation

Figure 3:
Secondary collector bus with EPR insulation cross section
Technology
Georgia Power has recently acquired CYMDIST to model the entire secondary and primary grid (See Figure 4.). The program is designed for planning studies and simulating the behavior of electrical distribution networks under different operating conditions and scenarios. It includes several built-in functions that are required for distribution network planning, operation and analysis. The model Georgia Power has developed is extremely accurate including cable systems, cable ratings, cable capacities and specifications. The Area Planner keeps detailed spreadsheets, continually updated, on upcoming and ongoing projects. The Georgia Power GIS system also tracks network statistics, so that if a particular network segment reaches a threshold, it is tagged for analysis by the Area Planner and Network design groups. Typically Georgia Power prefers to keep capacities in the 70 to 90 percent range, and any transformer or network segment exceeding 90 percent is prioritized and tagged for the Area Planner and engineering for more capacity.

Figure 4:
CYMDIST 7 Distribution Network simulation software with Network Editor
7.7.11.11 - HECO - The Hawaiian Electric Company
Planning
Network Planning
(Distribution Network Planning / Planning Criteria)
People
Network Planning at HECO is performed by Distribution Planning Division at HECO. The Distribution Planning Division is part of the System Integration Department. The Distribution Planning Division group performs all distribution planning at 46kV and below.
The group is led by a Principal Engineer and is comprised of one lead distribution engineer, and 5 Planning engineers who do all of the distribution planning work for the island of O’ahu. All of the engineers in the group are four year degreed engineers.
HECO has a documented planning criteria document. Each year, HECO planning engineers perform studies of the system using load forecasts based on historic peaks and anticipated load growth to identify places where either system loading limits are exceeded or other violations of their planning criteria are encountered. It is from this analysis that reinforcement projects are conceptualized.
Their distribution system is designed to N-1; that is, they plan their system such that all the system components, including primary feeders, secondary cable mains and taps, and transformers, are sized to be able to carry the load within specified thermal and voltage limits during peak conditions when any single component is out of service.
Process
The anticipated loading on the system is estimated by using the historic peak loading from the previous year as measured at the substation transformer, and apportioned to the feeders based on periodic loading measurements called “Tong Tests”. Historic load readings from demand meters and projected new loading information gathered from their Customer Installations Department (CID) is combined with this estimate to create a projected load profile for each feeder that is used for analysis.
HECO maintains a system power factor of 93%. They do have tariff language that requires customers to maintain an adequate power factor or incur penalties.
HECO’s Planning Criteria does not specify or limit the number of feeders that can be run in the same duct bank or conduit.
Technology
HECO historically has not used a load flow software product to aid them in distribution planning. They gather and record feeder loading and transformer loading information using an EXCEL spreadsheet. Load flows are calculated manually.
HECO is in the process of installing SynerGEE, a load flow software product from GL Industrial Services. This product will interface with HECO’s GIS system and be able to import up to date circuit models. They are targeting year end (2009) for implementation of this software.
HECO is performing secondary load flow analysis of their secondary network using the PSSE program from Siemens PTI.
HECO has limited SCADA on the distribution system, with less than 20% of the feeders having SCADA at the station. HECO has virtually no SCADA beyond the station fence.
In addition to Distribution Planning, the System Integration Department at HECO is comprised of Renewable Energy Planning, Transmission and Generation planning, a Protection group and a group that focuses on AMI.
Four times per year, HECO will perform a “Tong Test” of each feeder. The Tong Test is an amp reading taken on each phase of each feeder. One measurement is taken in the summer, one in the winter, one at night, and one during the day. These measures are used by Planning to apportion measured transformer load to each circuit.
7.7.11.12 - National Grid
Planning
Network Planning
(Distribution Network Planning / Planning Criteria)
People
At National Grid, network planning is performed by the Distribution Planning Organization, led by a Director. Organizationally, the Distribution Planning Organization is part of Distribution Asset Management, and is comprised of resources in both a central location (Waltham Massachusetts), and distributed throughout National Grid (Field Engineers).
Centrally located resources include capacity planning resources who reporting to a manager, and engineering personnel, who have broad system planning and engineering responsibilities, Regionally located resources include field engineers who report to managers of Field Engineering for both New York and New England, About two thirds of the Distribution Planning organization is centralized, with the remaining third decentralized.
In general, short term planning activity (current year) is led by the field engineers located in the regions. Longer term analyses (future years) is led by the central planners
The planning engineers who focus on the Albany network include a field engineer who works in the Albany office and focuses primarily on both radial and network underground systems for National Grid’s New York Eastern division, and an engineer situated in Waltham, who has network engineering responsibilities across the system. These engineers have responsibility for both network planning and network design.
Both of these engineers are four-year degreed engineers, and are not represented by a collective bargaining agreement (exempt).
National Grid has up-to-date standards and guidelines for the network infrastructure. In addition they have up-to-date planning criteria that address network planning.
Process
National Grid has SCADA installed to monitor loading at the substation. They are able to obtain historic 15 minute interval load data as measured at the substation.
Planning engineers use this information as well as information from National Grid’s customer information system to develop distribution feeder models. Customers / customer load are assigned to certain network busses to model the system. Engineers model the system at peak load, at 90% of peak load, and in the n-1 and n-2 contingency situations.
Distribution planning analysis includes analysis of both potential thermal overloads and voltage issues. When assessing loading impacts of devices such as transformers, National Grid uses 120% of nameplate for single contingency and 140% of nameplate for double contingency.
The network in Albany is summer peaking. Typically, planning studies for the network are performed in the spring and may project anticipated system loading multiple years in the future. In addition, the analysis may also include a fault current analysis to understand the ability of the system to properly clear faults. Note that while modeling and analysis for non network feeders occurs annually at National Grid, modeling and analysis of network feeders is not performed every year, and typically involves a multiple year projection of loading.
In the spring of 2010, planning engineers looked at the Albany network using 2009 monitored data and models as a base, and determined projected system loading for the summer of 2015. This longer-term view enabled them to develop a five-year construction plan for reinforcing the network. The analysis included thermal analysis, which looked down through the secondary as well to understand the thermal impacts on the secondary mains. Note that this analysis did not look at individual service conductor loading in the network. As part of this analysis, planning engineers also performed a fault current analysis to understand the expected performance of the system for solid faults in the secondary cable system.
National Grid’s process for reinforcing the system is that after performing the analysis planning engineers recommend capital improvements. Major capital improvements, in excess of $1 million, flow to a distribution capital investment group, an internal committee that reviews and approves funding for major investments. Capital expansions under $1 million follow an internal National Grid level of signature authorization (LOSA) procedure.
The study performed in the spring of 2010 resulted in the development of an investment proposal to the Albany network that includes the installation of network protectors, secondary cable installations, and secondary manhole mole and ring bus installations.
Technology
National Grid planning engineers use the PSSE power flow product to model and perform power flow analysis of the network system, and use a product called Aspen to perform fault analysis. (The Aspen product is also used by the System Protection group at National Grid.)
Note that the PSSE power flow product provides steady-state analysis. It cannot model network protectors (for example, back feed through the protectors).
In non-network areas, National Grid uses CymDist as a modeling tool, which has been integrated with their GIS system. National Grid has not applied this to the network system, as their GIS system does not model a meshed system.
7.7.11.13 - PG&E
Planning
Network Planning
(Distribution Network Planning / Planning Criteria)
People
Network planning is performed by the Planning and Reliability Department. This department is led by Principal Engineer, who is also the department supervisor. This group does distribution planning for both the network and non-network systems. Eight engineers comprise this department. Six focus on the radial system, and two focus on the network system.
For network systems, the two planning engineers are responsible for distribution planning. One of the two network engineers is relatively new to the department, and was assigned to receive training from the lead network engineer.
Both network planning engineers are four year degreed engineers. They are represented by a collective bargaining agreement (Engineers and Scientists of California).
Process
PG&E has secondary networks in both San Francisco and Oakland. They have 12 total networks, 10 being supplied by 12kV feeders and the other two, 34.5kV feeders. Each individual network system sourced at 12 kV is fed by six dedicated network feeders. Of the two 34.5kV sourced networks, one is fed by four feeders and the other, by five feeders.
Secondary network grids are 120/208V. Secondary network spots are at 120/208V and at 277/ 480V.
The downtown networks in San Francisco are fed by 4 substations, and the Oakland networks are fed by 2 substations. 12 kV primary feeders supplying the networks are typically PILC, and the 35kV are XLPE. When replacements are necessary, EPR cable is installed.
Each network is served by feeders supplied from a single substation. However, some feeders supplying a given network are fed from separate transformers at the station. In some cases, PG&E has experienced some challenges with circulating currents, such as unintended network protector operations. At the time of the immersion, PG&E was implementing changes to resolve this issue, such as redesigning the substation configuration to supply all feeders to a particular network from the same substation transformer.
PG&E customers in the network are charged standard residential rates, consistent with the rates charged to radial customers. Somewhere less than 5% of their electric revenues come from their secondary network systems.
PG&E’s network system is designed to n-1. That is, the system is designed to ride through the failure of any one component during a system peak, with only minor overloads to transformers, primary feeders and secondary mains during peak periods.
PG&E does not plan any new networks, but they will add load to the existing networks.
The planning process involves running load flows to compare system loading to the feeder ratings and to evaluate the implications to the system of anticipated new loading. Network planning is based on a peak load analysis, recognizing that the peak is only representative of loading for a few days each year. Planning engineers obtain monthly peak loads from the SCADA historian[1] and compare this to feeder ratings. Engineers may enter the SCADA readings into the load flow model and recalculate to see if there are any overloads. Alternately, they may simply compare the monthly peak values to previous peak load readings and circuit ratings. Planning engineers will ascertain the validity of any projected new load estimates, and run load flows to understand the implications of added load.
Designing for the peak provides conservatism to the planning process. Planning engineers report that actual loading is always lower than the loading projected by their load flow models, as these models are based on peak values and do not account for load diversity.
If the calculated circuit loading exceeds 110% of the either the circuit’s normal or emergency capacity ratings, the planning engineer will consider the circuit to be overloaded and recommend design changes to ameliorate the overload condition. PG&E uses the 110% level based on the fact that their load flow model uses all peak load values and thus doesn’t account for diversity. So, rather than reacting to modeled loads over the 100% rated values of circuits, they add the additional 10% since they know their models are conservative. They do this analysis for both base case and for contingency situations. (Six different contingency models are run, one for each primary feeder supplying a network).
Cable emergency ratings are set at 110% of nominal. Transformer emergency ratings are set at 130% of nameplate. The planning criteria specify the number of hours that a device could be expected to operate at the emergency rating (varies from between 24 to 48 hours).
In San Francisco, planned feeder outages to perform maintenance are taken at night, in lower load periods, and returned to service for the day. In Oakland, planned feeder outages for maintenance are taken during the day, as the network is lightly loaded. Often, these planned feeder outages may last for one week.
Technology
PG&E uses the EasyPower load flow product from ESA to model their network system. This model is manually populated and maintained by the planning engineer. The planning engineer reports being satisfied with this planning tool.
Note that PG&E is presently implementing the CYMEDIST,(by CYME) load flow product for performing analysis of their radial system. In a subsequent phase of their project, they plan to implement the use of CYMEDIST as their network planning tool as well. A challenge for them will be the conversion of data from EasyPower to CYMEDIST.
[1] PG&E’s SCADA provides three phase amp readings on all network feeders. Also, they have the ability to monitor loading on all network transformers through CT monitoring installed on the transformer secondary (at the NP). This information is housed in the PG&E SCADA Historian.
7.7.11.14 - Portland General Electric
Planning
Network Planning
People
PGE’s network system includes many facilities that customers co-design and co-own, so system planning for the network involves many departments with overlapping responsibilities. Because the process assembles experts from many areas of the company, system planning is based upon good project management and a multi-departmental approach.
Transmission and Distribution Planning: Across PGE, the Transmission and Distribution Planning (T&D) organization oversees the planning process for network and non-network systems. The Distribution Planning Department working within this organization employs five Distribution Engineers and an experienced manager with previous experience as a network distribution engineer. A planning engineer with a four-year degree in engineering covers the Portland Service Center (PSC), which includes the network.
Distribution/Network Engineers: Three Distribution Engineers have responsibilities to provide engineering services for the underground network. These engineers also work with customers to design and operate customer-owned facilities associated with network infrastructure. The Distribution Engineers are not physically based in the PSC service center or CORE group, and are overseen by the Eastern District Central Supervisor, who reports to the Manager of Distribution and T&D Standards. The underground Distribution Engineers are qualified electrical engineers. When needed, PGE hires civil engineers to perform certain design tasks associated with the civil infrastructure, including vaults, manholes, and duct banks.
Project Management Office Group: The Project Management Office (PMO) manages the larger, more complex projects. This group, which is part of the Transmission and Distribution organization, is involved in in the early stages in coordination with System Planning, and assumes responsibility for projects once the Planning Engineers have developed a shortlist of solutions. Because of an increasing number of more complex projects, PGE is expanding its Project Management Office Group.
One project manager within the PMO has responsibility for all projects in the CORE, including complex projects such as building a new network substation. The present project manager has a Project Management Professional (PMP) certification and project management experience with another utility. The PMP designation is not necessarily a requirement for T&D Project Managers.
Service & Design at PSC: Service & Design’s role is to work with new customers or existing customers that have new projects; so, they are responsible for new service connections, and upgrades to existing services. The supervisor for Service & Design’s wider responsibility includes the downtown network. The supervisor reports to the Service & Design Manager, who is a peer of the Distribution Engineering and T&D Standards manager. Both of these positions report to the General Manager of Engineering & Design.
The Supervisor of Service & Design at PSC and their group undertakes customer-initiated capital work. A “Mapper/Designer” reports to the Supervisor of Service & Design at PSC and provides the computer-aided design (CAD), geographic information system (GIS), and design service. A Field Inspector meets contractors in the field. Two inspectors work for the Service & Design organization, and one specializes in the network.
Service & Design Project Managers (SDPM): Network planning associated with customer-driven projects requires regular coordination with the customer throughout the project life. PGE has a position called a Service & Design Project Manager (SDPM), who works almost exclusively with externally-driven projects, such as customer service requests. At present, two Service & Design Project Managers cover the network and oversee customer-related projects from the first contact with the customer to the completion of the project. They coordinate with customers to assure that customer-designed facilities comply with PGE specifications.
The SDPMs can be degreed engineers, electricians, service coordinators, and/or designers. Ideally, an SDPM has an associate degree or a combination of electrical engineering experience and appropriate education. In addition, SDPMs should have proven project management skills and understand PGE and industry standards and practices. They should also have knowledge of the National Electrical Safety Code (NESC) and National Electrical Code (NEC) safety codes and the ability to use or learn the relevant information technology (IT) systems. PGE prefers a selection of SDPMs with a diverse range of experience and backgrounds.
SDPMs work on both CORE and non-CORE projects. This ensures that expertise is distributed and maintained across departmental and regional boundaries.
Process
Planning Process
The T&D Planning organization identifies the need for a project and undertakes studies to assess the lowest cost solution that will resolve the issue. When planners highlight a problem, they initially identify between three and five potential solutions, before choosing the lowest cost, least risk solution and proceeding. At that point, a schedule and estimate for the project are developed before it is handed to the PMO Group. They assemble a project team that includes representatives with a range of experience, depending upon the type and scope of the project. The assembled team visits the project site, or multiple sites for a combined substation/line project, and determines the scope before submitting a project for approval.
In the future, to streamline the process, Distribution Engineering will identify the project and potential solution before involving the PMO Group, who will develop the estimate and schedule before sending the project to the Corporate Capital Review Group for funding approval. Previously, the PMO only became involved when project funding was approved. With the new process, the PMO becomes involved much earlier and provides more accurate estimates and scheduling, alongside detailed engineering studies, before a project is approved. PGE amended the process because, with the existing system, little engineering analysis was undertaken and costs often escalated after approval due to the lack of detailed information. This complicated accurate assessment of the true costs and potential risks.
One concern with the new system is that engineers will spend time performing preliminary studies and, if the project is not approved, the upfront time commitment will waste resources. Therefore, it is important to promote better synergy between engineering and the PMO to streamline the project management process leading up to approval. Once a project is approved, the PMO will escalate the process and work with the team created during the estimating and scheduling phase of the project to plan, engineer, permit, and construct the project.
For internally-driven projects, the PMO oversees the project development, while for externally-driven projects, SDPMs usually oversee the project. For external projects, the PMO is only involved for large projects with complex coordination requirements. Depending upon the makeup of the project team, the engineering group may control the entire project and only involve the PMO if problems arise, such as a risk of missing deadlines. For other projects, the PMO may be more intimately involved.
At present, the PMO focuses mainly on the transmission system, and the group is only involved with distribution projects where they connect to larger transmission projects, such as the Marquam Substation project. The PMO generally works with larger projects that require a high level of coordination between multiple groups. The PMO does not work directly with equipment and material vendors, because this is the responsibility of the Materials Coordinator. The PMO is heavily involved with scheduling and offers an opinion about the resources required.
In general, no official processes determine whether a project or task should use internal or external resources, because this depends upon the available internal resources and the preferences of senior engineers and project managers. On the distribution system, many of the tasks require local knowledge, workmanship, and expertise, so PGE is more comfortable with internal crews undertaking the work.
Overall, the CORE Planning Engineers spend 10-20% of their time planning the network system, with the remainder on the radial system. At present, written planning criteria informs network planning. PGE does not have written design criteria.
Load Reduction and New Customers: As a wider philosophy, PGE is trying to maintain the network and reduce loads where possible. If a new customer enters the system on the periphery of the network system, they are usually added to the radial system rather than the network. The reason for this approach is that networks are expensive to maintain and build, so network access is reserved for customers with connections lying well within the network.
Customers on the periphery can request an alternative service to ensure reliability, which includes a service agreement and payment for the contingency service and the reserve capacity needed. This can also depend upon the load, with the enhanced service provided free for customers requiring over 18-MW loads. Customers with loads under 4 MW pay only for the feeder, and customers with 4-18 MW demands pay for the substation capacity.
Reporting: To support network planning, the Planning Department creates bi-annual loading reports, known as the “Weak Link Report,” which covers both the radial and network systems. The report examines the system peak loading for the summer and winter, using network data sourced from the substations. At present, other monitoring data received from the network is not used for modeling or planning, and is reserved for operations.
For the Marquam project, PGE produces weekly reports that summarize aspects of the project. This periodic reporting is more aggressive because of the size of the Marquam project, and the need to monitor and coordinate many tasks. The report is sent out to the various groups involved in this project.
Standardizing: Overall, PGE is improving its processes for documenting and standardizing equipment and procedures on the network. For example, when planning the new system layout, duct banks, known as duct packages, will contain no more than two feeders per network in any duct package to reduce the chance of vault fires.
Project Scheduling SharePoint: On a monthly basis, Project Managers maintain a project schedule for their individual projects and post those to a SharePoint site. This site also includes:
- Forecast cost information
- Actual cost information
- Brief report of monthly activities
- Link to the schedule
- Other commonly searched documents
- This information is not commonly shared with other groups. Project Managers issue weekly reports to the PMO manager, which takes the form of a bulleted list of task updates. T&D Planning Engineers perform shorter term studies and share the results with stakeholders via SharePoint. These results are used to justify potential capital projects.
PSSE Load Modeling Software
For the network system, PGE uses the Siemens PSSE modeling software for both the primary and secondary network. Currently, operators manually enter secondary loads into the PSSE system. Planners collaborate with Distribution Engineers to obtain the most up-to-date model in PSSE, and any loading updates are entered manually. The load data is derived from the customer meters, which is presently a labor-intensive process. PGE’s network load is relatively flat, but the utility is anticipating an increase in the next few years due to an expansion of the retail sector in the downtown area.
PSSE was used to develop and model a sequence of steps when splitting the Stephens Substation secondary network into two four-feeder configurations. System planners used PSSE modeling software to perform load analyses using peak demand data drawn from metered accounts on the network. PSSE was used to assign appropriate nodes to the metered accounts, and the load was scaled to match a coincidental summer peak loading patterns.
This was used to develop a base case scenario with the loadings and voltage on lines, equipment, and buses for the Stephens network. Planners were able to ensure that no line would be loaded more than 100%, no grid transformers would be loaded more than 140%, and no spot network transformers would be loaded more than 130% during peaks. Base loadings specified that no line should be loaded more than 88% and that no transformer should be loaded more than 70%. Where outages would see equipment potentially exceed the loadings, PGE identified equipment upgrades [1].
Technology
PGE uses a number of IT systems to model the system and plan projects. PGE uses CYME/CYMDIST to assess the reliability benefits of projects on the radial system, and planners use the software to develop a base case and evaluate the system under N-0 and N-1 contingencies. For modeling the network system, engineers use Siemens PSSE software for the primary and secondary network, using data from customer meters to develop a base case and highlight where normal and peak loading exceeded recommended limits.
Because PSSE is unable to monitor single-phase loads and cannot model loops, PSC will add the secondary network to CYME, using the GIS system to model and display loops. For mapping, PGE uses ArcFM, and is presently working with the vendor, Schneider Electric, to enable ArcFM to pass information to CYME for secondary network modeling.
PGE uses an Enterprise Resource Planning (ERP) system called PowerPlan, which has an Oracle attachment named “Pace.” This system provides canned financial data about projects. Other technologies used for planning include SharePoint, Field View, the PGE Engineering Portal, PI ProcessBook, and the T&D Database.
- Derek Harris. 2014. PGE Stephens Network System Split Report, internal document.
7.7.11.15 - SCL - Seattle City Light
Planning
Network Planning
(Distribution Network Planning / Planning Criteria)
People
Organization
Network Planning at Seattle City Light is performed by the Network Design Department, which is part of Energy Delivery Engineering. See Attachment A: SCL - Org Chart .The Network Design Department focuses exclusively on the planning and design of SCL’s networks.
Although SCL does have a separate planning group that performs distribution planning activities for SCL’s non-network distribution system, this group does not do the planning associated with the network. All cable ratings, load flow and voltage studies, master load flow analysis, assignment of feeders to load additions, area studies, etc. associated with the network are performed by the Network Design Department staff. (Note that SCL is currently implementing an Asset Management organization. At the time of this writing, SCL had not yet decided whether certain tasks currently performed by the Network Engineering group will be moved into the Asset Management organization.)
The Network Design Department is made up of a System Group (eight engineers) and a Services Group (eight engineers). These engineers do all of the planning and engineering for the network (the System Group), as well as interface with network customers for load additions, new loads, etc. (the Services Group). The individuals in this group are four-year degreed engineers. The senior level engineer position at SCL requires a PE license. The engineers at SCL are represented by a collective bargaining agreement (IBEW).
Culture
The Network Engineering group has a close working relationship with the Civil and Electrical construction and maintenance groups within the Area Field Operations – Network Department and the Distribution Operations Department. EPRI observed high levels of mutual respect between these groups, and high confidence by the field organizations in the planning and design decisions made by the Network Design Department.
SCL has remained committed to the network engineering department staffing levels, hiring new engineers into the network area to fill vacancies. SCL has no formal training program for network engineers. However, network engineers are sent to special classes on network equipment, etc. as part of their ongoing development.
Process
Planning Criteria
SCL has defined and documented network design criteria for Feeder Loading, Electrical System Construction, and Civil Construction (see below). SCL’s network system is designed to maintain N-1 load capability at peak load. More specifically:
Network Design Criteria for Feeder Loading
-
Load feeders to maintain N-1 load capability at peak load.
-
Limit feeder imbalance to 20% at N-0.
-
Keep load current within constraints determined by loadflow and ampacity studies for existing plant.
-
Keep load current within constraints determined by loadflow and ampacity studies for new construction.
-
Account for diversity factor during feeder loading analysis.
Network Design Criteria for Electrical System Construction
-
Allow no more than two mainstem cables from any one sub-network per MH or street vault. There may be mainstem cables from other sub-networks present (subject to the same restriction) as well as branch cables.
-
Allow no more than four lateral feeders from any one sub-network per MH or street vault. This may change as a result of studies for ampacity evaluations of feeder laterals with high loads or near steam lines.
-
Size new mainstem feeders to match substation capacity, with allowances for feeder imbalance and reliability.
-
Require two half-lapped layers of arc-resistant tape to each primary feeder in MHs and street vaults.
-
Limit DC Hi-pot testing of 15-kV class cables to a maximum of 26 kV DC and 28-kV class cables to a maximum of 47 kV DC.
-
Use VLF testing for newer cable testing if separable from older cable sections. Note: This particular requirement has not yet been implemented. SCL is still examining the merits of VLF testing for cable
-
Do not allow construction of new 480-volt secondary grid networks.
-
Use limiters on both ends of all secondary bus ties.
Network Design Criteria for Civil Construction (Street Facilities)
-
All duct banks shall be encased in concrete.
-
All new system duct banks shall have 5-inch diameter conduits for system cables.
-
Steel ducts are required for shallow construction.
-
Every effort shall be made to install new duct banks a minimum of 15 feet away from any steam logs. If new duct banks will be within 15 feet, a cable ampacity analysis is required to determine potential mitigation actions.
-
If a duct bank must cross a steam log, insulation must be applied per SCL construction guideline NDK 150.
-
Fluidized thermal backfill (FTB) or controlled density fill (CDF) may be used to backfill around encased service ducts.
-
Use only fluidized thermal backfill (FTB) around encased system ducts.
Cable Rating
SCL rates cables at 90 ˚ C; that is, they develop a cable ampacity rating that limits the conductor heating to 90 ˚ C. SCL does not develop an emergency or 24-hour rating for feeders. They plan their system to the 90 ˚ C limit.
SCL develops feeder specific ratings based on field conditions. Using software, they develop ampacity ratings for circuits that consider factors such as cable type, duct bank configuration, soil resistivity, proximity of foreign utilities, design temperature (90 ˚ C), load factor (80%), etc. SCL performs both a summer and winter analysis. The summer ratings, which are the most conservative, are typically used for planning purposes.
SCL re-rates cables any time conditions in the field change that could affect cable rating, including the addition of another parallel circuit, the addition of a foreign utility such as a steam line, a new cable in the duct bank, etc.
The specific cable ratings are entered into the load flow software for planning analysis.
Load Flow
SCL conducts a master load flow analysis twice per year using “extracts” from their monitored loading data after the summer and winter of each year. This master load flow analysis is performed on all network feeders. The analysis is performed by the Load Flow
Engineer within the Network Design Department. This process is one of the drivers of reconductoring projects.
(Note: many feeders are analyzed more than twice per year because of load increases – see feeder assignment process discussion in next paragraph.)
SCL also performs a feeder load analysis as part of their Feeder Assignment process in response to anticipated new load. The term “Feeder Assignment” means determining which feeder or feeders will serve a new network load. A Network Services engineer requests the feeder assignment based on a new or supplemental load need. The System Engineer within the Network Design department performs an analysis to determine the best scenario for serving the new load. This analysis includes ensuring that the network design criteria are met, and that any feeder imbalance is restricted to less than 20%. (Note that about 80% of new load is served as a spot network, rather than tapping the existing network secondary.) See Attachment B: Feeder assignment workflow sequence , for a flow diagram of the Feeder Assignment Process.
When SCL performs a load flow analysis, they start off with the worst case (no accounting for diversity). They then re-run the case after applying a diversity factor.
Network Secondary
SCL has existing 208 and 480 V secondary networks. SCL will not expand the 480 V network, because of the potential for having a sustained arc at 480 V.
Spot network services to new large load buildings are normally supplied at 480 V.
SCL has high fault duty in their downtown area (100000 A).
Technology
Cable Rating
SCL has been using a mid-1990s cable rating computer product called USAmp developed by USi. Within this software, SCL maintains a file containing cable specifications. The software enables planning engineers to specify the Rho (ρ – resistivity) based on the use of concrete duct bank, the diameter and wall thickness of the duct bank, pertinent dimensions such as the distance between conductors and between conductors and the wall of the duct bank, and other components such as the load factor and design temperature. The software generates cable ratings that are used for planning. SCL is currently using a cable rating product developed by CymE. SCL will also be using ETAP, which performs cable rating as well.
Load Flow and Voltage Drop
SCL uses a load flow and voltage drop analysis software package developed in house (legacy software). The software is nodal but not graphical. To perform load flows and voltage analyses, SCL engineers can call up a feeder, enter the changes, and solve the case. The output report is tabular, not graphic. The output indicates the load flow and voltage at each node.
SCL is currently evaluating third-party-vendor-developed load flow programs to replace their existing legacy program to provide graphical displays and to address ongoing enhancement, reporting, and maintenance needs.
Network Maps and Asset Records
SCL utilizes a home-developed system called NetGIS. NetGIS is their repository for network asset records, and also the product they use to produce network maps. NetGIS is not a full, graphical GIS system with electric connectivity. Rather, it enables SCL to produce CAD maps, and to maintain records associated with each network vault. Note that their load flow analysis product is not tied in with NetGIS.
More specifically, SCL personnel can obtain maps from the system, and can click onto a vault to obtain a description of the equipment contained in the vault including:
-
Splice type and information
-
Ductbank configuration
-
Civil information
-
Ground points
-
Busbar
When a change is made to the network, the GIS section updates the network feeder maps in NetGIS.
Remote Monitoring of the Network
SCL has installed a system developed by DigitalGrid, Inc. (formerly Hazeltine, and referred to by SCL employees as “the Hazeltine System”) to monitor their network equipment. This system uses power line carrier (PLC) technology for communication. (Communication signals are sent through existing utility power cables) SCL has been using this system for years, and has some degree of remote monitoring in all network vaults.
The DigitalGrid system is used to monitor:
-
current
-
network protector status
-
voltage
-
power factor
-
digital and analog sensors
-
vault ambient air temperature
-
various flags, such as:
-
B - Network Protector Open
-
C – Transformer Oil Temp
-
E – Transformer Oil Level
-
G – Smoke (currently being piloted)
-
The system also has alarm features for current, voltage, network protector pumping, sensors, and flags, and is tied in with the Distribution Operator consoles.
SCL utilized a pilot approach to evaluating and selecting their monitoring technology. They established pilots with products from three different vendors. In the process, SCL evaluated not only monitoring capability, but also control technology, because they are interested in implementing distribution automation in their network. (More specifically, they are seeking ways to be able to remotely operate network protectors, and to shift load from one primary feeder to another.) The result of this evaluation was that the DigitalGrid system that they have in place best suits their monitoring needs. SCL is still interested in piloting network distribution automation.
Other Planning Technologies
SCL is using the EPRI PTLoad product to assist them in rating transformers.
SCL is just beginning to use a harmonics and arc flash product from SKM.
7.7.11.16 - Survey Results
Survey Results
Planning
Network Planning
(Distribution Network Planning / Planning Criteria)
Survey Questions taken from 2015 survey results - Planning
Question 37 : In your typical network design, do all primary feeders sourcing a given network originate from the same substation, or do you source networks from multiple stations?


Question 38 : Are network primary feeders planned and designed as dedicated feeders?

Question 39 : Do switch points exist on your network primary feeders for the purpose of sectionalizing a network feeder?

Question 42 : Does your design limit the number of primary feeders entering a vault or a manhole?


Question 45 : Which of the following best describes your approach to loading your network?


Question 77 : Do you have any additional network “system hardening” initiatives underway?


Survey Questions taken from 2012 survey results - Planning
Question 3.3 : In your typical network design, do all primary feeders sourcing a given network originate from the same substation, or do you source networks from multiple stations?

Question 3.4 : Are network primary feeders planned and designed as dedicated feeders?

Question 3.5 : Do switch points exist on your network primary feeders for the purpose of sectionalizing a network feeder?

Question 3.9 : Does your design limit the number of primary feeders entering a vault through a given single duct bank?

Question 3.11 : Do you have any current plans to expand the size of your network? (Increase the footprint of the territory served by the network)

Question 3.12 : Which of the following best describes your approach to loading your network?

Question 3.13 : Do you have any network “system hardening” initiatives underway?

Survey Questions taken from 2009 survey results - Planning
Question 3.4 : In your typical network design, do all primary feeders sourcing a given network originate from the same substation, or do you source networks from multiple stations? (This Question is 3.3 in the 2012 survey)

Question 3.5 : Are network primary feeders planned and designed as dedicated feeders? (This Question is 3.4 in the 2012 survey)

Question 3.6 : Does your design limit the number of primary feeders entering a vault through a given single duct bank? (This Question is 3.9 in the 2012 survey)

Question 3.7 : Do you have any current plans to expand the size of your network? (Increase the footprint of the territory served by the network) (This Question is 3.11 in the 2012 survey)

Question 3.8 : Which of the following best describes your approach to loading your network? (This Question is 3.12 in the 2012 survey)

Question 3.9 : Do you have any network “system hardening” initiatives underway? (This Question is 3.13 in the 2012 survey)

7.7.12 - Organization
7.7.12.1 - AEP - Ohio
Planning
Organization
People
Planning for the areas of this urban underground network immersion study, AEP Columbus and Canton, Ohio, is performed in Columbus by the AEP Network Engineering group, which is organizationally part of the AEP parent company. Within the Network Engineering group, the company employs two Principal Engineers and one Associate Engineer to facilitate network underground planning for the Columbus and Canton urban underground networks. These planners are geographically based in downtown Columbus at its AEP Riverside offices. While the Columbus-based Network Engineers are responsible for network planning for all of Columbus and Canton, they are occasionally called upon to assist in distribution planning for areas just outside these urban areas in other parts of the AEP Ohio system, such as Gahanna. The Network Engineering group reports to the AEP Network Engineering Supervisor, who in turn reports Distribution Systems Planning Manager. Distribution Systems Planning reports to the Director of Engineering Services who in turn reports to the AEP Vice President of Customer Services, Marketing and Distribution Services. The AEP Network Engineering Supervisor, Distribution Systems Planning Manager and AEP Vice President of Customer Services, Marketing and Distribution Services support all AEP network planning throughout its operating companies, including companies located in Texas, Indiana, Michigan, Oklahoma, and other locations.
Two Principal Network Engineers primarily oversee the planning for Columbus networks; one Associate Network Engineer primarily oversees Canton, but often helps with Columbus-based projects. The Network Engineers are responsible for all aspects of the planning, from inception through project completion, including design, work orders, material acquisition, site inspections, and implementation.
AEP also has a Network Standards Committee, headed by the lead Network Engineering Supervisor in its downtown Columbus offices, and comprised of representatives from all AEP operating companies. This group works closely with the parent company’s Distribution Services organizations, and holds regular teleconference sessions on network findings, “lessons learned” in the field, and discusses potential network engineering solutions to common network planning and implementation issues.
Process
The Columbus and Canton Network Engineering group completes plans for urban network distribution projects in its area that are requested by the parent company based on approved system expansion and refurbishment projects. New Columbus and Canton customer service requests for network service are also routed to the Riverside-based Network Engineering group. All network underground distribution plans are based on the company’s comprehensive Network Planning Criteria guide from the AEP parent company and its 10-year capacity forecasts (See Attachment C ). At the time of the immersion, AEP was in the process of updating its network planning criteria.
7.7.12.2 - Ameren Missouri
Planning
Organization
People
Resources in several groups perform distribution planning of the network at Ameren Missouri.
Area planning for the distribution system is the responsibility of Distribution Planning and Asset Performance. This group, led by a manager, is staffed with four-year degreed engineers, and includes the Standards Group as well as a Planning Engineering Group. Organizationally, Distribution Planning and Asset Performance is part of Energy Delivery Technical Services, reporting to a vice president.
Local distribution planning of both the network and non-network underground infrastructure in St. Louis is the responsibility of the engineering group within the Underground Division.[1] This division is led by manager, and consists of both engineering and construction resources responsible for the downtown infrastructure. The engineering group is led by supervising engineer, and is comprised of Engineers and Energy Services Consultants (commonly referred to as Estimators) who deal with planning, design, and service issues. The engineers are four-year degree positions. Energy Services Consultants have a combination of years of experience and formal education, including two year and four year degrees. Organizationally, the Underground Division is part of Energy Delivery Distribution Services, reporting to a VP.
Finally, Ameren Missouri has formed the “Underground Revitalization Department,” a team of engineers focused on researching, evaluating, and developing plans for performing capital improvements to and revitalizing downtown St. Louis, including the network. Part of this group’s role includes addressing issues such as the development and update of planning criteria for the network. Organizationally, the Underground Revitalization Department is part of the Underground Division.
[1] Note that at the time of the EPRI practices immersion, June 2011, the Underground Operating Center was part of the Archview Division. In early 2012, Ameren Missouri reorganized, making the Underground Operating Center its own division, the Underground Division. In addition, the “Underground Revitalization Department” described in this document is now a responsibility of the Underground Division.
7.7.12.3 - CEI - The Illuminating Company
Planning
Organization
People
Network Planning at CEI is performed by the Planning and Protection Section of the Engineering Services Department (CEI Planning Group). The group is part of the CEI Engineering Services department, and is led by a supervisor who reports to the Engineering Manager. The group is responsible for all distribution planning and protection, from 36kV and below. The CEI Planning Group is comprised of 4 Planners and 3 Protection Engineers. All members of the group are four year degreed engineers. The Planning Supervisor noted that he prefers candidates for the CEI Planning Group to have their Professional Engineer (PE) license, but this is not a requirement.
At any one time, the CEI Planning Group may have two or three “rotational” employees working in the department for a six month period. The FirstEnergy rotational program for engineers places newer engineering employees in four different locations and assignments for six months each over a 2 year period. Rotational engineers are part of the FirstEnergy corporate organization and are placed in rotational assignments of varying types across the FirstEnergy system. At the conclusion of their rotational assignments, employees are placed in permanent positions that match their interests and aptitudes with the Company’s needs. The CEI Planning Group Supervisor noted that this program has enabled him to identify strong candidates for his group, and to expose and train all rotational employees assigned to his department in planning and protection practices.
FirstEnergy also has a corporate Distribution Planning and Protection organization responsible for providing governance and standardization to regional planning and protection groups. This group has recently produced a company wide Distribution System Planning Criteria Document.
7.7.12.4 - CenterPoint Energy
Planning
Organization
People
At CenterPoint, Distribution Planning, including network planning, is performed by the Electric Distribution Planning department (Planning group). Organizationally, this group is part of the Distribution Engineering Electric Distribution Engineering group. Note that the Planning group is not part of the Major Underground group, but assigns resources to support Major Underground.
The Planning group is not centralized. Rather, the Planning group assigns planning resources to individual regions and to support departments, such as Major Projects, or URD Design, so that the planners are physically close to the other groups they work with.
The Planning group is comprised of 21 total resources, including 2 Lead Engineers. Each of the Lead engineers has about 6 - 8 people reporting to them. These people are either 4 year degreed engineers, or technical experts. CenterPoint aims to have a balance between Engineers and Technicians. The department manager noted that the Planning group positions are often entry level engineering positions, and these engineers end up leaving the department for other opportunities.
In addition the Planning group has a Lead Engineer Specialist, who leads a computer support group comprised of 6 resources. These folks work with systems such as CymE, Microstation, LD Pro, etc.
CenterPoint estimates that about 1.5 full time equivalent resources focus on planning work for the Major Underground Group. One planning resource, an Engineering Specialist, is assigned full time to work in Major Underground. He is a “matrix” employee, with a dotted line reporting relationship to Major Underground. CenterPoint believes that positioning an individual into the Major Underground group has led to efficient communications, and strong working relationships. This individual is the “eyes and ears” for the Planning group in Major Underground. He does the bulk of the planning work in the “dedicated [1]” underground system, and works closely with the Major Underground engineers to perform network system analyses.
CenterPoint encourages its engineers to obtain their PE license. The PE license is required to become a Senior Engineer.
[1] The term “dedicated” underground at CenterPoint refers to three phase infrastructure is located entirely underground in their ducted manhole system. A “dedicated” network feeder does not mean that the feeder serves only a network; rather, it refers to a feeder that is entirely fed underground. In fact, at CenterPoint, feeders that supply the underground network also supply radial load along the way.
7.7.12.5 - Con Edison - Consolidated Edison
Planning
Organization
People
Con Edison’s overall Network Organization includes:
-
Engineering and Planning Responsibilities include Energy Services, Distribution Engineering, Operations Services, Marketing and Sales, Planning and Analysis, and D.C. Elimination.
-
Construction
Responsibilities include Construction Management, Construction Services, Public Improvement, Substation and Transmission Construction, Administrative Services, and Environmental, Health and Safety (EHS) and Training.
-
Central Engineering Responsibilities include Civil / Mechanical Engineering, Control Systems Engineering, Design Engineering, Electrical Engineering, Equipment and Field Engineering, and Environmental Engineering & Program Support.
-
System and Transmission Operations Responsibilities include Financial Planning, Environmental and Safety Monitoring and Compliance, Transmission Planning, System Operation, and Transmission Operation.
-
Substation Operations
Responsibilities include Substation Planning, Environmental, Health & Safety, Protective Systems Testing, and Substation Operations.
-
Electric Operations Responsible for Con Edison’s Operations Centers including Manhattan, Brooklyn and Queens, and Staten Island, as well as the Transformer and Meter shops. Con Edison’s Operations Centers are responsible for Electric Construction, Electric Operations, Environmental, Health and Safety, and Financial Planning / Operations Services.
-
Purchasing Responsibilities include Minority Women Business Enterprise, Materials, Systems Support, Services, Technology and Strategic Initiatives, Construction, Major Projects, and Contractor Performance.
-
Enterprise Shared Services Responsibilities include Corporate Emergency Planning and Security, Equal Employment Opportunity Affairs, Research and Development, Facilities, Shared Services Administration, Human Resources, and Finance and Administration.
Culture
Part of the method that EPRI uses in assembling a practices summary is to visit host utilities, like Con Edison, and perform a series of interviews with personnel and conduct field site visitations. Though these visits may be brief (in Con Edison’s case, 3.5 days), in performing them, EPRI investigators often gain insights as to where utilities place importance and how employees feel about their company. Please note that the findings presented in this section (Culture) apply to all of the functions surveyed by the EPRI team: Planning, Design, Construction, Operations & Maintenance, and Safety.
EPRI investigators found Con Edison employees to be very helpful, knowledgeable, and informative. Con Edison employees showed great pride in their company, their distribution system, and their work methods. One gets the sense that everything they do has been well thought out. Con Edison has a “family” feel, with employees appearing to be focused on their work.
Con Edison has excellent documentation of work processes, guidelines, and standards. In every case where EPRI would expect to see formal documentation of a specification or procedure, Con Edison was able to produce an up-to-date document. Moreover, the standards themselves were properly aimed at their intended audience, with field guidelines including bulleted lists, tables, drawings, etc. to facilitate the use of the guideline by field employees. The EPRI investigators also noted that Con Edison has expert resources that stand behind the information in their written documentation, and revisit it to ensure its continued currency and relevance. For example, Con Edison has expert cable resources that produce their network cable specifications. These individuals stay current on cable trends and ensure that the specifications reflect the latest industry thinking.
EPRI investigators detected an environment that encourages open dialogue and exchange of ideas on issues. For example, employees offered opinions on the pros and cons of Con Edison’s practice of performing a Hi-pot test on healthy network feeders to identify weaknesses in the cable (see “ Feeder Testing ” in the Maintenance NoteBook Process section). Employees offered opinions freely on topics, even if their opinions differed from company practice.
EPRI investigators noticed a clear focus on operation of the T&D system. The tools, trucks, network equipment, training, etc. that Con Edison uses are top notch. Several Con Edison employees specifically commented on the high quality of the tools and equipment they utilize. In a visit to one of the Work Out Centers, it was evident to EPRI investigators that Con Edison gives a higher priority to investment in the distribution system, and the tools, training, and equipment to maintain and operate it, than in the Work Out Center building itself. This is not to say the building was run down; rather that Con Edison places an appropriately higher priority on investment in their distribution network than in their non-T&D facilities. One gets the sense of Con Edison being a company run by technical people who recognize it as a technical business.
EPRI investigators also noted a strong and visible focus on safety at Con Edison. In every facility that EPRI investigators visited, safety goals and performance reports were conspicuously posted. At every visited worksite, EPRI investigators noted safe work practices including traffic and pedestrian control, the use of personal protection, the wearing of safety harnesses by Con Edison workers, a lifting crane set up outside of the vaults, and continuous air quality monitoring.
EPRI investigators also noted a strong commitment to industry collaboration. The Con Edison employees interviewed showed genuine enthusiasm for participating in this practices investigation, and in sharing their work practices and expertise with others. Con Edison’s commitment to collaboration is further evidenced by their practice of making their facilities and expertise open and available to others, such as providing fault location services, and making their testing facilities and training programs available to others.
Process
Planning
Distribution System Planning is performed by the Regional Engineering departments in collaboration with the Transmission Planning group. Transmission Planning prepares a load forecast for each network and forwards this to the Regional Engineering Department. Regional Engineering then apportions the forecasted load by feeder and produces a load relief plan for each feeder.
Planning for the Future (Third Generation group (3G))
Con Edison has formed a group tasked with addressing the challenges they face in meeting their projected demand and service needs given their current system design. Con Edison refers to their current design, which is a conventional networked secondary design, as second generation, or “2-G.” The group is referred to as the “3 G” group, in that they are focused on new, third-generation system designs to meet their challenges.
Many of the challenges that Con Edison faces are similar to those faced by other network utilities. In some cases the challenges may be exacerbated at Con Edison because of their large size and physical constraints. Some of the challenges they face are the high costs of redundant systems necessary to provide N-2 levels of reliability in parts of their territory, increasing fault current, limited physical space to expand the system, low equipment utilization factors, and new load types and distributed generation.
The 3-G group is looking specifically at ways to apply technology to reduce costs by avoiding or deferring capital expansions, increase operating flexibility, and increase equipment utilization while maintaining customer reliability and service.
For example:
-
They have performed international benchmarking studies and participated in employee exchange programs with foreign utilities to identify practices used in utilities internationally to address some of the same challenges that they face.
-
They are working with the vendor community to identify new technologies, such as fast switches that can be used to transfer load between feeders beyond the substation secondary bus.
-
They are redesigning their approach to substation design, seeking to avoid building them, or building new stations in a way that makes more use of installed assets, eases congestion, and makes their construction cheaper while being capable of operating with the same reliability.
-
They are revisiting their approach to connecting new customers, seeking changes to customer connection requirements that reduce the number of customers connected from the networked secondary grid.
7.7.12.6 - Duke Energy Florida
Planning
Organization
People
Network Planning at Duke Energy Florida is organizationally part of the Power Quality, Reliability, and Integrity Group (PQR&I), which is led by a Director of PQR&I for Duke Energy Florida.
To perform planning work, the Network Planning group divides the Duke Energy Florida territory into four separate zones. The cities of Clearwater and St. Petersburg, part of the South Coastal Region, are included in one of the four zones. Every zone is assigned a Lead Planning Engineer and Senior Planning Engineer, who are responsible for all distribution planning activities within the zone.
Engineers/Planners in these zones work on Reliability as well as Planning. Because Duke Energy Florida has seen minimal capacity demand growth in its urban underground grid, Engineers in the PQR&I group spend much of their time planning reliability and infrastructure upgrades.
All Planners have four-year degrees in Electrical Engineering, a requirement for the position.
Duke Energy Florida has no written planning criteria specific to secondary network systems.
7.7.12.7 - Duke Energy Ohio
Planning
Organization
People
Distribution planning for the network underground system is performed by the Distribution Planning Organization. Distribution Planning is part of Duke Energy’s Power Delivery Engineering Organization. Duke has one Distribution Planning organization focused on its Carolina utilities, and one focused on its Midwest utilities, including Duke Energy Ohio.
Within the Distribution Planning Midwest organization, one engineer has been assigned the responsibility to focus on Duke Energy Ohio network planning. This Engineer has other duties as well, but is the point person within the Planning department for the Cincinnati network.
This Network Planning Engineer is a four year degreed engineer.
This engineer works very closely with the Distribution Design Department and the Construction & Maintenance department at Dana Avenue to plan the network.
EPRI noted a very strong working relationship between:
-
the Network Planning Engineer, part of Distribution Planning Midwest, within the Asset Management organization,
-
the Project Engineer within the Distribution Design department who focuses on Cincinnati network design issues,
-
the Supervisor, Construction and Maintenance, Dana Avenue, who focuses on C & M issues in the network and leads the field resources, and
-
the Asset Manager, part of the Duke Reliability and Integrity Group, within Asset Management, and located in Charlotte.
These four individuals work closely as a team to manage all aspects of the Cincinnati network.
7.7.12.8 - Energex
Planning
Organization
People
The Australian Energy Management Commission (AEMC) is a federal body that manages all aspects of rules within the electric power industry. The body proposes rule changes, handles rule negotiations with owners such as Energex, mandates market reforms, and publishes final rules. Utility owners must consult with AEMC on major projects greater than $5M.
The Australia Energy Regulator office enforces rules on behalf of the AEMC. As practitioners find problems with the rules, they can propose changes. To that end, owners have founded associations for representation to the AEMC on their behalf, such as Energy Networks Australia and Grid Australia.
Process
Utilities in Australia, as practitioners, have the ability to identify problems and petition for changes to rules developed by the AEMC. An example cited by Energex management was the application of the “regulatory test.” In Australia, any major project (greater than $5M) must be presented to market participants, who have the ability to identify potential solutions. So, for example, an aggregator of generation supply may vie for the opportunity to service a new load. Energex was successfully able to assure that the rules require that the level of security of any supply solution offered by a market participant be commensurate with the level of security offered by the network solution. In other words, the ability of a market aggregator to supply a potential new load must be as secure as a solution put forth by Energex that leverages the Energex network.
As a part of its regulatory requirements, each utility owner, including Energex, must prepare a Distribution Annual Planning Report (DAPR) in accordance with the requirements of Section 5.13.2 of the National Electricity Rules (NER). The information contained within the DAPR complies with the requirements of Schedule 5.8 of the NER and describes the following:
-
The power network.
-
Planning procedures and policies.
-
Summary of network reliability for the previous financial year.
-
Forecast loads and emerging system limitations.
-
Proposed solutions to system limitations.
-
Major construction activities completed or committed to in the last 12 months.
The DAPR is an essential document for Energex and any other utility on the eastern seaboard of Australia as it affects funding, approval of major projects, and forecasting both network underground and distribution projects. It is essentially a government-approved roadmap for utilities when considering projects, refurbishment, performance, and maintenance.
7.7.12.9 - ESB Networks
Planning
Organization
People
Organizationally, system planning is performed by planners within the Network Investment groups, part of Asset Investment, within the Asset Management organization at ESB Networks. In addition to Asset Investment, the Asset Management organization consists of Program Management, Infrastructure Stakeholder Management, Assets & Procurement, Finance & Regulation, and Operations Management. These groups work closely together to manage the asset infrastructure at ESB Networks.
More specifically, distribution planning is performed within two Network Investment groups – one responsible for planning network investments in the northern part of Ireland, and the other for planning in the south. Planning is performed by one HV planner and four MV planners. Most of these individuals are degreed engineers, but some are “Technologists” who have developed their expertise through field experience.
Planning standards and criteria are developed jointly between the Asset Investment group and the Strategy group, which is part of the Finance and Regulation group within Asset Management.
7.7.12.10 - Georgia Power
Planning
Organization
People
Resources in several groups perform distribution planning of the network at Georgia Power. The company has both Area Planning and Distribution Planning. Area Planners are responsible for different areas of the state, such as Atlanta, Savannah, Macon, Augusta, Athens, and Columbus and are responsible for the substations in those areas to make sure the transformers have the capacity to handle projected future loads, contingencies, etc. These Area Planners are geographically based both in Atlanta and the southern part of Georgia. Those outside of Atlanta work in offices closest to the areas they are responsible for, while three Area Planners are based out of the company’s downtown Atlanta offices and are responsible for the Atlanta Metro area and a few networks in Macon and Augusta. Organizationally, Area Planners sit outside the network Underground group, but have a dotted line reporting to senior engineers in the Network Underground group. Note that Georgia Power’s Network Underground group is semi-autonomous and acts as a division within the organizational structure of Georgia Power.
Distribution Planners, are responsible for feeder loading to the networks and work closely with the Area Planners. Basically, Area Planners are responsible for all planning operations “inside the fence” of the urban networks, while the Distribution Planners are responsible for planning operations that fall “outside the fence” of the urban network(s). The two groups work closely together.
Process
Both groups – Area Planners and Distribution Planners – work with the network engineers during the design phase of projects. Projects of $2 million or less are brought before the Regional Distribution Council for approval. Any projects that require more funding are sent to the upper management for review and funding approvals.
7.7.12.11 - HECO - The Hawaiian Electric Company
Planning
Organization
People
Network Planning at HECO is performed by Distribution Planning Division at HECO. The Distribution Planning Division is part of the System Integration Department. The Distribution Planning Division group performs all distribution planning at 46kV and below.
The group is led by a Principal Engineer and is comprised of one lead distribution engineer, and 5 Planning engineers who do all of the distribution planning work for the island of O’ahu. All of the engineers in the group are four year degreed engineers.
HECO has a documented planning criteria document. Each year, HECO planning engineers perform studies of the system using load forecasts based on historic peaks and anticipated load growth to identify places where either system loading limits are exceeded or other violations of their planning criteria are encountered. It is from this analysis that reinforcement projects are conceptualized.
Their distribution system is designed to N-1; that is, they plan their system such that all the system components, including primary feeders, secondary cable mains and taps, and transformers, are sized to be able to carry the load within specified thermal and voltage limits during peak conditions when any single component is out of service.
7.7.12.12 - National Grid
Planning
Organization
People
The Distribution Planning organization, led by a Director, performs network planning at the National Grid. Organizationally, the Distribution Planning Organization is part of Distribution Asset Management, and is comprised of resources in both a central location (Waltham Massachusetts), and distributed throughout National Grid. About two thirds of the organization is centralized, with the remaining third decentralized.
Centrally located resources include capacity planning resources who reporting to a manager, and engineering personnel, who have broad system planning and engineering responsibilities, Regionally located resources include field engineers who report to managers of field engineering for both New York and New England
The planning engineers who focus on the Albany network include a field engineer who works in the Albany office and focuses primarily on both radial and network underground systems for National Grid’s New York Eastern division, and an engineer situated in Waltham, who has network engineering responsibilities across the system. These engineers have responsibility for both network planning and network design.
Both of these engineers are four-year degreed engineers, and are not represented by a collective bargaining agreement (exempt).
National Grid has up-to-date standards and guidelines for the network infrastructure. In addition they have up-to-date planning criteria that addresses network planning.
7.7.12.13 - PG&E
Planning
Organization
People
At PG&E, network planning is performed by the Planning and Reliability department. This department is led by Principal Engineer, who is also the department supervisor. This group does distribution planning for both the network and non-network systems. There are eight engineers that comprise this department. Six focus on the radial system, and two focus on the network system.
For network systems, the two Planning engineers are responsible for both network planning and network design.
One of the two network engineers is relatively new to the department, and was assigned to receive training from the lead network engineer.
The lead planning engineer noted that PG&E does not have a design manual for the network system. There are some construction standards that have been developed for network designs, but no design standards. At the time of the practices immersion, PG&E was working on retaining the services of a retired engineer to write the design manual for networks.
Both network planning engineers are four year degreed engineers. They are represented by a collective bargaining agreement (Engineers and Scientists of California).
7.7.12.14 - Portland General Electric
Planning
Organization
People
At PGE, system planning for the network involves many departments with overlapping responsibilities and includes the consideration of facilities that customers design and own. Because the process draws together experts from many areas of the company, system planning is based upon good project management and a multi-departmental approach.
Transmission and Distribution Planning: Across PGE, the Transmission and Distribution (T&D) Planning organization oversees the planning process for network and non-network systems. The Distribution Planning Department working within this organization employs five Distribution Engineers and an experienced manager with previous experience as a network distribution engineer. A planning engineer with a four-year degree in engineering covers the Portland Service Center (PSC), which includes the network.
Distribution/Network Engineers: Three Distribution Engineers have responsibilities to provide engineering services for the underground network. These engineers also work with customers to design and operate customer-owned facilities associated with network infrastructure. The Distribution Engineers are not physically based in the PSC service center or CORE group, and are overseen by the Eastern District Central Supervisor, who reports to the Manager of Distribution and T&D Standards. The underground Distribution Engineers are qualified electrical engineers. When needed, PGE hires civil engineers to perform certain design tasks associated with the civil infrastructure, including vaults, manholes, and duct banks.
Project Management Office Group: The Project Management Office (PMO) manages the larger, more complex projects. This group, which is part of the Transmission and Distribution organization, is involved in in the early stages in coordination with System Planning, and assumes responsibility for projects once the Planning Engineers have developed a shortlist of solutions. Because of an increasing number of more complex projects, PGE is expanding its Project Management Office Group.
One project manager within the PMO has responsibility for all projects in the CORE, including complex projects such as building a new network substation. The present project manager has a Project Management Professional (PMP) certification and project management experience with another utility. The PMP designation is not necessarily a requirement for T&D project managers.
Service & Design Project Managers (SDPM): Network planning associated with customer-driven projects requires regular coordination with the customer throughout the project life. PGE has a position called a Service & Design Project Manager (SDPM), who works almost exclusively with externally-driven projects, such as customer service requests. At present, two Service & Design Project Managers cover the network and oversee customer-related projects from the first contact with the customer to the completion of the project. They coordinate with customers to assure that customer-designed facilities comply with PGE specifications.
The SDPMs can be degreed engineers, electricians, service coordinators, and/or designers. Ideally, an SDPM has an associate degree or a combination of electrical engineering experience and appropriate education. In addition, SDPMs should have proven project management skills and understand PGE and industry standards and practices. They should also have knowledge of the National Electrical Safety Code (NESC) and National Electrical Code (NEC) safety codes and the ability to use or learn the relevant information technology (IT) systems. PGE prefers a selection of SDPMs with a diverse range of experience and backgrounds.
SDPMs work on both CORE and non-CORE projects. This ensures that expertise is distributed and maintained across departmental and regional boundaries.
Process
Across its service territory, PGE operates three regions, with each further subdivided into areas. One of the areas, the Portland Service Center (PSC), services central downtown Portland, which is the location of the company’s network infrastructure. The infrastructure that the PSC manages includes a mixture of overhead and underground facilities.
The PSC territory also includes five network systems. One substation supplies three network systems, and a second substation supplies the other two network systems. Each of these substations backs up the other. The system is designed to provide N-1 contingency reliability, meaning that reliability is maintained even with the any single piece of equipment removed from service.
The network uses a delta-wye configuration, with dedicated network primary feeders. Many of the buildings in the downtown Portland area are becoming more energy efficient, and this means that PGE operates the network with lighter loads.The PGE network has had few problems with protectors pumping and challenging, although older buildings have had some issues with the lighter loading, which can cause protectors to open.
Overall, due to the multiple redundancies in the network, the system is considered very reliable.
Substation Configurations: One of the two substations, which supplies three networks, is sourced by three 115-kV primary feeders, which supply four power transformers. The substation serves both network and radial feeders. Each of the three networks is supplied by four dedicated network feeders, at 12.4 kV, with each emanating from a different bus section. Voltage regulation is performed at the bus level. One of the networks consists of only spot network loads. PGE prefers to serve spot networks with four feeders, where possible, although some spot network locations are supplied by two or three feeders. The other two networks that this substation sources contain both grid network and spot network loads
The other substation that supplies two networks is located on the other side of the Willamette River, and its feeders cross the waterway to supply downtown Portland. This is the older of the two substations. Each of the networks is supplied by four dedicated network feeders, at 11 kV, with each emanating from different bus sections. However, this substation also supplies radial load through radial feeders that emanate from the same bus sections as do the network feeders. Each feeder has its own regulator (in contrast to the other station, where regulation is at the bus level) to prevent pumping and cycling of network protectors because of voltage differences at the station. This provides PGE finer control, but limits capacity.
In the future, all loads that the second substation supplies will transfer to a new substation, which is under construction at the time of this immersion process. 12.4-kV feeders from this new station will supply networks.
Marquam Substation: PGE is constructing the new Marquam Substation, which will address a number of issues with the older substation:
- The new substation will eliminate the river crossing that the older substation used
- The new substation will have added capacity in anticipation of future load growth
- The substation solves the existing co-mingling of the radial and network feeders on the same bus
- The new facility will be able to cope with the load that the newer substation supplies when that substation is rebuilt in the future
- The new substation can serve as a backup for quickly restoring network load
The Marquam Substation will serve five separate network systems, with two of the network systems transferred from the existing older station. A third will be transferred from the newer station within 10 years. The fourth and fifth network systems are earmarked for future load growth.
Marquam getaway duct banks will consist of four 48-in. (122-cm) diameter steel casings for crossing underneath a major roadway, with the conduit emanating from the casings tied into new vaults. Each of the casings will contain fourteen 6-in. (15-cm) diameter conduits, and PGE performed studies to assure that this configuration would not lead to overheating (and thus affect cable ampacity).
The substation will supply networks with a total network load of 75 MVA for each of the five network systems. Each of the feeders supplying the network is designed to carry up to 15 MVA. Load balancing will balance primary feeders within a ± 10% tolerance. In future, additional transformers, switchgear, and other equipment will be installed at Marquam with the ability to serve up to three radial feeders, rated at 600 amps [1].
Overall, Marquam will remove some of the reliability issues associated with the 1-1 kV system supplied out of the older station. During the construction of the new substation, PGE split the existing eight feeder network system to two four-feeder systems, which will help minimize outage times during the transfer. The new design also conforms to a more-standardized four-feeder system, and will provide future back-up capability for existing substations [2].
Technology
PSS®E
PGE’s Planning Engineers use the Siemens PSS®E application, which supports electric transmission system analysis and planning, and is used for modeling and simulations. PSSE can model networks with up to 200,000 buses, and users can perform steady-state contingency analyses and test corrective actions and remedial schemes. Users can analyze balanced and unbalanced faults, as well as perform deterministic and probabilistic contingency analyses. PGE can use the system to model substation topology, and users can anticipate potential network issues and model alternatives. PSSE includes a comprehensive library.
PSSE supports a number of analyses, including:
- Power flow
- System dynamics
- Short circuits
- Contingency analyses
- Optimal power flows
- Voltage stability
The system is compatible with other systems, and add-ons support bidirectional flows and the modeling of distributed generation installations.
PSSE is presently only able to model three-phase loads, not single-phase loads. PSSE is also unable to show loops graphically and creates errors when modeling the secondary network, which has prevented development of accurate models. PGE is transitioning to CYME software, which is presently used for the radial system. To do this, PGE will use ArcGIS to model and display loops.
Geographic Information System (GIS) – ESRI ArcGIS
To support planning, engineers use ArcFM, which is built upon ESRI’s ArcGIS system. Users can access ArcGIS mapping software via a browser, desktop application, or mobile device, and organizations can share maps and data. ESRI’s system allows users to capture, analyze, and display geographical information, enabling display of maps, reports, and charts.
GIS is used to map assets and circuits, and can be linked to the customer information system and other enterprise applications. The maps provided with ArcGIS include facility maps, circuit maps, main line switching diagrams, and a service territory map [3]. Operators can use ArcGIS to schedule work and dispatch crews, and they can also locate crews and view work status and progress [4].
With ArcGIS, operators and crews can locate assets and infrastructure, as well as determine how they are connected. The view of the electrical system includes connectivity, service points, and underground assets. Crews can follow how current flows through the interconnected network and determine upstream and downstream protective devices. The GIS allows users to overlay external data, including images, county maps, and computer-aided design (CAD) files onto the map view.
The GIS includes the ArcMap and ArcFM viewer, which allows designers to use compatible work units and send these to the Maximo system. In 2017/2018, PGE will investigate processes for transferring Arc GIS information into CYME, which will require a software development from the vendor, Schneider Electric. ArcFM is built on top of ArcGIS, and the system will allow engineers to use CYME, which is presently used on the radial system, for the network.
ArcFM GIS software helps engineers design network layouts and create a package with details for relevant personnel. Schneider’s software is a map-focused GIS solution that allows users to model, design, maintain, and manage systems, displayed graphically alongside geographical information. ArcFM uses open-source and component object model (COM) architecture to support scalability, user-configurability, and a geographical database.
PGE uses an Enterprise Resource Planning (ERP) system called PowerPlan, which has an Oracle attachment named “Pace.” This system provides financial data about projects. Other technologies used for planning include SharePoint, Field View, the PGE Engineering Portal, PI ProcessBook, and the T&D Database.
- Portland General Electric, Marquam Substation Network Distribution Ductbank Casings, internal document.
- Derek Harris. 2014. PGE Stephens Network System Split Report, internal document.
- Smart Grid Report. Portland General Electric, Portland, OR: 2017. http://edocs.puc.state.or.us/efdocs/HAQ/um1657haq16327.pdf (accessed November 28, 2017).
- GIS for Electric Distribution. ESRI, Redlands, CA: 2010. http://www.esri.com/library/brochures/pdfs/gis-for-electric-distribution.pdf (accessed November 28, 2017).
7.7.12.15 - SCL - Seattle City Light
Planning
Organization
People
Organization
Network Planning at Seattle City Light is performed by the Network Design Department, which is part of Energy Delivery Engineering. See Attachment A . The Network Design Department focuses exclusively on the planning and design of SCL’s networks.
Although SCL does have a separate planning group that performs distribution planning activities for SCL’s non-network distribution system, this group does not do the planning associated with the network. All cable ratings, load flow and voltage studies, master load flow analysis, assignment of feeders to load additions, area studies, etc. associated with the network are performed by the Network Design Department staff. (Note that at the time of the EPRI practices immersion, SCL was implementing an Asset Management organization. At the time of this writing, SCL had not yet decided whether certain tasks currently performed by the Network Engineering group will be moved into the Asset Management organization.)
The Network Design Department is made up of a System Group (eight engineers) and a Services Group (eight engineers). These engineers do all of the planning and engineering for the network (the System Group), as well as interface with network customers for load additions, new loads, etc. (the Services Group). The individuals in this group are four-year degreed engineers. The senior level engineer position at SCL requires a PE license. The engineers at SCL are represented by a collective bargaining agreement (IBEW).
Culture
The Network Engineering group has a close working relationship with the Civil and Electrical construction and maintenance groups within the Area Field Operations – Network Department and the Distribution Operations Department. EPRI observed high levels of mutual respect between these groups, and high confidence by the field organizations in the planning and design decisions made by the Network Design Department.
SCL has remained committed to the network engineering department staffing levels, hiring new engineers into the network area to fill vacancies. SCL has no formal training program for network engineers. However, network engineers are sent to special classes on network equipment, etc. as part of their ongoing development.
Process
Planning Criteria
SCL has defined and documented network design criteria for Feeder Loading, Electrical System Construction, and Civil Construction (see below). SCL’s network system is designed to maintain N-1 load capability at peak load. More specifically:
Network Design Criteria for Feeder Loading
-
Load feeders to maintain N-1 load capability at peak load.
-
Limit feeder imbalance to 20% at N-0.
-
Keep load current within constraints determined by loadflow and ampacity studies for existing plant.
-
Keep load current within constraints determined by loadflow and ampacity studies for new construction.
-
Account for diversity factor during feeder loading analysis.
Network Design Criteria for Electrical System Construction
-
Allow no more than two mainstem cables from any one sub-network per MH or street vault. There may be mainstem cables from other sub-networks present (subject to the same restriction) as well as branch cables.
-
Allow no more than four lateral feeders from any one sub-network per MH or street vault. This may change as a result of studies for ampacity evaluations of feeder laterals with high loads or near steam lines.
-
Size new mainstem feeders to match substation capacity, with allowances for feeder imbalance and reliability.
-
Require two half-lapped layers of arc-resistant tape to each primary feeder in MHs and street vaults.
-
Limit DC Hi-pot testing of 15-kV class cables to a maximum of 26 kV DC and 28-kV class cables to a maximum of 47 kV DC.
-
Use VLF testing for newer cable testing if separable from older cable sections. Note: This particular requirement has not yet been implemented. SCL is still examining the merits of VLF testing for cable
-
Do not allow construction of new 480-volt secondary grid networks.
-
Use limiters on both ends of all secondary bus ties.
Network Design Criteria for Civil Construction (Street Facilities)
-
All duct banks shall be encased in concrete.
-
All new system duct banks shall have 5-inch diameter conduits for system cables.
-
Steel ducts are required for shallow construction.
-
Every effort shall be made to install new duct banks a minimum of 15 feet away from any steam logs. If new duct banks will be within 15 feet, a cable ampacity analysis is required to determine potential mitigation actions.
-
If a duct bank must cross a steam log, insulation must be applied per SCL construction guideline NDK 150.
-
Fluidized thermal backfill (FTB) or controlled density fill (CDF) may be used to backfill around encased service ducts.
-
Use only fluidized thermal backfill (FTB) around encased system ducts.
7.7.12.16 - Survey Results
Survey Results
Planning
Organization
Survey Questions taken from 2015 survey results - Summary Overview
Question 9 : Within your organization, do you have a distinct Network Engineering and Network Planning groups?

Question 10 : Which of the following functions does your Network Engineering/Planning group(s) perform? (check all that apply)

Question 11 : Within your company, how many Full Time Equivalent resources (FTE’s) make up the following functions? (Provide total FTE’s, including work performed by contractors)


Survey Questions taken from 2012 survey results - Planning
Question 3.1 : Do you have a distinct Network Planning group, or is network planning performed by a general planning organization?

Survey Questions taken from 2009 survey results - Planning
Question 3.1 : Do you have a distinct Network Planning group, or is network planning performed by a general planning organization?

Question 3.2 : How many people perform network planning at your company?

7.7.13 - Program Management
7.7.13.1 - Duke Energy Florida
Planning
Program Management
People
At Duke Energy Florida, there is a Resource Management group responsible for planning and resource support for construction, civil construction maintenance, and large project construction. The Resource Management group has an active role in larger network construction projects such as cable replacement and targeted program work.
Resource Management includes a Project Logistics and Support group that consists of two planners who oversee twelve schedulers to provide project logistics and support. The resource planners and schedulers in this group determine the resources, budget, and schedule of construction projects throughout Duke Energy Florida. The Resource Management group is a centrally located organization that supports all of the Construction and Maintenance groups throughout Duke Energy Florida.
A majority of the projects involving the network system are not handled by the resource management group. The group becomes involved in network system projects when contractors are needed or the projects are large in scope. Network supervisors will work with the schedulers to maintain work crew schedules and forecast upcoming projects and plans. The supervisor meets once a week with the Scheduler, more often if necessary.
Schedulers will help to “work the plan” for large projects, and work closely with department supervisors to determine required skill sets and ensure enough resources are assigned to a project. In addition, the Resource Management group will make sure to match the skill set of employees with work being performed. For example, historically, Network Specialist crews had been assigned to perform annual structural integrity inspections of vault infrastructure – a task which was time consuming and one that did not require the qualifications of a Network Specialist. The Network Group enlisted the services of the Resource Management group to obtain appropriately skilled alternative resources to perform those inspections, enabling the crews with electrical network experience to focus on work more suited to their skillset.
Process
All daily construction and maintenance work falls outside of the realm of the Resource Management group’s responsibility. Assignment and oversight of daily construction and maintenance work is the responsibility of the Network Group supervisor, who will also manage time sheets and projects worked for network crews.
The Network Group supervisor will meet weekly with schedulers in the Resource Management group to discuss planned work to be performed. In addition, the weekly meetings serve as an opportunity for to share schedules and ask for additional people and resources if necessary.
Larger programmatic work, such as cable replacement efforts underway in St. Petersburg, will involve Resource Management.
Technology
Most of the project planning and tracking for network work is handled with Microsoft Excel. Schedulers will use a software package called iScheduler for assignment of work. iScheduler is part of WMIS, made by Logica.
At the time of this immersion, the network system group was in the Process of incorporating its scheduling with the main operating company’s Work Management Information System (WMIS) software, in conjunction with the Resource Management organization. WMIS is developed by Logica and is designed to maintain accounting and time reporting information in one software package. The WMIS electronic workflow management software is able to assign work orders and create schedules for the network field crews.
7.7.13.2 - Energex
Planning
Program Management
People
The Program Management group at Energex is organizationally aligned with the Service Delivery group, and is led by a group manager. The Service Delivery Group is responsible for all elements of service delivery, including design, construction and operations. Program Management also works closely with Asset Management.
Members of the Program Management team include senior project managers, individuals with extensive experience who handle more complex projects. Project complexity is driven by the use of multiple work groups, difficult customer interactions, or key accounts. Most project managers have experience in the field but also have some project management qualifications.
The Program Management group also has project coordinators who manage smaller jobs. These people often come from a clerical background with project management expertise. Their expertise is more about managing personnel than solving technical problems.
Energex is looking into requiring a PMP certification for project management positions and is actively encouraging employees who have not done so to receive formal project management training.
It is the responsibility of the Program Management group to “bundle up” related projects that come from the design group and assign resources and timing for projects before handing them over to a project manager. The project manager works with the Program Management group to make certain the time, resources, and on-site work are completed according to schedule.
Process
Program Management monitors the overall work plan. As forecasted dates approach, the program management group assigns resources, and matches specific projects to the expected work in the plan.
Much work is driven by DAPR, which covers a five-year timeline. The Program Management group builds its program of work out of the DAPR. Typically funding is already approved when Program Management becomes involved. If it is a large project, like a large project within the CBD, Program Management becomes involved fairly early, as soon as the Planners begin work.
The Program Management team lines up construction resources. The group typically looks at 12-month and five-year views based on estimates of work load throughout Energex. The team constructs Gantt charts for each of the anticipated projects. Each project Gantt chart displays, based on timing, the kinds of resources that are needed, skillsets required, and the cost associated with every major activity of the project. The team can then roll all projects forward and look at resource requirements month by month and by the year for the entire company, creating an aggregate resource requirement. The Program Management office can then assess any conflicts or resource constraints and move assets and resources around and adjust timelines accordingly, based on priority.
The head of Project Management schedules work groups from day zero (present) to up to six months out. These schedules are at a very detailed level. For example, the construction for a CBD project requires specific resources, and Energex crews need to achieve specific goals at scheduled dates (milestones). Energex uses Ellipse to conduct the scheduling, logistics, and all aspects of project. Project Management also works with work group leaders when things go wrong. This tight coordination is critical because most of the CBD projects are coming out of the same pool of personnel. Unlike the Distribution group, the CBD Network groups have highly specialized people who must be accurately scheduled for maximum effectiveness.
Most of the CBD work is associated with small medium voltage transformers. These sites have a three feeder meshed supply to the customer and may include switchgear, remote control relays, or a ring main unit, depending on what the planner wants. Where the CBD is concerned, the design approach is fairly standard, but as Energex service extends to the edge of the underground network, the approach varies depending on customer requirements.
At the edge of the CBD, the service design is more customer-driven by the project timing, how much room customers are willing to allot Energex equipment, etc. The planners set up the agreement with the customer on what Energex will do, and then pass the agreed to approach to the Design group. After leaving Design, the Program Management group bundles the project and assigns it to a project manager.
The Program Management team internally monitors the performance of the project as it progresses through each step in the project life cycle. In CBD projects, because of complexity, Program Management also assigns a project manager who works with the designers. Program Management has about 35 project managers available to them who handle projects that range from normal infrastructure to CBD projects. Program Management assigns a senior project manager when multiple workgroups are involved, such as a project requiring installation of switchgear and SCADA controls, and thus, involving multiple specialized workers.
If overtime or contractor resources must be brought in to meet deadlines, the Program Management office indicates this at a macro level, but the Project Management group works out specifically what extra resources are needed, especially in the near term (0 to 6 month range). The two teams, Program Management and Project Management, then work cooperatively.
Program Management is evaluated at Energex on the basis of on-time delivery of projects, value, and cost control. When a project moves into construction phase and is behind schedule, it is the project manager’s job to request additional resources. The project manager must then meet with Asset Management and go over options for resolving the project schedule and justify additional resources, either internally or through contractors. Multiple options are discussed, and the costs for each option are outlined, both in terms of capital and personnel.
These situations are often avoided by monitoring projects at each phase. Therefore, communication between Program Management, Design, project managers, and Asset Management is essential to stay on schedule and at cost. Regardless, de-scoping of projects is sometimes necessary, especially if plans are old, if features originally planned are not needed, etc. This saves both time and money and is tracked by the Program Management group when de-scoping frees up capital and human resources that can then be allocated to other projects.
Technology
The Program Management group uses Primavera EPPM to schedule and forecast jobs well into the future. Ellipse provides the team a macro-level view of all ongoing and planned Energex projects, as well as drill down to any project’s details. Gantt charts are used by project managers, supplied by Program Managers, with two-way communication and updates to these charts as the project is under way.
7.7.13.3 - ESB Networks
Planning
Program Management
People
As part of their Asset Management organization, ESB Networks has a group focused on Program Management. This group, led by a manager, consists of a Project Owner – Asset Management, an Integrations management group for distribution and for transmission, a Unit Cost performance group, and a Business Process and Data Management group.
The Program Management group provides project oversight, management services and tracking of the network investment project portfolio. Individual projects are managed by the delivery organization, but the portfolio is managed by the Program Management group.
Project portfolio managers do not require engineering degrees, but an engineering background is advantageous in that the manager can speak the language of the engineer.
Process
The Program Management provides project portfolio management services for ESB Networks. Their work includes the following activities:
-
Monitor the project portfolio
-
Assure structures are set up
-
Assure approvals are set up
-
Ensure that projects are released/shaped and packaged in the right way
-
Report on the progress of major efforts
-
Work closely with the Finance and Regulation group on developing communication strategies, and delivering results against goals to the regulatory agency
-
Maintain an integrated standard approach across ESB Networks
The Program Management group maintains a cooperative relationship with others in the organization, as they work closely with many internal groups in managing the project portfolio.
The Program Management provides oversight of the company’s maintenance programs. In general, they develop an overall asset strategy, and define that into maintenance plans.
The group establishes maintenance approaches for equipment of a particular type. For example, for HV assets, ESB Networks has established seven different maintenance/testing approaches, depending on the particular assets characteristics. Therefore, not all HV assets are subjected to the full suite of maintenance – it depends on the asset’s characteristics.
For distribution assets, however, ESB Networks’ maintenance approach is generally to perform consistent and routine maintenance across all of the assets of a particular type. ESB Networks did cite some examples of intended targeted approaches for distribution assets, such as implementing routine cable diagnostic testing of worst performing MV feeders. In this case, however, the regulator did not endorse this approach for distribution assets.
For capital projects, ESB Networks develops and seeks to obtain regulatory approval of an overall capital investment plan that includes various categories of capital spend, including system refurbishment projects developed by Asset Managers, loading driven reinforcement projects identified by Network Investment managers, line diversion projects (relocations) and undergrounding of facilities, renewable connections, reactive work, new customer connections, etc. Often the plan includes bundled projects that require capital from different spending categories.
Technology
ESB Networks uses an SAP enterprise resource planning (ERP) system, including the Maintenance Management module, and SAP Business Warehouse. ESB Networks notes that while not best-of-breed, this system has broad integrated functionality.
For maintenance, ESB Networks uses this system to initiate maintenance orders based on certain parameters. For certain HV assets, the company has established measurement points, with threshold levels that, when exceeded, initiative high priority orders to perform maintenance.
ESB Networks uses a distribution facilities information system (DFIS), which is their distribution asset register. This system is updated nightly. Note that at the time of the practices immersion, ESB Networks was planning and upgrade to their GIS system, which would tie in with the DFIS.
7.7.14 - System Protection
7.7.14.1 - AEP - Ohio
Planning
System Protection
People
System protection for AEP Ohio is performed by the AEP Network Engineering group in tight collaboration with its parent company. The company employs two Principal Engineers and one Associate Engineer to facilitate network design, including system protection, for the Columbus and Canton urban underground networks. These engineers are geographically based in downtown Columbus at its AEP Riverside offices. Organizationally, the Network Engineering group is part of the AEP parent company and performs planning for AEP Ohio as well as provides support services to the other AEP operating companies. Columbus-based Network Engineers provide system protection in collaboration with AEP Distribution and the Network Engineering Supervisor. The Network Engineering group reports to the AEP Network Engineering Supervisor, who in turn reports Distribution Systems Planning Manager. Distribution Systems Planning reports to the Director of Engineering Services who in turn reports to the AEP Vice President of Customer Services, Marketing and Distribution Services.
AEP also has a Network Standards Committee, headed by the lead Network Engineering Supervisor in its downtown Columbus offices, and comprised of representatives from all AEP operating companies. This group works closely with the parent company’s Distribution Services organizations, and holds regular teleconference sessions on network findings, “lessons learned” in the field, and discusses potential network engineering solutions to common network planning and implementation issues. This committee can and does test and recommend system protection alternatives, such as recommending an approach for cable limiter placement or standardizing on a certain style of network protectors for the AEP networks.
The AEP Ohio underground networks are monitored at the AEP Ohio Network Operations Center at a location in downtown Columbus. Using a remote monitoring system, Network Technicians collect and monitor data from network protectors, transformers, and other vault sensors (see Remote Monitoring System ). If the network experiences any problems, service personnel are dispatched from this Operations Center to the field.
Process
Protection issues on the network system, including sizing and coordination of protective devices such as cable limiters and network protector fuses is the responsibility of the Network Engineering group.
AEP Ohio has standardized on Eaton CM52 network protectors, though it has various in-service styles of both Eaton and Richards protectors. The company utilizes cable limiters and sizes them to coordinate with the Network protector fuses.
The entire AEP Ohio network monitoring system is under refurbishment, most notably with a dual looped, redundant fiber-optic communications network that will relay information to AEP Ohio monitoring stations (See Remote Monitoring System ). Optical cabling is being installed as the CM52 network protectors and other microprocessor controls and sensors offer a wider range of information than was available on protectors the company used in the past.
AEP Ohio uses cable limiters on all its 480 secondary networks, at both ends of the mains (see Figure 1). The company also uses limiters in 216 V networks on cables sizes 250 MCM and above (though faults at 216 V will self-clear). Cable limiter application approach is documented in the AEP article, Guide to the Installation of Cable Limiters on Network Secondary and Service Cables . AEP uses the “Bussman” type cable limiters.

Figure 1:
600-V cable limiter used by AEP Ohio
For network protector relay settings, AEP Ohio uses standard settings on file, established based on recommendations by the network protector relay manufacturer for different sizes and voltages of network transformers, and whether or not it is a spot network. Protectors are routinely tested in the field and before installation.
One notable practice at AEP Ohio is its fire protection safeguards in vaults. Using the High Thermal Event System from Eaton, if the system detects a fire, it automatically trips and shuts down service to prevent fire from spreading beyond the vault. The fire guard system is installed on the high voltage primary switches.
Technology
Switches and protectors can be tripped remotely through the Network Operations room through its SCADA system. Most AEP Ohio network protectors now have electronic relays for connecting the communication wire coming out of the protector to the SCADA system. Other protectors are being actively upgraded to these microprocessor relays as the fiber-optic upgrade continues throughout the Columbus network.
Protectors are inspected and maintained on a regular basis (see Maintenance ).
AEP has issued an overcurrent protection guide that outlines general coordination issues.
AEP also uses the CYME TCC module to perform coordination studies. AEP used this technology to perform arc flash studies and to developing its network protector fuse requirements to conform to arc flash requirements.
7.7.14.2 - Ameren Missouri
Planning
System Protection
People
System protection for both the network and non-network infrastructure serving Ameren Missouri, such as sizing fuses and establishing relay settings, is performed by engineers within the System Protection group. The System Protection Group is part of Substation and Relay Maintenance, a group within Energy Delivery Technical Services at Ameren Missouri. This group provides protection for the entire company, including power plant protection, transmission and distribution.
The System Protection Group, led by a Supervisory Engineer, is comprised of 4- year degreed electrical engineers. System Protection engineers are non-union employees at Ameren Missouri.
For the urban underground infrastructure supplying St. Louis, System Protection engineers perform feeder device coordination for all 13.8kV feeders, size the fuses that protect the transformer in the indoor rooms used to service large customers radially, and establish network protector relay settings.
For network protector relay settings, Ameren Missouri uses standard settings on file, established based on recommendations by their network protector relay manufacturer for different sizes and voltages of network transformers, and whether or not it is a spot network. System Protection engineers establish the settings. Distribution Service Testers within the Reliability Support Services group perform the fieldwork.
The System Protection Group actively supports the downtown revitalization effort as needed. For example, one of the changes being considered by the revitalization group is the addition of primary sectionalizing switches (such as Vista switches) on network feeders. The group is evaluating the implications of such an addition to a protection scheme for network feeders.
Process
For network feeders, protective devices include the feeder breaker, network protectors and cable limiters installed on the secondary. Network feeders are designed without automatic reclosing. Feeders are protected with phase, overcurrent and instantaneous relaying. Ameren Missouri network feeders are fed straight off the substation bus, while radial feeders are fed through reactors to limit the fault levels for Ameren Missouri’s numerous primary metered customers. Ameren Missouri does not use primary sectionalizing switches as part of their network feeder design.
Ameren Missouri installs standard link type limiters between transformers and ring buses, and between ring buses on both ends of secondary mains. They use high capacity “sand type” limiters where they serve customers from the ring bus, and between protectors and the collector bus in a 480V spot.
For radially fed downtown customers, Ameren Missouri typically supplies either a preferred and reserve feeder scheme or a two preferred feeder scheme with a manually or automatically operated tie switch. In these designs, Ameren Missouri will specify a high side fuse in the indoor room to protect the transformer (For example, a 125 A fuse supplying 2500kVA transformer). The System Protection Group will then size these fuses.
For network protector relay settings, Ameren Missouri uses standard settings on file, established based on recommendations by their network protector relay manufacturer for different sizes and voltages of network transformers, and whether or not it is a spot network. System protection engineers report that the system is working well. Ameren Missouri does not experience problems with false trips or with protectors hanging up.
Technology
Distribution feeders are modeled in DEW. The System Protection Group will periodically (about every other year) provide source impedances to the group that maintains the feeder models. The DEW feeder models provide fault levels to the system protection group for analysis.
Ameren Missouri uses Aspen software to perform coordination. Aspen contains relay curves, time-current characteristics for primaries fusing, etc.
A the time of the practices immersion Ameren Missouri was analyzing the implications of changing standards around arc flash on protection, particularly in spot networks.
7.7.14.3 - CEI - The Illuminating Company
Planning
System Protection
People
System protection at CEI is performed by 3 Protection Engineers in the Planning and Protection Section of the Engineering Services Department (CEI Planning Group). All members of the group are four year degreed engineers.
FirstEnergy also has a corporate Distribution Planning and Protection organization responsible for providing governance and standardization to regional planning and protection groups. This group is currently working on developing company wide Distribution System Protection Philosophy document.
Process
The CEI Planning group is responsible for performing the analyses to determine appropriate protection. For example, it is this group that will determine and provide the settings for new, electronic relays being installed in network protectors.
Technology
Network Feeders are protected with phase and ground overcurrent relays with instantaneous and time delay. ( Non-directional time and instantaneous phase overcurrent relays (50/51); Time and instantaneous ground overcurrent relays (50N/51N).
CEI has decided to install electronic relays in their network protectors. These relays will modernize the infrastructure, add reliability to the network protective scheme and prepare the system for possible future SCADA interaction. These relays have been ordered, and are scheduled to be installed in 2009.
7.7.14.4 - CenterPoint Energy
Planning
System Protection
People
System protection of major underground facilities at CenterPoint is performed by the Major Underground Engineering department. Note that while CenterPoint has protective relaying employees in other parts of the company, resources to design, construct and maintain system protection for the underground are wholly contained within Major Underground.
Protection design is the primary responsibility of an engineer within the Vaults group of Major Underground Engineering. At the time of this EPRI visit, the position was vacant and the duties were being filled by the department Consulting Engineer.
Protection construction and maintenance is the responsibility of the Relay sub group of Major Underground, led by an Operations Manager. This group is comprised of a two Crew Leaders, and Network Testers, the field position at CenterPoint that constructs, maintains and tests network equipment, including implementing protection settings.
Process
The Vaults group engineer within the Major Underground Engineering department is responsible for performing the analyses to determine appropriate protection settings. The engineer works closely with the Relay Crews to develop procedures to ensure that the settings are tested thoroughly in Major Underground’s relay shop before field implementation. There is also continuous collaboration between the engineer and the relay crews whenever protective schemes are modified. The modifications are tested jointly in the relay shop by the engineers and the relay crews.
Technology
CenterPoint uses communication enabled microprocessor relaying in most locations. This includes microprocessor relays with communications within their network protectors. A network rehabilitation project began in 1999 to replace all network protectors with CMD type network protectors with communications enabled microprocessor relays.
One of CenterPoint’s ongoing concerns is that the expected shorter life of the new, battery powered devices, as compared to older electromechanical devices.
All underground feeders at CenterPoint, including Network Feeders, are set single shot to lockout. They are protected with phase and ground overcurrent relays with instantaneous tripping.
For situations where a substation transformer is highly loaded, CenterPoint has implemented programming at certain substations that will swap loads to alternate sources in the case of the loss of a substation transformer, helping them to defer the investment to increase transformer capacity. This programming, using substation relays in combination with remotely controlled devices in the field, moves loads among transformers within a station and from station to station to provide service continuity in a contingency situation during peak periods by optimizing the distribution of load among transformers. See Distribution Automation Control in Contingencies . (Note: this methodology is not used in substations feeding dedicated underground circuits.)
7.7.14.5 - Duke Energy Florida
Planning
System Protection
People
Planning does participate in establishing protection settings, but works closely with a separate Distribution Protection, Automation, and Control group that develops standard protection settings for distribution systems, including a standard protection scheme for the network. (Example, the “one shot to lockout” requirement for a network feeder). Both Planning and the Protection group are part of the Power Quality, Reliability, and Integrity Group (PQR&I).
Both the Planning and Protection groups work closely with Network Group, as much of the institutional knowledge of network protector settings is maintained by Network Specialists within the Network Group.
An Engineer within the Duke Energy Florida Standards group has developed a Secondary Networks section of the Engineering Guidelines that contains good information on network protection, and on coordination between cable limiters and the network protector relays. See Attachment C .
Process
In general, for network protector relay settings, Duke Energy Florida follows IEEE guidelines, and will work with the NP manufacturer, Eaton, to develop altered settings (such as building in a delay) when necessary to meet specific situations. The settings (overvoltage and the reverse current) of the St Petersburg NP relays are a bit different than the settings of the NP relays in Clearwater, as the two systems differ. For example, the St. Petersburg infrastructure consists of only spot networks supplied by non-dedicated feeders. Clearwater consists of spots and a grid network supplied by dedicated feeders.
As Duke Energy Florida has comingled network and non-network loads on portions of their systems in Clearwater and St. Petersburg, they have experienced issues such as protector cycling and pumping. In many cases, they have worked with the manufacturer to alter the settings to aid in these situations.
For network protectors, Duke Energy Florida uses the Eaton CM22 at 208V and the CM52 at 480V operation. All protectors are equipped with the electronic (MCPV) relays (see Figure 1). Duke Energy specifies internal network protector fuses, and sizes limiters to coordinate with the network protector.

Figure 1:
Network Protector (CM22 with MPCV relay)
Cable Limiters are installed at each secondary junction on the secondary mains on the outgoing secondary cable. In addition, cable limiters are installed at all service connections. Duke Energy Florida uses full section limiters on the street main secondary grid. Half section limiters are used on service connection junction points and are sized to match the conductor size. This is to ensure a service conductor fault will be isolated before damaging the secondary main and associated limiters. Limiters are sized such that when a primary fault occurs, the primary protection should clear before any limiters blow. For a secondary fault, the limiters should clear the fault before the network protector fuse opens.
Technology
All network vaults contain Qualitrol monitoring (see Figure 2), which includes the network transformer oil level and oil temp as well as monitoring of the sump pump oil minder system to detect, alarm, and cease pumping of water in the presence of oil in the water. This information is aggregated using the Qualitrol sensor module and fed to the Eaton VaultGard system.

Figure 2:
VaultGard and Qualitrol collection boxes mounted on vault wall
Vault information is remotely monitored using the Sensus system, which aggregates information gathered in the NP relay and in the Qualtrol sensor module through the Eaton VaultGard system, and transmits this data via cellular communications (see Figure 3), using a third party application (See Remote Monitoring).

Figure 3:
Wall mounted Antenna for communication with Sensus System
7.7.14.6 - Duke Energy Ohio
Planning
System Protection
People
Duke Energy has a System Protection group that performs protective device coordination on the network. This work includes supporting the Network Planning engineer and the Network Project engineer in sizing fuses and establishing settings for network protector relays. (Note that most network protector locations utilize standard relay settings. )
The System Protection group that supports the Cincinnati network is part of the Protection Engineering, within the Asset Management organization. The System Protection group works closely with the Network Project Engineer within Distribution Design and the Network Planning Engineer within Distribution Planning Midwest.
Network Service Persons, a field classification within the Dana Avenue Underground group, are responsible for setting the network protector relays.
Process
When load is added to the system or the feeder needs to be recorded for any other reason, the network engineer will mark up a one line drawing of the feeder with the changes and send it to the System Protection group, who is responsible to look at the implications of the changes on the protection scheme and recommend any changes.
The system protection group is also responsible for sizing current limiting fuses, usually requested by customer based on the fault current. Note that Duke Energy Ohio does not require a current limiting fuse for a customer service.
7.7.14.8 - ESB Networks
Planning
System Protection
People
System protection at ESB Networks is designed by planning engineers within the Network Investment groups – two groups responsible for planning network investments in the North and South. Organizationally, the Network Investment groups, both north and south, are part of the Asset Investment organization. In addition to the Network Investment groups, the Asset Investment organization is also comprised of a Generation Investment group and a Specifications group, each led by a manager. The Asset Investment group is part of Asset Management.
Planning and system protection is performed by one HV planner and four MV planners. Most of these individuals are degreed engineers, but some are “Technologists,” who have developed their expertise through field experience.
Planning standards and criteria are developed jointly between the Asset Investment group and the Strategy Manager, which is part of the Finance and Regulation group within Asset Management.
Process
ESB Networks has documented guidelines that restrict short circuit levels and also guidelines that affect neutral treatment. The ESB Networks underground network designs specify primary and backup protection against phase and ground faults. ESB Networks provides duplicate protection at network feeder supply points to eliminate pushing faults up to the next level. Therefore, the most critical circuits have more critical protection. ESB Networks uses secure radio communication between supply points and has both distance and differential relaying. If one protection fails, the other serves as backup protection. The designs include the following:
-
All 110-kV transformers have differential, distance relaying with back-tripping
-
38-kV uses distance relaying as well as a permissive over-reach transfer tripping
-
MV systems use overcurrent protection at the feeder source, where single-phase spurs are fused from the mainline.
-
LV systems rely on multiple protected earth grounding
ESB Networks maintains strict civil standards for underground network cable burial and protection.
LV and MV cabling is installed in red, high-impact underground PVC ducts with a 150-200 Joules rating. HV cabling is installed in red, high-impact cement-bonded high-density polyethylene (HDPE) ducts with a minimum 200 Joules rating.
To prevent accidental dig-ins, ESB Networks has begun deploying a notable two-tier marking system for its LV/MV duct-lines. At 75 mm directly above the duct-line workers lay a 2.5 mm wide tape marker. Above that, at approximately 300 mm below the surface above the duct-line, there is a 250 mm wide marker. For HV duct-lines, the company lays a 2.5 mm thick marker strip along the entire width of the trench 75 mm above the duct.
It is notable that all duct-line markers are yellow. ESB Networks has found that yellow tape markers are the most visible to any work crews that may be digging in the area of buried duct-lines.
Technology
ESB Networks uses secured radio communications between supply points.
ESB Networks is piloting the use of fiber-optic phase conductor (OPPC) cabling on the LV system. This cable can act as a phase conductor and provide an optical path for communications.
All procedures for cable duct-line burial and marking are contained in the company’s online repository for use by internal personnel and outside contractors.
7.7.14.9 - Georgia Power
Planning
System Protection
People
System protection of the network infrastructure serving Georgia Power, such as sizing fuses and determining network protector settings, is performed by engineers within the Network Underground engineering group, part of the Network Underground organization. This group provides protection engineering services for only the network underground system. Led by a Manager, the network UG Engineering group is comprised of four-year degreed electrical engineers, as well as Technicians (some, with a two year technical degree). These engineers are non-union employees.
Within the Network Underground organization, there is also a Network Operations and Reliability organization, led by a manager, and comprised of resources, such as maintenance crews, Test Technicians, who perform the fieldwork associated with network protector settings, maintenance and installation, and Test Engineers, who operate and troubleshoot the network system. Maintenance crews are staffed with bargaining unit positions. The Test Technician classification is a non-bargaining, non-exempt position. The Test Engineer is a non-bargaining position.
The network is monitored by the Network Operations staff, comprised of Test Engineers, and is comprised of four-year and two-year degreed engineers.
Process
For network protectors, Georgia Power uses both Richards and Eaton protectors. Engineers have standardized on submersible dual voltage protectors (can be set for either 208V or 480V operation.

Figure 1:
Lee Welch, GA Power, describing a network protector
Georgia Power deploys mainly Eaton CM 22 and Richards 313 and 314s, and is happy with all three products. Engineering has bought and installed a few CM 52s for trial, but are concerned with the implications of stored energy in the unit spring. Once the trial is complete and identified issues are resolved, Georgia Power may move to this model or some other similar. Electronic relays are used on all types of protectors. Some older protectors have internal fuses, but Georgia Power is moving to protectors with outside fuse boxes mounted on the top of the protectors. Current-limiting fuses are installed outside all protectors. All new 480 volt protectors have the external fuse boxes, which allow one fuse to be uncovered at a time – a precaution against phase-to-phase flash.

Figure 2:
3000 A silver sand CLF
All network protectors are connected to the Network Operations center by a SCADA system that runs on DSL, radio frequency using the Southern Link system, or fiber network connection to the center where protectors are monitored by the Network Operations staff. Remote monitoring has been in place at Georgia Power for 15 years (See Figure 3 and Figure 4.).


Figure 3 and 4:
Image from GA Power Network Control Room
For network feeders, protective devices include the feeder breaker, network protectors, and fuses installed on the secondary between the network and the customer. Current-limiting fuses are used between the collector bus and the customer’s facilities (See Figure 2). The limiters are in place mainly to protect the Georgia Power bus from customer faults, and the company does not want customers to depend on that limiter.
Georgia Power network feeders are fed by circuit breakers straight off the substation bus. Network feeders are designed without automatic reclosing, normal for an underground network design.
For network protector relay settings, Georgia Power uses standard settings on file, established based on recommendations by the network protector relay manufacturer for different sizes and voltages of network transformers, and whether or not it is a spot network. Protectors are routinely tested in the field and before installation. Georgia Power engineers report that the system is working well, and ascribe this to standardization and remote monitoring. Georgia Power experiences very few problems with false trips or with protectors hanging up.
Technology
Breakers and protectors can be tripped remotely through the Network Operations room through its SCADA system. Many protectors now have electronic MPCV relays for connecting the communication wire coming out of the protector to the SCADA system. Protectors are inspected and maintained on a regular basis, tracked by in-house maintenance software.
7.7.14.10 - National Grid
Planning
System Protection
People
System protection for the network, such as sizing fuses and establishing relay settings, is performed by planning engineers within distribution planning. This includes all protection settings including the distribution feeder breaker settings. Note that National Grid does have a protection engineering group, whose responsibility stops at the substation bus.
Process
For network feeders, protective devices include the feeder breaker, network protectors and cable limiters installed on the secondary.
Historically, National Grid Albany used cable limiters on network protector leads and on services. More recently. National Grid has been applying cable limiters to street mains in selected locations to assure that the secondary cable system can adequately clear solid faults.
National Grid’s network standards call for all new conductor installations to have limiters installed at each end of cable runs and at junction points. The cable limiters used are standard, non-replaceable type. Sand type current limiters are not used in the street grids.
Technology
A National Grid underground engineer has performed a study of the Albany network to identify locations where the secondary cable system cannot adequately clear solid faults. From this study, he has identified specific locations where corrective measures such as changing conductor size, installing cable limiters or changing transformers to increase the available fault duty can be applied.

Figure 1:
Note cable limiters on network protector leads.
7.7.14.11 - PG&E
Planning
System Protection
People
System protection for the network, such as sizing fuses and establishing relay settings, is performed by the network planning engineers. For network protector relay settings, PG&E uses standard settings (established over 30 years ago) for different sizes and voltages of network protectors. Assuming that the network protector’s breaker mechanism is working properly, if a network protector has problems closing or opening, then a distribution engineer would review the settings and ask the Maintenance and Operations Department to implement any changes.
The network planning engineers are part of the Planning and Reliability Department. This department is led by Principal Engineer, who is also the department supervisor. This group does distribution planning for both the network and non-network systems. Eight engineers comprise this department. Six focus on the radial system, and two focus on the network system.
For network systems, the two Planning engineers are responsible for distribution planning and network protection. Both network planning engineers are four year degreed engineers.
The planning engineers are represented by a collective bargaining agreement (Engineers and Scientists of California).
Process
For network feeders, protective devices include the feeder breaker, network protectors and cable limiters installed on the secondary. PG&E uses cable limiters where the secondary feeds out the street grid (limiters applied on both ends). Limiters are sized by the network planning engineer.
Network feeders in San Francisco are designed with primary sectionalizing switches[1] (manually operated, not fault sensing devices). One of the drivers for the decision to design these switches into their network feeders was have a place to sectionalize.

Figure 1:
Oil filled network primary sectionalizing switch (model used at training facility)
For example, when opening a network feeder, they may have network protectors that are “hung up”; that is, failed to open. The primary sectionalizing switches provide them an opportunity to isolate the section of the feeder where the hung up protector is located so that they can move ahead with their work assignment in the de-energized section.
The switches provide an isolation point for troubleshooting and repairing a failed cable section. In addition, the sectionalizing point minimizes the steps associated with feeder clearances as they provide the ability to take a clearance on a feeder section rather than the entire feeder.
The sectionalizing switches have historically been oil filled devices. PG&E has embarked on a program to replace these devices with solid dielectric vacuum switches in order to reduce environmental and other possible hazards associated with the gear.

Figure 2:
Solid dielectric network primary sectionalizing switch (model used at training facility)
As part of PG&E’s planned SCADA upgrade project, which will increase the level of remote monitoring and control in the network (See Remote Monitoring and Control), network protector relays are being replaced with communication enabled relays (Eaton MPCV relays).
PG&E may use a “load capacitor” on the network protector to be able to close the protector in the event of an unloaded secondary. For example, if a customer breaker opens, and the network protector (NP) is set on the automatic setting, it won’t detect any load on the secondary. PG&E will use the load capacitor to provide a “phantom load” to confirm the NP’s ability to close when set to auto, and when the customer’s load is restored.

Figure 3:
“Load capacitor” mounted on secondary used to test the auto close ability of the NP
A challenge for PG&E is that they frequently have NP’s that will not close when the circuit is reenergized. In some cases, this is caused by very light loading, but in many cases, PG&E engineers suspect a relay settings issue. One area of increased focus cited by PG&E is the proper application of the NP test kit and establishment of the settings in the proper range during protector maintenance.
[1] Note that in Oakland, network feeders are not designed with primary sectionalizing switches. This difference is due to historical differences in design and maintenance philosophies between Oakland and San Francisco. PG&E has recently assigned responsibility for planning of both networks to the network planning engineers, within the Planning and Reliability group.
7.7.14.12 - Portland General Electric
Planning
System Protection
People
Several groups are involved with system protection on the network. On the PGE system, the Substation Group and Distribution Group are different organizations with different areas of concern. The Substation Protection Department handles feeder breaker protection, and Distribution Engineers handle protector settings on the distribution system, and the coordination of settings with the feeder breaker.
Service & Design Project Managers (SDPMs) are also involved with system protection. They have a clearly defined role and work almost exclusively on external projects. Two SDPMs cover the network and oversee customer projects from start to finish, ensuring that protective systems comply with regulations and PGE specifications.
Another important role is the Special Tester, which is a journeyman lineman who has additional training and technical skills, making them an expert on network protectors and relay settings. One Special Tester that is embedded in the network CORE group checks any protective equipment before it enters service on the network.
Process
System protection begins at the network substations, where network feeders emanate from separate bus sections. In this way, the loss of a bus section causes an outage on only one feeder supplying any one network. At one of the two stations that supply the networks, PGE regulates voltage with bus regulation. At the other station, the company uses line regulation, as this station supplies both network and radial feeders from the same bus sections, and line regulation offers finer control. PGE does not experience many problems with network protectors pumping and cycling, which is symptomatic of voltage and angle differences among network feeders.
PGE supplies its networks from 12.4-kV primary feeders from one station, and from 11-kV primary feeders from another station. Its networks are delta-wye, with all network feeders dedicated to network supply. Primary network feeders are protected with instantaneous relaying. PGE uses a faster acting setting when workers are working on a feeder.
In most of its spot network vaults, PGE has installed a ground fault relay scheme that measures the neutral and ground current through a current transformer (CT). If the current exceeds a threshold, it trips all of the network protectors supplying the spot and locks them into the open position. Once this system activates, the protectors can only be closed with manual intervention. PGE installed this scheme because the primary protection scheme will not see through to a fault on the downstream side of the protector prior to the collector bus. PGE has experienced incidents in which the customer bus in front of (upstream of) the switchgear faulted, and the ground fault protection scheme worked as intended.
For the protective system to function correctly, PGE requires that the customer-side ground and neutral not be grounded on the customer side, but instead be isolated, and that it be tied in with the ground fault scheme on the vault secondary side.
In addition, most vaults also have a trip scheme tied in with thermal sensors located above the collector bus and above the transformers. This scheme also trips all of the protectors supplying the spot.
Overall, PGE’s network rarely has problems with protectors pumping and cycling. However, in older buildings, lightly loaded systems may cause the protectors to open.
On the CM52 network protectors that PGE uses, fuses are mounted externally and do not include a “visual open.” The CM52 is a dead-front protector. At the time of the immersion, PGE was considering utilizing the arc flash reduction module (ARMS) system in future spot network locations. PGE does not use remote racking as a standard.
Crews bring new protectors to the warehouse, where a Special Tester tests them. This initial quality assurance check ensures that there will be no issues when the unit is installed. In addition, the Special Tester checks the equipment before it enters service. In some vaults, network protectors are wall mounted rather than fitted to the transformer, because the facilities are older and the vault is not big enough to fit a network unit. In some of these vaults, because of space limitations, the network unit is built by banking three single-phase transformers together, and using a separate wall-mounted primary switch and wall-mounted network protector.
Technology
All PGE network protectors are either CMD or CM52 units from Eaton. Standard sizes that PGE uses are 1875 A and 2825 A units. Eaton systems have high interrupting and fault close ratings, and the components are modular and standard across the different ratings. By using the same units, PGE reduces the need for a large part inventory and additional training for technicians and crews[1].
PGE uses CM52 network protectors in 125-kV/216-kV and 277-kV/480-kV volt-Y connected secondary network systems. The systems include an air circuit breaker with an operation mechanism, network relays, and control equipment. The units are available as submersible variants, and can stand alone or be mounted on the transformer throat. Submersible units are made of welded steel, which is bonderized and painted. The network protectors include an internal window that allows crews to see the internal hardware, and the door can be hinged on either side[2].
CM52 units include externally-mounted, silver-sand fuses to interrupt fault currents if the networker fails to trip. Additional internal copper-link or lead alloy fuses can be installed inside the enclosure.
Protector Remote Monitor: The PGE network is fitted with a remote monitoring system, which is used only for monitoring and not for control. The remote monitoring system is fiber based, using the Eaton Mint II system with a PowerNet server platform interface. A fiber conversion system from H&L Instruments converts the fiber communications to the protocol used on the NPs, and vice versa.
At present, PGE uses the system only for monitoring and not for control. When clearing a feeder, crews open the feeder breaker and double check, through the remote monitoring, that the protectors are open. They also test at the substation to assure that there is no back-feed. PGE is assessing the Eaton VaultGard monitoring system to harden the system, using the looped fiber optic communications already installed throughout the downtown area. The reason for assessing VaultGard is that it is a web-based protocol with integrated software that allows a higher degree of control.
- Eaton. “CM52.” Eaton.com. http://www.eaton.com/Eaton/ProductsServices/Electrical/ProductsandServices/ElectricalDistribution/SpecialtyPowerDistributionSystems/SecondaryNetworkSolutions/CM52Protectors/CM52/index.htm (accessed November 28, 2017).
- Instructions for the Eaton Type CM52 Network Protectors 800 to 4500 Amperes. Eaton, Moon Township, PA: 2010. http://www.eaton.com/ecm/groups/public/@pub/@electrical/documents/content/ib52-01-te.pdf (accessed November 28, 2017).
7.7.14.13 - References
EPRI Underground Distribution Systems Reference Book (Bronze Book)
Chapter Section 4.5 - Primary Feeder Protection
EPRI Low-Voltage Training Material
Fuse and Cable Limiter Coordination
7.7.14.14 - Survey Results
Survey Results
Planning
System Protection
Survey Questions taken from 2018 survey results - Manhole Event Preparedness and Response
Question 17 : Do you use cable limiters in your network secondary system(s)?


Survey Questions taken from 2015 survey results - Design
Question 65 : Do you use cable limiters in your network secondary system(s)?

Question 66 : If you use cable limiters please indicate where you install them (check all that apply)


Question 67 : If you use cable limiters, do you perform a protection coordination study between the Network Protector fuse, cable limiters, and the station’s feeder relay?

Question 68 : If you use cable limiters, do you rely on the conductor to burn clear as part of your secondary network protection scheme?


Question 69 : If you use limiters, do you perform studies of anticipated bolted fault currents in the secondary to assure that faulted sections burn clear or are isolated by appropriately sized cable limiters?

Question 70 : By your estimation, what percentage of the time are cable limiters effective?

7.8 - Safety
7.8.1 - 2020 Vision Program
7.8.1.1 - Portland General Electric
Safety
2020 Vision Program
Process
Recently, PGE accepted that many of its business processes were siloed, making it difficult to view operations across the entire enterprise. The fact that the company used over 300 different software applications exacerbates this challenge. In addition, the computer solutions used were fragmented, relied on patches and workarounds, offered little consistency and flexibility, and relied upon a number of key personnel. Accordingly, PGE recently initiated a number of programs to update the information technology (IT) systems, and use technology rather than employees to perform certain key functions.
One of PGE’s programs to address the IT gap is the “2020 Vision” program, which is intended to improve the overall efficiency of the business (see Figure 1). The 2020 Program began in 2008-2009, with the intention of delivering a modern, integrated IT system able to handle increasingly complex demands. The program uses technology to streamline and facilitate core business processes by enhancing the technology infrastructure and introducing flexibility to the workforce. The program will also improve the protocols for retaining knowledge and experience within the organization. Finally, it will improve the visibility of data across the company and support better use of data and metrics for reporting and accountability.

Figure 1:
2020 Vision Program
The 2020 Vision Program is a ten-year strategy that will modernize and consolidate the technology used at PGE. Legacy systems will be replaced by enterprise applications that maximize efficiency, streamline processes, and create flexibility. The new, integrated technology platform will reduce the number of vendors and underpin future smart grid developments.
The core technologies used in the program system include:
-
Maximo Mobile and Scheduling
-
Geospatial Information System and Graphic Work Design (GIS/GWD) replacement
-
Outage Management System replacement (OMS).
-
Although PGE has reduced the number of different programs, the new systems are more complex and have additional functions, as well as a need for interfaces between systems and common data management. Cybersecurity is also an issue, with IT support required to protect sensitive data.
-
Maximo: Maximo replaces the previous work management system, supports metric-based service management processes, and provides a common asset database across PGE.
-
Geographic Information System (GIS) and Graphic Work Design (GWD): This system is intended to improve the access of field employees to important asset location information. It also allows PGE to share critical information with emergency services during an incident. The system reduces the amount of manual, paper-based work and reduces the design time for customer-requested tasks.
-
MyTime: This web-based time collection system handles time and labor data, as well as automates working rules, regulations, and union contract provisions.
-
Customer Engagement Transformation: This project is intended to replace the older customer information system and meter data management system.
T&D Transformation
T&D Transformation is a subset of the 2020 Vision Program. PGE performed an in-depth review of the best way to capture efficiencies with new software systems and improve effectiveness. The program seeks improvement in five areas:
- Employee Safety: Maximo Mobile & Scheduling supports safety, because it is possible to track and log work processes when a worker completes inspection or maintenance work, locate employees, and provide communications.
- Accountability: Teams are provided with comprehensive information, and supervisors can monitor current crew status and track work progress. This provides data about how work is performed and helps assess how it can be completed more efficiently.
- Standardization of Processes: All departments will use the same systems.
- Productivity: Streamlining work orders and sending information remotely will improve productivity by reducing travel time, allowing dynamic re-optimization of work schedules, updating work status, and updating asset information and details of work performed.
- O&M Efficiency: Maximo will allow PGE to track inventory use and find the optimum stock levels, and maximize the availability of stock for upcoming work while lowering the amount of unnecessary stock held in inventory.
Overall, the program relies upon centralization, standardization, and technological solutions to streamline workflow processes. The first phase, completed in 2012, implemented Maximo and Mobile technologies, and now supports substation operations, field employees, and back-office workers. The system uses Maximo to track work and assets, and supports Enterprise Resource Management with Logica’s Asset and Resource Management Scheduler and Field Manager. This system integrates with Maximo and other systems to support scheduling, dispatch, and updating field work progress. In 2015, PGE installed the Geospatial Information System and Graphic Work Design Applications (GIS/GWD) system, after a process of analyzing, building, and testing the system. The utility also installed the new OMS.
Next Wave Project
The Next Wave project is a subset of the 2020 Vision Project and involves Maximo 7.5, CGI Asset Resource Management (ARM) Scheduler, and CGI ARM Field Manager. The new systems will replace and enhance existing work process and asset management systems. Alongside the IT implementation, PGE has initiated a number of organizational and process changes that will improve productivity, make assets more visible, enhance workflow and monitoring, and deliver a more robust and consistent data collection process. The Next Wave Project focuses on T&D.
7.8.2 - Accident - Incident Investigation
7.8.2.1 - Ameren Missouri
Safety
Accident / Incident Investigation
People
When Ameren Missouri experiences an incident, such as a failure of a piece of network equipment, or a safety accident or near miss, they will form a post incident response team to conduct an investigation. The composition of the team performing the post incident investigation depends on the nature of the incident.
Process
After a significant safety incident, Ameren Missouri may implement a Safety Stand Down, a period of work shut down where company resources are focused on investigation and understanding what happened and implementing processes to avoid repeat incidents. Ameren Missouri successfully used the Safety Stand Down after a significant incident in early 2011 involving an electrical contact where, fortunately, no one was hurt. Following the incident, they shut down work, and implemented a two-week “safety blitz” that included a review of company safety manuals with employees, employee testing, and a review of procedures for working with energized equipment.
Post incident investigations of a failed piece of equipment may lead to changes in equipment specifications or design standards. As an example, a post incident investigation of a network transformer failure led Ameren Missouri to change their transformer specification to call for a rupture proof tank design.
Technology
Ameren Missouri publishes a monthly Incident Summary, a bulletin that describes the incident, indicates the primary and contributing causes of the incident, and summarizes the recommendations to prevent the incident from occurring in the future. The Incident Summary bulletin is posted on the Safety Bulletin board within each department.
7.8.2.2 - CEI - The Illuminating Company
Safety
Accident / Incident Investigation
People
For an OSHA recordable incident or and accident / incident where medical attention is given, CEI has a formal investigation process. This process calls for the formation of an investigation team that includes the Region Director of the region involved, the regional Safety department, the Union steward, and, sometimes, Corporate Safety.
CEI does not have a formal written process for incident investigations that are not OSHA recordable.
Process
Every incident at CEI is followed up with an investigation. The leader of the investigation team depends on the incident. The team is usually led by the department manager. Team members include individuals on the crew, supervisors, and the union steward. If the incident is OSHA recordable, the Regional Director will be involved. If someone got hurt or may have been hurt, a safety coordinator is included.
The role of the investigation team is to:
-
determine what happened; that is, ascertain the facts,
-
verify that procedures were followed,
-
view the incident as a learning situation with a focus on prevention,
-
recommend revisions to existing procedures,
-
produce a report that summarizes findings and conclusions.
7.8.2.3 - CenterPoint Energy
Safety
Accident / Incident Investigation
People
CenterPoint has a formal process for investigating an OSHA recordable accident or vehicular accident. Within five days of the accident’s occurrence, an investigation committee is formed consisting of:
-
Director
-
Manager
-
Crew Leader
-
Member of the Safety Department
-
HERO Committee Member
-
Person(s) involved
-
Peer employee
Process
Every OSHA recordable and vehicular accident at CenterPoint is followed up with a formal investigation. The investigation committee will look at the incident, ascertain the facts and summarize what happened, perform an analysis to determine whether or not procedures were followed, and develop recommendations to prevent a similar occurrence in the future.
Note that the administering of formal discipline associated with an incident is not part of the team’s role. Determining if discipline will be administered is the responsibility of management in partnership with the Human Resources department.
Technology
CenterPoint publishes and distributes a safety facts bulletin summarizing every injury and incident.
7.8.2.4 - Con Edison - Consolidated Edison
Safety
Accident / Incident Investigation
People
Environmental, Health, and Safety (EHS)
Con Edison has a centralized group Environmental, Health, and Safety group (EHS), as well as EHS personnel imbedded throughout the field organizations. Con Edison has an extensive set of procedures as well as intensive training around EHS issues.
The EHS department responsibilities include providing internal oversight and guidance on environmental, health, and safety issues; policy and procedure development; performance reporting; compliance; incident investigation; and review and approval of safety equipment.
Process
Con Edison Accident/Incident Reporting Process
Con Edison has well-documented procedures for investigating and reporting serious accidents, incidents, and other occurrences. At Con Edison, serious accidents, incidents, and occurrences are those situations that affect Company operations, threaten degradation of service to a significant number of customers, might result in media interest, or affect the Company’s image to customers, regulators, elected officials, or the public. Con Edison’s procedures define actions that must be taken and define responsibilities for executing those actions.
When a serious accident, incident, or occurrence takes place, the department involved with the event notifies a group called the Central Information Group (CIG), located at Con Edison’s Energy Control Center. The CIG, which is manned around the clock, is responsible for acquiring, and disseminating information on reportable incidents to all appropriate company organizations. The distribution of the communication depends on the type of incident. For example, if someone is injured, there would be rapid notification to a broad array of people, including senior management. For other types of incidents, the email distribution may be limited to local management.
Con Edison’s procedures define the types of incidents to be reported, including:
-
Incidents related to Transmission Capability on the Electric System are reported by the System Operator.
-
Incidents that affect the Gas, Electric, and Steam Distribution Systems are reported by the appropriate Emergency Supervisor or Responsible Party.
-
Incidents that are classified as Personal Injuries or Property Damage relating to or caused by Company Employees and/or Company Equipment are reported by the Appropriate Emergency Supervisor or Responsible Party.
- For an accident involving a serious injury or death, the CIG issues an Accident Facts Bulletin via email as soon as practical after the event.
-
Incidents classified as Civic Obligations are reported by the appropriate Emergency Supervisor or Other Responsible Parties — e.g., Fire and/or Police Department.
-
Incidents affecting the Gas or Steam Transmission System are reported by the appropriate Gas System Operator or Steam Dispatcher.
-
Incidents involving Contingencies, Low Voltage, or Customer Outages are reported by the Electric Operations Emergency Supervisor.
-
Incidents involving Steam Operations are reported by Generating Station Operations Shift Supervisors.
-
Incidents involving Oil Spills, Fires, and Hazardous Substances are reported by Substation Operations.
After a serious accident, incident, or occurrence takes place, an Incident Investigation Team is promptly formed to investigate and prepare a confidential report detailing the events that led to the incident, and providing any recommendations that emerge from the investigation. The team members, including a chairperson, are selected from multiple organizations in the Company, with at least one member who is knowledgeable of the particular operation(s) involved in the incident, one member from the Law department, one member from Auditing, and one member from the Environment, Health, and Safety department.
7.8.2.5 - Duke Energy Florida
Safety
Accident - Incident Investigation
People
When Duke Energy Florida experiences a safety related incident, such as a failure of a piece of equipment, or a safety accident or near miss, they will conduct an investigation. The first responder to incident is the Lead Professional Health and Safety Professional for the division where the incident occurred.
Process
After a significant safety incident, the Lead Professional Health and Safety Professional will begin the investigation to determine the facts of what happened, why it happened, and how to prevent a future incident similar in nature. Over time, incident investigations have become more successful as employees have seen improvements as a result of findings from prior incident investigations. The learnings from prior investigations have resulted in new procedures or engineered safeguards to protect workers in the field.
Having seen successful results from prior investigations, employees are more engaged in the incident investigation to improve overall safety for the entire company. Employees are engaged in reporting near misses as the focus is not on disciplinary action, but rather prevention of future incidents.
One example of an incident requiring investigation and resulting follow up was one where a worker who had completed performing a DC hi- pot test, shut the DC hi-pot tester off, and attempted to remove the test probe from the de-energized feedthrough with a leather gloved hand, rather than with an insulated rubber glove. He received a shock even after the machine was turned off. Unknown to the worker, there was still charge left on the cable. In response to this incident, all hi-pot test units were “red tagged” and taken out of service until updated firmware from the manufacture could be installed on the testers, which prevents shock due inadvertent bare handed contact after the machine is shut down by grounding the cable under test and bleeding off any charge.
Technology
After a safety incident has occurred, the Lead Health and Safety Professional is sent immediately to the site, documents what happened by directly interviewing crew members and supervisors, takes pictures, and files a Preliminary Investigation Report (PIR). The PIR will provide recommendations to prevent an incident in the future and is forwarded to the corporate Vice President of Safety.
7.8.2.6 - Duke Energy Ohio
Safety
Accident / Incident Investigation
People
Duke Energy Ohio performs an accident investigation to ascertain the facts associated with an accident and to identify follow-up learnings.
An accident investigation team is formed consisting of the supervisor, a union representative, the crew involved in the accident, and corporate Environmental Health and Safety (EHS).
The team is charged with developing a preliminary report within 24 hours of the accident.
Process
Duke Energy Ohio has an accident investigation form that describes the steps to take in performing the accident investigation.
7.8.2.7 - Energex
Safety
Accident / Incident Investigation
People
Improving safety is a key focus area for Energex, which is driven by the company CEO. The company has embarked upon a system wide effort to change their safety culture. In the recent past, Energex had experienced three safety incidents, resulting in worker injuries. The company is hoping to leverage the emotion from those events as a driver for changing the safety culture.
Energex has established a safety management system, which is a comprehensive framework that guides their safety approach, and addresses strategies for managing the hazards and risk associated with the design, construction, operation and maintenance of the system. Strategies such as the approach to safety training, incident investigation and response, and emergency preparedness and response, are guided by this framework.
Energex has recently reorganized their safety organization, consolidating a corporate safety group, a Service Delivery safety group, and a Power Plant Safety group to form one safety organization.
Process
In response to a safety incident, Energex conducts an incident investigation. After severe incidents, such as an electrical contact, the company suspends all live line activities until the incident is fully understood. The response to an incident depends upon the severity of the incident. Each incident is classified and the level of classification defines the response. An investigation is performed using an investigation framework referred to as the incident causation analysis method (ICAM), which is a framework for documenting incident findings. In response to employee feedback requesting more information about safety incidents in their aftermath, Energex produces an incident summary. The incident summary is communicated back to employees through an incident learning document
(See Attachment B: Share Our Learnings Sample)
Technology
Energex has an incident database, called the eSafe system, which houses summations of all safety incidents and near misses. Each day, before the field crews are dispatched to conduct the day’s work, the work leader performs a “safety catch-up,” which is a review of any previous day incidents identified through the eSafe system with the work crews. Employees sign a document, indicating that they participated in this meeting.
(See Attachment C: Daily Safety Catch-up for Field Services)
7.8.2.8 - ESB Networks
Safety
Incident Investigation
People
ESB Networks maintains a Chief Executive Safety Committee that oversees and thoroughly documents safety procedures and practices. Representatives from throughout the company rotate onto the committee to get a more complete overview of current and evolving safety practices. Incidents are investigated by the safety committee, staff members, and network safety trainers.
Process
ESB Networks has a strict code of practices of safety behavior agreed upon by all the trade unions. Staff members participate in safety incident investigations, including approaches for doing work differently throughout the network to prevent another incident of the type investigated. Near miss reports can be reported anonymously – a way in which ESB Networks believes it can capture more data – and there is no punitive action taken for reporting near misses.
7.8.2.9 - Georgia Power
Safety
Incident Investigation
People
Crew supervisors are required to document any and all accidents, incidents or injuries at the job site with forms that are kept on the crew truck(s). The injury report is then forwarded to the Safety and Health group within Georgia Power. If the incident involves failed equipment or a “near miss,” a report is filed with engineering as well, and a Test Engineer must inspect the site before work continues. Failed equipment is then systematically and safely removed and taken to the Georgia Power TestLab for analysis.
Process
In the event of an accident, even a minor one, such as a crew member pulling a muscle, a member of the Safety group fills out a first aid form which includes all information about the accident including witnesses. The crew supervisor signs the form. The injured employee, the Safety group, and the supervisor each receive copies of the signed report. The employee can then take the report to a clinic, doctor, etc. to receive treatment, and to determine if the accident is considered an OSHA-recordable event.
For OSHA recordable events, the Safety supervisor will issue a First Notification report which is distributed state-wide over the company intranet to all managers, supervisors, and crew supervisors. The managers and supervisors use this report to inform their crews and raise awareness about the incident and how it can be prevented in the future. The First Notification report then is entered into the Georgia Power electronic OSHA log. Hard copies of the form are also kept. The same procedure is followed whether the accident is preventable or non-preventable.
Georgia Power is especially vigilant about arc flash prevention. If a crew member works on an energized conductor, for example, and does not follow safety procedures, the non-compliance must be reported. All incidents that involve a flash must be reported. Not reporting a flash incident is cause for dismissal.
Managers at Georgia Power report that as a result of these stringent safety guidelines and focus on reporting, they believe that employees do report every incident, however minor, including dents to equipment, windshield cracks, etc.
Technology
Georgia Power uses a computer program called “SHIPS” to documents training and safety records of all employees. Records are kept concerning accidents, incidents and OSHA recordable events. The system serves as the permanent record of the safety and training history throughout an employee’s career.
Incidents and accidents are classified as “charged” for incidents in which an employee is responsible for the incident. The record of the incident is “charged” to the employee’s business unit, or “uncharged” if the employee is not responsible. In this way, safety becomes behavioral-based, and the Health and Safety group can analyze these incident statistics for any number of variables that might be useful in modifying safety training and/or awareness.
7.8.2.10 - HECO - The Hawaiian Electric Company
Safety
Accident / Incident Investigation
People
At HECO, Accident - Incident Investigation is administered by the Safety department.
HECO has implemented a Near Miss program that investigates serious near miss situations that could have resulted in injury or death to someone, equipment damage, or a widespread outage. The Safety department administers the Near Miss program.
Process
The crew involved in the near miss situation would notify the safety department who would work with the department involved to investigate the situation. The outcome of the investigation can result in changes in work procedures to prevent or at least minimize the potential for a similar future occurrence.
The program is non – punitive, unless there is a serious violation of the safety rules.
HECO is also focusing on changing their approach to accident and incident investigation to be more focused on prevention. This includes the development of a Near Miss program that includes investigation of “near misses” that could have resulted in either damage to equipment, outages, or injury.
7.8.2.11 - National Grid
Safety
Accident / Incident Investigation
People
Supervisors and safety professionals of National Grid perform periodic compliance assessments, which are audits to assure that company safety practices are being adhered to. The results of these audits are reviewed and trended so that the company understands what the large issues are. Smaller or less significant incidents are typically reviewed informally.
National Grid has a formal incident analysis process to be implemented following a significant incident, or a near miss with the potential of being significant. National Grid uses an incident management system (IMS) that informs supervisors of the level of severity of various incidents. For example, a supervisor may use the IMS to determine whether or not a particular near miss event requires a formal incident analysis or not.
Process
In a formal incident involving safety, the Safety Department will assign team leader to an incident review team. The team is required to complete an analysis within two weeks.
Technology
National Grid has established a telephone number for employees to use to report incidents that are significant, or near miss events that had the potential to be significant,
National Grid provides near miss cards, which employees can fill out and turn into Corporate Safety reporting near miss events. These cards are not anonymous (See Attachment I).
National Grid uses an incident management system (IMS) managed by the Corporate Safety Department.
7.8.2.12 - PG&E
Safety
Accident / Incident Investigation
People
When PG&E experiences an incident as a result of failure of a piece of network equipment, such as a transformer or network protector, they will conduct a post-failure incident investigation. This investigation is normally led by the manager of networks, the asset manager for network equipment. The manager of networks is responsible for writing the failure investigation report.
Process
PG&E documents the results of its post incident investigation in a failure investigation report. This report includes a discussion of the background, the sequence of events that led to the failure, the findings of the investigation, and specific recommendations resulting from the investigation.
PG&E has an accident investigation form and procedure that describes the steps to take in performing the accident investigation.
PG&E has developed and implemented a form to enable employees to report “near misses” or “close calls”. This is an informal program at PG&E. PG&E management acknowledged that near misses are likely underreported by the work force for fear of repercussions, and that an area of opportunity for the company would be to increase the reporting of near misses to better identify risks and implement countermeasures.
7.8.2.13 - SCL - Seattle City Light
Safety
Accident / Incident Investigation
Process
Safety Accident Investigation
SCL has a process for convening a fact-finding investigation meeting after an accident within a certain time frame. These post-accident investigations sometimes result in work practice / process changes based on lessons learned from the investigation.
7.8.3 - Arc Suppression Blankets
7.8.3.1 - CenterPoint Energy
Safety
Arc Suppression Blankets
Process
CenterPoint performs heat gun checks to identify hot spots before entering a hole, as part of their manhole - vault entry process. They may use blast blankets in areas where the heat gun checks they perform as part of their manhole entry reveal hot spots.
7.8.3.2 - Duke Energy Florida
Safety
Arc Suppression Blankets
People
Duke Energy Florida uses blast blankets in areas where they are concerned about inadvertent contact with conductors or equipment. They will hang the blankets on portable stanchions, developed by Duke Energy Florida and dielectrically certified by a third party testing company (Kinetrics). Due to the success Duke Energy Florida had with the stanchions, an article was written in Incident Prevention Magazine [1] on the development of the stanchions.
Process
Instead of wrapping rubber blankets around or on top of areas of concern, Duke Energy Florida has set up stanchions with D rings where they can hang the blast blankets to provide separation between the equipment and workers in the hole.
New work procedures require the stanchion blast blanket system be used any time a crew is working on one circuit and there is another circuit in the hole.
Technology
The stanchions are threaded tension bars designed for use in the manholes and vaults. While newer manholes are designed with the clips in the ceiling for hanging blast blankets, older manhole do not have clips, because there is uncertainty about the strength of the material behind the ceiling in which the D ring will be mounted. The advantage of the threaded stanchion system is that it can expand within the manhole or vault and it is free standing without the requirement of additional drilling.

Figure 1:
Blast blanket on stanchions
7.8.3.3 - HECO - The Hawaiian Electric Company
Safety
Arc Suppression Blankets
People
Arc Suppression Blankets are used by the Cable Splicers within the C& M Underground Group.

Figure 1:
Arc Suppression Blankets

Figure 2:
Arc Suppression Blankets
Process
Cable Splicers utilize arc flash suppression blankets to cover facilities when perform work activities that increase the potential for an arc flash, such as moving cables and splices on energized facilities.
7.8.3.4 - Survey Results
Survey Results
Safety
Arc Suppression Blankets
Survey Questions taken from 2015 survey results - Safety
Question 129 : Please indicate which of the following design, operational or work procedure changes you have implemented to address network arc flash issues


Survey Questions taken from 2012 survey results - Safety
Question 8.11 : Please indicate which of the following design, operational or work procedure changes you have implemented to address network arc flash issues


7.8.4 - Career Development Program
7.8.4.1 - Con Edison - Consolidated Edison
Safety
Career Development Program
Process
Career Development Programs
Con Edison has three distinct programs focused on career development.
The GOLD program (Growth Opportunities for Leadership Development) is the company’s main college recruitment program. The GOLD program develops high-caliber college graduates for positions of increasing responsibility and leadership within the company during the course of an 18-month period. Through a series of practical, rotational job assignments, mentoring, and senior-management guidance, GOLD program participants tackle challenging supervisory and project-based jobs that provide valuable work experience and insight into Con Edison’s practices and operations. Upon successful completion of the program, participants are poised to advance into Con Edison’s management ranks.
The Management Mentoring Program is a career development program focused on present management employees. Con Edison’s Talent Management organization facilitated the establishment of 60 one-to-one mentoring partnerships in 2007-2008. Partners were committed to positively engage in a mentoring experience from April 2007 through April 2008. Potential participants (protégés to be mentored) must be management employees in band levels 1, 2, or 3, have at least one year of service in the company, maintain performance in good standing, and obtain their manager’s approval to participate. Potential participants should be goal oriented, receptive to feedback, and willing to assume responsibility for their personal growth. Mentors are management employees in band levels 3 or 4 who have cross-functional experience and a desire to be a mentor. This program is not available to employees in the TEAM, GOLD, or summer intern programs, because these programs currently have mentors assigned within the program structure.
Con Edison’s TEAM program (Tools for Employees Advancing into Management) is a career development program designed to provide recently promoted, former weekly employees with the tools necessary to make a successful transition into a management role. The program is administered by the Employee Programs & Services section of Talent Management and has as its goal the development of candidates into skilled supervisors or individual contributors. The program helps candidates fine tune their technical and job-related skills through their daily work activities. Candidates are provided with tools and training targeted at developing their leadership skills. The program seeks to build a solid leadership strategy upon the foundation of experience and hands-on expertise that candidates have acquired in their time as members of the bargaining unit. This fusion of technical and leadership expertise is designed to create a core of skilled management professionals who will help lead Con Edison into the future.
7.8.4.2 - Survey Results
Survey Results
Safety
Career Development Program
Survey Questions taken from 2015 survey results - Safety
Question 130 : Do you require your network engineers to obtain their professional engineering (pe) license before they can move to more senior engineering positions?

Question 131 : Do you have a formalized training program for cable splicers, network mechanics and other individuals working on the network system?

Question 132 : Is advancement from apprentice to the journey worker level in a given period of time required as part of the job function (i.e. – automatic progression job)?

Question 133 : If you have an automatic progression, what is the amount of time required to achieve the journey worker level?

Question 134 : Can you briefly describe your training program for network workers?

7.8.5 - Contractor Safety Orientation and Certification
7.8.5.1 - Duke Energy Florida
Safety
Contractor Safety Orientation and Certification
People
Contractor work at Duke Energy Florida is awarded through the Resource Management group.
Process
Contractors, especially for larger projects, must go through an on-boarding process, including agreements to strictly adhere to Duke Energy Florida standards, safety practices, reporting procedures, and scheduling.
Smaller civil project contractors, on an ad hoc basis, are hired based on expertise in specialties, such as manhole covers, construction repairs, and are not subject to an extensive on-boarding process.
7.8.5.2 - HECO - The Hawaiian Electric Company
Safety
Contractor Safety Orientation and Certification
People
HECO requires all contractors to receive basic safety orientation and to be certified as having completed this training. The training is conducted by the HECO safety department.
Process
When a new contractor enters HECO, they are required to participate in a safety orientation training session. This training consists of videos that familiarize the contractor with the characteristics of HECO’s electrical system, review HECO safety rules, and remind the contractor of the devastating effects of electrical contacts and burns.
At the conclusion of the training, the contractor receives a sticker on his hardhat certifying that he has completed the safety orientation.
Contractors must comply with all HECO safety rules.

Figure 1:
Contractor Safety Orientation Sticker
7.8.5.3 - PG&E
Safety
Contractor Safety Orientation and Certification
People
PG&E normally does not supplement their native workforce with contractors to perform routine work (construction and maintenance) in the network. However they do utilize external contractors to perform certain targeted work types. For example, PG&E uses an external contractor to perform environmental cleanups of vaults and manholes.
7.8.6 - Field Safety Person
7.8.6.1 - Ameren Missouri
Safety
Field Safety Person
(Blue Hat Program)
People
Ameren Missouri has implemented a program called the Blue Hat program. In this program a union employee is given a temporary assignment to act as a liaison between the field force and senior management on issues related to safety. It is named Blue Hat, because resources assigned to this position wear a blue hard hat – a different color hat than the regular Ameren Missouri employee.
People selected for this assignment are usually employees who have demonstrated a commitment to safety. Assignments can last for one to two years.
See Organization
Process
The goal of the Blue Hat resources is to liaise with the field force on issues of safety, tools and work methods. Their first objective is to try to resolve any identified issues themselves acting as an agent for the employee within the company. Issues that cannot be resolved by the Blue Hats are elevated to management.
Technology
The Blue Hats issue periodic reports that cover topics related to tools, methods, and safety. As an example, the May 2011 issue included articles on minimizing backing accidents, on the downtown network revitalization effort, and inspecting tools. These Blue Hat reports are posted on the Underground Construction department Safety bulletin board.

Figure 1:
Blue Hat Report
7.8.6.2 - Duke Energy Ohio
Safety
Field Safety Person
(Technical Skills Specialist)
People
Duke Energy Ohio has created a position called a Technical Skills Specialist (TSS). In place at Duke about 10 years, the TSS is a position designed to work closely with the field force, familiarizing them with new equipment and tools, solving problems, addressing safety issues, and performing training, including compliance training.
There is one TSS who is focused on the network. This individual works closely with the Cable Splicers and Network Service personnel in the Dana underground group.
The TSS is an exempt employee, with the networked TSS position often being filled by a former Cable Splicer.
The TSS position is also used as a developmental opportunity for someone who is being groomed for supervision.
Process
The TSS works closely with field resources, and is typically the first person alerted of a problem or a training issue.
The TSS participates in job tailgate sessions, and spends much of his time in the field.
The TSS works closely with field resources to introduce them to new equipment types. He will often arrange for a manufacturer to come out and train employees on the use of a new tool.
Duke’s experience with this position has been positive in that this individual builds rapport with the field force and can act as a liaison between the employees and supervision.
7.8.6.3 - Georgia Power
Safety
Field Safety Person
People
The Network Underground group has a dedicated Health and Safety Advisor assigned to them, who functionally reports to the Health and Safety department at Georgia Power. The Advisor meets regularly with the larger Georgia Power Safety and Health group. The Advisor also works closely with the Storm Center and with the Cable Locating group.
In all, the Safety and Health Advisor is responsible for the training and safety management of approximately 180 people within the organization. The Network UG Manager works closely with the Safety and Health Advisor on safety and health issues related to the operation and maintenance of the network underground system throughout Georgia.
The person presently assigned to the position of advisor for the Network UG group came up from the ranks of the underground organization, serving as a Cable Splicer, so he is familiar with the unique needs and requirements for safely working in a network. The Advisor shadowed safety personnel to gain on the job training, and eventually co-chaired and chaired the safety committee while he was a Cable Splicer crew leader.
The Advisor has received formal OSHA training at Georgia Tech as well as formal training in excavating, soil analysis, and scaffolding.
7.8.6.4 - HECO - The Hawaiian Electric Company
Safety
Field Safety Person
(Work Environment Specialist (WES))
People
The Work Environmental Specialist (WES) is a position within the C&M Underground department that focuses on construction and maintenance issues, tools and equipment issues, and safety issues.
The WES position is a temporary one, with employees from field positions rotating into the department for one year terms. After one year as a WES, an employee will return to his normal, permanent field job, and another employee will assume the role as a WES. This rotational approach also enables the individual who is assigned as a WES, to take the “learnings” from that experience back into the field when he returns.
The WES position was developed in 2008 to focus on issues that affect employees. Because the position is filled with employees who come from field positions and have established relationships with co-workers, department employees feel more comfortable talking with the WES about issues of safety, tool and equipment issues, etc.
The WES acts as a liaison between the C&M Underground group and the Safety department. The WES participates on company safety teams, such as the Construction and Maintenance Safety Team, a cross functional group that focuses on safety issues at HECO.
Process
According the HECO, the WES position has had a positive impact in creating dialogue between the field force and management around safety issues. They cited several examples where changes in tools or methods were made based on feedback from employees provided to the WES. The WES will liaise with safety, equipment vendors, the Technical Services group, etc, as required to bring about change in the department.
One example of a tool change that was brought about by the WES, was the implementation of battery operated cable cutters for use by Cable Splicers. The WES helped build the business case to justify the increased cost of this tool based on an improvement in safety.
7.8.6.5 - National Grid
Safety
Field Safety Person
(Work Methods Group)
People
National Grid has group called Work Methods, part of Distribution Engineering Services. Within this group are resources assigned to various parts of the company, with one resource having responsibility for supporting Underground East.
Work Methods resources act as an interface between the field resources and the Standards and Safety organizations. The group serves as the eyes and the ears of the field force, working closely with the field, performing job audits, and writing underground operating procedures. They have built a good rapport with the field force, and thus are able to identify issues from the field and liaise between the field and office organizations.
Individuals who work in work methods normally come from the field force, and are thus familiar with construction, and its associated practices, tools, and equipment.
Work Methods resources typically spend one to two days in the office and three to four days in the field per week. They work closely with standards engineers, the safety department, field crews, and field crew supervision.
Work Methods resources contribute content to the Electric Operating Procedures (EOP), a well thought out guideline used by National Grid that describes, in detail, procedures for performing certain tasks. The EOP book is up to date, with new processes issued quarterly, and all of the contents revisited on a three-year cycle. Copies of electric operating procedures can be found on National Grid trucks.

Figure 1:
EOP Book on Truck

Figure 2:
EOP Book on Truck
Safety audits - Work Methods people perform four SUSA’s per year.
Process
This group serves as the eyes and ears of the field force, and works as an interface between the field and Standards on issues of equipment, standards, tools and practices. Work Methods plays a key role in communicating changes to the standards to field. As an example, Work Methods individuals participate in annual standards presentations that are made to the field to explain significant changes in the construction standards. Work Methods also issues utility bulletins describing changes in work practice, describing new materials or tools, or addressing safety issues. (See Safety – Utility Bulletins)
National Grid’s Work Methods group also performs periodic random post construction field audits to identify and resolve any issues with the construction standards and how they are being built in the field. They will select jobs at random, review the job design, and the “as built” construction to identify opportunities for improvement. (See Post Construction Audits for more information.)
Work Methods resources will also perform SUSA safety audits, responsible for performing four per year.
Technology
Work Methods issues utility bulletins describing changes in work practice, describing new materials or tools, or addressing safety issues. (See Safety – Utility Bulletins.)
Work Methods resources contribute content to the Electric Operating Procedures (EOP), a well thought out guideline used by National Grid that describes, in detail, procedures for performing certain tasks. Example EOP’s include:
-
Infrared Non contact Thermometer inspection requirement for UG equipment.
-
Electric training procedure for Infrared Heat Inspections.
-
Cable Installation and Removal
-
Distribution Cable dielectric testing
-
Repairing PILC 2.4- 35kv
-
Fault Locating
-
UG Inspection And Maintenance
-
Proving Cables to be De-energized
7.8.6.6 - PG&E
Safety
Field Safety Person
People
(Senior Distribution Specialist)
PG&E has a position called Senior Distribution Specialist, part of the Electric Distribution Standards Strategy group. There are five specialists in total, with one assigned to the underground. Three are assigned to specific geographic areas, and one focuses on tools and equipment.
This specialist is a subject matter expert, and acts as an interface between the Standards Department and field resources. Specialists act as the “eyes and ears” of the Standards Department, and meet with standards engineers every two months to address issues.
A senior distribution specialist is a management position. As subject matter experts, senior distribution specialist positions are filled by experienced field resources - usually individuals who have been linemen, foreman and supervisors.
Senior distribution specialists meet every other month with each other and the standards engineers to discuss and resolve underground issues.
Process
The senior distribution specialists are often the first stop for underground issues raised by the field resources. An important role is to serve as an advocate for field resources, assuring that changes are made with visibility of their impact to field resources. In this capacity, they also serve as a safety liaison, bringing safety concerns back to the organization for resolution.
Another important role is to communicate changes in materials and standards back to the field forces. As an example, PG&E field resources identified a problem with stress cone covers, used to cover cables parked on a standoff bracket within pad-mounted equipment. The covers were too large, preventing the equipment doors from being closed. In this example, the specialist worked with the manufacturer to redesign and test the redesigned stress cone cover. The specialist worked with the field force to pilot and evaluate the covers and communicated to use of the new material to the organization.

Figure 1:
Prototype Stress Cone Cover being evaluated under the leadership of the Senior Distribution Specialist
7.8.6.7 - Survey Results
Survey Results
Safety
Field Safety Person
Survey Questions taken from 2018 survey results - safety survey
Question 7 : Do you have a “safety person”, (either a fulltime safety professional or other employee assigned to a safety role) focused on the network?


Question 8 : If you have a safety person focusing on the network, is the person a full time safety professional, or another employee assigned to a safety role?


Survey Questions taken from 2012 survey results - Safety
Question 8.1 : Do you have a “safety person”, (either a fulltime safety professional, or other employee assigned to a safety role) focused on the network?

Question 8.2 : If you have a safety person focusing on the network, is this person a full time safety professional, or another employee assigned to a safety role?


Survey Questions taken from 2009 survey results - Safety
Question 8.3 : Do you have a “safety person”, (either a fulltime safety professional, or other employee assigned to a safety role) focused on the network? (This question is 8.1 in the 2012 survey)

Question 8.4 : If you have a safety person focusing on the network, is this person a full time safety professional, or another employee assigned to a safety role? (This question is 8.2 in the 2012 survey)

7.8.7 - Lead Cable Safety
7.8.7.1 - AEP - Ohio
Safety
Lead Cable Safety
People
AEP has a strong culture of safety, which is evident in its attention to safety in the work place, in its work practices, and in its approach to network design.
Process
All Network Mechanics and Network Crew Supervisors receive extensive safety training, including annual lead awareness training.
7.8.7.2 - Ameren Missouri
Safety
Lead Cable Safety
People
The Underground Construction Department consists of Cable Splicers, Construction Mechanics, and System Utility Workers. Cable Splicers and Construction Mechanics are journeymen positions.
Cable Splicers perform work with the electrical infrastructure such as making up joints and terminations, including preparing lead splices.
Note that at the time of the practices immersion, Ameren Missouri was implementing a new position, called the System Journeyman, which combines the duties of Cable Splicer and Construction Mechanic. System Journeyman are responsible for performing minor civil work such as installing cable, switching and tagging, and performing cable testing and cable splicing activities.
Ameren has in-service lead cables in their underground network system. The current standard for new cable installations is EPR insulated cables for both primary and secondary.
Process
Ameren Missouri has a 30 month mandatory progression for Cable Splicers whereby employees must move through a program of formal training, on the job training (OJT) and testing and achieve the journeyman level within this period.
Working with lead and lead splices is part of the formal training received by Cable Splicers.
7.8.7.3 - Energex
Safety
Lead Cable Safety
People
See Training / Safety Training
Process
Safety training includes practices for dealing with lead conductors. While Energex is shifting to XLPE cabling, it still works routinely with lead (PILC cables within Brisbane). The company has established work practices to minimize employee exposure to lead. Example practices include wearing gloves, not smoking at the work site, and not heating the lead to a point where it becomes a dangerous vapor. Energex believes that as long as workers work within the confines of its required practices, they are safe from lead exposure. Employees (jointers) who work with lead receive annual blood tests for lead exposure.
Technology
7.8.7.4 - Georgia Power
Safety
Lead Cable Safety
Georgia Power does deliver periodic lead awareness training.
7.8.7.5 - National Grid
Safety
Lead Cable Safety
People
National Grid Albany has in-service lead cables in their underground network system, both primary and secondary. In their primary system, the current standard for new cable installations is EPR insulated cables. For secondary, the current standard is rubber cable with the Hypalon jacket.
Working with lead and lead splices is part of the formal training received by Cable Splicers. Training programs for Cable Splicers include a specific course on lead awareness.
7.8.7.6 - PG&E
Safety
Lead Cable Safety
People
The bulk of PG&E’s underground system, both network and non network uses lead cables. For network primary feeders at 12kV, PG&E continues to use lead cables as their standard because of their reliability. However for the radial system, they are attempting to remove lead cables from the system as they fail, and replace them with XLPE insulated cables.
Training programs for cable splicers include specific courses on working with lead cable and on the safe handling of lead materials. This includes training offered as part of the Cable Splicer job progression as well as the Safety Health and Claims group.
Process
PG&E has long-standing work practices for dealing with and working around lead; however, these practices have not been formalized.
PG&E requires the use of leather gloves when working with lead but has no requirement for chemical gloves.
Technology
PG&E’s Safety Health and Claims website contains information on the safe handling of lead materials.
7.8.8 - Manhole - Vault Entry
7.8.8.1 - AEP - Ohio
Safety
Manhole / Vault Entry
People
Network Mechanics and Network Crew Supervisors are responsible for following safe manhole and vault entry procedures, as outlined in the AEP Safety Manual. AEP performs confined space entry and rescue training as part of its formal training for Network Mechanics and provides refresher training in manhole rescue annually.
Process
All AEP Ohio Service Trucks are equipped with the necessary protective gear and tools for safe entry into manholes and vaults. Prior to entering a manhole or vault, crews test the atmospheric quality in the hole by dropping a gas monitor hose into the hole. AEP uses continuous gas monitoring and may ventilate the hole if necessary (see Figures 1 and 2).

Figure 1:
Continuous air monitor (1 of 2)

Figure 2:
Continuous air monitor (2 of 2)
AEP is not performing stray voltage tests of the manhole lid. To facilitate vault entrance, AEP utilizes an extendable post technology (LadderUP) attached to the permanently mounted vault ladder (see Figures 3 and 4).

Figure 3:
LadderUP safety post (1 of 2)

Figure 4:
LadderUP safety post (2 of 2)
AEP does not tether employees or require workers to wear lifting harnesses. Rescue apparatus is available on each truck. One practice of note is the use of hand-held Infrared (IR) cameras to identify hot spots as a manhole entry procedure (see Figures 5 and 6). Workers (both AEP and Contractors) will capture cable and bus temperatures. While an entire overview of temperature conditions is tested, particular attention is focused on cable joints, where the possibility of arcing from failed joints is the greatest. The company has mandated that if there is a 40 degree differential or greater on either side of a joint, the crew is to leave the manhole or vault and call in the condition.

Figure 5:
Obtaining cable joint temperatures readings using IR camera

Figure 6:
FLIR Systems IR camera used by AEP Ohio
AEP Ohio has been using this technique for over five years, and as a result, many distribution splices have been repaired. As a result of these on-going repairs, the crews are finding fewer instances of potentially dangerous cable joints. Most of the trouble spots have been cleaned up in the last three to four years.
Technology
First aid kits and AEDs are available on all crew trucks. AEP has purchased newer IR cameras that are less likely to provide false readings than the older versions. Trucks also contain Stat X aerosol fire suppressant kits (see Figure 7).

Figure 7:
IR Camera and Stat X Fire Suppressant kit mounted on truck door panel
7.8.8.2 - Ameren Missouri
Safety
Manhole / Vault Entry
People
Ameren Missouri performs confined space entry and rescue training as part of its formal required training for Underground Construction, Distribution Service Test, and Distribution Operating workers. Refresher training in manhole rescue is offered annually.
The Underground Construction department consists of Cable Splicers, Construction Mechanics, and System Utility Workers. Cable Splicers and Construction Mechanics are journeymen positions. Cable Splicers perform work with the electrical infrastructure such as making up joints and terminations, including preparing lead splices. Construction Mechanics perform the civil aspects of the work. System Utility Workers serve as helpers to the other two positions, and perform duties such as cable pulling and manhole cleaning. Note that at the time of the practices immersion, Ameren Missouri was implementing a new position, called the System Journeyman, which combines the duties of Cable Splicers and Construction Mechanics. System Journeyman are responsible for performing cable work, civil construction, and operating network equipment.
Maintenance and operations of network equipment such as network transformers and network protectors are performed by resources within the Service Test group and Distribution Operating group.
The Service Test group is made up of Service Testers and Distribution Service Testers. Service Testers perform low-voltage work only. They focus on things such as voltage complaints, RF interference complaints, and testing and maintaining batteries. Distribution Service Testers perform network protector maintenance, transformer maintenance including oil testing, and perform fault location. It is the Distribution Service Tester position who works routinely with network infrastructure.
The Distribution Operating group is made up of Traveling Operators, who perform switching on the system, including placing tags and obtaining clearances, and act as first responders and troubleshooters.
Process
Ameren Missouri performs a series of inspections when entering a manhole. After removing the lid, crews tests the atmospheric quality in the hole by dropping a gas monitor into it. Ameren Missouri field crews test air quality every time a man enters a hole, and use continuous air monitoring while men are working in a hole. Ameren Missouri may use ventilators to flush the vault with fresh air. An example situation where forced ventilation is utilized is when working in a hole where the manhole temperature is very high, impacted by adjacent steam lines.

Figure 1:
Gas monitor

Figure 2:
Vault Ventilation (Heat Shrink Splicing)

Figure 3:
Vault Ventilation (Heat Shrink Splicing)
On entering the manhole or vault, the crew will do a quick visual inspection of the interior, including the electrical components within the vault. Crews will complete a Network / Radial Vault Entrance & Condition form, documenting their visual inspection findings.
Ameren Missouri uses a manhole rescue apparatus set up over manholes, and requires employees to wear harnesses and be tethered (rope tethers) to the lifting apparatus when working in manholes. If an employee has to move to an area in the manhole where he feels he is unsafe, he can disconnect from the tether - but in general employees stay tethered. The tether is connected to the lifting apparatus with a piece of electrical tape that is designed to separate in the unlikely event of a vehicle striking the lifting apparatus, thus protecting the worker from injury in such an event.
Ameren Missouri uses either a 10 ft or 14 ft fiberglass ladder to enter the manhole. They allow the ladder to remain in the hole while working unless the hole is too small to accommodate both the ladder and the worker(s).

Figure 4:
Lifting Apparatus

Figure 5:
Lifting Apparatus (note use of electrical tape to affix the tether (rope) to the apparatus)
For vault entry, Ameren Missouri has developed a novel lifting tool for lifting the vault hatch that minimizes the loading on the worker’s lower back. This device has an ergonomically shaped handle and rotating hooks for attaching to various grate configurations.

Figure 6:
Lifting Tool for Vault Grate

Figure 7:
Lifting Tool for Vault Grate

Figure 8:
Lifting Tool for Vault Grate

Figure 9:
Lifting Tool for Vault Grate

Figure 10:
Lifting Tool for Vault Grate
Ameren Missouri is not requiring tethering or lifting harnesses for workers who enter vaults. This is, in part, due to the vault entrance design which includes a pull – out access and protection apparatus referred to as either the “safety basket” or the “cage”. The “cage” is a device that is raised above the vault entrance, and is used to ease vault ingress and egress by providing a hand rail for moving on or off the vault ladder, and for work area protection, by preventing either pedestrians or workers from accidentally falling into the hole.

Figure 11:
Ameren Missouri worker lifting the cage

Figure 12:
Ameren Missouri worker lifting the cage

Figure 13:
Typical vault entrance - Ameren Missouri

Figure 14:
Typical vault entrance Note permanently mounted ladder
Vault ladders are permanently mounted to the vault wall.
Technology
Ameren Missouri trucks are equipped with first aid kits.
7.8.8.3 - CEI - The Illuminating Company
Safety
Manhole / Vault Entry
People
Underground Electricians are responsible for establishing a safe work zone, and performing all required safety steps associated with manhole / vault entry. EPRI observed strong attention to work zone safety at all site visits.
Process
CEI tests air quality every time a man enters a hole, and uses continuous air monitoring while men are working in a hole. EPRI observed that these monitoring devices are positioned in the hole as opposed to just outside the hole.
CEI requires all workers to wear harnesses. A lifting crane is set up outside the hole to perform manhole rescue in case of an emergency. Workers are not tethered while working.
Note: The lifting crane is not required for short-duration tasks.
Technology
CEI has recently purchased new Air Quality monitoring devices. Industrial Scientific Model Number ITX. These are battery powered units and are connected to a docking station every evening to charge and calibrate.
7.8.8.4 - CenterPoint Energy
Safety
Manhole / Vault Entry
People
Major Underground crews are responsible for establishing a safe work zone, and performing all required safety steps associated with manhole / vault entry.
Process
CenterPoint tests air quality every time a man enters a hole. They utilize monitors that test for oxygen levels as well as the presence of three different gases. CenterPoint does not use continuous monitoring; rather, they will ventilate a hole during the performance of any work, including inspections.
CenterPoint also performs heat gun checks to identify hot spots before entering a hole. They may use blast blankets in areas where the heat gun checks they perform as part of their manhole entry reveal hot spots.
CenterPoint requires a lifting device and harnesses for manhole rescue to be present at each work location. CenterPoint does not require workers to wear a harness while working. All crew members are required to have annual training in manhole rescue.
Technology
CenterPoint is using Multi-Gas Detectors with Data Logging Software. These monitors perform a “pretest” evaluation that notifies the user if the unit needs to be recalibrated and recertified.

Figure 1:
3M 740 Multi Gas Detector
7.8.8.5 - Con Edison - Consolidated Edison
Safety
Manhole / Vault Entry
Process
Network Protector Vault Entry
When Con Edison employees enter a network protector vault in a building, it is their practice to first open the doors connecting multiple vaults so that they have access to multiple paths for exit in the event of an emergency.
Manhole Entry
Con Edison crews take a stray voltage reading whenever they enter or leave an underground structure. They use a proximity tester; then if there is a problem, they use a fluke meter to further diagnose. Often, to remedy stray voltage, they cut cable.
Con Edison is using continuous air quality monitoring. In the past, crews tested air quality upon entry, exit, and every two hours. Their current practice is to monitor continuously.
The units used to monitor air quality are self-diagnosing, meaning that they alarm if they malfunction. The units are recalibrated every two months.
One challenge that they face is the battery life of the units for longer jobs.
Con Edison requires all workers to wear harnesses. A lifting crane is set up outside the hole to perform manhole rescue in case of an emergency. (The lifting crane is not required for short-duration tasks.)
7.8.8.6 - Duke Energy Florida
Safety
Manhole - Vault Entry
People
Organizationally, Duke Energy Florida field resources that construct, maintain, and operate the urban underground and network infrastructure fall within a specific Network Group which is part of the Construction and Maintenance Organization. The Network Group is led by a supervisor who reports to the Region General Manager. The group consists of ten craft workers, five Electric Apprentices and five Network Specialists (the journey worker position), all part of the Network Specialist job family.
The Network Specialist is a jack-of-all-trades, responsible for all facets of UG work, including cable pulling, splicing, and maintaining and operating equipment such as cables, joints, network switches, transformers and network protectors. Network Specialists also work with the installation and maintenance of automation associated with the equipment they manage.
Electrician Apprentices are the entry level position in the Network Group. Electrician Apprentices provide assistance to Network Specialists while receiving on the job training. In addition, Electrician Apprentices with proper training are able to prepare cable splices excluding splices on lead and submarine cable.
Manhole Safety and Rescue Standards at Duke Energy Florida are established and monitored by the Lead Health and Safety Professional for the South Coastal Zone.
Process
Duke Energy Florida crew leaders perform thorough job briefings (tailboards) at the beginning of each work day or new job (see Figure 1). Every time a job site briefing is conducted, topics discussed are checked off and notes are recorded on a Tailboard Sheet see Figure 2). Elements of the tailboard session include:
-
Identification of the crew leader for the tailboard and job
-
Job location and address are reviewed
-
Crew qualifications and familiarity with tools are confirmed
-
Work and safety procedures are reviewed (including manhole entry procedures)
-
Crew members sign the tailboard sheet documenting their participation
In addition to the tailboard topics listed above, crews will review what to do if a medical emergency occurs. The location of the nearest hospital is provided and a crew member is designated as the person to call 911 if there is an emergency. Duke Energy Florida’s protocol is to call 911 first and then call the dispatcher. All company radios have an emergency call button with a direct radio connection to the dispatcher.
At the end of the day, a post job tailboard is held with the crew to make sure all switching is complete, grounds removed, and clearance tags have been removed. During the post job tailboard, lessons learned are discussed and the crew discusses the safest route to exit while addressing any obstructions or stationary objects that might impede a safe exit. The crew leader performs a full inspection of the job site to make sure conditions were restored to normal, no tools were left behind, and all equipment/cables are in safe configuration with proper tagging if work was not completed.

Figure 1:
Job site tailboard discussion

Figure 2:
Job site tailboard sheet
Personal Protective Equipment (PPE)
All work crews are equipped with the following PPE:
-
Fire retardant (FR) clothing (8-12 Cal, 65 Cal for 480V spot networks)
-
FR high visibility safety vest
-
Harnesses
-
Steel toed boots
-
Rubber gloves
-
Leather work gloves
-
Safety glasses
-
Hard hats
All PPE equipment is thoroughly inspected every six months, and is inspected daily at all job sites. As a safety precaution, all employees at the job site are not allowed to wear jewelry.
Before entry into the manhole/vault, a continuous gas monitor is placed into the hole to constantly monitor the air quality and gas levels inside the hole as crews are working. Alternatively, crew members may wear personal gas detection monitors. The continuous gas monitors are calibrated every day (see Figure 3). If necessary, under direction of the crew leader, the hole will be ventilated with forced air during certain situations (see Figure 4). In addition, new work procedures require an infrared (IR) inspection prior to commencing work in the hole.

Figure 3:
Continuous gas monitor - Altair 4X Multigas Detector

Figure 4:
Manhole ventilation
At Duke Energy Florida, all employees entering a submersible manhole or vault wear a harness and are tethered. Workers are tethered to a tripod mounted rescue apparatus (Sentry RS3 by Gemtor [1], Figures 5 and 6) that is tested and recalibrated annually, or anytime load is placed on the rescue device. A calibration sticker is affixed to the tripod to indicate the last calibration date. In the event that a rescue is performed, the harness used is replaced.
An acceptable alternative at Duke Energy to using tethering is to utilize a SCUBA system with an oxygen pack to perform manhole rescue. Use of the SCUBA system requires workers to remove facial hair.

Figure 5:
Rescue apparatus including tripod

Figure 6:
Sentry RS3 Personal Fall Arrest Device by Gemtor
Manhole/Vault Rescue
As previously stated, all entry personnel are fully tethered at Duke Energy Florida. There is a crew member observer at the top, outside of the hole. If the outside observer is required to retrieve equipment or a part from the truck for crew members in the hole (and thus called away from his duties as an observer), the crew will perform an “all stop” in the hole. Once an “all stop” is called, the worker in the hole stops all activities and moves to the ladder in preparation to exit in the event of an emergency. Once the material is lowered down to the crew member below, work can resume.
If an emergency occurs, crews are trained to call 911 immediately. Because crew cell phones are equipped with GPS, the 911 call is the fastest way to receive outside assistance to a location.
In the event of a flash or fire, observation crew members:
- Do not enter the hole under any circumstances
- Call 911
- Make a call to Dispatch
- The tethered employee(s) inside the hole is pulled out
Annually, all crew members receive refresher training in manhole rescue procedures at a vacant manhole. During this full day training session, crew members are also trained in arc flash, manhole fire, and other emergency rescue procedures.
Switching and Tagging
Switching is performed by crew members (Network Specialists of Electrician Apprentices) with field direction from the Network Specialists who will hold the clearances. Crew members carry a switch book where all switching orders are written down. The switching orders will identify all of the switching steps including:
-
Who performs the switching
-
What device is operated
-
Where the location of the device to operate is located
-
When will the device will be operated (in operational order)
While performing a switching order, crew members use three-way communication with dispatch. The crew member will record what the dispatcher tells him verbatim in his switch book and then he will read the information back to the dispatcher. After the crew member has read the switching step to the dispatcher, the dispatcher will confirm that it matches what is on his switching order. Only after confirmation, the dispatcher will issue the clearance number and allow the crew member to operate the device.
All switchers must be on the approved switching and tagging list. Every two years, all Network Specialists and Electrician Assistants take a switching and tagging procedure training course.
Another standard safety procedure prior to entry into a manhole/vault is to establish a protection “hotline”. The “hotline” is a safety related protection setting for the substation feeder breaker to reduce the duration of the instantaneous trip from the normal setting of 30 cycles to 6 cycles, so that if a fault occurs while a man is in the hole, the fault will clear more quickly. The “hotline” clearance is tagged to the crew leader, who designates the person working in the hole as an alternate clearance holder. The hotline clearance is obtained for every energized primary network feeder in the manhole.
Technology
Blast Blanket Stanchions
Duke Energy Florida uses blast blanket stanchions (shown in Figure 7) in areas where they are concerned about inadvertent contact with conductors or equipment. Instead of wrapping rubber blankets around or on top of areas of concern, Duke Energy Florida has set up stanchions with D rings where they can hang the blast blankets to provide separation between the equipment and workers in the hole. The stanchions were developed by Duke Energy Florida and dielectrically certified by a third party testing company (Kinetrics). Due to the success Duke Energy Florida had with the stanchions, an article was written in Incident Prevention Magazine [2] on the development of the stanchions.
The stanchions are threaded tension bars designed for use in the manholes and vaults. While newer manholes are designed with the clips in the ceiling for hanging blast blankets, older manhole do not have clips, because there is uncertainty about the strength of the material behind the ceiling in which the D ring will be mounted. The advantage of the threaded stanchion system is that it can expand within the manhole or vault and it is free standing without the requirement of additional drilling.
New work procedures require the stanchion blast blanket system be used any time a crew is working on one circuit and there is another circuit in the hole.

Figure 7:
Blast blanket on stanchions
Manhole Prints and Information Sheets
Duke Energy Florida maintains thorough manhole prints. The manhole prints are printed in color with the primary feeders shown in color while secondaries are shown in black ink. (See Attachment E ).
The manhole prints show the facilities that are placed on each wall. The manhole prints provide detailed and accurate dimensions including manhole depth, the position of the racks on the wall, and cable position. Each wall is laid flat on the drawing itself. If you were to take a scissors, cut the walls, and fold the walls up towards you, you would have an accurate depiction of being inside the manhole. Manhole prints can be printed on request for field projects. The manhole prints are also accessible via the corporate GIS system and can be saved as PDF files.
In addition to the manhole prints, “Information Sheets” initially created in Microsoft Excel are available and provide detailed information about the cable in the manhole. “Information Sheets” are also available for download from the corporate GIS system and can be saved as PDF files. The “Information Sheets” provide details about the cable including:
-
Cable Size
-
Voltage Class
-
Insulation Type
-
Manufacturer
-
Duct Position
-
Year Installed (with Work Order Number)
See Attachment E for sample of the information sheet.
[1] Gemtor
7.8.8.7 - Duke Energy Ohio
Safety
Manhole / Vault Entry
People
Duke Energy Ohio performs confined space training annually. The training is conducted by a safety expert within the Work Methods and Procedures Department. This training is classroom training.
Process
Duke Energy Ohio field crews test air quality every time a man enters a hole, and use continuous air monitoring while men are working in a hole. EPRI observed that these monitoring devices are positioned in the hole as opposed to just outside the hole.

Figure 1:
Continuous air monitoring device
Duke Energy Ohio requires all workers to wear harnesses. The harnesses are equipped with retrieval hooks. Workers are not tethered while working.
Historically, the underground group in Cincinnati had an arrangement with the Cincinnati Fire Department, in which the fire department would be called upon to perform manhole rescue. The fire department would use the rescue winch system mounted on each truck to rescue a worker.
At the time of the EPRI immersion, Duke Energy Ohio was in the process of changing their approach. For example, they are equipping each of their trucks with equipment to be able to perform a confined space rescue, including rescue lifting apparatus. They are also analyzing the implications of this change on crew makeup.
7.8.8.8 - Energex
Safety
Manhole Vault Entry
Manhole (Pit) Entry
People
Energex performs confined space training and rescue training (such as switchboard rescue and pit rescue training) as part of its statutory required training for field workers. Refresher training for safety training is conducted semi-annually. Jointers work with cable and cable accessory installation and maintenance, including cable pulling and splice preparation.
Process
Energex establishes a safety work area using traffic cones and barriers to isolate vehicular and pedestrian traffic from the job site (see Figures 1 and 2).

Figure 1:
Energex job site - underground pit

Figure 2:
Energex job site - underground pit
Energex performs a series of pre-entry inspections when entering a pit. Crews test for atmospheric quality by dropping a four gas monitor (oxygen, carbon monoxide, percent lower explosive limit [LEL] and hydrogen sulfide) into the hole. Energex requires continuous monitoring. If crews obtain a bad reading, they may ventilate the hole (see Figures 1 and 2).
Upon entering the pit, the worker performs a quick visual inspection of the interior of the pit, to identify any swollen joints, leaking oil, or other indications of a problem. Energex is not performing any stray voltage testing on the pit cover.
Energex does not require workers to wear harnesses or to be tethered, and workers do not setup rescue apparatus at the mouth of the pit. A rescue apparatus is available on the truck.
A first aid rescue kit is available on the truck and placed next to the manhole opening at the surface, or next to the mini pillar in which the worker is working (see Figure 3). These rescue kits do not contain breathing apparatus. In a flash situation, employees would dial 000 (the Australian equivalent of 911 in the U.S.), and request the fire department to respond.

Figure 3:
Energex truck used by underground crews
Low-voltage switchboard or mini -pillar
Employees working in a mini-pillar or low-voltage switchboard wear low-voltage gloves, and stand on an insulated mat (see Figures 4 and 5). A first aid kit is placed next to the worker, and contains an insulated hook that would allow an employee to pull an employee away from the switchboard who accidently makes contact (see Figures 6 and 7).

Figure 4:
Insulated mat placed in from of low-voltage switchboard

Figure 5:
Insulated mat placed in front of mini pillar

Figure 6:
Safety kit placed next to mini-pillar (the orange bag)

Figure 7:
Energex employee holding insulated hook for switchboard rescue
Technology
Energex required personal protective equipment (PPE) includes a hardhat, safety glasses, steel-toed boots, and all natural fiber clothing. At the time of the immersion, Energex was transitioning to the use of fire resistant (FR) protective clothing. Energex uses continuous gas monitoring, with portable four-gas detectors. Energex trucks are equipped with global positioning systems, and first aid kits.
7.8.8.9 - Georgia Power
Safety
Manhole / Vault Entry
People
Georgia Power has various employee classifications that must enter manholes and vaults to perform their jobs including Cable Splicers, Test Engineers, Test Technicians, and Duct Line Mechanics. Cable Splicers perform work with the electrical infrastructure such as making up joints and terminations, including preparing lead splices. Duct Line Mechanics perform the civil aspects of the work. Test Engineers perform transformer testing, troubleshooting and maintenance. Test Technicians perform network protector testing and maintenance.
The Health and Safety group at Georgia Power performs safety training for employees who may work in manholes and/or vaults, including annual refresher training in working in enclosed spaces and manhole rescue. There is a Safety Advisor assigned specifically to the Underground Network group at Georgia Power who leads this training.
Georgia Power’s Network Underground Safety and Work Procedures contain guidelines for performing manhole and vault entry, and a checklist that must be completed by the crew leader. (See Attachment J )
Process
Prior to entering a manhole or vault, Georgia Power requires that all crew members know the exact location of the enclosed space, the requirements for tagging if applicable, which circuits are present, the scope of work to be performed, how to respond in case of an emergency, and the results from the pre-entry test of atmospheric quality.
Georgia Power personnel perform a series of inspections when entering a manhole. After removing the lid, crews test the atmospheric quality in the hole by dropping a gas monitor into it. The crews test air quality every time a man enters a hole. Georgia Power may use ventilators to flush the vault with fresh air. An example situation where forced ventilation is utilized is when working in a hole where the manhole temperature is very high (See Figure 1).

Figure 1:
Georgia Power worksite, note ventilation
Crews use fiberglass ladders to enter manholes or permanently mounted ladders on vault walls. On entering the manhole or vault, the crew will do a quick visual inspection of the interior, including the electrical components within the vault (See Figure 2).

Figure 2:
Georgia Power worksite
Georgia Power has rescue apparatus located on the trucks, but does not normally set up the apparatus. Georgia Power does not require employees to wear harnesses or be tethered.
Georgia Power relies on fire departments to do any rescue and extraction and call 911 for assistance. The crew makes certain it is safe for fire department rescue personnel to enter the vault or manhole.
Technology
First Aid kits and AEDs are on all crew trucks. Crews also have internal communications through its SouthernLINC radio system to call for additional assistance from any other Georgia Power crew.
7.8.8.10 - HECO - The Hawaiian Electric Company
Safety
Manhole / Vault Entry
People
HECO Underground Cable Splicers are responsible for establishing a safe work zone, and performing all required safety steps associated with manhole / vault entry.
Process
HECO tests air quality every time a man enters a hole. HECO is not using continuous monitoring. They use active ventilation of the hole.
HECO is not requiring lifting harnesses, or utilizing a lifting crane is set up outside the hole to perform manhole rescue in case of an emergency.
7.8.8.11 - National Grid
Safety
Manhole / Vault Entry
People
National Grid performs confined space entry and rescue training as part of its formal required training for workers in the Electrical group. Refresher training in manhole rescue is offered annually
The Electrical Group is comprised of Cable Splicers, Maintenance Mechanics and Mechanics. Cable Splicers work with cable and cable accessory installation and maintenance, including cable pulling and splice preparation. Maintenance Mechanics perform network switching, fault location, minor vault maintenance, and inspection and maintenance of network equipment such as transformers and network protectors. Mechanics perform minor civil work.
Process
National Grid performs a series of pre-entry and post-entry inspections when entering a manhole. Prior to removing the manhole lid, the lid is tested for potential using a stray voltage detector. After removing the lid, crews tests the atmospheric quality in the hole by dropping a gas monitor into it. Note that National Grid requires continuous air monitoring and requires at least one person in a vault or manhole to wear a four-gas monitor (oxygen, carbon monoxide, %LEL and hydrogen sulfide) at all times. National Grid also checks for elevated temperatures in the manholes before entry.
On entering the manhole or vault, the crew will do a quick visual inspection of the interior, including the electrical components within the vault. All separable connectors are checked with an infrared gun to detect overheating from electrical faults.
Crews complete an enclosed space evaluation form for every manhole entry to document the conditions and indicate what workers must be aware of. Gas levels from the monitor are recorded on this form (See Attachment J .)
Continuous ventilation is not used unless chemicals are being used, or there are bad readings on the air monitors. In this case ventilators are used to flush the vault with fresh air, and entry is not allowed until the air monitor indicates that levels are safe. The underground department does not use SCUBA gear.
National Grid Albany uses a manhole rescue apparatus set up over manholes, and requiring employees to wear harnesses and be tethered (rope tethers) to the lifting apparatus. The tether is connected to the lifting apparatus with a breakaway pin that is designed to separate in the unlikely event of a vehicle striking the lifting apparatus, thus protecting the worker from injury in such an event. The wearing of tethers is an established practice at National Grid Albany, as National Grid has required employees to be tethered for over eight years. If the circumstances within the vault make the wearing of the tether impossible or unsafe, employees may elect not to wear the tether, but must document this decision on the pre-job briefing An alternate method is then used and documented on the job brief form. In this method, the entrants still wear the harness. An extendable pole is set up at the entry, which allows the attendant to reach into the manhole or vault without entering, to clip a tether onto the harness, and rescue the entrants.
National Grid trucks are equipped with a code blue button, which can be used in an emergency. This button, part of the radio system within the truck, gives the emergency call top priority, All trucks are equipped with an automatic vehicle location system, such that when the blue button is depressed, the operations area will know what truck issued the call and where the truck is located from the on board GPS system.
Technology
National Grid required Personal Protective Equipment (PPE) includes a hardhat, ANSI safety glasses with side shields, steel toed, EH-rated boots, outer layer FR protective wear with an Arc Thermal Protective Value rating of 8 cal per square centimeter (Level 2), and all natural-fiber clothing underneath.
National Grid may differentiate the clothing required based on tasks.
National Grid uses continuous gas monitoring, with portable four gas detectors worn by employees.
National Grid workers wear lifting harnesses with tethers. A rescue lifting apparatus is set up at the manhole entrance.
National Grid trucks are equipped with global positioning systems, first aid kits, and burn kits.

Figure 1:
Stray Voltage detector

Figure 2:
Four gas monitor

Figure 3:
Lifting apparatus

Figure 4:
Employee tethered to the lifting apparatus

Figure 5:
Breakaway pin between the tether and lifting apparatus

Figure 6:
Lifting apparatus

Figure 7:
Code blue button

Figure 8:
Truck-mounted First Aid kit
7.8.8.12 - PG&E
Safety
Manhole / Vault Entry
People
PG&E performs confined space entry training as part of its formal required training to become a cable splicer. Refresher training is offered annually.
Process
PG&E field crews test air quality every time a man enters a hole, and use continuous air monitoring while men are working in a hole.
Crews entering will perform other safety checks depending on the work assignment. For example, crew members entering a vault to perform transformer oil testing will perform a few checks to confirm the transformer is de-energized, such as checking the network protector status, feeling the transformer unit to see if it is humming, and comparing the oil temperature to the recorded high temperature.
PG&E does not use a manhole rescue apparatus set up over the manholes or require employees to wear harnesses and tethers.
The M&C Network Electric group has an arrangement with fire departments in San Francisco and Oakland, in which the fire department would be called upon to perform manhole rescue. In an accident, PG&E’s procedure is to call the distribution operator, who would then call 911 to engage the fire department to perform first response.

Figure 1:
Continuous air monitoring device

Figure 2:
Job Site
Technology
PG&E trucks are equipped with first aid kits.
Ultimately, enabled by the remote monitoring system, PG&E would like the crews to have the ability to determine the status of the network protectors from the truck through a lap top. (See Remote Monitoring)
PG&E is piloting a small tripod that can be used for lifting equipment out of the hole. This could facilitate lifting light equipment out of the hole, but is not a manhole rescue apparatus.
7.8.8.13 - SCL - Seattle City Light
Safety
Manhole / Vault Entry
Process
During the the Manhole Drill crews perform heat gun readings in each manhole to identify any problems. Crews also look for problems on adjacent feeders in the same hole, and may postpone performing the feeder maintenance until addressing any identified problems on the adjacent feeders (in other words, address problems on adjacent feeders before moving to an N-0 the crews perform heat gun readings in each manhole to identify any problems. Crews also look for problems on adjacent feeders in the same hole, and may postpone performing the feeder maintenance until addressing any identified problems on the adjacent feeders (in other words, address problems on adjacent feeders before moving to an N-0 condition).
Heat gun checks are performed both at the front end, before the maintenance is accomplished, and at the back end, after maintenance is complete
Technology
SCL uses continuous air monitoring.
SCL does not routinely require workers to wear a harness, or the positioning of a lifting apparatus outside the hole.
7.8.8.14 - Practices Comparison
Practices Comparison
Safety
Manhole - Vault Entry

2015 Survey Results

7.8.8.15 - References
EPRI Underground Distribution Systems Reference Book (Bronze Book)
7.8.8.16 - Survey Results
Survey Results
Safety
Manhole - Vault Entry
Survey Questions taken from 2018 survey results - safety survey
Question 9 : Do you perform routine training on how to conduct a tailboard meeting?


Question 10 : How to you determine / assess the quality of your tailboard meetings?

Question 22 : Please indicate which of these manhole / vault entry procedures you utilize:


Survey Questions taken from 2015 survey results - Safety
Question 128 : Please indicate which of these manhole/vault entry procedures you utilize:


Survey Questions taken from 2012 survey results - Safety
Question 8.7 : Is a first aid kit on hand when a crew is working in a vault?


Question 8.10 : Please indicate which of these manhole / vault entry procedures you utilize


Survey Questions taken from 2009 survey results - Safety
Question 8.8 : Is a first aid kit on hand when a crew is working in a vault? (This question is 8.7 in the 2012 survey)

Question 8.10 : Do you use continuous air quality monitoring when working in a Manhole? Vault?


Question 8.11 : Do you require the use of a lifting crane and worker harnesses when working in an Underground Manhole? Underground Vault?


7.8.9 - Morning Stretch
7.8.9.1 - AEP - Ohio
Safety
Morning Meeting / Stretch
People
At AEP Ohio, Network Crew Supervisors lead daily morning safety briefings that include a morning stretch.
Process
In addition to stretching, Network Crew Supervisors use the daily morning safety meeting to report out from both the District Safety Council and the State Safety Council.
Technology
Crews utilize a video to guide them through their daily stretching exercise routine.
7.8.9.2 - Ameren Missouri
Safety
Morning Meeting / Stretch
People
The Construction Supervisor responsible for Underground Construction conducts a daily morning meeting with the entire department to review safety and health issues and to prepare for the day. This morning meeting also includes a morning stretch.
Process
The morning meeting / stretch is led by the Construction Supervisor. It includes the discussion of safety issues, such as reminding employees to stay hydrated in hot weather conditions, and administrative issues, such as replacing expired contents of a first aid kit.
The meeting also includes a morning stretch. Employees are not mandated to participate in the stretch but must be present at the meeting. Virtually all participate in the stretching.
One day per week, the stretching is led by a physical therapist. On the days of the week when the physical therapist is not present, the morning stretch is led by an employee.
Ameren Missouri contracted with a company called Apex to develop an injury prevention program for Ameren Missouri aimed at reducing employee injury. This program includes the daily performance of stretching exercises, and a weekly visit to the morning meeting by a physical therapist. On the day of the visit, the physical therapist leads group in the performance of the stretching exercises. This physical therapist is also available after the meeting to provide individual counseling to employees on prevention and on treating minor strains (such as recommending the use of ice or heat, etc.)
Ameren Missouri reports a significant reduction in soft tissue injuries in their Illinois company attributable in part to the implementation of a similar program there.
Technology
Ameren Missouri has posted a description of the various morning warm-ups and stretching exercises on their Safety Bulletin Board.
7.8.9.3 - Duke Energy Florida
Safety
Morning Meeting / Stretch
(30 for 30)
Process
Duke Energy Florida has implemented a practice called “30 for 30,” where every thirty minutes, participants of a meeting stand and stretch for 30 seconds. The meeting discussion does not cease, but continues as participants engage in this stretch. A timekeeper is assigned at the start of the meeting to remind participants to stretch at 30 minute intervals.
7.8.9.4 - Georgia Power
Safety
Morning Meeting / Stretch
People
Each morning, crews start the day with a safety discussion and a morning stretch to prepare them for the day physically and mentally.
Technology
Georgia Power utilizes bulletin boards throughout the company to re-enforce safety programs and safety and health messaging.

Figure 1:
Examples of safety related displays; Note that Georgia Power encourages daily stretching
7.8.9.5 - HECO - The Hawaiian Electric Company
Safety
Morning Stretch - Walk about
People
All personnel in the C&M Underground group participate in performing daily morning light stretching exercises and in a brief walk around the HECO office facility. This includes supervisors and any visitors who will participate in the morning safety / tailboard meeting.
Process
The HECO C&M Underground group begins each work day with a morning stretch and a brief walk around the office facility. This process was implemented to encourage the group to loosen up each morning to help prevent injury
This process has also assisted with mental focus too, with workers casually chatting about the upcoming workday. This morning “walk about” is immediately followed by the morning safety Tailboard meeting.
7.8.9.6 - National Grid
Safety
Morning Meeting / Stretch
People
Job briefings are conducted at the start of the each job, and are led by the person in charge of the work (either the supervisor, or a crew leader or similar position). Additional job briefings are held whenever there is a significant change in the working conditions that might impact the safety of employees. The job briefing is documented and signed by the designated employee in charge of the job.
Process
The briefing covers hazards associated with the job site and its surroundings. During the briefing, the crew identifies all hazards, both electrical and non-electrical, in the work environment. Difficult physical work, including strain, awkward positions, and difficult lifting is discussed. The briefings cover all of the hazards associated with the job, work procedures, special precautions, energy source controls, personal protective equipment requirements, and a warm-up / stretch period.
The scope of the discussion depends on the job and how it relates to employee experience and training. Brief discussion is allowed for routine work, where it is expected that employees have the experience to recognize and avoid the hazards of the job. Extended briefings are required where employees are unfamiliar with the hazards, or the work is particularly complicated or hazardous.
Employees working alone do not need to conduct formal job briefings but are expected to plan tasks and perform them as though a job briefing were being done.
7.8.9.7 - PG&E
Safety
Morning Meeting / Stretch
People
Prior to each shift, the distribution supervisors conduct a pre-shift tail board meeting with the field crews. The meeting is conducted in the cable splicer day room, known as the “bull room”. The content of the tail board meeting varies from meeting to meeting, addressing safety concerns specific to the projects scheduled for that shift and including a reading from the safety manual. This meeting is also used to review any pertinent utility bulletins (see Utility Bulletin).
Process
The pre-shift tailboard meeting also includes stretching by field crews, including a brief upper body stretch of the arms, elbows and shoulders.
7.8.9.8 - Survey Results
Survey Results
Safety
Morning Stretch & Walk About
Survey Questions taken from 2009 survey results - Safety
Question 8.2 : Please indicate the type(s) of safety meetings you conduct. Check all that apply.

7.8.10 - Near Miss Program
7.8.10.1 - AEP - Ohio
Safety
Near Miss Program
People
Network Mechanics and Network Crew Supervisors are required to document any “near miss.”
Process
In the event of a “near miss,” any crew member must fill out a written form and submit it to the supervisor. This report is recorded in the AEP Ohio database system and likely will become the topic of the next day’s morning meeting.
Technology
“Near miss” reports are recorded in the AEP Ohio database.
7.8.10.2 - Ameren Missouri
Safety
Near Miss Program
People
Ameren Missouri has implemented a Near Miss program, where employees are encouraged to report near misses through an anonymous reporting system. Ameren Missouri managers acknowledged that while the program is gaining momentum, there still exists some skepticism among the bargaining unit employees about this program and that employees have been slow to report near misses.
Technology
Ameren Missouri issues a number of safety related publications, including near miss reports. These reports and other safety- related publications are posted on a safety bulletin board within each department.
7.8.10.3 - CEI - The Illuminating Company
Safety
Near Miss Program
Note: Refer to Safety Stop Program.
7.8.10.4 - CenterPoint Energy
Safety
Near Miss Program
People
CenterPoint Energy has implemented a “Near Miss” safety suggestion box for identifying methods to address issues identified through near misses.
7.8.10.5 - Con Edison - Consolidated Edison
Safety
Near Miss Program
(Close-Call Reporting)
People
Close Call Coordinator and/or local Close Call Committee communicate the status of Close Call(s)/Lessons Learned to their organization.
Con Edison’s Corporate EH&S department routinely publishes Close Calls or Lessons Learned that apply to a broader base.
Process
Close-Call Reporting
Con Edison has implemented a close-call program to enable employees to report hazards, unsafe conditions, and/or unsafe behavior that have the potential to result in injuries or property damage, without disciplinary action.
Con Edison employees are encouraged to recognize, report, and share situations that they believe may lead to a potential injury, or that represent conditions that need to be corrected. Employees can report close calls through an on-line form located on the Con Edison intranet. (See Attachment H , Con Edison Specification CSP 26.00 — Close Call Procedure.)
When a Close Call is submitted, an individual for that department, called the “Close Call Coordinator,” reviews the submittal for completeness and to categorize it as either a Close Call or a Lessons Learned. A “Close Call” is an event where no physical injury or property damage has occurred, but had the potential to result in injury or property damage. A “Lessons Learned” is an event where property damage or a minor injury (no medical treatment or first aid needed) occurred.
On a monthly basis, the Close Call Coordinator and/or local Close Call Committee communicate the status of Close Call(s)/Lessons Learned to their organization.
Con Edison’s Corporate EH&S department routinely publishes Close Calls or Lessons Learned that apply to a broader base.
7.8.10.6 - Duke Energy Florida
Safety
Near Miss Program
People
Duke Energy Florida has two formal programs in place aimed at improving safety practices by learning from experience.
One is a “Near Miss” program designed to document information about events where a safety hazard occurred, but no one was hurt. For example, an employee accidently dropping a tool into an area that creates a flash with no one getting injured is an example of a “Near Miss.” The other program is a “Good Catch” program designed to document information about potential safety hazards identified before the occurrence of an event. For example, an employee proactively reporting cracked and raised cement on a walkway that poses a trip hazard before anyone trips.
All employees are encouraged to document and report both Near Misses and Good Catches. Supervisors are responsible for reporting both as they identify them. The reporting associated with these programs is supervised by the Lead Health and Safety Professional for the South Coastal Zone.
Duke Energy Florida enjoys good participation in these programs. In a recent eighteen-month survey of Duke Energy Florida, there were 54 Near Misses reported state-wide, including both native and contractor resources. Employees noted that both programs gained momentum as employees saw the value of the information being distributed in near miss and good catch reports. Employees began to see the reporting of this information as a way of increasing learning and an opportunity to improve safety, rather than something that would result in punitive action.
Through programs like this, Underground department experts believe they have achieved a “culture of safety,” where employees take personal accountability for their own well-being and the well-being of their coworkers.
Process
Near Miss reports and Good Catch reports are submitted through the network system’s PlantView online software, and issued in the form of Safety Alerts. An example of a Near Miss report is included in Attachment N.
After a Near Miss is reported, the Lead Health and Safety Professional is sent immediately to the site to document what happened by directly interviewing crew members and supervisors. The safety professional will also take pictures of the event site and prepare and submit a Preliminary Investigation Report (PIR) which includes recommendations to prevent an incident in the future. This PIR is forwarded to the corporate Vice President of Safety. A Near Miss report, a one or two-page description of the near miss incident, is published and shared throughout the company. (See Attachment N .)
Technology
Network system employees fill out Near Miss and Good Catch reports in the company’s online PlantView system. Electronic PIR reports are filed with Duke Energy Corporate.
7.8.10.7 - Energex
Safety
Near Miss Program
People
Improving safety is a key focus area for Energex, which is driven by the company CEO. The company has embarked upon a system wide effort to change their safety culture. In the recent past, Energex had experienced three safety incidents, resulting in worker injuries. The company is hoping to leverage the emotion from those events as a driver for changing the safety culture.
Energex has established a safety management system, which is a comprehensive framework that guides their safety approach, and addresses strategies for managing the hazards and risk associated with the design, construction, operation and maintenance of the system. Strategies such as their approach to safety training, incident investigation and response, and emergency preparedness and response, are guided by this framework, including near miss reporting.
Energex has recently reorganized their safety organization, consolidating a corporate safety group, a Service Delivery safety group, and a Power Plant Safety group to form one safety organization.
Process
Energex has piloted a program for reporting near misses, hazards, and incidents in four of its locations. Their initial experience is that the number of near misses reported is low, but that employees do report incidents and hazards. Energex is actively pursuing methods to increase near miss reporting. Energex promotes the reporting of near misses and hazards. The company has noticed a proportional decrease in lost-time accidents to the increase in the reporting of these metrics.
7.8.10.8 - ESB Networks
Safety
Near Miss Program
People
ESB Networks employs a Manager of Safety, Quality, and Environment within its ESB Networks group. ESB Networks also maintains a Chief Executive Safety Committee that oversees and thoroughly documents safety procedures and practices. Representatives from throughout the company rotate onto the committee to get a more complete overview of current and evolving safety practices.
Process
Safety is engrained at every level within ESB Networks, with complete senior management support, including periodic, mandatory safety audits conducted on a regular basis. The organization has recently embarked on a four-year continuous safety improvement campaign that includes behavioral approaches, meetings, and on-the-job coaching. As a result of this and earlier initiatives, it is notable that ESB Networks has earned an OH SAS (Occupational Health and Safety Auditing System) accreditation, which is a significant industry accomplishment.
Among the “safety tenets” that ESB Networks ascribes to are the following:
-
“If it’s not safe, don’t do it.” (their most important tenet)
-
“A near-miss today could be an accident tomorrow.”
-
“We are proud of what we do.”
-
“We get it right the first time.”
-
“We look out for each other.”
As a part of its positive re-enforcement of safety policies, reporting of near-misses is not penalized, and ESB Networks finds that field personnel and Network Technicians proactively report and make recommendations for further improving safety practices.
7.8.10.9 - Georgia Power
Safety
Near Miss Program
People
Crew supervisors are required to document any and all accidents, incidents or injuries at the job site with forms that are kept on the crew truck(s). The injury report is then forwarded to the Safety and Health group within Georgia Power. If the incident involves failed equipment or a “near miss,” a report is filed with engineering as well, and a Test Engineer must inspect the site before work continues.
Technology
Georgia Power uses a computer program called “SHIPS” to documents training and safety records of all employees. Records are kept concerning accidents, incidents and OSHA recordable events. The system serves as the permanent record of the safety and training history throughout an employee’s career.
Incidents and accidents are classified as “charged” for incidents in which an employee is responsible for the incident. The record of the incident is “charged” to the employee’s business unit, or “uncharged” if the employee is not responsible. In this way, safety becomes behavioral-based, and the Health and Safety group can analyze these incident statistics for any number of variables that might be useful in modifying safety training and/or awareness.
7.8.10.10 - HECO - The Hawaiian Electric Company
Safety
Near Miss Program
People
HECO has implemented a Near Miss program that investigates serious near miss situations that could have resulted in injury or death to someone, equipment damage, or a widespread outage. The Safety department administers the Near Miss program.
Process
The crew involved in the near miss situation would notify the safety department who would work with the department involved to investigate the situation. The outcome of the investigation can result in changes in work procedures to prevent or at least minimize the potential for a similar future occurrence.
The program is non – punitive, unless there is a serious violation of the safety rules.
HECO acknowledges that there are likely near miss situations that go unreported.
7.8.10.11 - National Grid
Safety
Near Miss Program
People
National Grid has a formal incident analysis process to be implemented following a significant incident, or a near miss with the potential of being significant. National Grid uses an incident management system (IMS) that informs supervisors of the level of severity of various incidents. For example, a supervisor may use the IMS to determine whether or not a particular near miss event requires a formal incident analysis or not.
Process
In a formal incident involving safety, the Safety Department will assign team leader to an incident review team. The team is required to complete an analysis within two weeks.
Technology
National Grid has established a telephone number for employees to use to report incidents that are significant, or near miss events that had the potential to be significant,
National Grid provides near miss cards, which employees can fill out and turn into Corporate Safety reporting near miss events. These cards are not anonymous (See Attachment I).
National Grid uses an incident management system (IMS) managed by the Corporate Safety Department.
7.8.10.12 - PG&E
Safety
Near Miss Program
People
PG&E has developed and implemented a form to enable employees to report “near misses” or “close calls”.
Process
This is an informal program at PG&E. PG&E management acknowledged that near misses are likely underreported by the work force for fear of repercussions, and that an area of opportunity for the company would be to increase the reporting of near misses to better identify risks and implement countermeasures.
7.8.10.13 - Portland General Electric
Safety
Near Miss Program
People
To ensure a conduit between management and field workers, PGE employs safety coaches who volunteer to represent their department. They discuss safety issues and events, including reported near misses, with management and the safety team to ensure that any concerns are dealt with and escalated if needed. Safety coaches sit on the Safety Committee, which meets monthly.
The CORE group has one safety coach, and the position is rotated every 2-3 years. The CORE safety coach is a journeyman with normal duties and acts as a point of contact if crew members have a safety concern or experienced a near miss.
Safety coaches discuss concerns and incidents amongst themselves during monthly meetings and determine what actions should be taken. In addition, prior to the monthly meeting, the safety coach spends time talking with crews to find out any issues that can be raised at the meeting.
Process
Overall, PGE adopts a mantra of “see something, say something” for any safety concerns. PGE uses a formalized program called My Safety which documents near miss situations online. Employees can enter information about a near miss, and the safety coach can fill in the details. Alternatively, near miss incidents can be submitted anonymously.
Safety professionals throughout the company view any items entered into the My Safety program, and a selection of important topics is picked out every week for discussion at the weekly meeting.
If a near miss incident did not violate any safety rules or result in a direct injury, there will be no disciplinary consequences. Where rules were violated or an injury or damage occurred, the supervisor pursues the matter and determines an appropriate response.
PGE does not have a formal “good catch” program. However, the My Safety program provides the ability for an employee to recognize a peer for good safety performance.
Technology
My Safety Application: On the My Safety Application used by crews to log incidents, users can view a summary of safety incidents grouped by location, as well as summaries of safety performance. This system is used to record near misses and recognize peers for good performance.
7.8.11 - Operating a 5KV Underground Oil Switch
7.8.11.1 - CEI - The Illuminating Company
Safety
Operating a 5kV Underground Oil Switch
People
Underground Electricians perform sectionalizing of the 4kV underground distribution system. This system consists of older, oil filled switches. Many of these devices have deteriorated and are prone to failure.
Process
CEI 5kV oil switches are only operated in a no load condition. They will use these devices to parallel and break parallel feeders.
Because of the age of these devices, CEI had a long standing practice to only operate these devices remotely from outside the hole using a rope attached to the switch handle.
They had an event that demonstrated that operating the device from top at the mouth of the hole was still potentially hazardous to employees, as a fire ball could shoot out the top of the hole.
More specifically, they had a fault that they thought was caused by the failure of a pole top termination. They opened oil the switch to de-energize the line section. When they repaired the problem with the termination, they went back to the hole to close the switch. They did this by affixing a rope to the switch handle. They ran the rope under a ladder to get the proper angle when pulling the switch. One man stood next to the hole to hold the ladder down, while the other guy pulled up on the rope. It turned out that when they closed the switch, they closed into another fault that existed on the line section that they were unaware of. This resulted in a flash that injured the man at the top of the hole.
They have made two significant changes as a result:
- Changed their work procedures to require that after they repair a fault they do a cable test before attempting to reenergize a circuit or circuit section. They use either a 5kV megger test (DC test) or a VLF test.
- They implemented a device for remotely operating the switch handle, while being able to stand away from the manhole opening – see Technology section below.
Technology
Because of the risks associated with operating older 5kV oil switches, CEI has developed a device for remotely operating the switch handle, while being able to stand away from the manhole opening. The device consists of a base which attaches to the switch body itself, an operating handle that fits over the switch handle, and a slide mechanism and cable device that can used to operate the switch from a safe distance from the manhole opening.

Figure 1:
Base

Figure 2:
Base + Switch body

Figure 3:
Operating handle that fits over the switch handle

Figure 4:
Slide mechanism and cable device than can be used to operate the switch from a safe distance from the manhole opening
See Attachment - V
7.8.11.2 - PG&E
Safety
Operating a 5kV Underground Oil Switch
Process
PG&E has been moving from using oil switches as network feeder sectionalizing switches to a solid dielectric switch. One driver for this change is a concern over the failure of the switch and the environmental and other hazards associated with oilfield gear.
7.8.12 - Operating Errors Investigations
7.8.12.1 - CEI - The Illuminating Company
Safety
Operating Errors Investigations
People
The investigation of an operating error is similar to the incident investigation process at CEI. The people involved in the investigation team depend on the nature of the operating error. If there are safety related issues to the error, the safety coordinator and director may be involved.
In a case where the operating error affects customer reliability, the operating error investigation may be performed as part of an outage investigation analysis that includes people from asset management. This outage investigation team, called a REAP team, performs analysis of outages causes to develop procedures to prevent these circumstances from recurring.
CEI may or may not administer formal discipline depending upon the circumstances associated with the operating error.
Process
The process for conducting operating error investigations is not documented, and is administered informally by the department manager. The investigation team is formed and meets to discuss the incident and to make recommendations based on the incident findings. For example, CEI had an incident where an employee erroneously marked and cut a live 33kV cable (The employee thought it was de-energized), resulting in a lengthy outage to customers. After this incident, a team was formed to investigate what happened and to make recommendations to avoid repeat incidents of this type.
As a result of this particular incident, CEI modified its procedure to require a second employee to verify what the first employee determined to be the de-energized feeder before cutting the cable. Only when this dual check is complete, will CEI commence with the cable cut.
Technology
The results of operating incident investigations are documented.
7.8.12.2 - Con Edison - Consolidated Edison
Safety
Operating Errors Investigations
Process
Operation Error Procedure
Con Edison’s Manhattan Electric Operations department has developed a procedure for investigating and documenting operating errors that occur in the Manhattan Customer Service Area.
An operating error is defined as a violation of a safety, environmental, maintenance, or operating procedure that did or could have resulted in an unsafe working condition, an environmental incident, personal injury, equipment damage, customer or equipment outages, or operation of equipment not consistent with its design.
The procedure requires that when an operating error occurs and is recognized, all further operations are to cease immediately, until the incident is investigated and report written. No attempt shall be made to undo the action that resulted in the error until precise orders are issued to safely remedy the situation.
A responsible person assigned by the Manhattan Electric Control Center Manager prepares and issues a report describing the error.
The report is to be clearly and concisely written and contain, but not be limited to the following:
-
Description of the system/equipment conditions before the error
-
Detailed description of the error
-
Sequence of events (chronology), if required
-
Initial critique of the error
-
Recommendations to prevent another error
-
All applicable maps, feeder prints, layouts, Before and After project drawings (B&A’s), wiring diagrams, hold-offs, and b-tickets shall be included in the report.
(See Attachment I Sample Operating Error Report 02-25M51 6 29 02, for a sample of a completed operating error report.)
7.8.12.3 - HECO - The Hawaiian Electric Company
Safety
Operating Errors Investigations
( Near Miss Program)
People
HECO has implemented a Near Miss program that investigates serious near miss situations that could have resulted in injury or death to someone, equipment damage, or a widespread outage. The Safety department administers the Near Miss program.
Process
The crew involved in the near miss situation would notify the safety department who would work with the department involved to investigate the situation. The outcome of the investigation can result in changes in work procedures to prevent or at least minimize the potential for a similar future occurrence.
The program is non – punitive, unless there is a serious violation of the safety rules.
HECO acknowledges that there are likely near miss situations that go unreported.
7.8.12.4 - SCL - Seattle City Light
Safety
Operating Errors Investigations
Process
Safety Accident Investigation
SCL has a process for convening a fact-finding investigation meeting after an accident within a certain time frame. These post-accident investigations sometimes result in work practice / process changes based on lessons learned from the investigation.
7.8.13 - Organization
7.8.13.1 - AEP - Ohio
Safety
Organization/Culture
People
AEP has a strong culture of safety, which is evident in its attention to safety in the work place, in its work practices, and in its approach to network design. EPRI researchers observed a wide variety of good safety practices:
-
Excellent housekeeping at work facilities
-
Inclusion of safety features in equipment specs and design standards
-
Effective use of job work site protections
-
Innovative designs such as a service center design without a raised dock, which is more appropriate to the type of truck used by the underground department as it avoids the need to step down into the truck (as one would from a raised dock.)
AEP utilizes various committees/teams at all levels of the organization to coordinate safety activities. At the overall company level, AEP has a Safety Committee, comprised of representatives from throughout all its operating companies. AEP also utilizes committees at the individual operating company level. AEP Ohio conducts monthly state-wide safety meetings (Ohio Safety Council), as well as area-specific meetings, such as meetings of the Columbus Safety Council. At AEP Ohio, safety initiatives are coordinated and implemented through the Ohio Distribution Safety Supervisor.
At the work level, Network Crew Supervisors and Network Mechanic crew leaders are responsible for performing onsite and morning safety briefings. An AEP Ohio Safety Department Representative performs periodic onsite safety inspections.
Process
Monthly state-wide meetings and local Columbus Safety Council meetings are held with the AEP Ohio Safety Coordinator in attendance. These meetings focus on topical issues, including new technology, equipment, procedures, and safety recommendations. These councils also serve as a forum for members to address safety concerns. Relevant information from these meetings is then shared with employees in AEP Ohio’s daily morning meeting with employees.
Morning Meetings for the field crews focus on topical safety practices and are led by one of five Network Crew Supervisors. The Morning Meeting duty is rotated among the five Network Crew Supervisors.
Formal Safety Training
All Network Mechanics and Network Crew Supervisors have undergone extensive safety training, including lead awareness, de-energization of cables, network protectors, safe manhole entry, and many other safety procedures and practices that are contained in the AEP Safety Manual. Annual safety training for Network Mechanics is also held on topics such as safe handling of new equipment and lead awareness.
Company-wide yearly Safety Stand Downs are also conducted, which focus on specific safety practices in depth. In these “Stand Downs,” workers spend allotted time, usually several hours, focusing on a safety topic.
Safety Checklists
Safety Checklists are used to document conditions as well as the performance of a safety discussion at job sites. These checklists can be filled out using a smart phone application (app). The checklist is tied to AEP Ohio’s Human Performance Improvement program, which uses the SAFER acronym for approaching all jobs.
-
“S” for summarizing all procedures and safety precautions that will be needed at the job.
-
“A” for anticipating any potential dangers, problems, or complications.
-
“F” for foreseeing what all the steps that are required in the job.
-
“E” for evaluating all the protections and safety procedures that should be used.
-
“R” for reviewing just-in-time-documents online, past experiences on similar jobs, and online best practices for the specific job they are performing.
Safety checklists are recorded online.
Safety Audits
The AEP Safety Department Representative performs 15 safety audits per year in AEP Ohio. Information is recorded and reported to AEP Ohio management as well as to the parent company.
Cooperation with Local Fire Department
AEP Ohio has recently held meetings with the local Columbus fire department to coordinate rescue and emergency response procedures. In cooperation with the fire chief and his staff, the Columbus Fire Department and AEP Ohio will put together a manhole rescue and fire response video and training course. The focus of the training is how network crews and the fire department must work together, and clearly delineate procedures and roles in in emergency situations. The finished video will be made available to all AEP operating companies.
Cooperation with Local Fire Department
It is notable that the AEP Ohio network group has not had one personal injury in the last 10 years. (Only minor vehicle accidents have occurred.) AEP Ohio ascribes this safety track-record to its philosophy of always putting safety first – before productivity and customer service.
Technology
AEP Ohio uses job safety checklists that can be filled out using a smartphone app. Safety information is recorded and available online for the entire company. The AEP Safety Manual, safety forms, guidelines, and safety best practices documents are available online to all company employees.
7.8.13.2 - Ameren Missouri
Safety
Organization
People
Safety is a key area of focus for Ameren. EPRI researchers noted visible attention to safety at Ameren Missouri, both in terms of observed work practices, work area protection and personal protection, and in the company’s proactive efforts to influence the corporate culture associated with safety.
Ameren Missouri has formed safety culture teams comprised of employees who focus on understanding the “pulse” of the organization, and on developing and implementing strategies to build trust and positively influence the culture.
In the past few years, Ameren Missouri has implemented multiple strategies to influence the company culture to focus on safety and to shift accountability for safety to the individual. These strategies range from changes in job classifications and job training requirements, to the implementation of safety related programs such as the implementation of a morning stretch period in field worker departments. Part of Ameren Missouri’s safety focus is entitled “Target Zero". Target Zero is a vision or goal for the company for zero unsafe acts. Ameren Missouri knows that unsafe acts ultimately lead to accidents and injuries. Consequently, the mindset they are striving for is one that tries to achieve zero unsafe acts. This focus on safety is elevated to the highest level of the organization, with safety being part of Ameren Corporation’s vision statement.
Ameren Missouri has a safety department that is organizationally aligned with Energy Delivery Distribution Services. There are six supervisors within this group, aligned functionally, who are responsible to develop and implement strategies to influence safety. One of these positions, a Senior Safety Supervisor, is assigned to focus on the safety of underground resources. Safety Supervisor positions are filled by people with varied backgrounds.
Ameren Missouri managers within the Underground organization are taking actions to develop new attitudes. These actions include things such as adding tools and equipment that facilitate safe work practices, and providing supplemental training to employees based on their feedback of where they lack confidence in performing a particular task. Managers report that new attitudes have taken hold, with employees holding one another accountable on issues of safety. Front line supervisors report that they feel like they have management backing to respond to issues associated with safety.
Ameren Missouri has a safety program called the Blue Hat program, designed to increase worker safety awareness and problem resolution. In this program an employee from the union is temporarily assigned to a position within the department that liaises with the field force on issues with tools, equipment and work practices. (See Safety - (Blue Hat Program) ) )
The change in culture is having a positive effect on safety performance. As an example, the Underground Construction group has seen a quantifiable improvement in department safety performance that company management attributes to a change in the department culture.
Ameren Missouri tracks industry-standard safety measures such as OSHA recordable incidents, lost workdays, and days away restricted and transfer (DARTS), a measure that includes resources who are back at the work place, but remain on restricted duty.
Ameren Missouri’s safety approach includes programs that reward successful performance, and punitive action for disregard of safety rules. These programs were implemented in an attempt to raise the bar and hold employees and crew leaders responsible. For example, Ameren Missouri offers an Eagle Leadership award, a financial award given to the employees in a work group for achieving certain safety goals. As another example, Ameren Missouri has developed certain “rules to live by”, such as the wearing of seat belts. If an employee breaks one of these rules, Ameren Missouri will take a punitive action, such as giving an employee who violated the rule time off without pay.
Process
Ameren Missouri conducts a number of periodic safety related meetings and practices including:
-
Regular tail board meetings
-
Morning “5 minute” briefings
-
Monthly safety meeting
-
Tool committee meetings
-
Safety committee meetings
-
Culture committee meetings
An example of safety practice implemented as part of Ameren Missouri’s focus on safety is kicking off meetings with a safety message. The meeting host will select a topic of interest for the group and start the meeting by sharing information on that topic. The topic does not necessarily have to be related to the meeting purpose, but rather a topic that would be of interest and generally apply to the meeting participants. An example topic would be a reminder to a meeting of field resources to identify all potential energy sources, including non conventional (non electric) sources such as water, steam, work equipment, etc.
Another program that Ameren Missouri has implemented that influences the safety culture is the performance of safety assessments. Ameren Missouri will assemble a small group of employees, typically between two and five, and visit either an operations center or workgroup and perform an assessment or review of everything they do from a safety perspective. Assessment teams will review both downstream and upstream activities. Downstream activities are things that are the consequences of performance, such as performance metrics, recordable incident rates, lost time accidents, etc. Upstream activities are things that work groups are doing to prevent accidents, such as job briefings, and performing quality safety meetings. Assessment teams will try to understand the linkages between upstream and downstream activities. Part of the assessment process is to talk with employees, understand their perspectives, and gather internal best practices that can be shared with others.
Another practice is the performance of job briefings (tailboards). At Ameren Missouri there are six elements to a job briefing. They include a review of:
-
hazards of the job
-
safe procedures and practices
-
discussions of any special precautions
-
identification of energy sources
-
discussion of clearances
-
personal protective equipment
An element of the job briefings is a requirement to regroup and re-brief when the work environment changes.
Ameren Missouri conducts a daily morning safety meeting (also called a “5 minute briefing”). This meeting is lead by a supervisor who prepares a safety related topic. The morning meeting includes stretching exercises. Once a week, Ameren Missouri invites in a physical therapist to lead the morning stretching exercises and to provide personal counsel to employees.
The construction supervisors within the Underground Construction group perform routine safety observations, called Job Behavior Observations (JBOs). Supervisors and managers are required to perform a certain number of JBO’s each month. Information from these observations is recorded on a form.
An example of a good safety practice in place at Ameren Missouri is the formal conversation that takes place during a shift change, when one employee is ready to leave his shift and the other employee comes on shift. Ameren Missouri requires a specific discussion of any operational issues and unusual conditions that may exist.
Ameren Missouri has implemented a Near Miss program, where employees are encouraged to report near misses through an anonymous reporting system. Ameren Missouri managers acknowledged that while the program is gaining momentum, there still exists some skepticism among the bargaining unit employees about this program and that employees have been slow to report near misses for fear of punitive action.
Technology
Ameren Missouri issues a number of safety related publications, including safety sampling results, safety alerts, near miss reports, Blue Hat reports, standards reports, incident summaries, and tool committee summaries. These safety-related publications are posted on a bulletin board within each department focused on safety.

Figure 1:
UG Construction Safety Bulletin Board
7.8.13.3 - CEI - The Illuminating Company
Safety
Organization
(Culture)
People
EPRI investigators noted a strong focus on safety at CEI. Safety goals and performance reports were conspicuously posted at the UG Network Service operating center. Various safety initiatives and meetings are conducted, including a daily “Safety Standup” meeting, involving the entire department.
EPRI investigators noted safe work practices including adequate traffic and pedestrian control, the use of personal protective equipment, the wearing of safety harnesses by workers, a lifting crane set up above the vault or manhole opening, and continuous air quality monitoring.
CEI has tied safety performance to incentive compensation, with non bargaining compensation being tied to overall safety performance, and bargain unit incentive compensation tied in with attendance at safety meetings, training, and not having an accident.
Culturally, one CEI employee noted that they have changed the attitude about safety from a “victim mentality” to one of “accountability”. They have accomplished this by driving responsibility for safe work practices down to the individual, and getting front line supervision involved.
Process
CEI has multiple practices in place to maintain a focus on safety. These include:
-
Safety training – each man receives from 16 – 24 hours per year.
-
Advanced Safety Coordinators – CEI employs two people who are focused in safety
-
Daily Safety Standup Meeting
-
Daily Safety Communication
-
Safety Stop program
-
Safety topic of the month
-
Monthly Safety Stand down meeting
-
Monthly supervisor safety meeting
-
Quarterly corporate meeting with union representation
7.8.13.4 - CenterPoint Energy
Safety
Organization
(Culture)
People
EPRI investigators noted a strong focus on safety at CenterPoint. Safety goals and performance reports were conspicuously posted at the Major Underground operating center. Various safety initiatives and meetings are conducted, including the “HERO” value based safety program, a peer to peer safety observation program described more fully later in this report.
EPRI investigators noted safe work practices during site visits, including adequate traffic and pedestrian control, the use of personal protective equipment, atmospheric testing and ventilation, and the use of a heat gun to test for hot spots when entering a manhole.
CenterPoint has company level safety goals, and breaks these down into departmental safety goals. Major Underground’s safety performance is tied into the corporate goals. Safety performance is incorporated into performance reviews.
Culturally, CenterPoint has programs in place that help to increase employee focus on safety. They have several safety observation initiatives underway and set goals for the number of observations performed to get employees thinking and talking about safety. They have implemented a suggestion box as part of the HERO program to gather ideas about safety improvement.
Process
CenterPoint has multiple practices in place to maintain a focus on safety. These include:
-
Safety training – each man receives about 20 hours per year including training in manhole rescue, asbestos awareness, excavation safety, and ladder safety.
-
HERO Program
-
Crew Inspections (Safety Site Inspections)
-
Safety Action Committee
-
Monthly Safety Meeting
-
Safety Council Meeting
-
Accident Review Process
-
Tailboard meetings at start of each day and at project sites
-
Daily safety message distributed to employee pagers
-
“Near Miss” safety suggestion box
7.8.13.5 - Con Edison - Consolidated Edison
Safety
Organization
(Culture)
People
Safety Culture
EPRI investigators noted a strong and visible focus on safety at Con Edison. In every facility that EPRI investigators visited, safety goals and performance reports were conspicuously posted. At every visited worksite, EPRI investigators noted safe work practices including traffic and pedestrian control, the use of personal protection, the wearing of safety harnesses by Con Edison’s workers, a lifting crane set up outside of the vaults, and continuous air quality monitoring.
Environmental, Health, and Safety (EHS)
Con Edison has a centralized group Environmental, Health, and Safety group (EHS), as well as EHS personnel imbedded throughout the field organizations. Con Edison has an extensive set of procedures as well as intensive training around EHS issues.
The EHS department responsibilities include providing internal oversight and guidance on environmental, health, and safety issues; policy and procedure development; performance reporting; compliance; incident investigation; and review and approval of safety equipment.
Technology
Sump Pump Installations with Oil Minder System
For vaults equipped with sump pumps, Con Edison installs an Oil-Minder control system (by Stancor). This system allows water to be automatically pumped from vaults without ejecting oil. The Con Edison installation includes a high water alarm, which is tied in with Con Edison’s RMS system, where applicable.
The Oil-Minder system uses a sensor probe that can distinguish oil from water. When the probe detects water, the sump pump operates. When the probe detects oil, the system prevents the sump pump from operating, containing the oil in the sump hole. The system relies on the fact that oil is lighter than water and rises to the top of the sump hole. If, for example, the sump hole contains water with a layer of oil on the top, the sensor probe (which reaches down to within 3 inches of the bottom of the sump hole), sensing water, pumps water out of the hole until the probe detects the oil. When the oil is detected, the pump stops.
See Attachment K .
Con Edison has sump pump installations that predate its use of the Oil Minder system. The utility is installing about 100 Oil Minder System units annually in their existing vaults with sump pumps.
Cable Design
Con Edison is working with cable manufactures to remove potentially hazardous substances from their distribution cables. These substances include the fire-retardant bromides used in the Dual-Layer Ethylene Alkene Rubber (EAM) cable insulation and the lead in the primary Ethylene Propylene Rubber (EPR) cable insulation.
7.8.13.6 - Duke Energy Florida
Safety
Organization
(Culture)
People
Safety is a key area of focus for Duke Energy Florida. EPRI researchers noted visible attention to safety, both in terms of observed work practices, such as work area protection and personal protection, and in the company’s proactive efforts to influence the corporate culture associated with safety.
The view at Duke Energy Florida is that all employees must be involved in fostering a culture of safety. Their approach to safety improvement is to create an environment that engages employees in the process, rather than focus on only disciplinarian measures. Employees cited examples of how the environment of employee engagement has improved safety through application of learnings from prior incidents and “near miss” events to operational processes and to engineering designs.
Duke Energy Florida has a corporate safety department that includes Health and Safety Professionals. One lead Safety and Health Professional focuses on safety in the South Coastal Region, which includes Clearwater and St. Petersburg. This person is responsible to develop and implement strategies to influence safety in the region, including the safety of the network underground organization.
Lead Health and Safety Professional positions are filled by people with well-rounded experience in field work, training, and safety. The Lead Health and Safety Professional for the South Coastal Region has 38 years of total experience at Duke Energy Florida, including 17 years of experience in the field as a lineman, and 9 years of experience as a trainer.
Each Operating Center in Duke Energy Florida has formed a local safety committee, comprised of representatives from each work group, and led by an employee designated as the operating center safety chairperson. As Clearwater and St. Petersburg are part of separate operating centers, network employees may be represented on either local safety committee. Participation is voluntary, and there is no forced rotation of members on the committee. The local safety committees hold monthly safety meetings. The local ops center chairperson and committee report (via a dotted line) to the Lead Health and Safety Professional.
Process
The Lead Health and Safety Professional communicates directly with network system supervisors in the Clearwater/St. Petersburg area on an as-needed basis, whenever an issue needs to be addressed. The Lead Health and Safety Professional also participates in safety meetings, and is responsible for performing routine safety observations, performing a minimum of eight observations each month.
Duke Energy Florida conducts a number of periodic safety related meetings including:
-
Job site tail board meetings
-
“Take 10” Meetings
-
Weekly meetings
-
Monthly safety meeting
-
Zone Safety Committee Meeting
(See the Safety Meetings section of this report for more information.)
Job briefings (tailboards) are conducted prior to every job at Duke Energy Florida and include the following topics.
-
Hazards of the job
-
Safe procedures and practices
-
Discussions of any special precautions
-
Identification of energy sources
-
Discussion of clearances
-
Personal protective equipment
An element of the job briefings is a requirement to regroup and re-brief when the work environment changes. This practice is call an “all-stop,” which as the name entails, stops all work at the time initiated. In addition, Duke Energy Florida also performs a post job briefing.
Duke Energy conducts a daily morning safety meeting, also called a “Take 10” meeting. This meeting is led by a supervisor who prepares a safety related topic. In addition to the safety topic, the discussion includes job and site specific safety issues as part of the planning for the work of the day.
Once a month, a safety meeting is held in each of the operating centers in the South Coastal Zone; Clearwater meetings are held the first Wednesday of every month, while St. Petersburg meetings are held the second Wednesday of each month. All employees, including the network Group, attend this meeting unless unavailable because of an outage or emergency. While the Safety and Health professional participates in these meetings, they are led by the local safety committee, comprised of representation from each work group and led by an employee designated as safety chairperson. The content for the meeting includes corporate safety and training content, as well as content developed by the local safety committee.
In turn, each Operating Center Safety Chairperson and co-Chair attend a monthly Zone Safety Meeting. This separate monthly meeting includes all the safety chairs from the operating centers that comprise a Zone. Once a quarter, all Zones meet for a Florida-wide Safety coordination meeting.
An example of a practice implemented as part of Duke Energy Florida’s focus on safety is kicking off meetings with a safety message, and assigning responsibility for safety related duties in the event of an emergency, such as calling 911, or retrieving the AED. The meeting host will select a topic of interest for the group and start the meeting by sharing information on that topic. The topic does not necessarily have to be related to the meeting purpose, but rather a topic that would be of interest and generally apply to the meeting participants. An example topic would be a reminder to a meeting of field resources to identify all potential energy sources, including non-conventional (non-electric) sources such as water, steam, work equipment, etc.
Another practice of note is the “30 for 30,” a practice where every thirty minutes, participants of a meeting stand and stretch for 30 seconds. The meeting discussion does not cease, but continues as participants engage in this stretch. A timekeeper is assigned at the start of the meeting to remind participants to stretch at 30 minute intervals.
Duke Energy Florida has implemented a “Near Miss” program, where employees are encouraged to report near misses. In addition, there is a “Good Catch” program to identify situations were an employee noticed a potential safety hazard and reported it before an event occurred.
Technology
Duke Energy Florida issues a number of safety related publications, including “Connection” which is safety communication packet distributed electronically weekly to the supervisors as one document with links to other documents that include safety related topics. The other documents may include Safety Alerts describing incidents or near misses, Health and Safety Awareness bulletins, updates on safety performance, and other safety related communications. “Connection” ensures a single source is providing a unified and consistent safety message broadcast to all company employees. See Attachment K for a sample of the connections bulletin – note the links to the other safety related documents. See Attachments L , M and N for samples of a Health and Safety Awareness Bulletin, a Safety Alert Incident summary and a Safety Alert “ Near Miss ” summary.
7.8.13.7 - Duke Energy Ohio
Safety
Organization
(Culture)
People
EPRI researchers noted specific attention to safety in their visits at Duke Energy Ohio. Safe working practices were observed during field visitations, including work area protection, such as the use of traffic cones and warning tape, and personal protection, such as wearing FR rated clothing, and using continuous air monitoring.
Duke Energy recently had a leadership change, with the new leader taking a very close look at the company’s approach to safety. As a consequence of this company wide focus on safety, at the time of the EPRI immersion, Duke Energy Ohio was in the process of reviewing their safety practices, and was in the process of implementing activities to change the safety culture.
Duke’s new focus is on promoting safe behaviors. They recognized the need to move from a punitive approach to one that focuses on changing behaviors.
Sample actions underway at Duke Energy Ohio to increase safety awareness include:
-
Providing increased safety training for both management and the union. This training involves bringing people in from the field as opposed to conducting the training on a rain day. (One employee cited the fact that management brought employees in to receive this training on a nice day as evidence of their commitment to safety),
-
Requiring management employees to read a particular book on safety / performance by Aubrey Daniels,
-
Implementing a safety behaviors program,
-
Manning jobs differently. For example if a field crew calls into the office and says that they need additional resources to do the job safely, management would capitulate.
-
“Walking the talk”. Duke employees cited a specific example of an ice storm where an employee suffered a near miss. Management shut down the restoration effort to understand what had happened. The fact that management agreed to take a “time out” from the restoration during a major event meant a lot to the employees and demonstrated that management was serious about safety.
-
Another significant change in Duke’s management philosophy was getting front-line supervisors back in the field.
Duke Field supervisors have noticed a change in their safety culture as a result of these efforts. They noted that a few years back, when a supervisor would visit a crew, it used to be like “pulling teeth" to get people to adhere to the company safety rules. “Now”, they noted, “you seldom find any infractions in PPE.” Over the past two years, they have gone from “lax to careful”.
The Dana Avenue underground department had no designated safety person. However, each work group within the underground department has their own safety chairperson – en employee who represents that group at safety meetings. A question asked by EPRI investigators was “Who is responsible for safety?” The response at Duke Energy Ohio was “All of us”.
Process
Duke Energy Ohio convenes regular safety meetings at various levels in the organization, ranging from quarterly Safety Oversight Committee meetings to job specific tailboard meetings.
Duke Energy Ohio has tied company bonuses to the achievement of Total Case Incident rate targets. Incentives apply to both bargaining and non bargaining employees.
Technology
Duke Energy recently updated their safety manual. The manual is written generally, covering all areas of T & D. However, because this manual is written generally, it doesn’t cover safety issues specific to network operations.
Supervisors at Dana Avenue believe that the company should invest in a safety manual that describes safety procedures for the network. For example, “what should employees do when detectors reveal gas in manholes?” The field force knows that when the alarm goes off, they need to get out of the hole. But specific guidelines for responding safety situations in the network are not well documented.
7.8.13.8 - Energex
Safety
Organization
(Culture)
People
Improving safety is a key focus area for Energex, which is driven by the company CEO. Energex has embarked on a system-wide effort to change their safety culture. In the recent past, Energex had experienced three safety incidents, resulting in worker injuries. Energex is hoping to leverage the emotion from those events as a driver for changing the safety culture.
Energex has established a safety management system, which is a comprehensive framework that guides their safety approach, and addresses strategies for managing the hazards and risk associated with the design, construction, operation, and maintenance of the system. Strategies such as the approach to safety training, incident investigation and response, and emergency preparedness and response, are guided by this framework.
Energex has recently reorganized its safety organization, consolidating a corporate safety group, a service delivery safety group, and a people and procurement safety group to form one safety organization.
The safety organization is comprised of four departments:
-
Governance, community and assurance
-
Incident investigation and analysis, comprised of six full-time incident investigators
-
Operational safety and risk department, comprised of safety advisors (9) , and project team (4), and focused on issues such as personal protective equipment (PPE), and asbestos management,
-
Strategy, capability and performance, focused on establishing and executing a safety strategy on behalf of the company.
Process
Energex recognizes that positively influencing safety performance involves changing behaviors, and that it is a change management issue that must be addressed over time. The company has implemented a number of strategies to influence their safety culture (see Figure 1).

Figure 1:
Energex sample poster promoting safety
The company recently conducted a safety culture diagnostic, hiring a contractor to review their practices and make recommendations for change. A leading safety program is one outcome from the effort.
Safety is a company key result area. The company, through their normal business process, produces a company scorecard of KPIs, and safety is a key component. Scorecard performance is used to determine performance bonuses for all employees. The bonus pool for employees is up to six percent of salary.
Historically, Energex used lagging indicators, such as lost-time incidents frequencies, as safety KPIs. The company has elected to move away from the use of lagging indicators as KPIs used to calculate performance bonuses, and instead shifted to leading indicators, which measure preventive behaviors.
Energex’s current safety KPI is an aggregated metric comprised of the following three leading indicators:
-
Percentage of leadership safety visits conducted within expected time frames. Multiple employee types, including every level of management, have targets for performing field safely visits. The number of visits to be performed varies by job type.
-
Percent of eSafe actions closed out on time. When Energex has a safety incident, they perform a post incident investigation. Out of this investigation, they will produce specific recommendations (referred to as eSafe actions) with an expected time frame for completion. This metric is based on adherence to the recommendation implementation schedule.
-
Near Miss and Hazard Reporting Target Energex promotes the reporting of near misses and hazards. The company has noticed a proportional decrease in lost-time accidents to the increase in the reporting of these metrics.
In addition to a performance bonus system based on safety performance as measured by the leading indicators, Energex also provides cash incentives to employees who work in a particular work group who achieve certain safety milestones based on lagging indicators, such as time without a lost-time incident.
Note that lagging indicators, such as lost time, are not part of any incentive pool for front line supervisors, as Energex does not want to incent personnel in these front line jobs to cover up incidents. The company wants to create an environment where people report incidents. At the time of the practices immersion, Energex was considering shifting these payments to leading indicators.
7.8.13.9 - ESB Networks
Safety
Organization/Culture
People
ESB Networks employs a Manager of Safety, Quality, and Environment within its ESB Networks group. ESB Networks also maintains a Chief Executive Safety Committee that oversees and thoroughly documents safety procedures and practices. Representatives from throughout the company rotate onto the committee to get a more complete overview of current and evolving safety practices.
Process
Safety is engrained at every level within ESB Networks, with complete senior management support, including periodic, mandatory safety audits conducted on a regular basis. The organization has recently embarked on a four-year continuous safety improvement campaign that includes behavioral approaches, meetings, and on-the-job coaching. As a result of this and earlier initiatives, it is notable that ESB Networks has earned an OH SAS (Occupational Health and Safety Auditing System) accreditation, which is a significant industry accomplishment.
Among the “safety tenets” that ESB Networks ascribes to are the following:
-
“If it’s not safe, don’t do it.” (their most important tenet)
-
“A near-miss today could be an accident tomorrow.”
-
“We are proud of what we do.”
-
“We get it right the first time.”
-
“We look out for each other.”
As a part of its positive re-enforcement of safety policies, reporting of near-misses is not penalized, and ESB Networks finds that field personnel and Network Technicians proactively report and make recommendations for further improving safety practices.
ESB Networks spends about €4M per year on public safety advertising. Builders and contractors as well as ESB Networks personnel are proactively informed about safe digging operations near buried cable (see Attachment C: Safe Digging Procedures).
Technology
ESB Networks has recently published a new “Live Line” policies and procedures manual that thoroughly details safety issues and practices of working on live lines.
ESB Networks’ Safety Rules colloquially referred to as the “Bible”, is prepared and periodically updated by the Operations Policy group, and is available in hard copy and online. All Network Technicians receive a copy, which they must sign after receiving and reviewing it. The “Safety Rules” book contains the following:
-
Sets out how work should be organized
-
Sets out how personnel communicate with the control room operator
-
Sets out the different roles for personnel when operating on the system
-
Describes processes for grounding the system
-
Details safety clearance zones, such as working distances, etc.
These documents are available in hard copy and through the ESB Networks intranet. The company web site also posts and keeps updated documents on safety procedures on safe digging and avoiding electrical hazards through a public, online link at their web site (see Figure 1).

Figure 1:
Publically posted safety documents on ESB Networks web site.
7.8.13.10 - Georgia Power
Safety
Organization/Culture
People
The Network Underground group has a dedicated Health and Safety Advisor assigned to them, who functionally reports to the Health and Safety department at Georgia Power. The Advisor meets regularly with the larger Georgia Power Safety and Health group. The Advisor also works closely with the Storm Center and with the Cable Locating group.
In all, the Safety and Health Advisor is responsible for the training and safety management of approximately 180 people within the organization. The Network UG Manager works closely with the Safety and Health Advisor on safety and health issues related to the operation and maintenance of the network underground system throughout Georgia.
The person presently assigned to the position of advisor for the Network UG group came up from the ranks of the underground organization, serving as a Cable Splicer, so he is familiar with the unique needs and requirements for safely working in a network. The Advisor shadowed safety personnel to gain on the job training, and eventually co-chaired and chaired the safety committee while he was a Cable Splicer crew leader.
The Advisor has received formal OSHA training at Georgia Tech as well as formal training in excavating, soil analysis, and scaffolding.
Safety is a key area of focus for Georgia Power. EPRI researchers noted visible attention to safety throughout the Underground Network group, both in terms of observed work practices, work area protection and personal protection, and in the company’s proactive efforts to influence the corporate culture associated with safety.
Each morning, crews start the day with a safety discussion and a morning stretch to prepare them for the day physically and mentally.
Each work group has a weekly safety meeting to discuss incidents and near-misses, as well as a safety topic where a rule or policy is discussed.
Each group within Georgia Power has a safety committee in which every department is represented. The Network UG safety committee is comprised of volunteer representatives from Engineering, Maintenance, Cable Construction, Duct Line Construction, and Operations & Reliability. The committee meets once a month. The minutes of the meeting are recorded and distributed. The meeting addresses open issues, any recent incidents, or new ideas for improving the safety and well-being of employees.
The Georgia Power Network Underground group develops an annual safety plan which describes the various safety committees, and communicates the department safety strategy including expectations of employees, and accident reporting procedures.
(See Attachment H )
Process
Network Underground employees attend quarterly safety meetings, run and managed by the Safety and Health group, which address issues specific to the group. The group often invites guest speakers to these meetings who are experts on specific network underground safety issues.
In addition to these quarterly meetings, employees must attend yearly safety training in the following areas:
-
OSHA regulations
-
CPR
-
First Aid
-
Smith System Safe Driving refresher
-
Fire extinguishers
-
Use of AED
If any employee has a driving accident, the employee must take the full Smith System Safe Driving course (not the refresher course), as do any new employees. The Safety and Health group also brings in an expert from Industrial Hygiene and Environmental Safety to talk about the following:
-
Industrial hygiene
-
Hearing and sight protection
-
Lead awareness
-
Environmental safety, including safe handling of spills and storm water regulation
-
Battery storage
-
PCB storage
-
Safe hauling of flammable liquid
Other topics are covered as determined by the Safety and Health group within Georgia Power.
Once every two years, Georgia Power requires flagging training through the vehicle training specialists. Even though contractors are usually used for flagging, Georgia Power wants its field personnel trained as well.
Depending on crew members’ job classifications, they must also complete the following training:
-
Forklift training every three years.
-
Competent Person class on trenching, as needed
-
Enclosed space training, as needed
Local management decides what training is need for each location and when.
Competent Person Training is essential not just for safety reasons, but also in the event of an OSHA inspection at a trenching site. Each job crew must have a crew leader with the appropriate Competent Person training for the work the crew is performing. This crew leader is given a Competent Person card, which they can show to any OSHA or Georgia Power inspector.
Job briefings, led by a member of the crew, are held before each job. Crews are reminded of key safety measures that must be taken according to the tasks at hand on the site, such as protective gear required, confined spaces measures, etc. The crew member responsible for filling out the job briefing report sends it to the crew supervisor who keeps it on file for one year in a Job Briefing book. This is an OSHA requirement strictly followed by Georgia Power employees. Any qualified crew member can perform the job briefing, and the responsibility is routinely rotated to give all crew members greater familiarity of safety and job procedures.
(See Attachment I for a copy of the job briefing form.)
Since 2005, Georgia Power has instituted a safety program called “Target Zero” to emphasize that no accident is acceptable. There have been no serious injuries at Network Underground since the goal has been in place. If an accident should occur, the company resets the clock, so to speak, back to zero. It would have negative connotations, it believes, to focus on any accidents. There is a consistent focus on zero accidents, regardless. Safety is a key goal in the company’s overall performance plan.
Georgia Power also has a safety program called “100 Days of Summer” as most accidents happen in the hottest weather. It is notable that Georgia Power has an extensive safety training and compliance program, but it also emphasizes many health and safety issues off the job. One example is its “Take 5 @ the 5’s” initiative, which reminds employees to take five minutes at five before each hour to hydrate.
Georgia Power uses a number of positive motivators to re-enforce safety practices. One example is departmental awards for achieving its “Target Zero” program with the goal of zero safety incidents in one calendar year. Another positive motivator is a safety competition with a neighboring utility, Duke Power. The winners receive luggage, a cooler, or some other personal gifts. Georgia Power also has intra-company safety competitions with awards and prizes as well.
Technology
Georgia Power issues safety reports to all departments; documents safety training schedules; and issues Web site blurbs on the company intranet about safety tips, safety competitions, and safety reminders. Bulletin boards are also used throughout the company to re-enforce safety programs and safety and health messaging. Bulletin boards also display recorded deaths at the company (See Figure 1 and Figures 2 and 3) to remind everyone of the seriousness of the hazards they face every day. The Safety and Health group feels this has had a positive effect because there have been no fatalities at Georgia Power Network Underground since 1988.
Much of the Georgia Power’s communication about safety is designed to appeal to the employee’s sense of responsibility to family.

Figure 1:
Examples of safety related displays; Note that Georgia Power encourages daily stretching


Figure 2 and 3:
Examples of safety related displays
Georgia Power has what it calls the Section Zero book, which contains all mandatory safety and work procedures. The book was negotiated between company and union and covers all areas of safety including PPE specifications, housekeeping, and safety and work procedures for distribution.
7.8.13.11 - HECO - The Hawaiian Electric Company
Safety
Organization
(Culture)
People
EPRI investigators noted a strong focus on increasing safety awareness at HECO, driven from the CEO level of the organization.
HECO has recently established a new safety approach, including a new high level vision for safety, the establishment of new safety metrics, the establishment of safety goals over a three year period, and reporting of safety performance. For example they have shifted their metrics from one based on lost time accidents to one based on the EEI standard Total Recordable Cases Incident rate. This will expand their focus to all recordable incidents and enable them to better benchmark with others. Their three year safety performance targets are aggressive, aiming for first quartile safety performance[1] . They are conducting quarterly reviews to monitor progress against these goals, and make course corrections as required.
Process
HECO recognizes the change management challenges of improving safety performance. They are actively working to change a historic culture that at times found it acceptable to take risks in order to get the lights back on. They are focused on establishing a culture that recognizes that all accidents are preventable, and that employees must look out for their own safety and the safety of their co-workers. One example of an action HECO took to help change the safety culture was to include lineman from other companies (through the Northwest Lineman’s college) to supplement their safety training. These lineman brought ideas about how others do things that directly resulted in changes at HECO, such as a focus on wellness and the implementation of a morning stretching program.
HECO is also focusing on changing their approach to accident and incident investigation to be more focused on prevention. This includes the development of a Near Miss program that includes investigation of “near misses” that could have resulted in either damage to equipment, outages, or injury.
HECO has also implemented a Job Hazards Safety Process.
HECO has taken steps to increase safety dialogue among employees, including conducting frequent safety meetings, requiring worker tailboard meetings, and implementing the Work Environment Specialist position, to identify and address safety issues without employees fearing any punitive reprisal ( See Work Environment Specialist). HECO wants to change a historic perception that some hold that company safety professionals are focused on placing blame, rather than determining root causes to prevent future similar incidents.
Technology
HECO has made recent changes to their personal protective equipment approach, requiring a Level 2 clothing system, including 8 Cal FR rated clothing and the use of face shields. (See Personal Protective Equipment)
[1] Based on EEI Benchmarking comparisons
7.8.13.12 - National Grid
Safety
Organization
(Culture)
People
EPRI researchers noted visible attention to safety at National Grid, both in terms of observed work practices, work area protection and personal protection, and in the implementation of safety strategies to develop a safety culture. This was evidenced by practices such as beginning every employee meeting with a “safety moment”, conducting both formal and informal safety meetings and inspections, and in using the impact on safety as a key factor in evaluating project priority.
National Grid appears to have been successful in inculcating safety into its culture. EPRI researchers participated in several meetings where employees, as part of the “safety moment” volunteered and transformed a description of a personal experience associated with safety into an impromptu safety message for the benefit of all meeting participants.
Internal surveys conducted by National Grid reveals that employees believe the company to be serious about safety.
National Grid employs safety professionals who work to develop and implement strategies to influence the safety culture. Organizationally, safety professionals are grouped functionally, with individuals focused on electric safety in a separate group from those that focused on gas, shared services, etc. Within New York East, there are two safety professionals focused on electric operations – one for overhead lines, and one for underground lines and substations. The safety professional responsible for underground lines and substations has a four year degree in Safety, is a Certified Safety Professional, and has experience working for a number of large companies in a safety area. National Grid employs safety professionals with a variety of backgrounds and experience.
National Grid has an investment management group which is responsible for overseeing the justification and risk analysis of specific projects. In particular, it is responsible for prioritizing project based on risk analysis, and thus plays a crucial role in directing resources to mitigating safety risks.
Site visits to assess work crew safety are undertaken both formally and informally. Formal compliance assessments are conducted so that each employee is observed and reported on at least once per year. Informal assessments are conducted using the Safe and Unsafe Acts (SUSA) visits model, where a work group is observed without their knowledge (most often by their direct supervisor) and then engaged in a discussion centered on how their activities may have been safe or unsafe, and how to resolve the unsafe acts in the future.
Pre-job briefings are an integral part of day-to-day safety. These outline the site-specific safety hazards, equipment, and techniques that will be encountered or used on the job. The employee in charge of the work delivers these briefings. If the supervisor is on site, he/she is considered in charge of the work and the job briefing. If not, the crew chief, crew leader, working leader, working foreman, or similar person is in charge of the work and the briefing. During the briefing, the crew assesses the job site and surroundings and discusses the types of hazards present.
The entire crew, including the supervisor, is expected to be focused on safety in all work. A copy of the electric operating procedures (EOP) book is required to be in the service van and available to the work leader. A committee of field workers and supervisors, engineers, and the Safety Department revisits all EOPs on a three-year schedule.
There is mandatory first aid training for crews, which covers both first aid and rescue procedures. Yearly manhole rescue training is conducted. Other training includes air monitoring procedures and personal protective equipment training.
Overall safety is assessed across lines of business with the use of a calculation tool called the Safety Pyramid.
Process
National Grid has a number of safety management practices in place designed to achieve their vision of being a world-class safety organization. These include on-site safety assessments, pre-job briefings, electric operating procedures (and review cycles), and general safety measures. Some of these practices will be discussed in more detail in this report.
On-Site Safety Assessments
National Grid conducts two types of on site safety assessments – the Safe and Un Safe Acts visits and Compliance Assessments.
Safe and Unsafe Acts (SUSA) visits or observations are done by supervisors six times per month and by work methods people four times per year. These are informal assessments designed to give employees feedback, and engage them in the process of thinking about safety in their work.
A more formal Compliance Assessment is conducted for every employee at least annually. This Compliance Assessment is a formal observation that connects an employee to the work that he/she is doing, holding them accountable for their activities and the state of equipment they are responsible for. Department supervisors are responsible for performing two compliance assessments per month. Operating departments conduct surveys of the field conditions periodically to ensure there is full awareness of configurations in the field. Additional incident analyses may follow significant findings of concern.
Pre-job briefings
Job briefings are conducted at the start of the each job, and are led by the person in charge of the work (either the supervisor, or a crew leader or similar position). Additional job briefings are held whenever there is a significant change in the working conditions that might impact the safety of employees. The job briefing is documented and signed by the designated employee in charge of the job. (See Attachment K )
The briefing covers hazards associated with the job site and its surroundings. During the briefing, the crew identifies all hazards, both electrical and non-electrical, in the work environment. Difficult physical work, including strain, awkward positions, and difficult lifting is discussed. The briefings cover all of the hazards associated with the job, work procedures, special precautions, energy source controls, personal protective equipment requirements, and a warm-up / stretch period.
The scope of the discussion depends on the job and how it relates to employee experience and training. Brief discussion is allowed for routine work, where it is expected that employees have the experience to recognize and avoid the hazards of the job. Extended briefings are required where employees are unfamiliar with the hazards, or the work is particularly complicated or hazardous.
Employees working alone do not need to conduct formal job briefings but are expected to plan tasks and perform them as though a job briefing were being done.
Electric Operating Procedures (EOP)
Correct operating procedures are an important safety consideration. National Grid has developed an Electric Operating Procedure manual that covers safety aspects such as the type of personal protective equipment to be used, grounding methods, and other working methods. These procedures were developed by committees with representatives from engineering, construction and operations, and safety, and are re-visited every three years to ensure they are up to date and correct. A variety of conditions may be assessed in their preparation. For example, a study of all the potential hazards a cable splicer might be exposed to would be conducted to determine the types of personal protective equipment to be used and the procedures that are most appropriate.
National Grid has a number of other notable general safety practices in place to ensure the highest standards of safety are adhered to. These include:
PPE Requirements
Personal Protective Equipment (PPE) includes hardhat, ANSI safety glasses with side shields, steel toed EH-rated boots, and outer layer protective wear with an Arc Thermal Protective Value rating of 8 cal per square centimeter, and with all natural-fiber clothing underneath.
National Grid requires hearing protection for anybody working on an activity with suspected or measured noise exceeding safe levels, and posts warning signs in high noise areas. If noise levels interfere with understanding normal conversational speech, hearing protection is required. Note that National Grid has implemented a Hearing Conservation Program that includes implementing administrative and engineering controls to reduce noise exposure and offering targeted training on hearing protection to employees.
Tethering
Crews in vaults are tethered at all times, except if it is unsafe or impossible. In this case, it is documented in the pre-job briefing, and crew leaders must authorize the acceptable conditions for untethering. National Grid has had this policy in place for approximately ten years.
Continuous Air Monitoring
Crews use continuous monitoring for combustible and other dangerous gases. Crew members wear portable four gas monitors, with at least one person on the crew in the hole wearing an air monitor at all times. A full time attendant must remain outside the vault at all times and cannot enter the vault.
Equipment
All trucks have an automatic vehicle location system, and a Code Blue button. In the case of an emergency, the Code Blue button is pressed, and the truck’s system notifies the Operations Center. The Operations Center then calls 911 and directs services to the truck’s location based on the GPS coordinates. Every truck is also equipped with a first aid kit.
Technology
National Grid’s safety monitoring practices allow it to compare safety between different lines of business within the organization. The tool used for this is the Safety Pyramid. This conceptual tool gives a safety score that is a composite measurement of various types of incidents, weighted by their severity. It includes Lost Time Incidents, Restricted Work Day Cases, OSHA Recordable Incidents, Switching Errors, Motor Vehicle Accidents, SUSA and Compliance Assessments, Significant Hazard Reports, and Near Miss Incidents.
7.8.13.13 - PG&E
Safety
Organization
(Culture)
People
EPRI researchers noted visible attention to safety at PG&E, both in terms of observed work practices, work area protection and personal protection, as well as in the implementation of safety strategies such as the conducting of safety meetings and inspections and design changes to reduce potential exposure to employees and the public.
PG&E has effectively implemented an asset management process for network equipment, assigning a specific person as the “Manager of Networks,” part of the Distribution Engineering and Mapping organization. This asset manager is responsible for determining the investment, maintenance and replacement strategies for network assets including network transformers, network switches, and network protectors. The manager of networks noted that much of the investment in the network is really focused on maintaining and improving safety rather than reliability, as network secondary systems are inherently reliable by virtue of their design. PG&E has made space specific design changes to improve worker and public safety.
EPRI observed strong working relationships between the manager of networks, and other key PG&E resources focused on network management. The manager of networks was visible and known to the field force, periodically meeting with field crews to review topics of interest, often safety related topics.
Safe working practices were observed during field visitations, including work area protection, such as the use of traffic cones and warning tape, and personal protection, such as wearing FR rated clothing, and using continuous air monitoring.
Safety related training is incorporated into the formal training provided to cable splicers. Each course offered to splicers through their job progression includes safety related issues such as manhole safety.
PG&E has established safety goals set at the division level and are not broken down to the M&C Electric Network group. However, the Group’s safety performance contributes to the divisional goal.
Process
PG&E has incorporated safety processes, such as safety meetings, safety training, safety observations, and the routine conducting of tail board meetings into their work processes. For example, the Superintendent, Vice President of the M&C Electric Network group conducts two safety observations per week. One PG&E employee noted that the company’s emphasis on safety is such that “anyone can bring up a safety issue or stop a job because of the potential safety issue”.
PG&E uses a document called a “Utility Bulletin”, which is a document that notifies the crews of key issues, including safety related issues.
PG&E has implemented design changes to improve the overall reliability and safety of the system.
-
One such safety-driven design strategy is PG&E’s implementation of a program to replace oil filled transformers located in high rise buildings with dry type transformers to mitigate the potential effects of a catastrophic failure of an oil filled transformer.
-
Another is their decision to change the network unit design from one with a transformer mounted primary switch compartment to one with a remotely located solid dielectric switch as a primary sectionalizing point. This decision eliminates a potential failure point, preventing a failure of the primary switch compartment from migrating to the transformer tank itself, and thus expanding the potential severity of the event.
-
Another is the installation of a new manhole cover system designed to improve safety by reducing the risk of collateral component and infrastructure damage.
Technology
PG&E maintains a Safety Health and Claims Website that provides employees to safety and health related materials.
Safety and health related placards and notices were evident at all PG&E facilities visited by EPRI researchers.

Figure 1:
Safety Placard at San Ramon Training Center
7.8.13.14 - Portland General Electric
Safety
Organization
(Culture)
People
Safety is a core value at PGE, and the company has developed a comprehensive program to protect workers, customers, and the public. Many programs are implemented company-wide and also cover the network system, while the CORE also has its own safety programs to cover the unique operating conditions of the underground system.
Executive Safety Council (ESC): PGE has created an ESC to oversee safety across the company. The safety officers and senior management representatives on the ESC regularly meet with employee groups to listen to any concerns about safety and share information about PGE safety initiatives 15 [1].
Safety Coordinator for Eastern Region: Every region in PGE’s service territory has a safety coordinator. The present coordinator for the Eastern Region, which includes the CORE, has over 30 years of experience and began working for PGE as a journeyman.
Safety Coaches: To ensure that there is a conduit between management and field workers, PGE employs safety coaches who work with the safety team. Safety coaches are members of the union who volunteer to represent their department.
They discuss safety issues and events with management and the safety team to ensure that any concerns are dealt with and escalated if needed. Safety coaches sit on the Safety Committee, which meets monthly. The CORE group has one safety coach, and the position is rotated every 2-3 years. The CORE safety coach is a journeyman with normal duties who acts as a point of contact if crew members have a safety concern or experienced a near miss. Safety coaches discuss concerns and incidents amongst themselves during monthly meetings and determine what actions should be taken. In addition, prior to the monthly meeting, the safety coach spends time talking with crews to find out any issues that can be raised at the meeting.
The safety coaches complete a Safety Committee training program provided by the training department, which includes the following:
- Occupational Safety and Health Administration (OSHA) training
- “Why You Are a Safety Coach”
Ergonomic Specialist: PGE employs an ergonomic specialist who oversees a number of training programs to enhance safety, including compliance training. The main goal of the specialist is to prevent injuries, and the specialist undertakes regular field visits to discuss safety with employees across PGE.
The ergonomic specialist also works with the safety coordinator to mitigate injuries. One example is an effort underway to prevent worker injuries when removing heavy manhole covers, a priority issue within PGE. Another example is a tool initiative being implemented across the company, using battery-operated tools to minimize injuries such as repetitive motion injuries from using hand tools.
The ergonomic specialist is involved in the workers’ compensation program and liaises with an external vendor to provide the MoveSmart program. MoveSmart shows employees how to move their bodies in ways that minimize strains and other injuries. PGE has implemented a one-day “Train the Trainer” course for the MoveSmart program.
Process
Safety Meetings
To maintain the focus on safety and its priority across the entire company, PGE holds regular meetings to address concerns and ensure implementation of programs across the company.
Weekly Safety Coaches Meeting: On Mondays, the safety coach organizes the weekly safety coaches meeting, which is open to all and includes members of all groups, including engineering and design. This helps engineers gather any concerns raised by line crews. The meeting agenda includes a review of the action register, running list of open action items, discussion of near misses, and round table discussions of safety-related topics.
Weekly Conference Call: Every Thursday, the company holds a weekly conference call that includes supervisors from the various line units, management, and safety coaches from across PGE. This wider conference call may include the senior management of the company and is intended to share information between regions. A rotating facilitator manages the call.
To ensure that information is shared across the company that important information is passed to the line crews, any issues raised during the weekly conference call are discussed during the local safety calls held every Monday morning. Action items from the Thursday conference calls are logged on the Action Register alongside the expected completion dates. During the Monday morning safety meeting, time is always allotted for reviewing these actions.
Safety Committee: The Safety Committee, which meets monthly to discuss safety across the region, includes all safety coaches, safety coordinators, and the regional management team. At this meeting, the Regional Safety Coordinator raises a particular topic of local interest for discussion in the weekly meetings.
On a quarterly basis, all regions (Eastern, Southern, Western) hold a larger quarterly safety meeting. A chairman oversees quarterly meetings and union representatives initiate them.
Weekly Meeting: Every Monday morning, PGE line crews hold a Monday morning safety meeting, which for lasts about an hour. The meeting begins with an update about events occurring in the city and a discussion covering whether any of these will affect scheduled work. The meeting also includes a list of issues and near misses encountered in the field and in the yard during the previous week, as reported by crews. The meeting always begins with a safety moment, in which an item from the safety manual, such as foot protection, is reviewed. The meeting also includes the Action Register Review with points discussed during the Thursday conference call. Meetings are never rushed and line workers are free to raise any issues. The meetings also discuss action plans from previous meetings.
For example, one meeting saw crews raise the issue of sewer gases in vaults. The foreman leading the discussion explained the procedure that crews should follow if they suspect that sewer gases are present in a manhole/vault. They were informed that they should not enter the vault and instead report it to the repair organization, which calls out a contractor to clean the vault. Workers should never expose themselves to any airborne pollutants.
Some other examples of issues discussed at meetings include the following:
-
Crews noted that a number of vaults had a new collector bus installed, but the spacing between the conductors was extremely tight. This could present a safety issue during future work. In order to mitigate the safety risk, crews installed insulation blankets over the secondary cable and posted notices in the vault stating that before any work is performed in the vault, the feeders should be de-energized.
-
One worker raised the issue of shared vaults with a neighboring utility, noting that there should be a better notification system to ensure that the other company does not perform switching or other tasks that could pose a hazard to workers ensconced in enclosures. Tailboards: At every job site before the work begins, the crew holds a tailboard meeting. A tailboard sheet informs and records the contents of this meeting. The dashboard displays the sheet, which all employees must sign to show that they understand it. Completed tailboard sheets are filed to maintain a record of the job discussion. The safety coordinator periodically reviews them. See Appendix C.
Safety Initiatives
Near Miss Program: PGE uses a formalized program in which a program called My Safety documents near miss situations online. All employees have access and the safety coach may assist in filling in details. Near miss incidents can be submitted anonymously.
Safety professionals across the system view any items entered into the My Safety program, and important topics are selected each week for discussion at the weekly meeting.
If a near miss incident did not violate the safety rules or result in a direct injury, there will be no disciplinary consequences. Where rules were violated or an injury or damage occurred, the supervisor pursues the matter, and consequences depend on the results of the supervisor’s investigation.
Safety Coordinator Crew Visits: One of the main roles of the safety coordinator is to conduct field visits, and each coordinator must log at least 200 crew visits every year. During a site visit, the coordinator looks for any safety violations. The coordinator records each visit, noting what was found, the date of the visit, the name of the foreman, the job address, and the crew number.
The CORE supervisor tries to make at least five crew visits per week and fills out a safety observation form. These forms are used across the company, so some of the items on the form are not applicable to CORE work. Relevant items include the following:
-
Vault entry
-
Traffic control
-
Personal protective equipment
-
A general comments section
Focus on Safety: PGE has a companywide focus on safety, including using numerous safety related key performance indicators (KPIs) to track performance for all supervisors. Overall, PGE’s safety performance is very good, and the corporate goal is to achieve zero injuries. In the past four years, PGE has cut the number of injuries annually from 160 to 80 across the company.
PGE believes that the main reasons for this improvement are the following:
-
Improving communication and discussions about safety
-
Convincing employees that it is possible to work without injuries by rigorously adhering to safety practices, not compromising safety to get the job done, and consistent management attention and support of safety
-
Focusing on training
-
Becoming more diligent with the stretching program to reduce the number of soft tissue injuries. This stretching program was a grass roots initiative in one of the PGE regions and resulted in a dramatic reduction in number of strains and sprains. It was adopted company-wide, with employees leading it.

Figure 1:
PGE Stretch Program One poster
Within the CORE group, the biggest cause of injuries is lifting manhole covers. The overall incident rate fell by 38% between 2015 and 2016 for the Eastern Region.
Grassroots Safety: The grassroots safety programs in place at various PGE sites actively seek feedback from employees and rely on the experience of field workers to identify any safety issues, and work to rectify them. PGE believes that these grassroots programs can help workers completely eliminate hazards, improve practices, and assure compliance with regulations [1].
Tool Program: One company-wide initiative saw the standardization of the power tools used by crews, sourcing them from a single manufacturer and shifting away from hand tools to battery-operated units. In terms of safety, this ensures fewer repetitive injuries, reduced incidences of carpel tunnel syndrome, and better ergonomics.
Confined Space Entry: If a crew notices any evidence of sewer gases in manholes/vaults, it does not enter the space. Instead, it calls the repair organization, which arranges a contractor to clean the vault.
Personal Safety: PGE has a documented lead safety procedure that contains requirements for working with lead, including respiratory requirements. At present, PGE uses an onboarding process for employees, which includes taking a base level lead blood count. PGE has a periodic lead blood testing program and intends to place additional emphasis on lead working practices and lead testing.
PGE has also reviewed its mandatory drug and alcohol testing program. Previously, a drug test was mandatory when an employee injury occurred. However, this practice led to criticisms by employees who felt that the company cared more about drug compliance than occupational health. PGE redefined the procedure to reassure employees that properly addressing the health issues was the top priority.
Accident Response: During an accident, PGE procedures dictate that the crew should call the System Control Center (SCC) with the relevant information. In addition, either the crews or SCC contacts emergency services. The SCC completes an online form that is distributed to approximately 150 people automatically and calls out the safety coordinator responsible for the network. In addition, PGE has a Crisis Response Team that responds to situations of employee injury. Representatives of this team travel to the hospital with the injured employee and notify the family. Using this team removes the burden from the SCC. This protocol was implemented approximately 10 years ago.
Automatic Vehicle Location (AVL)systems are standard in PGE vehicles and help dispatchers monitor the location of crews, as well as match crew skills with the emergency [2].
Technology
My Safety Application: To record safety incidents, every employee has access to the web-based My Safety application, which includes basic identification information, dropdowns, and checkboxes to complete, as well as a comments section to elaborate on the incident/issue in question. Alternatively, a paper form that mirrors the application input form can be completed and passed on to an administrative person within the safety organization who will enter the details into the system.

Figure 2:
My Safety" submission of a near miss screen shot
The My Safety application can be used to report safety incidents, near misses, and to provide recognition to a peer for good safety performance. The system is also used to record contractor-reported incidents/issues.
-
Portland General Electric 2015 Service Quality Measure Report. Portland General Electric, Portland, OR: 2015. http://edocs.puc.state.or.us/efdocs/HAQ/re61haq161241.pdf (accessed November 28, 2017).
-
R. Lewis II. “Mobile Tools Maximize Productivity at PGE.” Transmission and Distribution World, January 27, 2015. http://www.tdworld.com/features/mobile-tools-maximize-productivity-pge(accessed November 28, 2017).
7.8.13.15 - SCL - Seattle City Light
Safety
Organization
(Culture)
People
SCL Network crews do not feel pressure to sacrifice safety for productivity. They believe the network system is very safe. Network crews have high confidence in the system design, in the way the system is maintained, and in the way the network enclosures are constructed.
SCL’s approach to safety violations is non-punitive. Any punishment associated with safety is tied to breaking the work rules, not the accident itself.
Documentation
SCL’s safety manual is the Washington State Department of Labor and Industries Safety Standards for Electrical Workers, Chapter 296-45 WAV.
Training
Each year, every network employee attends 3.5-5 days of training that includes mandatory training such as confined space, manhole rescue, first aid, etc., as well as nonmandated training on pertinent topics.
SCL conducts various meetings to ensure a good flow of information relative to safety. Network employees attend:
-
Monthly safety meetings
-
Weekly crew chief meetings
-
Monthly “all network” meetings, where they bring everyone together to talk about training, safety, report out from conference findings, etc.
-
Bi-weekly Crew Coordination meetings, where safety issues related to specific jobs are discussed
-
Tailgates at the start of day, and after lunch each day
Process
Field Safety Coordinator Position
SCL has a program where they rotate a Cable Splicer into a Field Safety Coordinator position for a period of one to two years. This person is responsible for performing safety crew inspections and communicating safety issues.
Safety Accident Investigation
SCL has a process for convening a fact-finding investigation meeting after an accident within a certain time frame. These post-accident investigations sometimes result in work practice / process changes based on lessons learned from the investigation.
Visible Break Requirement
SCL requires a “visible break” as part of their clearance procedures. They contend that this requirement – being able to observe the visible break on the transformer primary switch through the site window, and also pulling the fuses when opening the network protector – has led to their strong safety record.
Safety Apparel
At the time of the EPRI immersion, SCL did not require flame-retardant clothing for its field workers.
Technology
Cable Testing and Grounding
In order to test that a cable is dead, SCL uses a Husky guillotine cutter with a ground for the purpose of spearing and grounding cable at the same time. They developed this tool, in partnership with Husky, because of concern with spearing their cable given the three-conductor cable they are using. The tool cuts and grounds the cable remotely after the crewman has left the vault.
Wrench with Captive Bolt Feature
SCL has developed a tool for keeping the nuts that are removed when removing network protector fuses captive. This eliminates the risk of a nut falling to the energized portion of the network protector.
7.8.13.16 - Survey Results
Survey Results
Safety
Organization
Survey Questions taken from 2018 survey results - safety survey
Question 7 : Do you have a “safety person”, (either a fulltime safety professional or other employee assigned to a safety role) focused on the network?


Question 8 : If you have a safety person focusing on the network, is the person a full time safety professional, or another employee assigned to a safety role?


Survey Questions taken from 2012 survey results - Safety
Question 8.1 : Do you have a “safety person”, (either a fulltime safety professional, or other employee assigned to a safety role) focused on the network?

Question 8.2 : If you have a safety person focusing on the network, is this person a full time safety professional, or another employee assigned to a safety role?

Survey Questions taken from 2009 survey results - Safety
Question 8.1 : How many days per year of safety training do your network field personnel receive per person?

Question 8.3 : Do you have a “safety person”, (either a fulltime safety professional, or other employee assigned to a safety role) focused on the network? (This question is 8.1 in the 2012 survey)

Question 8.4 : If you have a safety person focusing on the network, is this person a full time safety professional, or another employee assigned to a safety role? (This question is 8.2 in the 2012 survey)

7.8.14 - Personal Protective Equipment
7.8.14.1 - AEP - Ohio
Safety
Personal Protective Equipment
People
EPRI researchers observed strict and consistent adherence to the use of personal protective equipment (PPE) by AEP Ohio network resources. AEP network employees are required to wear a hardhat, safety glasses, and outer layer flame resistant (FR) clothing (level 2 standard). Reflective vests are required in traffic areas. AEP may differentiate PPE requirements based on task. For example, in 480-V vaults where potential arc energies are high, workers will supplement PPE with a higher rated outer garment to perform some activities.
Technology
AEP is very focused on safety for its network workers. The Network Engineering Supervisor seeks “engineered solutions” rather than “administrative solutions” wherever possible in order to add another level of safety, in case someone inadvertently forgets or omits an administrative step. This focus on engineered solutions is evident in AEP Ohio’s network unit standard, and in particular its selection of safety features associated with it network protectors.
Safety features associated with the protector include:
-
Dead front unit
-
“Stack light” annunciator system indicating protector status
-
Remote rackout feature
-
ARMS module – arc reduction system – ordered on all 480-V protectors.
-
For 480-V NPs, use external disconnects on top of the protector
-
External disconnect keys cannot be retrieved unless protector is opened to prevent attempting to disconnect the protector from the secondary under load.
7.8.14.2 - Ameren Missouri
Safety
Personal Protective Equipment
People
EPRI researchers observed strict and consistent adherence to the use of personal protective equipment by Ameren Missouri resources, including hard hat, safety glasses, FR rated clothing, and rubber goods protection when required.
Technology
Ameren Missouri requires flame resistant (FR rated) clothing for its employees in accordance with the IEEE standards. They have a documented protective apparel policy that defines the protective apparel requirements for employees of different classifications. In general, underground employees are required to wear Ameren Missouri approved FR apparel above the waist as their outermost garment. Below the waist, they require clothing that is either FR rated, or 100% natural fiber that is 11oz or more.
Ameren Missouri may differentiate the clothing required based on tasks. For example, a Traveling Operator will don a lab coat style 40 calorie flash suit when testing for potential on a test breaker or racking out a network protector.

Figure 1:
Ameren Missouri Worker PPE

Figure 2:
Ameren Missouri Worker PPE
Ameren Missouri is not requiring tethering or lifting harnesses for workers who enter vaults. This is, in part, due to the vault entrance design which includes a pull – out access and protection apparatus referred to as either the “safety basket” or the “cage”. The “cage does not provide room for the lifting apparatus to be set up over the vault mouth, and would prevent a worker from being lifted vertically out of the vault.

Figure 3:
Work Area Protection – Manhole

Figure 4:
Work Area Protection - Vault
Ameren Missouri uses a manhole rescue apparatus set up over manholes, and requires employees to wear harnesses and be tethered (rope tethers) to the lifting apparatus when working in manholes. If an employee has to move to an area in the manhole where he feels he is unsafe, he can disconnect from the tether - but in general employees stay tethered.
7.8.14.3 - CEI - The Illuminating Company
Safety
Personal Protective Equipment
People
At FirstEnergy, all layers of clothing must be FR rated (Flame Resistant), except underwear.
First Energy provides employees with a $250/ year per person clothing allowance. In addition, employees are provided an allowance for the purchase of safety shoes.
The level of protective equipment required and the vendors from which clothing is purchased are chosen by the Corporate Safety department.
The wearing of ear rings by Underground Electricians is prohibited.
Process
FirstEnergy is in the process of moving to a 12 cal[1] clothing system for all line workers, including Underground Electricians. This change was driven, in part, by changing NEC and OSHA guidelines surround arc flash hazards and personal protective equipment.
All employees will be issued an FR T shirt and will be required to wear layers of FR clothing as required to meet the 12 cal requirement.
Face protection in addition to a hardhat and safety glasses (such as a face shield or balaclava) will be required in certain applications.
Technology
FirstEnergy is in the process of moving to a 12 cal clothing system for all line workers, including Underground Electricians.
[1] Clothing system with an Arc Thermal Performance Value of 12 cal / cm2
7.8.14.4 - CenterPoint Energy
Safety
Personal Protective Equipment
People
CenterPoint resources noted that PPE infractions were the most often reported observations made by the HERO employee based safety program (See HERO Program ).
Process
In light of the changes on PPE required due to arc flash rule changes, CenterPoint recently changed its standard clothing level for underground workers from heavy cotton to an 8.7 FR shirt, worn on top of a T shirt.
Technology
CenterPoint’s standard PPE is comprised of a hard hat, safety glasses, long sleeve FR Level 2 shirt, cotton pants, shoes with puncture resistant soles (steel toes not required), and a traffic vest if working on the street.
CenterPoint does vary the PPE requirements, depending on the work type. For example, when working on 480V systems in the network, an FR jacket and face shield are required in addition to the standard PPE.
7.8.14.5 - Con Edison - Consolidated Edison
Safety
Personal Protective Equipment
People
Safety Culture
EPRI investigators noted a strong and visible focus on safety at Con Edison. In every facility that EPRI investigators visited, safety goals and performance reports were conspicuously posted. At every visited worksite, EPRI investigators noted safe work practices including traffic and pedestrian control, the use of personal protection, the wearing of safety harnesses by Con Edison’s workers, a lifting crane set up outside of the vaults, and continuous air quality monitoring.
7.8.14.6 - Duke Energy Florida
Safety
Personal Protective Equipment
People
Safety is a key area of focus for Duke Energy Florida. EPRI researchers noted visible attention to safety, including good work area protection and the use of personal protective equipment (PPE).
Duke Energy Florida network safety standards and equipment are supervised by the Lead Health and Safety Professional for the South Coastal Zone.
All Duke Energy Florida Electrician Apprentices and Network Specialists are certified in CPR, First Aid, and trained to reduce/prevent the risk of spreading blood borne pathogens.
The use of personal protective equipment is one of Duke Energy Florida’s “Keys to Life”, a practice which is essential to maintaining personal safety and is thus, non-negotiable. See Special Safety Programs - “Keys to Life”.
Process
All PPE is thoroughly inspected every six months at the DCC, and is inspected daily at all job sites. As a safety precaution, all employees at the job site are not allowed to wear jewelry.
Duke Energy Florida may differentiate PPE requirements based on task.
Duke Energy Florida believes that in order for employees to respond to an emergency quickly and effectively, they must have the necessary tools readily available. To that end, the company is in the process of consolidating field crew truck safety equipment. Unlike many operating companies, where First Aid and Automated External Defibrillator (AED) equipment are kept in separate bins, the company is standardizing on Safety Backpacks, containing both first aid kits and AEDs. Duke Energy Florida will complete the deployment of standardized backpack kits with AEDs and first aid supplies on all company vehicles this year.
Technology
All work crews are equipped with the following PPE:
-
Fire retardant (FR) clothing (8-12 Cal, 65 Cal for 480V spot networks)
-
FR high visibility safety vest
-
Harnesses
-
Steel toed boots
-
Rubber gloves
-
Leather work gloves
-
Safety glasses
-
Hard hats
Duke Energy Florida is implementing standardized backpack kits, containing both first aid kits and AED’s, to ensure that both the equipment and the training on the use of that equipment are uniform throughout the company. In addition, since the kits are standardized, field workers will know all what first aid supplies are available and be ready in the event of a medical emergency if they are working with different vehicles.
7.8.14.7 - Duke Energy Ohio
Safety
Personal Protective Equipment
Technology
Duke Energy Ohio requires flame resistant (FR rated) clothing for its employees. Duke does not differentiate the clothing required based on tasks.
Duke requires head protection, glasses, a sturdy work boot with a defined heel, FR rated shirt and pants, and vests for traffic control when applicable. At the time of the immersion, Duke was not yet requiring a jacket or a hood.
Duke does not require steel toed boots indicating that the weight of the equipment is such that the steel toe wouldn’t really protect the foot anyway and could potentially do more damage.
Duke Energy Ohio requires a 4.2 calorie FR clothing system with 100% natural fiber underneath. Duke provides an allowance to the employee for purchasing the clothing.
Duke recently implemented the wearing of harnesses by field employees when working in a submersible manhole or vault. At the time of the EPRI immersion, Duke Energy Ohio was not utilizing a lifting crane or tethering workers.
7.8.14.8 - Energex
Safety
Personal Protective Equipment
People
Energy Networks Australia (ENA), an organization that represents the interests of distribution utilities in Australia, and somewhat analogous to the role of EEI for U.S. utilities, has developed a guideline for PPE, which establishes minimum requirements, based on clothing system testing.
Process
At the time of the immersion, Energex was shifting from an all-cotton clothing requirement, to a fire resistant (FR) clothing requirement. Energex is conducting clothing tests on various clothing types to establish a final clothing system / system level. Energex anticipates a shift to all FR-rated clothing within the next 12 months.
7.8.14.9 - ESB Networks
Safety
Personal Protective Equipment
Technology
ESB Networks Issues personal protective equipment to all field technicians, including arc-protective jackets with a flash shield used for switching. Gear is regularly inspected for flaws, and replacement equipment is issued if needed.
7.8.14.10 - Georgia Power
Safety
Personal Protective Equipment
People
The use and specifications of PPE by Georgia Power follows strict OSHA rules and IEEE guidelines with additional specifications developed and implemented by Georgia Power’s Safety and Health group. EPRI researchers observed strict and consistent adherence to the use of personal protective equipment by Georgia Power personnel during its immersion visit to job sites, including hard hat, safety glasses, FR rated clothing (Level 2), and rubber goods protection when required.
Process
According to tasks, as detailed in the Section Zero book and through training, employees are expected to wear the appropriate gear for the job they are performing. For example, Cable Splicers must be in FR clothing, hard hat, eye and ear protection, steel toed boots with a defined heel, and rated gloves when appropriate.
Employees receive a three hundred dollar per-year safety clothing allowance for their basic FR pants, shirt, and coveralls. Management orders the coveralls with a company to make certain that standard clothing is used by all personnel. Any additional protective gear such as rubber or Kevlar gloves, face shields, switching smocks, etc. are provided by the company and stored on crew trucks.
Georgia Power has washers and dryers on the premises for employees to properly launder and inspect their equipment on a regular basis. Employees are expected to turn in worn or defective PPE and replace it. Georgia Power Safety Inspectors can search trucks and inspect PPE equipment; if defective PPE is found, the Safety Inspector will confiscate it.
Technology
Georgia Power has rubber goods exchange areas for recycling and replacing worn rubber goods. Uniform condition guides are prominently posted in work crew areas (See Figure 1 through Figure 3.).

Figure 1:
Rubber goods exchange area

Figure 2:
Rubber goods exchange area

Figure 3:
Uniform condition guide
7.8.14.11 - HECO - The Hawaiian Electric Company
Safety
Personal Protective Equipment
People
HECO requires that employees wear FR (Flame Resistant) clothing, and is using an 8 Cal clothing system. HECO C&M underground employees wear HECO coveralls.
HECO also requires steel toed shoes, hard hats and safety glasses
HECO has recently implemented the use of face shields for UG C&M employees anytime they are grounding, switching, or working within five feet of energized equipment. Early issues associated with this change are increased difficulty in communications and fogging of the face shields.


Figure 1 and 2:
HECO employees wearing face shields
Process
HECO provides an allowance to C&M field employees for the purchase of flame retardant clothing. Employees have access to an account through which they can order flame retardant clothing up to the allowance amount. Most of the Underground C&M employees observed by EPRI wear FR rated coveralls provided by HECO.
C&M Underground employees are responsible for washing their own FR clothing with the exception of the coveralls, which are washed by HECO through an arrangement with a cleaning service.
7.8.14.12 - National Grid
Safety
Personal Protective Equipment
People
EPRI researchers observed strict and consistent adherence to the use of personal protective equipment by National Grid resources.
Technology
National Grid required Personal Protective Equipment (PPE) includes a hardhat, ANSI safety glasses with side shields, steel toed EH-rated boots, outer layer FR protective wear with an Arc Thermal Protective Value rating of 8 cal per square centimeter (Level 2), and all natural-fiber clothing underneath. Reflective vests or outer garments are also required in traffic areas.
National Grid may differentiate the clothing required based on tasks. For example, a higher arc flash rated outer garment is required to perform switching in some applications.
National Grid has a hearing conservation program. Hearing protection is required for anybody working on an activity with suspected or measured noise exceeding safe levels, and warning signs are posted in high noise areas. If noise levels interfere with understanding normal conversational speech, hearing protection is required. Administrative and engineering controls to reduce noise exposure are being implemented where possible. Specific training for employees is also being offered.
National Grid uses continuous gas monitoring, with portable four gas detectors worn by employees.
National Grid workers wear lifting harnesses with tethers. A breakaway rescue lifting apparatus is set up at the manhole entrance.

Figure 1:
PPE

Figure 2:
Breakaway rescue lifting apparatus is setup at manhole entrance

Figure 3:
National Grid workers wear lifting harnesses with tethers
7.8.14.13 - PG&E
Safety
Personal Protective Equipment
People
EPRI researchers observed strict and consistent adherence to the use of personal protective equipment by PG&E resources.
Technology
PG&E requires flame resistant (FR rated) clothing for its employees. PG&E may differentiate the clothing required based on tasks. For example, cable splicers will don a 100 calorie flash suit when racking out a 480 V network protector, or when operating a primary oil switch from inside the hole. (The normal process is to rig the switch handle and operate the oil switch from outside the hole.)
PG&E requires head protection, safety glasses, a sturdy work boot with a defined heel, FR rated shirt and pants, and vests for traffic control when applicable.
PG&E uses a level 2 clothing system. PG&E provides an allowance to employees for purchasing the clothing. The allowance differs by classification.
At the time of the EPRI immersion, PG&E was not utilizing a manhole rescue apparatus set up over the hole, such as lifting crane, or requiring employees to wear harnesses and to be tethered.
PG&E relies on the Fire Company to perform manhole rescue.
7.8.14.14 - SCL - Seattle City Light
Safety
Personal Protective Equipment
Technology
At the time of the EPRI immersion, SCL was not requiring Flame retardant (FR rated) clothing. SCL has since adopted a category 2 clothing system.
7.8.14.15 - References
EPRI Underground Distribution Systems Reference Book (Bronze Book)
7.8.14.16 - Survey Results
Survey Results
Safety
Personal Protective Equipment
Survey Questions taken from 2018 survey results - safety survey
Question 13 : What clothing system level is required to work in the network (routine work)?


Question 14 : For 480V network protectors, does your company require crews to wear flash suits (i.e. higher than cat four PPE) or other incremental protection when they open or work in an energized NP?


Question 15 : Does your utility test the heat rating or arc flash rating of your tools and clothing?


Question 16 : Does your utility buy clothing or tools that are arc flash certified / heat certified?


Question 17 : What other types of work in the network, if any, require incremental PPE or other tools? Please describe.

Survey Questions taken from 2015 survey results - Safety
Question 126 : Do you require your network crews to wear flame retardant (FR rated) clothing?

Question 127 : If so, what clothing system level is required to work in the network (routine work)?


Survey Questions taken from 2012 survey results - Safety
Question 8.3 : Do you require your network crews to wear flame retardant (FR rated) clothing?

Question 8.4 : If so, what clothing system level is required to work in the network (routine work)?


Question 8.5 : Do you require incremental face protection, such as a face shield, or goggles and balaclava when working in the network?


Question 8.6 : For 480 V NP’s, does your company require NP crews to wear Flash Suits when they open an energized NP?


Question 8.7 : Is a first aid kit on hand when a crew is working in a vault?


Question 8.8 : Do your crews have an AED (Automated External Defibrillator

Question 8.11 : Please indicate which of the following design, operational or work procedure changes you have implemented to address network arc flash issues


Survey Questions taken from 2009 survey results - Safety
Question 8.5 : Do you require your network crews to wear flame retardant (FR rated) clothing? (This question is 8.3 in the 2012 survey)

Question 8.6 : If so, what clothing system level is required to work in the network (routine work)? (This question is 8.4 in the 2012 survey)

Question 8.7 : Do you require incremental face protection, such as a face shield, or goggles and balaclava when working in the network? (This question is 8.5 in the 2012 survey)


Question 8.8 : Is a first aid kit on hand when a crew is working in a vault? (This question is 8.7 in the 2012 survey)

[Personal Protective Equipment
- 208/120V](onenote:..\11%20Survey%20Results%20-%20Arc%20Flash%20&%20Network%20Systems\Arc%20Flash%20PPE.one#Arc%20Flash%20-%20208\120V§ion-id=%7BEE7F476C-1D0C-4C35-939E-616DFC2662B0%7D&page-id=%7B0EB9717E-4209-4429-B554-287367FC5CB6%7D&object-id=%7B83F07666-0702-4310-B951-31D2D097C220%7D&1E&base-path=C:\Users\pjtr002\Documents\2015_Practices_repository_1\2014%20Urban%20UG%20Practices%20Repository)
[Personal Protective Equipment
- 480/277V](onenote:..\11%20Survey%20Results%20-%20Arc%20Flash%20&%20Network%20Systems\Arc%20Flash%20PPE.one#Arc%20Flash%20-%20480\277V§ion-id=%7BEE7F476C-1D0C-4C35-939E-616DFC2662B0%7D&page-id=%7B198BAFDC-DDBB-43DB-9A25-2F3731E96AA9%7D&object-id=%7B36034179-7793-497C-9B1B-E0FF2CBB6268%7D&13&base-path=C:\Users\pjtr002\Documents\2015_Practices_repository_1\2014%20Urban%20UG%20Practices%20Repository)
7.8.15 - Safety Communication
7.8.15.1 - Ameren Missouri
Safety
Safety Communication
( Safety Alert)
People
The Ameren Missouri Safety department prepares a document called a Safety Alert to communicate significant safety issues internally. Issues could be a review of a significant incident, with recommendations for change. Safety Alerts are often produced as a result of incident investigations to communicate findings and changes in procedures stemming from the investigation.
Technology
The Safety Alert is used to communicate significant safety issues, and is posted on the Safety Bulletin board. (See Attachment L for sample Safety Alert.)
7.8.15.2 - CEI - The Illuminating Company
Safety
Safety Communication
(Daily Safety Communication)
People
First Energy has implemented a safety process where by a summary of any significant safety issue that occurs across their system is reported and recorded to a company wide voice mail box. Each day, the recordings of these incidents are sent to all the Director level personnel across the company. The Directors are responsible for rolling this information to their managers and their teams, and to safety personnel. These individuals are responsible for rolling the information out to their teams.
Process
All operating areas are responsible to contact this message box and report any safety related issue that occurs. Incidents can range from accident summaries, to bee stings, to contractor incidents. Each day, the recordings of these incidents are sent to all the Director level personnel across the company. The Directors are responsible for rolling this information to their managers and their teams, and to safety personnel.
Technology
A standard voice mail box was established at First Energy for this purpose.
7.8.15.3 - Con Edison - Consolidated Edison
Safety
Safety Communication
Process
Morning Call
Con Edison conducts a “morning call” in each region, and in their System Operations group. The morning call is a telephone conference call where important operating issues are discussed. The morning call typically takes about ten minutes to complete.
The call includes a discussion of:
-
first contingencies; that is, situations where a piece of equipment is out of service and the system is operating in an N-1 condition,
-
activities and outages scheduled on primary feeders
-
secondary activity anticipated for the day
-
outages/incidents experienced on the systems
-
work reporting; that is, a review of the work scheduled for the day
-
shunts and bridges; that is, places where temporary cables are installed, usually above ground, bypassing a section of the distribution system
-
street light work scheduled for the day
-
environmental issues
-
feeder issues
The handout used during the call consists of:
-
Display of the Feeder Board, listing the primary feeders that are out of service
-
Display of the Critical Transmission and Substations Equipment Outage Status
-
Table of the current feeder outages, indication of the reason for the outages, anticipated duration, work to be performed, other pertinent comments, etc.
-
HIPOT Summary (high potential feeder test summary), listing feeders that were tested the previous day
-
Banks dropped
-
Customer Service – Distribution Equipment report, indicating the defective banks off the system, both customer and company owned
-
Lists of other systems statuses, such as Banks Made Auto, Banks on Outage, Open Mains Received, Open Mains Tied Permanent
-
Customer Outages
-
Shunts and Bridges Summary Report
-
Customer Outages
-
Outstanding Job Summary by Responsibility
-
Age Distribution Summary by Responsibility, showing the number of projects of different types, sorted by how long the job has taken (the age of the job)
-
Daily Open Mains summary Report
-
Summary of Primary C and D Faults
-
Daily Incident Report, highlighting safety incidents
7.8.15.4 - Duke Energy Florida
Safety
Safety Communication
(Safety Updates/Bulletins)
People
“Connection” is an electronic safety summary communication sent via email from the Duke VP of Operations. This universal, company-wide communication is distributed to all Supervisors on Friday so that employees receive the latest information at the same time. These summaries are reviewed Monday mornings in team meetings. Many Supervisors forward the communication to their team members in addition to conducting the briefing. The Connection communication includes summaries of recent events, including Incidents, Near Misses, “Good Catches” (problems averted due to timely intervention), and embedded links to important information.
See Attachment K for a sample of the connections bulletin – note the links to the other safety related documents. See Attachments L , M and N for samples of a Health and Safety Awareness Bulletin, a Safety Alert Incident summary and a Safety Alert “ Near Miss ” summary.
Process
“Connection” serves an important role in the company because it provides a single, consistent method of communication to all employees about safety at Duke Energy. This digest enables supervisors to go to one source to find information that is relevant to their operations that week, such as the conditions in specific manholes, duct lines, etc. “Connection” gives employees have a weekly “one-stop” overview of pertinent events on the system, with links attached to other documents with more detailed information. It prevents employees from having to access numerous systems to get the information.
As a part of its on-going commitment to Safety, Duke Energy Florida’s “Connections” also contains safety performance reports, including company key performance indicators such as the total incident case rate (TICR), and the preventable vehicle accident rate (PVA), both industry standard measures.
“Connection” allows users to click on specific event categories, such as Significant Injury or Fatality (SIF). Within this group, individual event details are visible through the system, such as type of injury, and the full injury report, including date, time, and cause. Good Catches and Near Misses are captured in the electronic PlantView system and communicated to all employees through “Connections.”
“Connection” includes information from throughout the Duke Energy operating companies, and crew supervisors can filter information that they believe could be of use to their own crew sites. Given Duke Energy’s large footprint throughout the United States, this allows different regions to share experiences throughout the company. For example, a Near Miss in Ohio due to unusual site conditions was recently reviewed by the Florida crews.
“Connection” also includes time-sensitive information, such as the deadline requirements to complete certain training courses. The communication includes links to course schedules and resources. After training is complete, the trainee’s supervisor signs a Record of Training (ROT), which are also stored online (see Safety Training).
Technology
Duke Energy Florida has an extensive electronic system for recording and reporting incidents, Near Misses, Good Catches and other events through its PlantView system. PlantView is a tool developed by EPRI that can be used to automate the entry, storage, management, and reporting of information in an integrated database that is accessible through web portals.
“Connections” is sent out to the field and its contents are reviewed weekly, during Monday briefings.
7.8.15.5 - Duke Energy Ohio
Safety
Safety Communication
People
Each morning, Duke Energy Ohio convenes a safety meeting. The content of the meeting varies from day to day but includes things such as: reading of minutes from safety meetings, reviewing safety bulletins that are produced by Corporate, review any changes in specifications, reviewing any Power Delivery (PD) letters (see below).
Each workgroup within the underground department has its own safety chairperson.
Process
At the time of the immersion, the morning safety meeting involved all the employees in that department. Dana Avenue management revealed that they are considering breaking the larger group into smaller meetings to talk more specifically about safety issues. If they implement this, they would start as one group to discuss department wide issues, and then break into smaller groups.
Technology
The PD Letter (Power Delivery Letter) is a bulletin used to communicate a safety issue, safety changes or work practices change. The content of a PD Letter can range from highlighting an issue with a particular piece of equipment, to providing work practice guidelines. See Attachment K for a sample PD Letter.
PD Letters can be read at the morning safety meeting. PD letters that are issued relative to information normally found in company manuals need to be incorporated into those manuals by whoever initiated the letter.
7.8.15.6 - Energex
Safety
Safety Communication
People
Energex has established a safety management system, which is a comprehensive framework that guides their safety approach, and addresses strategies for managing the hazards and risk associated with the design, construction, operation and maintenance of the system. Strategies such as the approach to safety training, incident investigation and response, and emergency preparedness and response, are guided by this framework.
Energex has recently reorganized their safety organization, consolidating a corporate safety group, a Service Delivery safety group, and a Power Plant Safety group to form one safety organization.
Process
In response to employee feedback requesting more information about safety incidents in their aftermath, Energex produces an incident summary. The incident summary is communicated back to employees through an incident learning document
(See Attachment B: Share Our Learnings sample )
Technology
Energex has an incident database, called the eSafe system, which houses summations of all safety incidents and near misses. Each day, before the field crews are dispatched to conduct the day’s work, the work leader performs a “safety catch-up,” which is a review of any previous day incidents identified through the eSafe system with the work crews. Employees sign a document, indicating that they participated in this meeting.
(See Attachment C: Daily Safety Catch-up for Field Services sample)
7.8.15.7 - Georgia Power
Safety
Safety Communication
( Safety Alert)
People
The Safety Advisor for the Network Underground group sends out a safety alert to all managers and supervisors throughout Georgia Power whenever an OSHA-recordable incident occurs. The alert includes a copy of the First Notification report which is prepared for all OSHA recordable accidents, preventable or non-preventable. The managers and supervisors use this report to inform their crews and raise awareness about the incident and how it can be prevented or avoided in the future.
Process
The First Notification report then entered into the Georgia Power electronic OSHA log. Hard copies of the form are also kept. (See Incident Investigation )
The Georgia Power risk management group and the company’s insurance carrier also receive copies of the First Notification report.
Technology
First Notification Reports are sent company-wide over the Georgia Power intranet to all managers and supervisors. Incidents are kept electronically in the company’s SHIPS computer program, and hard copies are also filed.
7.8.15.8 - National Grid
Safety
Safety Communication
(Utility Bulletin and Safety Briefing)
People
Utility Bulletin
National Grid utilizes a utility bulletin (also called a Distribution Engineering Service bulletin, or DES bulletin) to communicate significant issues internally, which pertain to safety, standards, or work methods. The bulletin itself is a brief write-up of the issue to be communicated.
Safety Briefing
National Grid’s Safety, Health, and Environment Department (SHE) distributes general weekly Safety Briefing newsletters. These Safety Briefings encompass a variety of topics, from general safety programs and initiatives to specific safety concerns and incident analyses. The editor for these briefings accepts weekly submissions for newsletter content from all employees..
Every Monday afternoon, National Grid sends out information for a Tuesday morning safety briefing conducted by supervisors. Tuesday morning safety briefings are held every week, and the content can include information published in the Safety Briefings provided by Safety, or a review of utility bulletins issued by Work Methods, Standards, Or Safety.
Process
Utility Bulletin
DES bulletins are used as a way to communicate information about new tools, methods or equipment to the field force, engineering, and supervision. DES bulletins are often issued as an interim step before the implementation of a formal change to a practice or standard at National Grid.
For example, the Standards Department may issue a bulletin that describes a change in material or in a construction standard in advance of those changes being published in the company’s Standards book or Material Specifications. For example, see Attachment F for a Bulletin issued by Standards describing the use of fire stop sealants at duct openings in manholes.
Similarly, the Work Methods group may issue a bulletin to describe a change in an electric operating procedure, or to introduce new or changed tools and equipment. (See Attachment G for a sample bulletin describing a new gas detector introduced at National Grid.)
Also, the safety group may issue a bulletin to reinforce a safety concept or to notify the field force of a safety concern with a particular tool, practice, or piece of equipment.
Bulletins may be reviewed as part of a pre shift tailboard meeting.
Safety Briefing
Safety Briefings contain information on a variety of topics related to health and safety, including:
-
Policies
-
Procedures
-
Regulations
-
Laws
-
Study findings
-
New initiatives
-
Best practices
-
Incident analyses
-
General health and well-being tips (e.g. stress reduction, safe driving)
-
General news items
A representative sampling of headlines from recent newsletters is presented here to give an idea of the general flavor of the newsletter.
Follow the Rules - Not Just for Compliance, But For Your Safety!
This article explains that safety rules are not arbitrary, but are designed based on previous injuries, and represent an opportunity to learn from the misfortunes of others. It then describes recent incidents that had the potential to be very serious but which only resulted in minor injury, and directly compares them to actual fatalities in similar circumstances from the OSHA fatality database, showing that had the circumstances been only slightly different, those seemingly minor incidents could have resulted in fatalities.
Vehicle Housekeeping
A description of vehicle housekeeping practices and how they may lead to unsafe working conditions is provided, including injuries from using improper tools because the proper ones can’t be found, tripping hazards, strain injuries from reaching around other objects because of general disorganization, and other scenarios. It then discusses general housekeeping rules that will keep the vehicle organized and safer.
Injury Reporting Basics
Here, the responsibilities of supervisors for reporting injuries and ensuring employees receive the correct medical attention are outlined. It includes procedures and phone numbers for reporting injuries to the appropriate Health and Safety management department.
Hearing Conservation Program
Some changes to a hearing conservation program are outlined, including employee responsibilities, noise monitoring methods, hearing studies, and general high noise environment regulations.
National Work Zone Awareness Week
A national campaign to promote awareness of motorist and worker safety issues in work zones along roadways is described, along with some events and media coverage meant to promote the campaign.
Personal Security Drill Findings
A drill was conducted to assess the response of a field worker, and appropriate supervisory staff, to a scenario involving a dangerous conflict with an upset customer. Results of the drill, with recommendations for staff, are presented.
Anti-Idling Laws
Laws in many states and local jurisdictions concerning vehicle idling are discussed. A discussion of the costs of engine idling across the fleet of vehicles, in terms of diesel and engine maintenance costs, is presented, along with a link to National Grid’s policy on idling.
Technology
Utility Bulletin
The Bulletin is used to communicate significant issues internally, including safety issues, operational issues or work practice changes
Safety Briefing
Submissions for the newsletter can be submitted to the editor via email. The newsletter is distributed in PDF format and may be printed for posting.
7.8.15.9 - PG&E
Safety
Safety Communication
(Utility Bulletin)
People
PG&E prepares a document called a Utility Bulletin to communicate significant issues internally. Issues could be operating issues, safety issues, the proper use of a tool, etc.
PG&E has a defined process for issuing a utility bulletin and requires a level of signature authorization.
Process
Utility bulletins are often issued as an interim step before the implementation of a formal change to a practice or standard at PG&E. Utility bulletins may be reviewed as part of a pre shift tailboard meeting.
As an example, EPRI observed the manager of networks reviewing with the M&C Electric Network night shift maintenance crews a particular utility bulletin describing procedures for manually operating a network protector, including steps for operating a protector that is “hung up” either remotely using a rope sling, or directly, wearing a 100 calorie flash suit. A key message of the bulletin was that when operating a protector using a rope sling, the protector lever must be activated in a quick and continuous motion to prevent arcing of the contacts, especially on the GE protectors.

Figure 1:
Picture of network protector contacts with evidence of arcing. (From PG\&E NP repair shop)
Technology
The PD Utility Bulletin is used to communicate significant issues internally, including safety issues, operational issues or work practice changes (See Attachment M for sample utility bulletin.)
7.8.15.10 - Portland General Electric
Safety
Safety Communication
People
PGE utilizes safety updates and bulletins to communicate safety related information at all levels of the company. At the executive level, the Executive Safety Council (ESC) regularly meets with employee groups to listen to safety concerns and share information about PGE safety initiatives [1].

Figure 1:
Safety notices prominently displayed
Safety coaches provide the main link between management and field workers. Safety coaches discuss concerns with management and the safety team, and act as a point of contact for field workers wishing to discuss issues. They regularly discuss issues among themselves and determine what actions are needed. The CORE group has one safety coach, a volunteer position taken by a journeyman on a 2-3 year cycle. Safety coaches also talk to crews before the monthly meetings to determine what issues should be shared.
Process
PGE has produced a number of laminated safe work practices sheets and notes for certain tasks. At present, they only apply to overhead work rather than CORE underground practices. Overall, the company is in the process of documenting work practices to memorialize knowledge that has historically been passed only verbally (“tribal knowledge”).
The way in which PGE delivers safety updates and bulletins is through the various weekly and monthly meetings held across the company. In addition, job-related safety information and updates are reviewed during jobsite tailboard meetings.
Technology
My Safety Application: On the My Safety Application used by crews to log incidents, users can view a summary of safety incidents grouped by location, as well as summaries of safety performance.
- Portland General Electric 2015 Service Quality Measure Report. Portland General Electric, Portland, OR: 2015. http://edocs.puc.state.or.us/efdocs/HAQ/re61haq161241.pdf (accessed November 28, 2017).
7.8.15.11 - Survey Results
Survey Results
Safety
Safety Communication
Survey Questions taken from 2009 survey results - Safety
Question 8.2 : Please indicate the type(s) of safety meetings you conduct. Check all that apply.

7.8.16 - Safety Meetings
7.8.16.1 - AEP - Ohio
Safety
Safety Meetings
People
AEP utilizes various committees/teams at all levels of the organization to coordinate safety activities. At the overall company level, AEP coordinates safety through its Safety Committee, comprised of representatives from throughout its operating companies.
AEP also utilizes committees at the individual operating company level. AEP Ohio conducts monthly state-wide safety meetings (Ohio Safety Council), as well as district specific meetings, such as meeting of the Columbus Safety Council. The underground network organization has representation on both the State and District (Columbus) safety councils. These councils respond to safety issues brought forth by representatives. Issues may also be directed towards the safety department.
At AEP Ohio, safety initiatives are coordinated and implemented by safety department representatives. One safety department rep has responsibility for the network organization (among others). Network Crew Supervisors perform daily morning safety briefings. Information from the safety councils is normally disseminated to the workforce through the daily morning safety briefings. Network Mechanic crew leaders are responsible for performing onsite (tailboard) safety briefings. These meetings are documented, with crew members required to sign the form.
An AEP Ohio Safety Department Representative performs periodic onsite safety inspections. In addition, Network Crew Supervisors perform periodic onsite safety inspections, with the required number varying from year to year (typically about 15 inspections per year).
Process
The safety council meetings (both the State and District Safety Councils) are focused on safety issues, including new technology, equipment, procedures, and safety recommendations. The meetings provide a forum for addressing safety issues. These councils are comprised of representatives from various functional groups including the underground network group. These councils will, for example, discuss and seek resolution to safety concerns associated with both tools and processes, with the District Council addressing more local issues specific to Columbus.
Network Crew Supervisors use the daily morning safety meeting to report out from both the District Safety Council and the State Safety Council. Each morning meeting is led by one of the Network Crew supervisors, with the responsibility for leading the meeting rotated among the crew leaders.
Technology
Safety checklists are used to document conditions as well as the performance of a safety discussion at job sites. These checklists can be filled out using a smartphone application (app).
Safety information is recorded and available online for the entire company. Forms, guidelines, and safety best practices documents are available online for all company employees, including the AEP Safety Manual.
7.8.16.2 - Ameren Missouri
Safety
Safety Meetings
People
Ameren Missouri holds various safety meetings, ranging from job site tailboard meetings to large company safety meetings. Meetings can be led by a crew foreman, supervisor, manager or safety professional, depending on the type of meeting.
In addition, Ameren Missouri has implemented the practice of kicking off all company meetings with a brief safety message delivered by the meeting host. The meeting host will select a topic of interest for the group and share information on that topic. The topic does not necessarily have to be related to the meeting purpose, but rather a topic that would be of interest and generally apply to the meeting participants.
Process
Ameren Missouri holds various safety meetings, including:
-
Job site tail board meetings
-
Morning “5 minute” briefings
-
Monthly safety meeting
-
Quarterly Safety meetings
-
Tool committee meetings
-
Safety committee meetings
-
Safety Culture Team meetings
Job Site Tail Board Meetings
Ameren Missouri crew leaders perform job briefings (tailboards) at the beginning of each work day or new job. An element of the job briefings is a requirement to regroup and re-brief when the work environment changes.
Ameren Missouri records the job briefing on a Job Briefing Sheet, including the employees who participated in the briefing.
Morning “5 minute” briefings
Ameren Missouri conducts a daily morning safety meeting (also called a “5 minute briefing”). This meeting is led by a supervisor who prepares a safety related topic. The morning meeting includes time for employee warm-up and stretching exercises. Once a week, Ameren Missouri invites a physical therapist to lead the morning stretching exercises and provide council to employees.
Monthly Safety Meeting
Ameren Missouri conducts monthly safety meetings within each department. For example, the Underground Construction group and Service Test group each convene a monthly safety meeting, with all members of the department represented. A safety professional may or may not be present.
A meeting summary is posted on the Safety bulletin board.
Note than in the Service Test department, union employees also meet quarterly to discuss safety issues. This meeting is evidence of a cultural transition at Ameren Missouri, with individuals taking accountability for their safety.
Quarterly Safety Meetings
Ameren Missouri conducts quarterly safety meetings with all employees. These meetings are administered by Ameren Missouri safety professionals.
Tool Committee
The Ameren Missouri underground group has formed a tool committee comprised of one supervisor, and three field representatives to discuss issues and develop recommendations for worker tools. The Blue Hat representative also participates on this committee.
The tool committee meets monthly. A meeting summary is posted on the Safety bulletin board.
Safety Committee
The Ameren Missouri Underground Construction group has formed a safety committee led by a supervisor and comprised of in house people, including a safety professional from Ameren Missouri’s safety group. This committee discusses departmental safety issues and makes recommendations for change locally. Information from this committee is distributed via the monthly safety meetings, or daily morning 5 minute meetings.
The safety committee meets monthly. A meeting summary is posted on the Safety bulletin board.
Safety Culture Team
Ameren Missouri has formed a Safety Culture Team to focus on understanding cultural barriers to improving safety locally, and to make recommendations for changes to build trust and positively influence the company culture. The committee is comprised of managers and supervisors, including the UG Construction manager. A safety professional is also part of this team.
The safety culture team meets monthly. A meeting summary is posted on the Safety bulletin board.
(Tailboard Meetings)
People
Ameren Missouri crew leaders perform job briefings (tailboards) at the beginning of each work day or new job.
Process
At Ameren Missouri, there are six elements to a job briefing. They include a review of:
-
hazards of the job
-
safe procedures and practices
-
discussions of any special precautions
-
identification of energy sources
-
discussion of clearances (called work practices authorization or WPA Ameren Missouri)
-
personal protective equipment
An element of the job briefings is a requirement to regroup and re-brief when the work environment changes.
Technology
Ameren Missouri records the job briefing on a Job Briefing sheet, which includes the employees who participated in the briefing. For example, in the Distribution Service Test department, the record of the job briefing is part of the time reporting process, with employees required to record both the start of day job briefing, and any subsequent briefing required as field conditions may change. This includes a recording of the elements of the briefing that include the following, known by the acronym “PAUSE”: PPE, Awareness of hazards, Unusual or special precautions, Safe work rules, and Energy source control.
7.8.16.3 - CEI - The Illuminating Company
Safety
Safety Meetings
(Daily Safety “Stand Up” Meeting)
People
All personnel in the Underground department participate in the daily safety “Stand Up” meeting. The meeting is led by the Underground Department Manager and his supervisory team and involves all department employees. Company safety personnel may or may not be present.
Process
Every workday begins with brief safety meeting led by the Underground Department Manager, and involving the entire department. This meeting is referred to as the daily safety stand up meeting. The content of the meeting varies and is based on areas of need or relevance. For example, with icy weather conditions, a focus might be on slips, falls and other hazards associated with this weather. The meeting would also cover safety issues associated with specific projects being worked on, or on specific incidents that may have occurred in other parts of the company (Available through the Daily Safety Communication). The meeting also provides an opportunity for employees to voice any safety related concerns they may have.
This process has been highly effective in maintaining a focus on safety and giving employees a forum to voice both safety related and non safety related concerns.
CEI has other safety meetings in place to maintain a focus on safety, including the following:
-
Monthly Safety Standdown meeting
-
Monthly supervisor safety meeting
-
Quarterly corporate meeting with union representation
Technology
The daily safety “Stand Up” meeting is primarily a discussion, although visual aids, such as Power Point presentations may be used.
7.8.16.4 - CenterPoint Energy
Safety
Safety Meetings
People
Daily Safety Tailboard Meeting
CenterPoint Crew Leaders conduct a daily safety tailboard with their crews where safety issues associated with the days work are discussed.
Also, CenterPoint requires that Major Underground crews conduct a jobsite tailboard meeting at every job location. This meeting is conducted by either a Crew Leader or the crew chief.
Monthly Safety Meeting
Monthly, CenterPoint conducts a series one hour safety meeting with all Major Underground employees. Each Major Underground manager prepares and hosts his own meeting, typically held at the start of the shift.
Over the past five years, CenterPoint has overtly moved the responsibility for these meetings from the Safety department to the Major Underground department managers themselves.
Bi-Monthly Safety Council Meeting
Every other month, CenterPoint holds a meeting comprised of the department director, managers and crew leaders (all supervision) of the Major Underground department, called the Safety Council Meeting. The purpose of this meeting is to discuss pressing safety issues, review safety trends identified through observations and other inputs, and develop strategies for improving department safety.
Safety Action Committee
Monthly, CenterPoint conducts a meeting of the Safety Action Committee, hosted by a Major Underground Crew Leader who is assigned to a safety role. This is the same Crew Leader who liaises with the HERO team as a representative of Major Underground. Each Major Underground Crew Leader has a group representative (crew member) who attends the meeting.
CenterPoint schedules this meeting monthly, usually back to back with the monthly Safety meeting.
Process
Daily Safety Tailboard Meeting
The jobsite tailboard meetings include a discussion of the safety issues associated with each project. Information about the job discussed at the jobsite tailboard meeting, such as atmospheric testing or water issues, is recorded on a tailboard conference sheet See Attachment N . Every member of the crew signs the conference sheet. The results of the conference are kept on the truck dash so that they are accessible during the project.

Figure 1:
Tailboard Conference Sheet
Information from the tailboard is filed and saved for a period of three years.
Monthly Safety Meeting
In advance of the meetings, the Major Underground management team meets to determine the topics to be presented and the approach for the meeting. Managers will often invite people from their departments to present topics as this can add more credibility to the information being presented.
CenterPoint safety professionals will sometimes participate in this meeting, particularly if there is a specific company wide message or program to disseminate.
Safety Action Committee
The purpose of the meeting is to bring safety issues to the group for discussion and resolution. Issues can be associated with any aspect of the work, including materials, engineering, work practices, tools, etc. The meeting format is a round table, with each person given an opportunity to contribute. Management guests are sometimes invited.
7.8.16.5 - Con Edison - Consolidated Edison
Safety
Safety Meetings
Process
Safety Meetings
A job briefing is held each morning for every crew led by either a supervisor or lead mechanic.
Con Edison supervisors perform daily safety inspections, inputting the information on a four-page form. See Attachment J. The results of this form are entered into a computer system.
Con Edison also holds a larger safety meeting monthly with all field employees. Safety discussions are incorporated into other meetings as well, such as the underground network equipment standards committee meetings.
Con Edison gives safety performance high visibility. Safety performance reports are conspicuously posted in the utility’s buildings.
7.8.16.6 - Duke Energy Florida
Safety
Safety Meetings
People
Duke Energy Florida holds various safety meetings, ranging from job site tailboard meetings to large company safety meetings. Meetings can be led by a crew foreman, supervisor, manager or safety professional, depending on the type of meeting.
One Lead Health and Safety Professional is responsible for the Clearwater and St. Petersburg network system safety standards and oversight. This person is responsible to develop and implement strategies to influence safety in the South Coastal Region, including the safety of the network underground organization.
Each Operating Center in Duke Energy Florida has formed a local safety committee, comprised of representatives from each work group, and led by an employee designated as the operating center safety chairperson. As Clearwater and St. Petersburg are part of separate operating centers, network employees may be represented on either local safety committee. Participation is voluntary, and there is no forced rotation of members on the committee. The local safety committees hold monthly safety meetings. The local ops center chairperson and committee report (via a dotted line) to the Lead Health and Safety Professional.
Duke Energy Florida has implemented the practice of kicking off all company meetings with a brief safety message delivered by the meeting host. The meeting host will select a topic of interest for the group and share information on that topic. The topic does not necessarily have to be related to the meeting purpose, but rather a topic that would be of interest and generally apply to the meeting participants. In addition, at meeting starts, Duke Energy Florida’s practices is to assign responsibility for safety related duties in the event of an emergency, such as calling 911, or retrieving the AED. A practice of note is the “30 for 30,” a practice where every thirty minutes, participants of a meeting stand and stretch for 30 seconds. The meeting discussion does not cease, but continues as participants engage in this stretch. A timekeeper is assigned at the start of the meeting to remind participants to stretch at 30 minute intervals.
Process
Duke Energy Florida holds various safety meetings, including:
-
Job site tailboard meetings
-
“Take 10” Meetings
-
Weekly Meetings
-
Monthly safety meeting
-
Zone Safety Committee Meeting
Job Site Tailboard Meetings
Duke Energy Florida crew leaders perform thorough job site briefings (tailboards) at the beginning of each work day or new job. Every time a job site tailboard is conducted, topics are checked discussed are checked off and notes are recorded on a Tailboard Sheet. Elements of the tailboard session include:
-
Identification of the crew leader for the tailboard and job
-
Job location and address are reviewed
-
Crew qualifications and familiarity with tools are confirmed
-
Plans for hydration breaks
-
Work plans and safety procedures are reviewed (including manhole entry procedures)
-
Workers sign the tailboard sheet documenting their participation
At the end of the day (or project), the crew leader does full inspection around the job site to make sure conditions were restored to normal, that no tools were left behind, and that all equipment/cables are in a safe configuration with proper tagging if work was not completed. In addition, a post job tailboard meeting is held with the crew to make sure all switching is complete, grounds removed, and clearance tags have been removed. During the post job tailboard, lessons learned are discussed and the crew discusses the safest route to exit while addressing any obstructions or stationary objects that might impede a safe exit.
“Take 10” Meetings
Network crew supervisors lead a “Take 10” briefing every morning for each of their crews. The “Take 10” meeting was initially instituted as a pre – work day tailboard sessions, as practiced at many utilities, where the job plan is discussed by the team and supervisors review site and job-specific safety issues. Over the years, the discussion has evolved to include communication of periodic safety information/messages to augment the job preplanning prior to leaving for the job site.
Weekly Meetings
Weekly, department supervisors, including the Network Group supervisor, conducts a brief safety meeting to review the contents of a company issued safety communication packet entitled “The Connection”. This company safety communication packet is issued to all supervisors on Friday afternoon, so that they can prepare to communicate information relevant to their department during Monday morning meetings. “Connection” is a safety packet prepared for Delivery Operations, Transmission Grid Solutions, Gas Operations and Customer Operations, and issued by the Vice President of Distribution Maintenance and Construction with input from all departments. Included in the packet are event reports, near misses, and good catches. A sample weekly connections summary is attached to this report in Attachment K. “Connection” ensures a single source is providing a unified and consistent message broadcast to all company employees.
Monthly Safety Meeting
On a monthly basis, Duke Energy Florida will conduct a monthly safety meeting within each operating center within the South Coastal Zone. Each Operating Center holds the meeting on a selected Wednesday within the month, so no two operations centers hold meetings at the same time. All employees, including the network Group, attend this meeting unless unavailable because of an outage or emergency. While the Safety and Health professional normally participates in these meetings, their presence is not mandatory, as these meetings led by the local safety committee, comprised of representation from each work group and led by an employee designated as safety chairperson. The content for the meeting includes corporate safety and training content, as well as content developed by the local safety committee.
In turn, each Operating Center Safety Chairperson and co-Chair attend a monthly Zone Safety Meeting. This separate monthly meeting includes all the safety chairs from the operating centers that comprise a Zone.
Zone Safety Committee Meeting
Quarterly, Duke Energy Florida holds Zone Safety Committee Meetings for all of Florida. Each division in Duke Energy Florida will appoint a lead, chair, and co-chair to attend the Zone Safety Committee Meeting. At this meeting, safety topics are developed to be reviewed at the next Monthly Safety Meeting with all employees. The Safety and Health professional normally leads the discussion of the topics developed at the Zone Safety Committee meeting at the next Monthly Safety Meeting.
Technology
The “Connections” safety communications is distributed electronically to the supervisors as one summary document with links to other documents that include safety related topics. This includes safety topics, and includes a review of safety events that may have occurred. The department supervisor will cull through the available data and look for information that is relevant for his team.
This review may also include a review of “Near Misses” and “Good Catches.” “Good Catches” are situations were an employee noticed a potential safety hazard before an event occurred. For instance, an employee proactively reporting cracked and raised cement on a walkway that poses a trip hazard before anyone trips is an example of a “Good Catch”. A “Near Miss” is an event where a safety hazard occurred, but no one was hurt. For example, an employee accidently dropping a tool into an area that creates a flash with no one getting injured is an example of a “Near Miss.”
7.8.16.7 - Duke Energy Ohio
Safety
Safety Meetings
People
Morning Safety Meeting
Each morning, Duke Energy Ohio convenes a safety meeting. The content of the meeting varies from day to day but includes things such as: reading of minutes from safety meetings, reviewing safety bulletins that are produced by corporate EH and S, review any changes in specifications; reviewing any PD letters (see Technology below).
Each work-group within the underground department has their own safety chairperson.
Monthly Safety Committee Meeting
Duke Energy Ohio holds a monthly safety committee meeting. This meeting consists of resources from the entire region, including Dana Avenue and other districts.
Dana Avenue has two representatives to the monthly committee - one from management, and one from the union. The union representative to the meeting is a volunteer. Duke tries to rotate the involvement of the union, giving a person two or three times to attend.
Safety Week
Safety week is a week where Duke Energy sets aside time to focus on safety related topics.
Tailboard Meetings
Every crew is responsible for performing a jobsite safety tailboard.
These meetings are used to discuss issues with the jobs, point out potential safety hazards, review operating protocol and clearances, etc.
Process
Morning Safety Meeting
At the time of the immersion at Duke, the morning safety meeting involved all the employees in that department. Dana Avenue management revealed that they are considering breaking the larger group into smaller meetings to talk more specifically about safety issues. If they implement this, they would start as one group to discuss department wide issues, and then break into smaller groups.
Monthly Safety Committee Meeting
The purpose of the meeting is to discuss safety issues relative to the Region. An example of a topic discussed at this meeting is the challenge that Duke Energy Ohio experienced when they moved to dead front switchgear (elbows) as a standard. For this issue they developed a training session on operating dead front switch gear, and participated in the delivery of the training to the districts in the new equipment.
Safety Week
Safety week is a week where Duke Energy sets aside time to focus on safety related topics. The content covered can be any safety related topic, such as dog bites, sun exposure awareness, and safety demonstrations.
Often, during this week, Duke Energy management will hold special events, such as a cookout, to bring employees together to focus on safety.
Tailboard Meetings
Tailboard meetings are used to discuss issues with the jobs, point out potential safety hazards, review operating protocol and clearances, etc.
Duke Energy Ohio has recently implemented documentation of tailboard meetings.
Technology
Morning Safety Meeting
The PD letter (Power Delivery Letter) is a bulletin used to communicate a safety issue, safety changes or work practices change. The content of a PD letter can range from highlighting an issue with a particular piece of equipment, to providing work practice guidelines. See Attachment K for a sample PD Letter.
PD Letters can be read at the morning safety meeting. PD letters that are issued relative to information normally found in company manuals need to be incorporated into those manuals by whomever initiated the letter.
7.8.16.8 - Energex
Safety
Safety Meetings
People
Energex Crew leaders perform a job site risk assessment, called a “tool box talk” (see Figure 1). This is a documented safety meeting, with a form that is signed by all crew members and job site visitors who receive the briefing. Any visitors who arrive at the site must participate in a safety briefing as well. The performance of the job site tool box talk is a legislative requirement in Queensland.
Process
The briefing reviews the scope of the job and illuminates hazards specific to the job. The form used in the past was multiple pages and involved many check boxes. Energex worked with employees to produce a streamlined form that is used to document the safety meeting, to simplify its use, and to encourage discussion of job site safety hazards.

Figure 1:
Energex crew leader conducting a tool box talk (job site safety briefing)
7.8.16.9 - ESB Networks
Safety
Safety Meetings
(Tailboard Meetings)
People
ESB Networks maintains a Chief Executive Safety Committee that oversees and thoroughly documents safety procedures and practices. Representatives from throughout the company rotate onto the committee to get a more complete overview of current and evolving safety practices. A group of 30 people representing 178 teams across ESB Networks attend the committee meetings with an emphasis on improving safety procedures in any way possible.
Process
ESB Networks holds regular monthly meetings for all personnel, and safety issues are one of the key topics of discussion and review. ESB Networks believes in a positive re-enforcement of safety behavior (see “Safety – Culture ” in this report.)
In addition, ESB Networks has periodic safety forums with its contractors to address issues of safety, and it encourages the various contractor companies to cooperatively work on improving safety procedures. ESB Networks was able to obtain common learning across all contractors and to identify best practices. If a contractor or ESB Networks personnel are found to be operating unsafely, inspectors and/or supervisors have the authority to stop work on a project until corrective measures are made.
Tailboard Meetings
People
Job site meetings are mandatory for all personnel before a project begins, whether it is a minor repair or major commissioning of service, etc. The meeting is led by the field supervisor.
Process
ESB Networks has a specific job site safety plan (JSSP) which is a risk assessment of the job site. The plan is reviewed by all crew members prior to work. Each crew member then signs the job site safety plan. ESB Networks feels this has had a significant impact on reducing incidents.
Related to the job site safety plan, ESB Networks has implemented “climb safe” procedures, which entail performing specific pre climbing tests, such as tapping poles to identify rot, and proper fall and catch techniques.
ESB Networks believes that the implementation of these two pre job techniques has resulted in a significant reduction in incidents. (ESB Networks has seen a dramatic reduction in safety incidents in recent years with their increased focus on safety.
Technology
Monthly job site safety briefing reports are entered into the ESB Networks internal system each month.
7.8.16.10 - Georgia Power
Safety
Safety Meetings
People
The Network Underground group has a dedicated Health and Safety Advisor assigned to them, who functionally reports to the Health and Safety department at Georgia Power. The Advisor meets regularly with the larger Georgia Power Safety and Health group.
In all, the Safety and Health Advisor is responsible for the training and safety management of approximately 180 people within the organization. The Safety and Health Advisor works closely with the Network UG Manager on safety and health issues related to the operation and maintenance of the network underground system throughout Georgia.
The person presently assigned to the position of advisor for the Network UG group came up from the ranks of the underground organization, serving as a Cable Splice, so he is familiar with the unique needs and requirements for safely working in a network. The Advisor shadowed safety personnel to gain on the job training, and eventually co-chaired and chaired the safety committee while he was a Cable Splicer crew leader.
Process
The Network UG group holds several different types of safety meetings including weekly safety meetings within each work group, monthly meetings of the Network UG Safety committee, and quarterly meetings of the entire department.
The Network UG safety committee is comprised of volunteer representatives from Engineering, Maintenance, Cable Construction, Duct Line Construction, and Operations and Reliability. The committee meets once a month, and is focused on improving safety and work practices and providing a forum for employees to have input. Work of the committee includes developing topics and programs for monthly departmental safety meetings, developing and approving revisions to the Network Underground Safety and Work Procedures manual, informal review of accidents, both medical and vehicular, and a review of all safety concerns brought forth by employees to their safety representatives.
The entire Network Underground group of Georgia Power convenes quarterly for a safety meeting led by Safety and Health advisor. The group often invites guest speakers to these meetings who are experts on specific network underground safety issues.
Employees also attend yearly safety training, including compliance training such as enclosed space training, trenching, and CPR. In addition, Network UG employees receive annual training on using a bucket truck, as UG resources are called upon to work as service repair crews during storms. Note that Georgia Power has built a small overhead training yard at the Network UG location to accommodate this training.
7.8.16.11 - HECO - The Hawaiian Electric Company
Safety
Safety Meetings
People
All personnel in the C&M Underground group participate in a daily morning Safety / Tailboard meeting. The meeting is led by the C&M Underground supervisors and involves all department employees. Company safety personnel and Engineering department personnel may or may not be present.
Process
The meeting is held each morning after the morning stretch / walkabout to discuss the days work, safety issues, as well as Company and department business. Typically the meeting will begin with general safety Company and department issues that involve everyone. The meeting will then break into smaller tailboard discussions of the days work.
EPRI observed very open lines of communication between employees at these meetings. The meetings have a “family feel”, with workers readily voicing issues and concerns, and individuals showing respect for each other’s opinions. EPRI further noted a strong working relationship between the UG group and the Engineering staff that were present at these meetings.
Technology
The meeting is primarily a discussion, although visual aids, such as job sketches or tools demonstrations may be used.
7.8.16.12 - National Grid
Safety
Safety Meetings
People
National Grid holds various safety meetings, ranging from job site tailboard meetings to large company safety meetings. .
Meetings can be led by a crew foreman, supervisor, manager or safety professional depending on the type of meeting,
National Grid’s Safety, Health, and Environment Department (SHE) distributes general weekly Safety Briefing newsletters. These Safety Briefings encompass a variety of topics, from general safety programs and initiatives to specific safety concerns and incident analyses. The editor for these briefings accepts weekly submissions for newsletter content from all employees..
National Grid has a certified safety professional who acts as the point contact for general health and safety issues that arise.
Process
National Grid holds various safety meetings, ranging from job site tailboard meetings to large company safety meetings. Examples of safety meetings include:
-
Division Safety Meeting
- This meeting, run by the Manager – UG Lines East, includes both union and management personnel, and a safety professional.
-
Mid-Level Safety Meeting
- This meeting includes the Manager – UG Lines East and his counterparts across the system (other UG management), and includes management and union representatives, and Work Methods.
-
EO Safety Committee
- This is a month safety meeting comprised of vice presidents, who establish safety strategies for the company,
-
Tuesday Morning Safety Briefing
- The entire underground electric group meets each Tuesday morning to review issues associated with safety. The content for these meetings is often based on published Safety Briefings provided by the Safety Department (See Safety Communication: Safety Briefing), and distributed every Monday afternoon. The content of these meetings can also include a review of utility bulletins issued by Work Methods, Standards, Or Safety (See Safety Communication: Utility Bulletin). These meetings are run by department supervisors.
Technology
Submissions for the newsletter can be submitted to the editor via email. The newsletter is distributed in PDF format and may be printed for posting.
7.8.16.13 - PG&E
Safety
Safety Meetings
People
PG&E holds various safety meetings, ranging from job site tailboard meetings (see below) to large company safety meetings. In general, PG&E uses a grass roots approach to safety, involving employees in discussion of safety issues and establishment of safety practices.
Meetings can be led by a crew foreman, supervisor, manager or safety professional (Safety Coordinator), depending on the type of meeting,
The Safety Coordinator is a Safety Health and Claims Department employee responsible for implementation of the company’s safety programs, and is a point contact for general health and safety issues that arise.
Process
PG&E holds various safety meetings, ranging from job site tailboard meetings to large company safety meetings. Examples of safety meetings include:
Monthly Safety Meeting
The safety coordinator convenes a monthly safety meeting with representatives from the M&C Electric Network group. The meeting objective is to develop a “grass roots” safety approach specific to needs of the M&C Electric Network Group. The safety coordinator acts as a facilitator, and meeting attendees include the Superintendent, VP of the M&C Electric Network group, and a front line supervisor who is designated a safety “coach”.
Monthly Crew Foreman / Supervisors Meeting
The Superintendent, VP of the M&C Electric Networks holds a monthly crew foreman / supervisors meeting that includes a specific focus on any safety related issues.
Weekly Safety Meeting (also referred to as a Standup Meeting)
The Supervisors conduct a weekly meeting with the field force to discuss and resolve issues facing the group. Safety is a central focus, although the meeting is used to discuss issues of any type.
Bi-Monthly Regional Phone Conference
PG&E holds a bi monthly conference call that includes a discussion of key safety related issues.
Tailboard Meetings
Prior to each shift, the distribution supervisors conduct a pre-shift tail board meeting with the field crews. The meeting is conducted in the cable splicer day room, known as the “bull room”. The content of the tail board meeting varies from meeting to meeting, addressing safety concerns specific to the projects scheduled for that shift and including a reading from the safety manual. This meeting is also used to review any pertinent utility bulletins (see Utility Bulletin).
The pre-shift tailboard meeting also includes stretching by field crews, including a brief upper body stretch of the arms, elbows and shoulders.
In addition, each crew leader is responsible for performing a jobsite safety tailboard meeting. These meetings are used to discuss specific issues with the jobs, point out potential safety hazards, review operating protocol and clearances, etc.
7.8.16.14 - Portland General Electric
Safety
Safety Meetings
People
Safety is a core value at PGE, and the company allocates time for frequent meetings at every level of the organization. This ensures that safety concerns and directives are discussed throughout the company.
Executive Safety Council (ESC): PGE has created an ESC to oversee safety across the company. The safety officers and senior management representatives on the ESC regularly meet with employee groups to listen to any concerns about safety and share information about PGE safety initiatives [55].
Safety Coordinator for Eastern Region: Every region in PGE’s service territory has a safety coordinator. The present coordinator for the Eastern Region, which includes the CORE, has over 30 years of experience and began working for PGE as a journeyman.
Safety Coaches: To ensure that a conduit between management and field workers, PGE employs safety coaches who work with the safety team. Safety coaches are members of the union who volunteer to represent their department.
They discuss safety issues and events with management and the safety team to ensure that any concerns are dealt with and escalated if needed. Safety coaches sit on the Safety Committee, which meets monthly. The CORE group has one safety coach, and the position is rotated every 2-3 years. The CORE safety coach is a journeyman with normal duties and acts as a point of contact if crew members have a safety concern or experienced a near miss. Safety coaches discuss concerns and incidents amongst themselves during monthly meetings and determine what actions should be taken. In addition, prior to the monthly meeting, the safety coach spends time talking with crews to find out any issues that can be raised at the meeting.
Process
Safety Meetings
To maintain the focus on safety and its priority across the entire company, PGE holds regular meetings to address concerns and ensure that programs are implemented across the company.
Weekly Safety Coaches Meeting: On Mondays, the safety coach organizes the weekly safety coaches meeting, which is open to all and includes members of all groups, including engineering and design. This helps engineers gather any concerns raised by line crews. The meeting agenda includes a review of the action register, running list of open action items, discussion of near misses, and round table discussions of safety-related topics.
Weekly Conference Call: Every Thursday, the company holds a weekly conference call that includes supervisors from the various line units, management, and safety coaches from across PGE. This wider conference call may include the senior management of the company and is intended to share information between regions. A rotating facilitator manages the call.
To ensure that important information is shared across the company and passed to the line crews, any issues raised during the weekly conference call are discussed during the local safety calls held every Monday morning. Action items from the Thursday conference calls are logged on the Action Register alongside the expected completion dates. During the Monday morning safety meeting, time is always allotted for reviewing these actions.
Safety Committee: The Safety Committee, which meets monthly to discuss safety across the region, includes all safety coaches, safety coordinators, and the regional management team. At this meeting, the Regional Safety Coordinator raises a particular topic of local interest for discussion in the weekly meetings.
On a quarterly basis, all regions (Eastern, Southern, Western) hold a larger quarterly safety meeting. A chairman oversees quarterly meetings and union representatives them.
Weekly Meeting: Every Monday morning, PGE line crews hold a Monday morning safety meeting, which for lasts about an hour. The meeting begins with an update about events occurring in the city and a discussion covering whether any of these will affect scheduled work. The meeting also includes a list of issues and near misses encountered in the field and yard during the previous week, as reported by crews. The meeting always begins with a safety moment, in which an item from the safety manual, such as foot protection, is reviewed. The meeting also includes the Action Register Review with points discussed during the Thursday conference call. Meetings are never rushed and line workers are free to raise any issues. The meetings also discuss action plans from previous meetings.
For example, one meeting saw crews raise the issue of sewer gases in vaults. The foreman leading the discussion explained the procedure that crews should follow if they suspect that sewer gases are present in a manhole/vault. They were informed that they should not enter the vault and instead report it to the repair organization, which calls out a contractor to clean the vault. Workers should never expose themselves to any airborne pollutants.
Some other examples of issues discussed at meetings include the following:
-
Crews noted that a number of vaults had a new collector bus installed, but the spacing between the conductors was extremely tight. This could present a safety issue during future work. In order to mitigate the safety risk, crews installed insulation blankets over the secondary cable and posted notices in the vault stating that before any work is performed in the vault, the feeders should be de-energized.
-
One worker raised the issue of shared vaults with a neighboring utility, noting that there should be a better notification system to ensure that the other company does not perform switching or other tasks that could pose a hazard to workers ensconced in enclosures.
Tailboards: At every job site before the work begins, the crew holds a tailboard meeting. A tailboard sheet informs and records the contents of this meeting. The dashboard displays the sheet, which all employees must sign to show that they understand it. Completed tailboard sheets are filed to maintain a record of the job discussion, and the safety coordinator periodically reviews them. See Appendix C.
Focus on Safety: PGE has a company-wide focus on safety. Every meeting, whether it is a line meeting or management meeting, opens with a “safety focus.” PGE uses numerous safety key performance indicators (KPIs) to track safety performance for all supervisors. Overall, PGE’s safety performance is very good, and the corporate goal is to achieve zero injuries. In the past four years, PGE has cut the number of injuries annually from 160 to 80 across the company.
PGE believes that the main reasons for this improvement are the following:
-
Improving communication and discussions about safety
-
Assuring employees that it is possible to work without injuries by rigorously adhering to safety practices, not compromising safety to get the job done, and consistent management attention and support of safety
-
Focusing on training
-
Becoming more diligent with the stretching program to reduce the number of soft tissue injuries. This stretching program was a grass roots initiative in one of the PGE regions and resulted in a dramatic reduction in number of strains and sprains. It was adopted company-wide, with employees leading it.
Safety Coordinator Crew Visits: One of the main roles of the safety coordinator is to conduct field visits, and each coordinator must log at least 200 crew visits every year. During a site visit, the coordinator looks for any safety violations. The coordinator records each visit, including what was found, the date of the visit, the name of the foreman, the job address, and the crew number.
The CORE supervisor tries to make at least five crew visits per week and fills out a company form.
7.8.16.15 - SCL - Seattle City Light
Safety
Safety Meetings
People
Training
Each year, every network employee attends 3.5-5 days of training that includes mandatory training such as confined space, manhole rescue, first aid, etc., as well as non-mandated training on pertinent topics.
SCL conducts various meetings to ensure a good flow of information relative to safety. Network employees attend:
-
Monthly safety meetings
-
Weekly crew chief meetings
-
Monthly “all network” meetings, where they bring everyone together to talk about training, safety, report out from conference findings, etc.
-
Bi-weekly Crew Coordination meetings, where safety issues related to specific jobs are discussed
-
Tailgates at the start of day, and after lunch each day
7.8.16.16 - Survey Results
Survey Results
Safety
Safety Meeting
Survey Questions taken from 2009 survey results - Safety
Question 8.2 : Please indicate the type(s) of safety meetings you conduct. Check all that apply.

7.8.17 - Safety Observations
7.8.17.1 - AEP - Ohio
Safety
Safety Observations
(Safety Auditing)
People
Periodic safety observations are performed by both the AEP Ohio Safety department representative and by Network Crew Supervisors.
Process
Safety checklists are used to guide the performance of the job site observations and to record findings. These checklists can be filled out using a smartphone application (app). The checklist is tied to AEP Ohio’s Human Performance Improvement program, which uses the SAFER acronym for approaching all jobs.
-
“S” for summarizing all procedures and safety precautions that will be needed at the job.
-
“A” for anticipating any potential dangers, problems, or complications.
-
“F” for foreseeing all the steps that are required in the job.
-
“E” for evaluating all the layers of protections and safety procedures that should be used.
-
“R” for reviewing just-in-time-documents online, past experiences on similar jobs, and online best practices for the specific job they are performing.
Safety checklists are recorded online. The AEP Safety Department Representative performs 15 safety audits per year in AEP Ohio. Information is recorded and reported to AEP Ohio management as well as to the parent company.
Technology
AEP Ohio uses job safety checklists that can be filled out through a smartphone app. Safety information is recorded and available online for the entire company. Forms, guidelines, and safety best practices documents are available online for all company employees, including the AEP Safety Manual.
7.8.17.2 - Ameren Missouri
Safety
Safety Observations
(Job Behavior Observations)
People
All management employees in Energy Delivery, including supervisors, managers, superintendents and vice presidents, perform periodic safety observations called Job Behavior Observations (JBOs). Per their process, each supervisor is required to perform a certain number of JBO’s per month, depending on their job classification. For example, supervisors are required to perform at least four work site JBO’s per month.
Process
As the title indicates, JBO’s are aimed at reinforcing positive job behaviors, such as the wearing of proper personal protective equipment, and adhering to company policies and procedures. The JBO inspector will review the job site and work being performed, looking for and recording observations of safe practices related to:
-
Personal protective equipment (broken into detail)
-
Body use, movement and position
-
Housekeeping
-
Vehicle equipment and use
-
Policy and procedures
The inspector will conduct a short tailboard meeting with the field crew, noting the positive observed behaviors, and pointing out any noted deficiencies.

Figure 1:
Ameren Missouri Superintendent performing JBO
Technology
Information from the JBO is recorded on a form, and entered into a computer system used to generate reports. Findings are aggregated at the division level, and published in reports that indicate the total number of observations, and the percentage of observed safe behaviors. These reports are issued monthly by the safety department and posted on the safety bulletin boards in each work center.
7.8.17.3 - CenterPoint Energy
Safety
Safety Observations
People
At CenterPoint, supervisors, managers and crew leaders are responsible for performing periodic site visits to perform safety observations. Observations are recorded on a Site Inspection checklist (See Attachment M).
Process
When supervisors perform safety observations, they are required to record these observations on a site inspection checklist.
Crew Leaders are responsible for performing at least four observations per month and for recording observations on the checklist. Operations Managers perform two observations per month, and the department Director performs one observation per month.
Technology
Information recorded on the checklists is kept in a three ring binder. Once per year, Major Underground management meets with the safety group to audit the observation findings, identify trend, and if appropriate, recommend safety improvement initiatives.
7.8.17.4 - Con Edison - Consolidated Edison
Safety
Safety Observations
Process
Safety Meetings
A job briefing is held each morning for every crew led by either a supervisor or lead mechanic.
Con Edison supervisors perform daily safety inspections, inputting the information on a four-page form. See Attachment J: Safety Inspection Form . The results of this form are entered into a computer system.
Con Edison also holds a larger safety meeting monthly with all field employees. Safety discussions are incorporated into other meetings as well, such as the underground network equipment standards committee meetings.
Con Edison gives safety performance high visibility. Safety performance reports are conspicuously posted in the utility’s buildings.
7.8.17.5 - Duke Energy Florida
Safety
Safety Observations
People
Regular occurring safety observations at Duke Energy Florida are performed by both the lead Health and Safety Professional for the South Coastal Zone, and by supervisor(s) within the Network Group.
The Lead Health and Safety Professional for the area will perform crew safety observations throughout the year, performing a minimum of eight observations each month. The purpose of the observations is to reinforce positive job behaviors.
Network department supervisors perform periodic job site observations and driving observations. Supervisors must perform and submit documentation of 15 job site observations per quarter.
Note that employees are expected to update their driving records (citations, tickets, insurance, etc.) in the Duke Energy Florida’s PlantView management system.
Process
The safety observation performed by the Health and Safety professional focuses on both the operations of the crew members including adherence to company standards, and how the supervisor interacts with his crew. While on site, the Health and Safety Professional may focus on a particular crew member for a detailed observation. This crew member will be asked questions about job scope, safety procedures, safety precautions taken while working, and safe practices at the site. In addition to asking questions, the observer will look for and document the use of safety and work practices.
Similarly, the safety and driver observations performed by department supervisors are focused on the use of safe work practices and adherence to company safety standards.
Observations of safe practices include:
-
Utilization of human performance concepts, tools and techniques, such as conducting or participating in the pre-job briefing
-
Use of personal protective equipment and other safety precautions
-
Body use, movement and position, and craftsmanship
-
Housekeeping and work area protection
-
Vehicle and equipment
-
Policy and procedures
-
Communications
Observers utilize a detailed Field Observation Form as a guideline, indicating whether or not observed behaviors are being performed in accordance with safety related practices or the Duke Energy Florida standard. In support of these observations, the company has developed subdocument that defines the “Range of Tolerance” associated with observed practices.
The safety inspector will conduct a short tailboard meeting with the field crew after the observation, noting the positive observed behaviors, and pointing out any noted deficiencies.
Technology
Job Site safety observations are documented on a paper Field Observation Form after during each visit (See Attachment O). Similarly, driver observations are also recorded on a paper form (See Attachment Q). These observations are then electronically recorded in PlantView, and can then be sorted for reporting by many fields including supervisor, employee, team, and time/date of observation.
7.8.17.6 - Duke Energy Ohio
Safety
Safety Observations
(Jobsite Inspections)
People
Supervisors perform monthly crew audits, visiting each crew once per month.
EHS employees will also perform random safety audits.
Process
Supervisors record their observations on an audit form. The information later gets entered into a computer system, for reporting and analysis.
The job site inspection summaries are reviewed by the department’s Vice President.
Technology
The job site inspection information is recorded on a form (See Attachment L) and then entered in a computer system. The EHS group analysis the summary data to identify safety / work practice trends.
7.8.17.7 - Energex
Safety
Safety Observations
People
Energex Crew leaders perform a job site risk assessment, called a “tool box talk” (see Figure 1). This is a documented safety meeting, with a form that is signed by all crew members and job site visitors who receive the briefing. Any visitors who arrive at the site must participate in a safety briefing as well. The performance of the job site tool box talk is a legislative requirement in Queensland.
Process
The briefing reviews the scope of the job and illuminates hazards specific to the job. The form used in the past was multiple pages and involved many check boxes. Energex worked with employees to produce a streamlined form that is used to document the safety meeting, to simplify its use, and to encourage discussion of job site safety hazards.

Figure 1:
Energex crew leader conducting a tool box talk (job site safety briefing)
7.8.17.8 - ESB Networks
Safety
Safety Observations
(Safety Auditing)
People
A Safety Services team gathers information and statistics on incidents and near-misses. This information is incorporated into ESB Networks’ extensive documentation system.
Process
Safety quality and environment are sampled through on-site visits by supervisors. There are two mandatory safety audits required of each supervisor per month. The results of these on-site safety samples may entail coaching, and it is not punitive unless the safety infraction is very serious.
ESB Networks measures success by less lost time due to injuries; no employee first-time injuries; fewer near-miss reports; less contractor injuries; and actions taken on safety improvement plans when adopted.
At the time of this immersion report there were only 12 minor incidents in the year – all were investigated. ESB Networks ’ goal for the year was no more than 20 incidents.
7.8.17.9 - Georgia Power
Safety
Safety Observations
(Safety Auditing)
People
The Georgia Power Network Underground group has a dedicated Health and Safety Advisor who reports to the Health and Safety Distribution supervisor within Georgia Power. The Advisor meets regularly with the larger Georgia Power Safety and Health group.
The Network Underground group has a dedicated Health and Safety Advisor assigned to them, who reports to the Health and Safety department at Georgia Power. The Advisor meets regularly with the larger Georgia Power Safety and Health group.
The Advisor, as well as Network Underground leadership, such as distribution supervisors (crew foremen), perform regular job site inspections, called safe work observations, to reinforce safe work practices.
Process
The Safety Advisor and Distribution Supervisors each make approximately 25 observations a month. For a Distribution Supervisor, this works out to about one visit per crew per month. Observations from the visitation are recorded on a form. The form contains a checklist of items for inspection, including work methods, equipment condition, working conditions, etc. Any defective safety equipment, such as torn gloves or worn boots, are confiscated and noted. The focus of the observations is to identify and call out those practices that are being done well, to reinforce positive behaviors.
Paper forms completed by Distribution Supervisors are forwarded to the Safety Advisor for entry into a Georgia Power computer system using Microsoft Word documents. Job observations can be pulled up on the computer system by crew leader, foreman, date, etc., though Georgia Power does not routinely run reports against this system.
(See Attachment K )
Technology
Job behavior and inspection forms are kept in Word documents for review and retrieval. OSHA-recordable accidents are stored in the company SHIPS safety management system.
7.8.17.10 - National Grid
Safety
Safety Observations
(Crew Observations)
Safety Compliance Assessment
People
The safety compliance assessment is a formal process in which a supervisor visits a job site and audits the safety practices in place. This type of assessment connects an employee to his/her work and formally records the results. Formal assessments are conducted so that each employee is observed and reported on at least once per year. Unlike the Safe and Unsafe Acts (SUSA) visits, which are intended to inform workers and assist them with making safe choices on an ongoing but anonymous basis, this is a formal compliance assessment that holds employees accountable for their working methods and equipment.
Process
Supervisors within UG Electric East are required to perform at least two Safety Compliance audits per month. Each employee is to be observed at least once per year.
Each department (for example the underground group) has its own compliance assessment procedure based on the work undertaken. Compliance reports indicate who was audited and where, unlike the SUSA visits which are more anonymous. Incidents are reviewed to see what the biggest issues are. A major focus with compliance assessments is ensuring that a complete, well-written job brief was performed and signed, identifying hazards and risks for that job, and that steps were identified and taken to reduce those risks.
The compliance assessment form (See Attachment E) includes basic information on the assessment, including the site name and location, crew task, observation date, personnel observed, whether they are employees or contractors, the number of people observed, and the observer(s).
Many items in various categories are assessed and recorded on the checklist. These include the following:
-
Focused Observations for Electric
-
Are hazards understood?
-
Are proper steps taken to avoid those hazards?
-
-
Manual Handling - Soft Tissue Injury Prevention
- Are repetitive or strenuous tasks done correctly?
-
Communication & Risk Assessment
- Are the job brief and related duties done correctly?
-
Work Area Safety
-
How secure is the work area?
-
Are hazards marked?
-
Is the work area kept tidy?
-
-
Personal Protection
-
Is the protective equipment in good condition?
-
Is it properly used?
-
-
Using Tools and Equipment
-
Are appropriate tools used?
-
Are they in good condition?
-
-
Vehicles / Mobile Equipment
-
Are vehicles being operated properly?
-
Are they in good condition?
-
Is all the required safety equipment on board and inspected?
-
-
Work Methods and Procedures
- Are proper procedures being followed at all times?
-
Work Place Environment
-
Is the environment safe and comfortable?
-
Is water and first aid equipment available?
-
-
Work Practices
-
How is the body positioned during tasks?
-
What sorts of precautions are taken while maneuvering and working?
-
-
Environmental
-
How is waste managed?
-
Are proper procedures being followed to protect the environment?
-
These categories all have a number of very detailed checklist items, which can be rated Safe or Unsafe, or on a scale from Poor to Very Good, depending on the question.
For checklist items that score as “poor” or “unsafe”, specific observation detail are recorded, including the people involved, the details of the problem, and the immediate action taken to remedy it. Follow-up items are listed and assigned to the appropriate party, including the due date and a complete date to be filled out once completed.
Technology
A checklist for Compliance Assessment form is used for performing these assessments. (See Attachment E)
The Corporate Safety department records information from the compliance assessments into a computer system for generating reports to monitor safety trends.
7.8.17.11 - PG&E
Safety
Safety Observations
(Crew Observations)
People
Supervisors perform a minimum of four work site crew observations per week.
The VP, Superintendent M&C Electric Networks performs two crew observations per week.
PG&E also has a group within Maintenance and Construction (M&C) called the Quality Control (QC) group. This group performs periodic safety audits. Note that at the time of the EPRI practices immersion, this group was being trained on network systems in preparation for implementing QC audits of the network.
Process
The crew observations include a look at work procedures and safety procedures.. Supervisors log their observations on form. The information later gets entered into a computer system, for reporting.
Technology
The crew observation information is recorded on a form and then entered in a computer system. Certain items may be flagged by the system based on “scores” reported by the observer, though it is not being used for performance trending.
7.8.17.12 - Portland General Electric
Safety
Safety Observations
People
Safety observations are the responsibility of the safety coordinator for Eastern Region, who covers the CORE in addition to other locations. The present coordinator has over 30 years of experience and began his career with PGE as a journeyman.
The CORE supervisor also routinely performs safety observations and tries to make at least five safety visits per week.
Process
Safety Coordinator Crew Visits: One of the main roles of the safety coordinator is to conduct field visits, and each coordinator must log at least 200 crew visits every year. During a site visit, the coordinator looks for safe work practices and any safety violations. The coordinator records each visit on a crew visit form, noting what was found, the date of the visit, the name of the foreman, the job address, and the crew number.
The CORE supervisor also tries to make at least five crew visits per week and records findings on a similar crew visit form.

Figure 1:
T&D safety coordinator crew visit form
7.8.17.13 - Survey Results
Survey Results
Safety
Safety Observation
Survey Questions taken from 2018 survey results - safety survey
Question 9 : Do you perform routine training on how to conduct a tailboard meeting?


Question 10 : How to you determine / assess the quality of your tailboard meetings?

7.8.18 - Special Safety Programs
7.8.18.1 - Ameren Missouri
Safety
Special Safety Programs
(Safety Sampling)
People
Ameren Missouri has implemented a peer to peer safety observation process called Safety Sampling. In this program, employees perform periodic safety observations with peers to reinforce positive job behaviors. The program is similar to the Job Behavior Observation (JBO) program, performed by managers (See Safety – Job Behavior Observation ). ).
Process
An example of the process used to perform safety sampling is the one used in the Distribution Service Test department. This department has a safety committee that includes four Distribution Service Testers. Each member of the committee spends one day per month visiting with crews, and performing a safety sampling. They will review the job site and work being performed, looking for and recording observations of safe practices related to:
-
Personal protective equipment (broken into detail)
-
Body use, movement and position
-
Housekeeping
-
Vehicle equipment and use
-
Policy and procedures
The safety sampling inspector will conduct a short tailboard meeting with the field crew, noting the positive observed behaviors, and pointing out any noted deficiencies.
Technology
Information from the safety sampling is recorded on a form (See Attachment M ).
Statistical summary information from the safety sampling program is reported monthly and published on the Ameren Missouri safety bulletin boards in each work center.
7.8.18.2 - CEI The Illuminating Company
Safety
Special Safety Programs
(Safety Stop Program)
People
CEI has two full time safety professionals called Advanced Safety Coordinators, who focus on implementing safety programs for the entire Illuminating Company. The Advanced Safety Coordinators report organizationally to the Director of Human Resources for CEI. One of the programs they administer is the Safety Stop Program, focused on observation and reporting of safety behavior.
Process
CEI is utilizing a program produced by DuPont Corporation called the Safety Stop Program (Safety Training Observation Program). The program is focused on guiding people (leaders, supervisors, safety professionals, etc) in observing workers performing routine work activities with a focus on safe behaviors. The program includes training of employees in performing safety observations, and the use of a “stop” card that is used to observe and record safe acts and to correct unsafe acts. (See Attachment U). ).
The program includes five criteria: Decide, Stop, Observe, Act, and Report. Supervisors will perform safety observations that include noting the reactions of people, the use of personal protective equipment, the positions of people, the use of tools and equipment, and procedures and orderliness. They will record both safe acts and unsafe acts observed. If an unsafe act is observed, they will take immediate corrective action and record same.
Supervisors complete the observation forms and send them to the Advanced Safety Coordinators who tabulate the information and use the information to monitor trends. Once per quarter the trend summary is distributed and aids management in determining what safety elements to focus on.
CEI has had high participation in the programs, with over 2000 safety observations turned into their Safety Coordinators in 2008.
CEI noted that most reported observation of unsafe practices was in the procedures and orderliness category.
Technology
The Safety Stop Cards are filled out manually. The information collected is tabulated and reported using a Microsoft Excel spreadsheet.
7.8.18.3 - CenterPoint Energy
Safety
Special Safety Programs
(HERO Program)
People
CenterPoint has implemented a Value Based Safety Program in each major operating group. Within Distribution Operations, of which Major Underground is a part, the program is called the HERO (“Having Employees Record Observations”) program.
The HERO program, now in its third year, is a peer to peer observation program led in full by employees, and including all employees (other than Managers). The program supplements CenterPoint’s other safety meetings, and is focused on getting employees to look out for each other.
Each division has a HERO team, with representatives for each group within the division participating on the team. The Major Underground group assigns a crew leader to participate in this team, and to be a safety point person. This individual liaises between the HERO group, management and employees.
The HERO team decides how to organize and implement the program and establishes a specific budget for executing the program.
The HERO program does not have a formal discipline program associated with it.
Process
The HERO program is a peer to peer observation program that is executed by using checklists. Employees will conduct a work task observation and record the observations on one of three checklists – an office check list, see Attachment J , a field checklist, see Attachment K , and a driving checklist, see Attachment L .
An employee who is a potential observer approaches a peer employee and lets them know that he/ she would like to perform an observation. The observer performs a short observation, records findings on the checklist, and, at the conclusion of the observation, shares any noteworthy findings with the employee who was observed. In addition to providing positive feedback, the observer will talk about no more than one item for improvement, if identified.
When the program was implemented, everyone received some training in how to perform an observation. CenterPoint has found the program to be highly beneficial to the observers, in that it forces them to think about safety as it relates to the work being observed.
Afterword, the information from the checklist is entered into a computer program (RADAR) that enables CenterPoint to run reports to identify observation trends, potential risks, and generate safety statistics.
The program measure is the percentage of participation of employees. In Major UG, 84% participate in the program, completing at least four observation forms (checklists) per month.
CenterPoint does provide a yearly incentive to participate in the program. Gift cards are providing to employees that participate for more than three months in a row. CenterPoint will also conduct periodic celebrations for the achievement of selected milestones associated with the HERO program.
HERO teams also develop other initiatives to promote safety, such as developing signs to remind employees of safe practices, such as using a handrail when going up or down stairs.
CenterPoint believes the program to be beneficial. Participation in the program is strong. Corporate safety performance has improved over the past three years, while Major Underground Safety performance has remained static.
Technology
HERO observation information is entered into a purchased database called RADAR data management software[1] , by Safety Performance Solutions, Inc, which facilitates data recording and report writing.
7.8.18.4 - Duke Energy Florida
Safety
Special Safety Programs
(Keys to Life)
People
Duke Energy has established certain “Keys to Life,” a listing of behaviors / practices associated with hazards design to maintain personal safety.
Associated with the Keys to Life is a consolidated manual of work processes for working safely. The manual covers every job throughout the enterprise, including nuclear, overhead, and underground network work.
Process
The genesis of the development of the Keys to Life was an employee fatality. The company responded by defining certain practices and behaviors associated with hazards that must be follow. Adherence to the Keys to Life practices is non-negotiable. For the Duke Energy Delivery Operations and Services organization, the Keys to Life areas of focus, for which required safe behaviors have been defined, include:
-
Driving safely
-
Personal protective equipment
-
Pre-job briefings
-
Work zone safety
-
Electrical safety
-
Pole/structure inspection
-
Falls from elevation
-
Falling objects/line of fire
-
Rigging
-
Confined Space Entry
-
Trenching/excavations
See Attachment P.
Each of the practices defined in the Keys to Life is supported by a consolidated manual of work processes, organized by specific tasks, and posted online. Subject matter experts (SMEs) from throughout the Duke Energy enterprise are called on to contribute their expertise in the formulation of specific processes included in the manual.
An example of this is the work process for safely entering manholes. To develop this process, SMEs from throughout Duke Energy, including a representative from Duke Energy Florida, came together to craft the enterprise-mandated manhole entry process. The SME-generated work methods are set to the highest standard, perhaps exceeding local operating company standards already in place. The goal is to develop and maintain the most robust standard and apply it throughout the Duke Energy operating companies. Periodically, the company will issue bulletins that augment the work processes, which are then incorporated into the larger manual.
In safety alerts that summarize safety incidents, hazards, or near misses, Duke Energy will reference the associated “Keys to Life Connection,” which reviews the appropriate safe work practices associated with the specific case.
Technology
The Keys to Life manual of work methods is posted online. Electronic bulletins supplement the manual, and are then incorporated into the larger online manual.
7.8.18.5 - Duke Energy Ohio
Safety
Special Safety Programs
Safety Stand Down Meeting
People
At Duke Energy Ohio, the safety “stand down” meeting is a special meeting convened companywide to discuss a significant issue relative to safety such as a serious accident. EPRI investigators attended such a meeting convened to review an accident involving a contractor.
In such a case, Duke Energy Ohio management will assemble a meeting of the entire department. Meeting content can vary but consists of things such as reading letters / opinions of listening to voice mails from upper management on a particular incident, emphasizing a particular safety principle or discussing a particular accident, and reviewing video’s pertinent to the particular incident. For example, during the Safety Stand Down meeting attended by EPRI, employees viewed a Duke produced video that showcased the experiences of an employee who had sustained a work related injury.
All employees attend these meetings and are given an opportunity to discuss the situation, ask questions and raise related issues.
7.8.18.6 - Energex
Safety
Special Safety Programs
(Strategic Risk Assessments)
People
Improving safety is a key focus area for Energex, which is driven by the company CEO. The company has embarked upon a system wide effort to change their safety culture.
Energex has established a safety management system, which is a comprehensive framework that guides their safety approach, and addresses strategies for managing the hazards and risk associated with the design, construction, operation and maintenance of the system. Strategies such as their approach to safety training, incident investigation and response, and emergency preparedness and response, are guided by this framework.
Energex has recently reorganized their safety organization, consolidating a corporate safety group, a Service Delivery safety group, and a Power Plant Safety group to form one safety organization.
Process
Energex has implemented a process of performing a strategic risk assessment on their 10 highest risk activities for the purpose of assuring that they have adequate controls established to address those risks.
Technology
The company uses a product called Bow-Tie ( http://bowtiepro.com/ ), which facilitates the creation of bow-tie diagrams, to perform these assessments. Bow-tie diagrams are a tool for communicating risk assessment results by displaying the links between the potential causes, preventative controls and consequences of an event (incident or accident).
7.8.18.7 - Georgia Power
Safety
Special Safety Programs
Target Zero Safety Program
People
The Georgia Power Underground Network group has a dedicated Health and Safety Advisor who reports to the Health and Safety group within Georgia Power. The Advisor meets regularly with the larger Georgia Power Safety and Health group. The Safety and Health Advisor works closely with the Network Underground manager regarding the operation and maintenance of the network underground system throughout Georgia. In all, the Safety and Health Advisor is responsible for the training and safety of approximately 180 people within the organization.
Process
Since 2005 Georgia Power has instituted a safety program called “Target Zero” aimed at achieving no accidents in a calendar year. If an accident should occur, the company “resets the clock”, so to speak, back to zero, to maintain the focus on eliminating all accidents.
Georgia Power does establish goals related to safety performance, including accidents. Management bonuses are influenced by safety performance. Georgia will also establish group incentives based on achievement of safety targets. Network Underground noted that there have been no serious injuries in the department since the goal has been in place.
Technology
Georgia Power issues safety reports to all departments; documents safety training schedules; and issues Web site blurbs on the company intranet about safety tips, safety competitions, and safety reminders. Bulletin boards are also used throughout the company to re-enforce safety programs and safety and health messaging. Bulletin boards also display recorded deaths at the company.
Georgia Power safety book, called “Section O,” describes the company safety rules.
(See Attachment L )
7.8.18.8 - National Grid
Safety
Special Safety Programs
Safe & Unsafe Acts (SUSA) Audits
People
Safe and Unsafe Acts (SUSA) is an informal audit process in which someone observes field crew behavior, notes safe or unsafe acts, and then discusses with crew members the safety of those acts. National Grid implemented the SUSA program to find a way to enable managers to communicate effectively about safety with the crews and to continually reinforce safe working habits.
Audits are usually performed by a direct supervisor of the work crew, but can be performed by anyone. The results of the audit are recorded anonymously so that incidents can be reviewed and areas of concern identified in general. Each supervisor undertakes six SUSAs per month, for a total of 72 SUSAs per year. Work Methods people do four SUSAs per year.
Process
Unlike a formal compliance assessment, the Safe and Unsafe Acts (SUSA) visits provide a more informal assessment method where the focus is on dialogue with employees. During a SUSA visit, crews are engaged in questions such as “what is the worst thing that could happen here?” and “how do we avoid it?” In particular, the tone of a SUSA visit is meant to be conversational, and to get employees thinking rather than being passively instructed. Situations are discussed with a focus on how to act when similar scenarios are encountered in the future. Supervisors undertake them six times per month.
While the focus is to informally discuss safety issues to improve working methods, a checklist for performing SUSA visits is also filled out to assist with the process. On it, general information is recorded including the primary and additional tasks the crew is performing (e.g. installing wire), plus the work site location and observers present. Much like the formal assessments, a number of checklist items are scored from “poor” to “very good”, or as either “safe” or “unsafe”, in categories including manual handling (for soft tissue injury prevention), communication and risk assessment, work area safety, personal protection, tool and equipment use, vehicles and mobile equipment, the overall work place environment, driving, work practices, and environmental impacts. Details can be found on the attached SUSA document (See Attachment D)
The SUSA records specific details of “poor” or “unsafe” observations, including the immediate action taken, but unlike the formal compliance assessment, the forms do not include crew member names. The reporting is relatively anonymous as the reporting function of the SUSA forms are not meant to hold individual employees accountable, but rather to allow for a review of incidents to identify the biggest issues and aid with discussion and training.
Technology
A Safe/Unsafe Acts checklist is used for performing these assessments (See Attachment D ).
7.8.18.9 - Portland General Electric
Safety
Special Safety Programs
Switching and Tagging
People
Crew members (cable splicers) perform switching and tagging under direction from the load dispatchers working in the System Control Center (SCC). Dispatchers are assigned geographically, and from Monday to Friday, two dispatchers cover each of the two PGE regions. One of the regions includes the CORE underground area.
Process
Planned outages follow a structured process informed by a shutdown order that identifies the switching steps, including the location and device to be operated. For a planned outage, the Network Engineering Department creates a shut-down order document using a template and provides the load dispatcher with a three-day lead time to complete the order.
The communication between the crew members and the dispatcher uses three-way communication, with the crew member recording what the dispatcher says verbatim before reading the information back to the dispatcher. After the crew member has read the switching step to the dispatcher, the dispatcher confirms that it matches the switching order. Only after confirmation, the dispatcher issues the order and allows the crew member to perform the switching. Note that for the network, this communication does not occur at every step. The dispatcher provides an order for the crew to open and danger-tag all the associated vaults on the shutdown order. The shutdown order lists all the vaults, and one order specifies when to open and tag all the associated vaults. Only after all of the devices have been operated and tagged will the crew member contact the dispatcher and receive a clearance to install grounds and proceed with the work.
At present, load dispatchers use the network protector to gather information about conditions on the secondary system, but nothing is controlled remotely.
When PGE tags circuits and equipment, this also appears on its geographic information system (GIS) mapping.
7.8.18.10 - SCL-Seattle City Light
Safety
Special Safety Programs
Manhole / Vault Event Response - A Collaboration between Seattle City Light and the Seattle Fire Department
Introduction / Overview
Many electric utilities in the United States operate underground distribution networks in densely populated major load centers such as cities. These systems, because of both their electrical design (meshed systems) and civil design (underground ducted manhole / vault systems), are highly reliable as they are largely protected from adverse external conditions and less prone to outages than overhead systems because of their inherently redundant design. However, underground systems do occasionally fail and can result in “manhole events”, including smoke emissions from a manhole, fire in a manhole, or a manhole explosion.
The majority of these events originate within the manholes, vaults or in cable ducts between the structures. In most cases, the event causes smoke to emanate from the structures. In rare occurrences a fire is visible, and in extreme cases an ignition of combustible gases which have formed within the manhole causes the manhole cover to be propelled into the air. These manhole events, although rare, can damage surrounding infrastructure, and endanger the public.
Accordingly, electric utilities and EPRI are addressing the problem with research into solutions designed to prevent, mitigate, and contain events. One area of research focus has been to identify utility practices, including approaches, procedures and technologies, that are being used by utilities to respond to and mitigate such events. To this end, in 2018, EPRI issued a survey that seeks to identify practices being employed across the industry to prepare for and respond to manhole events, including understanding what sort of emergency preparedness and response guidelines have been established in the industry, what sort of emergency exercises or “drills” are being performed, and what sort of partnerships have been developed with other emergency response stakeholders, such as fire companies.
For many utilities, the roles of the electric utility responders and of emergency partners such as fire department responders are not well clarified or documented. The 2018 survey of utilities found that only 25% of responding companies have documented procedures for company employees responding to a smoking manhole, and only about 30% have documented procedures for company employees responding to a manhole fire. Further, only about 30% report having documented procedures for first responders responding to a manhole event. In addition, only about 25% of responding companies perform periodic drills that include network situations such as a manhole fire, and of those who do, less than 15% involve other stakeholders, such as the fire department, in those exercises.
Because manhole events are rare, folks responding from the fire department (Fire ) may not be sure what expectations the utility has of them. In the case of a smoking manhole, if the fire company arrives at the site before the utility is on site, what does the utility expect? Should the Fire attempt to put out the fire? Should they wait until the fire burns out? Should they wait until the utility has de-energized the area before attempting to put out the fire? Or should they attempt to control the fire before it spreads, minimizing damage, and possible reducing outage time? What sort of PPE should they utilize? Should they use water or chemicals? What sort of chemicals should be used? Similarly, Electrical responders may not be familiar with the expectations that the fire department resources have of them.
Seattle City Light - Seattle Fire Department Collaboration
This case describes a collaborative effort underway between Seattle City Light (SCL) and the Seattle Fire Department (Seattle Fire) to define roles and expectations, raise understanding and awareness of the Fire Department of the electric company infrastructure and hazards associated with manhole events, and develop and agree to a response approach for manhole events.
History / Background
The collaboration between SCL and Seattle Fire was initiated in 2014, and was championed by the Principal Electrical Engineer at SCL, responsible for their network system, and a Captain within the Seattle Fire Company. The process involved a series of regular meetings conducted between the two groups to clarify SCL’s expectations of Seattle Fire in an emergency, and from that, to formalize the relationship between Seattle Fire and SCL, including definition of roles and responsibilities, definition of practices to be utilized, and development of specialized training, tools and technologies for Seattle Fire to be able meet those expectations. Part of the process for identification of practices included joint field visits to representative SCL facilities, joint visits to other city utilities and fire companies, and participation in industry working groups such as the North American Dense Urban Utility Working Group (NADUUWG).
Vault Response Team
The result of these efforts was the formation within Seattle Fire of a Vault Response Team (VRT), a group of firemen who receive specialized training in responding to electrical fires that occur in the city of Seattle. The VRT is staffed by regular on-duty members of the fire company, and is automatically dispatched on all manhole, vault and substation fires.
See Figure 1.

Figure 1:
Seattle Fire Vault Response Team
Seattle Fire has documented procedures and roles for the members of the VRT. They have developed a Standard Operating Guideline (SOG) to guide the VRT when operating at an electrical manhole, vault or substation fire. This guideline provides an overview, key definitions, strategies, and defines the actions that should be taken. This document is complemented by a Vault Fire Response Positional Responsibilities document, which defines the roles and responsibilities of various positions that may be assigned within the VRT including the Incident Commander, Vault Team Leader, The Truck (Power 25) Operator, Nozzle Team, Vault Safety Officer, Cover Team Supervisor, Cover Team, and Aid Members (“Hooks”).
In an emergency, the VRT Team Leader coordinates with Seattle City Light and advises the Incident Commander of hazards and of potential tactical considerations. If appropriate, and with approval of the Incident commander, Seattle Fire will flood a manhole or vault with CO2. In most cases the vault or manhole does not need to be deenergized for the VRT to commence flooding operations to extinguish the fire.
Seattle Fire has created other documents to support and guide this process, consistent with their internal processes, including Command sheets and matrices, and are working on an SOP for Vault and Substation fires.
Power 25 Specialized Fire Truck
Part of mobilizing the VRT was assuring that they had proper equipment to respond to an event, including refurbishing a fire truck (Power 25) so that it is equipped with a NFPA compliant “High Pressure Mobile System”, a system for delivering CO2. This system has a capacity of 900 lbs. of liquid CO2, and a nozzle system capable of moving more CO2 per minute with less nozzle reaction. The truck is also equipped with other tools, including a laptop that is loaded and kept up to date with copies of SCL’s vault / manhole maps, SCL hooks for removing manhole lids, a Kevlar tarp for positioning over the manhole after flooding with CO2 to provide for greater saturation, CO2 detectors, and high visibility barriers for placing around open manholes. The truck also carries an on-board 15 kW generator to provide electric power or lighting if necessary.
See Figures 2 & 3.

Figure 2:
Power 25 Specialized VRT response truck

Figure 3:
Power 25 CO2 Delivery System
Training
To support the formation of the VRT, SCL and Seattle Fire have jointly developed specialized training for the members of the VRT. Some of the training is taught by SCL experts. VRT members receive 96 hours of specialized training including:
Training in the use of the Power 25 specialized truck and in the deployment of CO2,
Training in the hazards associated with CO2,
Training in hazard recognition so that VRT responders know what to look for. This training includes recognizing hazards in vaults located within buildings, hazards from street vaults and manholes, and hazards from rectifiers.
Training in “sizing up” a vault to determine appropriate action,
Training in electrical theory, including AC / DC systems, and in the difference between network and URD systems.
See Figure 4.

Figure 4:
Seattle City Light delivering electrical training
A noteworthy practice utilized by SCL and Seattle Fire is the performance of a joint vault fire exercise, referred to as “confidence training”. The exercise is conducted at an SCL training facility which is equipped with submersible vault and manhole structures for use in training. As part of the confidence training, SCL will create an arc in a manhole by positioning two cables about one inch apart, grounding the one side and applying a voltage (approx. 20kV) to the other by connecting to Hi Pot (thumper) device. An arc is created, which creates a true electrical scenario, and familiarizes VRT crews with the sounds associated with arcing.
The VRT will then “practice” all phases of the process for responding to an electrical event, including donning all appropriate PPE, manning the various positions, and completing all required activities in the proper order, including removing the manhole lid, positioning the CO2 nozzles, flooding the hole, and covering with the Kevlar tarp.
See Figures 5 - 8.

Figure 5:
Confidence Training, creating an ARC

Figure 6:
Confidence Training - Removing the cover

Figure 7:
Confidence Training - Positioning the nozzle, flooding with CO2

Figure 8:
Seattle City Light delivering electrical training
Outreach
As part of their on-going efforts to solidify the process and to foster similar collaborations elsewhere, Seattle Fire and SCL have reached out to peer utilities and fire companies nationally, including participating in industry workshops such as NADUUWG, and conducting site visits with other utilities and fire companies to exchange ideas. Seattle Fire has also allowed peer fire companies and utility representatives to visit Seattle and participate in training.
Summary
Manhole events are a rare but potential happening for operators of urban underground systems. By virtue of their scope and impact, these events demand the involvement and coordination of various emergency response stakeholders including fire companies. Responding effectively requires defining response processes, and clarifying roles. Seattle City Light and the Seattle Fire Company have demonstrated an effective and comprehensive approach to meeting this objective that includes support from senior management, appropriate resourcing, documentation of standard operating practices, definition of roles, development and delivery of training, and the performance of periodic exercises. SCL and Seattle Fire’s approach can serve as a model for utilities seeking to coordinate with their Fire response partners.
7.8.19 - Training
7.8.19.1 - AEP - Ohio
Safety
Safety Training
People
AEP has a strong culture of safety, which is evident in its attention to safety in the work place, in its work practices, and in its approach to network design.
Process
All Network Mechanics and Network Crew Supervisors have undergone extensive safety training, including lead awareness, de-energization of cables, network protectors, safe manhole entry, and many other safety procedures and practices that are contained in the AEP Safety Manual. Annual safety training for Network Mechanics is also held on topics such as safe handling of new equipment and lead awareness.
Company-wide yearly Safety Stand Downs are also conducted, which focus on specific safety practices in depth. In these “Stand Downs,” workers spend allotted time, usually several hours, focusing on a safety topic.
Technology
The AEP Safety Manual, safety forms, guidelines, and safety best practices documents are available online to all company employees.
7.8.19.2 - Ameren Missouri
Safety
Safety Training
People
Ameren Missouri holds various safety meetings, ranging from job site tailboard meetings to large company safety meetings. Meetings can be led by a crew foreman, supervisor, manager or safety professional, depending on the type of meeting.
In addition, Ameren Missouri has implemented the practice of kicking off all company meetings with a brief safety message delivered by the meeting host. The meeting host will select a topic of interest for the group and share information on that topic. The topic does not necessarily have to be related to the meeting purpose, but rather a topic that would be of interest and generally apply to the meeting participants.
Process
Ameren Missouri holds various safety meetings, including:
-
Job site tail board meetings
-
Morning “5 minute” briefings
-
Monthly safety meeting
-
Quarterly Safety meetings
-
Tool committee meetings
-
Safety committee meetings
-
Safety Culture Team meetings
Job Site Tail Board Meetings
Ameren Missouri crew leaders perform job briefings (tailboards) at the beginning of each work day or new job. An element of the job briefings is a requirement to regroup and re-brief when the work environment changes.
Ameren Missouri records the job briefing on a Job Briefing Sheet, including the employees who participated in the briefing.
Morning “5 minute” briefings
Ameren Missouri conducts a daily morning safety meeting (also called a “5 minute briefing”). This meeting is led by a supervisor who prepares a safety related topic. The morning meeting includes time for employee warm-up and stretching exercises. Once a week, Ameren Missouri invites a physical therapist to lead the morning stretching exercises and provide council to employees.
Monthly Safety Meeting
Ameren Missouri conducts monthly safety meetings within each department. For example, the Underground Construction group and Service Test group each convene a monthly safety meeting, with all members of the department represented. A safety professional may or may not be present.
A meeting summary is posted on the Safety bulletin board.
Note than in the Service Test department, union employees also meet quarterly to discuss safety issues. This meeting is evidence of a cultural transition at Ameren Missouri, with individuals taking accountability for their safety.
Quarterly Safety Meetings
Ameren Missouri conducts quarterly safety meetings with all employees. These meetings are administered by Ameren Missouri safety professionals.
Tool Committee
The Ameren Missouri underground group has formed a tool committee comprised of one supervisor, and three field representatives to discuss issues and develop recommendations for worker tools. The Blue Hat representative also participates on this committee.
The tool committee meets monthly. A meeting summary is posted on the Safety bulletin board.
Safety Committee
The Ameren Missouri Underground Construction group has formed a safety committee led by a supervisor and comprised of in house people, including a safety professional from Ameren Missouri’s safety group. This committee discusses departmental safety issues and makes recommendations for change locally. Information from this committee is distributed via the monthly safety meetings, or daily morning 5 minute meetings.
The safety committee meets monthly. A meeting summary is posted on the Safety bulletin board.
Safety Culture Team
Ameren Missouri has formed a Safety Culture Team to focus on understanding cultural barriers to improving safety locally, and to make recommendations for changes to build trust and positively influence the company culture. The committee is comprised of managers and supervisors, including the UG Construction manager. A safety professional is also part of this team.
The safety culture team meets monthly. A meeting summary is posted on the Safety bulletin board.
7.8.19.3 - CEI - The Illuminating Company
Safety
Safety Training
(Job Skills Demonstration)
People
CEI has implemented a Job Skills demonstration program that assures that Underground Electric Workers in a given classification can demonstrate proficiency in certain skills in order to advance. Electrical workers who demonstrate proficiency in certain skills can move up in pay grade within a specific classification.
CEI has assigned several people (6) to act as advocates for the skills development process. These individuals sit down with every employee and review the skill book, explain how the process should work, ascertain whether the employee is getting the training he/she needs, and act as advocates of the process.
Process
Employees are each given a “skills book” that lists the individual skills they are responsible to learn and demonstrate in order to advance. See Attachment W
The employee will develop these skills through on the job training. When an employee feels he is proficient in a certain skill, he can demonstrate the skill, proving that he has the skills to perform the given task. A supervisor will “sign off” in the skills book indicating that the employee has demonstrated skill proficiency.
As employees within a classification demonstrate skill proficiency, they move up in pay within that classification. There are several pay steps within each classification.
Prior to moving to the highest salary step within a pay grade (Salary step One), an employee must take a progression test. This test (not a skills demonstration but an “on paper” test) is administered by the training department and covers the topics demonstrated in the skills book.
When an employee passes this test and achieves salary step One within a pay grade, they are eligible for advancement to a higher classification.
Typical skills required at each classification include:
-
Electrical Worker C – learn to pull cable, understanding equipment.
-
Electrical Worker B – begin to learn splicing, learn a 15 kV transition slice
-
Electrical Worker A – 33 kV Transition splice, Switching
-
Leaders – Network Protector Maintenance
Technology
The skills book is a hard copy book maintained manually by the employee. The skills proficiency test is a computer based test administered by the training department.
7.8.19.4 - CenterPoint Energy
Safety
Safety Training
Job Skills Demonstration Program
People
CenterPoint has a strong focus on formal training and on-the-job training, with advancement to the journeyman levels based on a combination of training, testing, and time of service in the various position levels. CenterPoint has well developed documentation of the skills that must be achieved and demonstrated at each level in order to advance to the next.
Process
Advancement through the Network Tester and Cable Splicer job families involves a three year apprenticeship program that includes a combination of training, job skills demonstration, and testing.
Network Testers are hired as apprentices, and enter into a three year apprenticeship program. They initially attend a three week orientation program that includes pole climbing. New employees must successfully complete this three week orientation to remain in the apprenticeship program. After the first 90 days of being accepted into the program, Network Testers participate in a second three week program where they receive additional overhead line training and company orientation.
The apprenticeship program is broken in to 6 six month classes that include classroom training, OJT, and testing to move from one class to the next. If an individual cannot pass the tests and other requirements, he will not advance. He will be given a second opportunity to pass and advance, If he cannot, he is rejected from the program. (He may be able to find other opportunity within CenterPoint). At the completion of the three year program, the employee becomes a journeyman Network tester.
Similarly, Apprentice Cable Splicers, selected from Helpers who have completed one year with the company, enter the Cable Splicer apprenticeship program. They, too initially attend a three week orientation program that includes pole climbing. After being accepted into the Apprenticeship program, cables splicers participate in a second three month program where they receive additional overhead line training and company orientation. At the completion of the three year program, the employee becomes a journeyman Cable Splicer.
Employees are required to review training modules for selected tasks (example: Splicing – See Attachment F ). The employee is responsible to review the module and discuss its contents with their supervisor. They will then take a written test to demonstrate their understanding of the material included in the module. ). The employee is responsible to review the module and discuss its contents with their supervisor. They will then take a written test to demonstrate their understanding of the material included in the module.
7.8.19.5 - Duke Energy Florida
Safety
Training
People
Duke Energy Florida uses a combination of classroom training and computer based training to deliver safety training. Experienced Network Specialists lead the delivery of some of the safety related training courses. Others are led by safety professionals.
The Lead Health and Safety Professional for the South Coastal Zone, which includes the Clearwater and St. Petersburg network systems, is responsible for oversight of safety training, safety standards, and safety records, including records of training completion and certifications.
Process
Training is delivered in classes and online. Safety related training includes the following (a partial list):
-
First Aid
-
CPR / AED
-
Environmental Awareness (full day training)
-
Confined Space Training
-
Manhole/Vault Entry
The Environmental training covers safe water, oil, and air procedures and requires a full day. First Aid, CPR and AED refreshers are normally accomplished at regularly scheduled Safety Meetings. In total, each employee has about one week of required safety training per year.
OSHA 269 forms, a Duke Energy Form, are on record for each field employee, are maintained by the department supervisors and include verified certification and training for the following:
-
CPR
-
First Aid
-
Job Site Briefings
-
Confined Space Entry
-
Trenching and Excavations Procedures
-
Personal Protective Equipment
-
Driving and Job Site Observations
The trainee’s supervisor signs a Record of Training (ROT) once training has been completed by the prescribed deadline. These training records are kept online. Forms and certifications are kept up to date as OSHA audits and inspects these forms once or twice a year.
Technology
To keep employees trained and refreshed on safety issues, the company uses MyTraining — an automated system that reminds employees through electronic alerts of what safety compliance training they have to fulfill, and the time period in which to complete that training.
All certifications and training records are kept on line and viewable with PlantView. Hard copy print outs are also available for inspection.
7.8.19.6 - Duke Energy Ohio
Safety
Safety Training
People
Duke Energy Ohio has technical trainers who run schools for Cable Splicers and Network Service persons.
Duke also has a technical skills specialist, who works closely with field resources on training issues (see Technical Skills Specialist).
Process
Some of the regulatory required training programs run at Duke are:
-
PCB handling,
-
lead awareness,
-
blood borne pathogens, and
-
manhole entry – confined space training.
Technology
The Dana Avenue facility contains a training center, built in 1990. The Center replicates the various types of construction field resources will encounter in the underground system, both network facilities and non-network facilities.
Within the center, trainers have the ability to energize facilities at operating voltages. As a safety feature, a man must hold a switch while facilities are energized – if the man let’s go to switch, a switch will automatically open, de-energizing the facilities.
The training facility can be used to practice fault locating techniques.
Below are some pictures of the training center.


Figure 1 and 2:
Training Center - transformer


Figure 3 and 4:
Training Center – Cable Samples


Figure 5 and 6:
Training Center – Network Facilities
7.8.19.7 - Energex
Safety
Training / Safety Training
People
Improving safety is a key focus area for Energex, which is driven by the company CEO. The company has embarked upon a system wide effort to change their safety culture. In the recent past, Energex had experienced three safety incidents, resulting in worker injuries. The company is hoping to leverage the emotion from those events as a driver for changing the safety culture.
Energex has established a safety management system, which is a comprehensive framework that guides their safety approach, and addresses strategies for managing the hazards and risk associated with the design, construction, operation and maintenance of the system. Strategies such as their approach to safety training, incident investigation and response, and emergency preparedness and response, are guided by this framework.
Energex has recently reorganized their safety organization, consolidating a corporate safety group, a Service Delivery safety group, and a Power Plant Safety group to form one safety organization.
Process
Energex conducts certain statutory required training such as switchboard rescue (a training that focuses on how to rescue an employee who makes electrical contact while working in a low-voltage switchboard, such as those used on the low-voltage side of a medium-voltage substation, or located within a mini-pillar), confined space training, and asbestos training. Work leaders receive a one day training session in safety leadership, but a skills-based leading safety program is under development.
Safety training includes practices for dealing with lead conductors. While Energex is shifting to XLPE cabling, it still works routinely with lead (PILC cables within Brisbane). The company has established work practices to minimize employee exposure to lead. Example practices include wearing gloves, not smoking at the work site, and not heating the lead to a point where it becomes a dangerous vapor. Energex believes that as long as workers work within the confines of its required practices, they are safe from lead exposure. Employees (jointers) who work with lead receive annual blood tests for lead exposure.
Training Center
People
Energex has a comprehensive training facility called EsiTrain. (EsiTrain is a brand name, meaning Electric Supply Industry Training.) EsiTrain, a part of Energex, is a registered training organization. This means that Energex must conform with requirements of the Australia Qualifications Framework (AQF) in order to remain a registered training organisation, which allows them to issue a qualification to a trainee. This qualification is recognized throughout Australia and is “fully transportable.” So, an employee who receives a qualification as a cable jointer from EsiTrain would be recognized as a cable jointer outside of Energex.
EsiTrain offers the following two types of training:
Training that gives a qualification (conforms to the AQF), and training that is enterprise specific; that is, required by Energex, and beyond what is required by the AQF (e.g., work practice on accessing a confined space in the CBD network underground system).
The AQF provides a framework that describes “what” an employee must be able to do to achieve a certain qualification. EsiTrain delivers training that provides the “how” to perform the work.
Process
The training is based on Energex’s work practices, which are defined by the Work Practices group, and are well documented. EsiTrain works closely with company SMEs within the Work Practices group (and other areas), and company operating advisory committees (OACs) to build the detailed training curricula. For example, Energex has a work practice for preparing a cable joint. This work practice is written at a level of detail appropriate for a cable jointer who already has the underpinning skills associated with preparing a joint. EsiTrain instructional designers take the information from the work practice and develop it into a training course for apprentices and tradespersons by adding the underpinning knowledge that is required to prepare and complete a cable joint.
The work practices group also decides whether the work practice or task is something for which an employee must demonstrate competency, and if that competency needs to be periodically reviewed. High risk tasks may require frequent refreshers to renew competency, while lower risk tasks may only require a one-time training.
The EsiTrain team also factors in regulatory requirements in developing the training, much of these coming from the two following sources:
The Electrical Safety Legislation
The Electrical Safety Office administers and implements the electrical safety legislation and handles licensing, policing, and proof of the current employee competency and skills. It legislates what competencies in which employees must be proficient. It requires that employees are licensed, and that Energex can show proof of employee competency and currency.
Work place health and safety requirements (internal or external)
The Work Place Health and Safety group requires that Energex has a safe system of work. The Energex safe system of work provides input into which safety training employees should receive, such as training on proper PPE, for example. EsiTrain has experienced resources that serve as trainers located on site at their training facility. The backgrounds of the training positions vary, but they are normally filled by personnel with long term experience working for Energex.
For highly specialized training, Energex may engage the services of an external provider to conduct training. For example, Energex may hire Pirelli Cable to instruct cable jointers on the preparation of a large transmission joint.
Energex believes there is much consistency, validity and reliability in the training that is offered. Energex acknowledges that a challenge for the company is to ensure that any changes it incorporates into the training make sense operationally. The company addresses this by a range of actions including regular meetings with the operational business, embedment of the training group within the operational business and field rotations for technical trainers. This ensures the training staff understands the business needs and that the training meets expectations. Interfacing with OACs is a key step in assuring that business needs are satisfied in the training.
Technology
The EsiTrain facility itself is comprehensive, with various hands-on training facilities for overhead and underground distribution and transmission facilities (see Figure 1 through Figure 10).

Figure 1:
EsiTrain facility

Figure 2:
EsiTrain facility - SF6 switchgear training area


Figure 3 and 4:
ESITrain facility - cable jointing instruction

Figure 5:
ESITrain facility - cable jointing instruction

Figure 6:
EsiTrain facility. Left side - low-voltage switchboard training area. Right side - pole top termination practice area

Figure 7:
EsiTrain facility Manhole of PIT practice area. The dimensions of the work enclosure match the dimensions of a typical pit. Note the cable racks on the right side. Jointers practice assembling joints in this confined space

Figure 8:
EsiTrain facility EsiTrain facility - overhead training yard. Parts are energized and parts are de-energized.

Figure 9:
EsiTrain facility EsiTrain facility - underground training yard. (Under the pavilion)

Figure 10:
Indoor training facility at Energex
7.8.19.8 - ESB Networks
Safety
Safety Training
People
ESB Networks has a Technical Training Centre, located in Portlaiose, which is about a one-hour drive outside of Dublin. This center provides training services for all of ESB Networks, including all technical training associated with the line worker craft, operations training, and training on equipment commissioning.
The technical training center develops and delivers training based on the needs of the organization, including LV, MV, and HV training, in areas including overhead line work (see Figure 1), cable work, HV substations, metering, driver training, and new equipment commissioning. (For example, it includes training on commissioning new automatic reclosers being installed as part of ESN Network’s distribution automation scheme.) The scope of training offered is driven by the training demand from around the ESB Networks system.

Figure 1:
Training yard – overhead section
The center is staffed by approximately 12 training officers who deliver training in the various subjects offered at the center. The center also employs an information technology specialist, who both delivers training himself and supports other training initiatives associated with information technology.
In addition to the staff located at the Technical Training Centre, ESB Networks has three apprentice Training Coordinators located throughout ESB Networks.
Technology
The center itself consists of an indoor training hall, 11 classrooms, a cable workshop, HV testing laboratories, as well as physical representations of LV MV and HV equipment located in a training yard (see Figures 2 through 4). The yard has both a dead system, and a live system, where ESB Networks can train employees in working on voltages up to 48 kV. The training yard also consists of three mock stations, including an urban and rural station.

Figure 2:
MV substation training yard

Figure 3:
Training yard, UG junctions, top view

Figure 4:
Training yard, UG junctions, side view
7.8.19.9 - Georgia Power
Safety
Safety Training
People
Organizationally, Georgia Power field resources that construct, maintain, and operate the network infrastructure fall within the Network Underground group, a central organization that is responsible for all network infrastructures, led by a manager. The Network Underground group is responsible for network underground infrastructure throughout the state of Georgia, including Atlanta, Athens, Macon, Savannah, and Valdosta. The Network Underground group is responsible for all of the manhole and duct line systems at GA Power, both network and non-network.
The Network Underground group consists of Test Engineers, Cable Splicers, Duct Line Mechanics, Civil Construction Engineers (for design and supervision), Test Technicians, Winch Truck Operator (WTOs), and Light Equipment Operators.
Cable Splicers perform work with the electrical infrastructure such as making up joints and terminations, including preparing lead splices. Cables splicers also pull cable and operate network equipment.
Duct Line Mechanics perform the civil aspects of the work, including duct line, manhole and vault construction. Duct Line Mechanics may also pull cable.
Process
Both the Cable Splicer and Duct Line job groups have a three-year job progression to achieve journeyman status. Both job families require a combination of time, on the job training, formal training and testing to advance. Training, broken into six-month modules, is delivered at the Georgia Power Network Underground training center, and taught by senior personnel. Each module has three-weeks of classroom training and requires extensive on-the-job training (OJT) to reinforce the skills presented in the formal training.
As a part of formal training, Apprentices must pass a test at the end of each six-month module before proceeding to the next level. Apprentices have two opportunities to pass each test. Apprentices receive a salary increase as they pass each level.
If an employee advances to Senior Duct Line Mechanic and wants to switch to Cable Splicer, he must go back through the three-year cable program and pass the apprentice program for a cable splicer. Georgia Power employs many more Cable Splicers than Duct Line Mechanics. The more popular job progression within the company is to move from a WTO to the Cable Splicer apprenticeship (more popular than the Duct Line Mechanic Apprenticeship, even though these positions pay about the same.) Note that the cable splicer job family is more technical than is the duct line mechanic family, and therefore requires more technical training, both formal and OJT.
The Network Underground group exposes apprentices to as many OJT tasks as possible. For example, the group will assign an apprentice with a Senior Cable Splicer to perform a particular task such as the preparation of a straight lead splice. Each Apprentice has an OJT book that contains a checklist of the various tasks that are required. The apprentice’s supervisor must sign and date the OJT checklist when the Apprentice has worked on a particular task. There are some tasks that are not formally part of the training program, but that the network underground leadership expects the apprentices to accomplish during their OJT. One such task is the proper racking of a manhole. It is the apprentice’s responsibility to ensure his supervisor signs and dates completed tasks in the OJT booklet.
Advancement is based on formal training and testing, not on completion of the OJT booklet; the supervisor can make arrangements to ensure each Apprentice receives the appropriate OJT tasks, whenever possible. Formal training often includes hands-on tasks, such as cable splicing. For example, two supervisors can evaluate an Apprentice’s splice and determine whether the apprentice prepared the splice correctly, examine the measurements, and make sure the splice meets Network Underground group specifications. Eventually, throughout the three-year program, these OJT tasks are completed.
Technology
Much of the formal training associated with the advancement to the Journeyman level for Cable Splicers and Duct Line Mechanics is performed at the Georgia Power Network Underground training facility in Atlanta (See Figure 1 through Figure 4.).

Figure 1:
Training Center – Network Unit. Note cutaway of termination chamber

Figure 2:
Training Center – Joint assembly practice area

Figure 3:
Training Center – Full size manhole

Figure 4:
Training Center – Termination assemble practice area
All Apprentices, as well as other Georgia Power employees, receive a number of safety-related courses, such as manhole entry, rescue, CPR, and storm emergency drills.
7.8.19.10 - National Grid
Safety
Safety Training
People
National Grid has two New York training centers, located in Schenectady and Syracuse.
National Grid has technical trainers who run formal training for Cable Splicers and Maintenance Mechanics.
National Grid’s Work Methods representatives work closely with field resources on training issues (see Work Methods).
Process
Employees receive a formal training book upon entering the cable splicer or maintenance mechanic job families and as they progress through the levels to journeyman.
For example, new hires into the program will receive required training such as CPR and first aid. After entering the Splicer school, for example, employees will receive formal training at the training centers as required. (See Job Progression for more information).
All positions start as a Helper for six months. Following this term, candidates take a review exam to determine if they are eligible to progress in the program. Employees can enter either the Cable Splicer program, or the Maintenance Mechanic program.
Each training school session (A, B, & C) is ten days long, typically held in Syracuse, NY. In addition, formal training classes are provided periodically throughout the progression series, such as network protector diagnostics (three days), safety training, etc. All field employees also participate in four days of Annual Expert Training in Schenectady, NY, regardless of their progression status (Helper through Supervisor).
Technology
The formal training Cable Splicers includes courses such as:
Cable Splicer A Training
-
Safety
-
Work area protection
-
Enclosed space training
-
Tools
-
Test equipment
-
Troubleshooting streetlights
-
Cable, joints and terminations
-
Hoisting and rigging
-
Electrical symbols
Cable Splicer B training
-
Safety
-
Dig Safe
-
Transformer theory
-
Rotation testing
-
Network system presentation
-
Pin pointer
-
Cable joints and terminations
Cable Splicer C training
-
Safety
-
Test equipment
-
Transformers
-
MOV arrestor’s
-
Corrosion
-
Tags
-
One line diagrams
-
Forms
-
Failure paths and causes
-
Clearance and control
-
Cable joints and terminations
Additionally, Cable Splicers receive a number of other safety and environmental related courses, including lead awareness and manhole entry and rescue.
National Grid has two training centers that contain classrooms and field equipment used for underground training. One is in Syracuse, NY, and one in Milbury, MA. Most training for UG NYE is held in Syracuse. In addition, Annual Expert Training and some miscellaneous training is conducted at the training center in Schenectady, NY.
7.8.19.11 - PG&E
Safety
Safety Training
People
PG&E has a well-equipped training center located at Livermore, home to all formal training of field personnel. For example, the formal training required for progression in the Cable Splicer family (known as the PG&E Academy) is conducted at the Livermore facility. In addition, they have a learning center located in San Ramon, which hosts some classroom-based training.
PG&E has technical trainers, who run the PG&E Academy for Cable Splicers,
PG&E’s Senior Distribution Specialists work closely with field resources on training issues (see Senior Distribution Specialist). The senior distribution specialist focused on underground maintains an office at the Livermore training center.
Process
The formal training associated with the PG&E Academy for apprentice cable splicers includes courses such as:
-
Introduction to Cable Splicing.
- Focuses on PILC cables and teaches the duties of the helper. Content includes manhole safety, job setup, the use of construction manuals and the PG&E Technical Information library (an on line system for accessing technical references), work procedures, and tools. Safety and quality are emphasized and participants must demonstrate the ability to build a lead splice, including using a spilt connector, wiping, and soldering. Students must pass written and practical tests.
-
Beginning Lead Splicing
- This course revisits the teachings from the Introduction to Cable Splicing course, and requires participants to build six major projects of increasing complexity selected by the course supervisor. This particular course is very hands on.
-
Intermediate Lead
- This course focuses on safety and revisits some of the teachings from prior courses. This course includes content on basic electricity, transformers, banking transformers, etc. It is a more theoretical course and less hands-on than prior courses.
-
Advanced Lead Training
- At this point, participants will have from 2 to 2 ½ years of training and experience. This course takes a step back and looks at the big picture. It includes content about the overall electrical system, various system configurations, fault indication, performing fault location including the process for thumping cable, as well as requiring the completion of a complicated splice.
-
Underground Fundamentals
- This course is provided to both Cable Splicers and Linemen. It focuses on non-lead cables and splices. It includes discussion of pre-molded splices, the function of stress cones, fault finding, cable spiking, grounding, and working with secondary. It is a “back to basics” course, even though it is offered later in the progression for cable splicers. Safety and quality are emphasized.
In addition to these courses, cable splicer apprentices receive a number of safety related courses, including lead exposure and confined space entry.
Technology
PG&E’s Livermore training center is well equipped, containing both classrooms, and field equipment used for hands on training of field personnel.
At the time of the EPRI practices immersion, PG&E was in the process of rebuilding the underground training yard both energized and non-energized portion.
Below are some pictures of the training center.


Figure 1 and 2:
Training Center

Figure 3:
Training Center – Cable Racks


Figure 4 and 5:
Training Center – UG Switch

Figure 6:
Training Center – Classroom


Figure 7 and 8:
Training Center – UG Yard
7.8.19.12 - Portland General Electric
Safety
Safety Training
People
PGE uses a combination of on-the-job learning, formal training courses, drills, and computer training to ensure that employees have the knowledge they need and meet safety compliance requirements.
Process
Compliance training includes vault rescue, pole top rescue, and all other federally mandated training.
The vault rescue class is a company-wide training undertaken annually, and workers train in a shallow vault that does not always resemble the deeper network vaults. Accordingly, the CORE may augment this training with more specific vault rescue training geared to the network vaults, which would take place in a live vault because they do not have a deep test vault. PGE also provides annual computer-based training on confined space practices.
The Portland Service Center (PSC) brings in an external vendor to give lead and asbestos training, as needed.
PGE has invested in the documentation of safe work practices in the form of laminated sheets and notes for certain work/tasks, and it plans to expand this concept to include work practices specific to the CORE.
Fire Department Training: PGE periodically coordinates with the Portland Fire Department (PFD) for training, covering actions to take if there is a fire in a vault or manhole. In the past, PGE ran exercises on a yearly basis with the PFD, and it intends to reestablish these. If a vault rescue is needed, the Portland Fire Department (PFD) utilizes their own rescue equipment. The PFD’s response time is good because it operates from locations across the downtown area.
Emergency Drills: PGE conducts system-wide outage restoration drills once a year, prior to the fall storm season. In the past, this included some scenarios that involved the CORE network system. For example, a recent drill was substation-centric, and the tested scenarios simulated the outage of one of the stations supplying the network.
PGE also conducts annual earthquake drills, which are tabletop exercises organized by the Business Continuity Group. These drills do not always involve the network depending on the scenario chosen.
PSC has no written guidelines specifically related to unforeseen events occurring on the network.
During an emergency, PGE follows the principals of the incident command system (ICS) at the management level.
Overhead Training:
The CORE journeymen, who work almost exclusively with urban underground systems day to day, are required to support restoration work on the overhead system when needed. In restoration, they generally work in two-man crews addressing wire-down situations. In order to reinforce these skills, the CORE group conducts annual training on overhead systems in a de-energized training yard, where it reviews various overhead line work scenarios.
7.9 - Survey Results
7.9.1 - 2009 Survey Results
7.9.1.1 - Summary - Overview
Survey Title : Urban Network Practices Inventory, 2009
Summary Overview Questions 1.1 - 1.10 General/Physical Questions 2.1 - 2.6 Planning Questions 3.1 - 3.14 Design Questions 4.1 - 4.14 Construction Questions 5.1 - 5.14 Maintenance Questions 6.1 - 6.39 Operations Questions 7.1 - 7.19 Safety Questions 8.1 - 8.11 Distributed Generation Questions 9.1 - 9.6 Practices of Note Questions 10.1
Question 1.2: Utility Type?

Question: 1.7: Total number of electrical customers served (Total Company)?

Question 1.8: Total number of customers served by Urban Networks Systems?

Question 1.9: Annual network load growth (%)?

Question 1.10: Total Approximate Peak Network load (MW)?

7.9.1.2 - Summary - Physical/General
Survey Title : Urban Network Practices Inventory, 2009
Summary Overview Questions 1.1 - 1.10 General/Physical Questions 2.1 - 2.6 Planning Questions 3.1 - 3.14 Design Questions 4.1 - 4.14 Construction Questions 5.1 - 5.14 Maintenance Questions 6.1 - 6.39 Operations Questions 7.1 - 7.19 Safety Questions 8.1 - 8.11 Distributed Generation Questions 9.1 - 9.6 Practices of Note Questions 10.1
Question 2.1: What is the number of distinct conventional secondary networks (segregated street grids) served at your company?


Question 2.2: How many feeders make up the preferred network feeder group?

Question 2.3: What is the number of spot networks served at your company? (“Spot network” in this question defined as a service to a facility from a single vault and a common secondary bus without connection to the street grid)


Question 2.4: Network primary operating voltage(s)?

Question 2.5: Primary cable types? (Check all that apply)

Question 2.6: Number of network distribution transformers?


7.9.1.3 - Planning
Survey Title : Urban Network Practices Inventory, 2009
Summary Overview Questions 1.1 - 1.10 General/Physical Questions 2.1 - 2.6 Planning Questions 3.1 - 3.14 Design Questions 4.1 - 4.14 Construction Questions 5.1 - 5.14 Maintenance Questions 6.1 - 6.39 Operations Questions 7.1 - 7.19 Safety Questions 8.1 - 8.11 Distributed Generation Questions 9.1 - 9.6 Practices of Note Questions 10.1
Question 3.1: Do you have a distinct Network Planning group, or is network planning performed by a general planning organization?

Question 3.2: How many people perform network planning at your company?

Question 3.3: To what level of contingency do you plan your network?

Question 3.4: In your typical network design, do all primary feeders sourcing a given network originate from the same substation, or do you source networks from multiple stations?

Question 3.5: Are network primary feeders planned and designed as dedicated feeders?

Question 3.6: Does your design limit the number of primary feeders entering a vault through a given single duct bank?

Question 3.7: Do you have any current plans to expand the size of your network? (Increase the footprint of the territory served by the network)

Question 3.8: Which of the following best describes your approach to loading your network? (Please check one box only)

Question 3.9: Do you have any network “system hardening” initiatives underway?

Question 3.10: Do you use software to perform network circuit analysis? (Load flow studies, voltage drop analysis, etc)

Question 3.11: If Yes, are you using the software for..?

Question 3.12: Does the same engineer(s) who analyzes the primary system also analyze the secondary system?

Question 3.13: Do you calculate minimum available fault current at the fringes of the street secondary network cables (208Y/120 V) to assure self-clearing of street network cable failures?

Question 3.14: If you are using load flow software, please indicate which software product(s) you are using.

7.9.1.4 - Design
Survey Title : Urban Network Practices Inventory, 2009
Summary Overview Questions 1.1 - 1.10 General/Physical Questions 2.1 - 2.6 Planning Questions 3.1 - 3.14 Design Questions 4.1 - 4.14 Construction Questions 5.1 - 5.14 Maintenance Questions 6.1 - 6.39 Operations Questions 7.1 - 7.19 Safety Questions 8.1 - 8.11 Distributed Generation Questions 9.1 - 9.6 Practices of Note Questions 10.1
Question 4.1: Do you have a dedicated / distinct network design group? Or are your network designers part of a design group that also performs non network design?

Question 4.2: If yes, does your network design group do both electrical and civil designs?

Question 4.3: How many people perform Network Design at your company?

Question 4.4: Does your network utilize vaults located:

Question 4.5: What type of design are you using for new civil structures such as manholes and vaults?

Question 4.6: If your network utilizes subsurface vaults, do you use automatic sump pumps to clear water accumulation?

Question 4.7: If Yes, does your standard design call for oil sensors on sump pumps in vaults that house oil containing equipment?

Question 4.8: If yes, do these sensors function to prevent the pumping of oil into the street?

Question 4.9: Do you require a firewall between two pieces of equipment in one vault? (example, between two network transformers)

Question 4.10: In a building vault, do you tie your neutral in with the building steel / ground system?


Question 4.11: Does your typical network design utilize: (see Graph below)


Question 4.12: Does your network transformer specification call for a one or two chamber design for the primary termination and switch?


Question 4.13: Have you incorporated skid free vault and manhole covers into your civil designs?

Question 4.14: If so, are you retrofitting older existing covers?

7.9.1.5 - Construction
Survey Title : Urban Network Practices Inventory, 2009
Summary Overview Questions 1.1 - 1.10 General/Physical Questions 2.1 - 2.6 Planning Questions 3.1 - 3.14 Design Questions 4.1 - 4.14 Construction Questions 5.1 - 5.14 Maintenance Questions 6.1 - 6.39 Operations Questions 7.1 - 7.19 Safety Questions 8.1 - 8.11 Distributed Generation Questions 9.1 - 9.6 Practices of Note Questions 10.1
Question 5.1: Do you have a distinct field group focused on the construction, maintenance and operation of the network? Or are your field workers part of a group that also works with non network systems?

Question 5.2: Total number of Network field electrical workers (do not count “civil” workers)

Question 5.3: Do you contract any network electrical (not civil) construction work?

Question 5.4: If using contractors, what % of your total network electrical work is contracted?

Question 5.5: Total number of Network civil construction workers

Question 5.6: Do you contract any network civil construction work?

Question 5.7: How many hours of training (on average, per person) does your field force receive in a year?

Question 5.8: Do you routinely conduct post construction audits to ascertain / assure the quality of the construction?


Question 5.9: Do you have a formal process for reporting construction standards or material specifications deficiencies?


Question 5.10: Do you have a process for inspecting or testing incoming network materials?


Question 5.11: Do you utilize Mobile Data Units in your network fleet?

Question 5.12: If so, what system are you using?

Question 5.13: Do you utilize work management software to assist in assigning resources, scheduling, and managing the execution of network projects?

Question 5.14: What work management system are you using?

7.9.1.6 - Maintenance
Survey Title : Urban Network Practices Inventory, 2009
Summary Overview Questions 1.1 - 1.10 General/Physical Questions 2.1 - 2.6 Planning Questions 3.1 - 3.14 Design Questions 4.1 - 4.14 Construction Questions 5.1 - 5.14 Maintenance Questions 6.1 - 6.39 Operations Questions 7.1 - 7.19 Safety Questions 8.1 - 8.11 Distributed Generation Questions 9.1 - 9.6 Practices of Note Questions 10.1
Question 6.1: Do you have regularly scheduled maintenance and inspection program(s) for your network system?

Question 6.2: In determining your maintenance frequency, do you perform a risk assessment of your individual equipment, manholes, vaults, etc and vary your maintenance approach based on that risk?


Question 6.3: Do you have a documented, up to date maintenance guidelines for performing maintenance on network equipment? (Example: network transformer maintenance guideline)

Question 6.4: Do you have metrics in place to assess the performance of the network system?


Question 6.5: Is network maintenance, inspection and testing performed by (Check One)?

Question 6.6: If using contractors, what % of your total network maintenance work is contracted?

Question 6.7: Do you regularly perform primary cable diagnostic testing?

Question 6.8: If yes, what is the frequency of cable diagnostic testing?

Question 6.9: In what applications will you perform cable diagnostic testing?


Question 6.10: If yes, please indicate / describe what testing techniques you use.


Question 6.11: If you perform withstand testing, describe how you determine which cables to test.


Question 6.12: When testing cable, what are the expected leakage currents that you would expect to see for healthy cables?

Question 6.13: Do you regularly perform Vault inspections?

Question 6.14: If yes, what is the frequency of the Vault inspections?

Question 6.15: Do you regularly perform Manhole inspections?

Question 6.16: If yes, what is the frequency of the Manhole inspections?

Question 6.17: Do you regularly perform Primary cable and splice / connection infrared inspections?

Question 6.18: If yes, what is the frequency of Infrared testing?

Question 6.19: Do you regularly perform secondary cable and splice / connection infrared inspections?

Question 6.20: If yes, what is the frequency of secondary infrared testing?

Question 6.21: Do you regularly perform Secondary / Grid cable testing?

Question 6.22: If yes, what is the frequency of secondary cable / grid testing?

Question 6.23: If yes, please indicate / describe what testing techniques you use.

Question 6.24: Do you perform heat gun checks as part of your preventive maintenance programs?


Question 6.25: Do you perform cable limiter continuity checks as part of your preventive maintenance program?


Question 6.26: Do you perform Equipment Fluid sampling and testing (such as transformer oil) as part of your maintenance?

Question 6.27: If yes, what is the frequency of sampling?

Question 6.28: If yes, please indicate which tests you perform


Question 6.29: If you perform analysis of fluid samples, what trigger level or criteria are used to determine when:

Question 6.30: Do you regularly perform pressure testing to identify leaks in the primary termination chamber, ground switch chamber, and/or transformer tank?

Question 6.31: If yes, what is the frequency of testing?

Question 6.32: Do you regularly perform Network protector maintenance and testing?

Question 6.33:If yes, what is the frequency of testing?

Question 6.34: When you perform Network Protector maintenance, please indicate which of the following you do. (See graph below)


Question 6.35: Does your NP maintenance include conducting periodic “drop tests”, whereby a primary feeder is opened, and measurements are taken for back feed voltage to assure that the network protectors function correctly (automatically open)?


Question 6.36: Do you use a diagnostic camera to ascertain the condition of ducts and conduits?

Question 6.37: Please list any other routine network maintenance or inspections you are performing, and provide the frequency.

Question 6.38: Are you currently implementing replacement programs for any of your network equipment?

Question 6.39: If Yes, Please indicate which equipment is being replaced.


7.9.1.7 - Operations
Survey Title : Urban Network Practices Inventory, 2009
Summary Overview Questions 1.1 - 1.10 General/Physical Questions 2.1 - 2.6 Planning Questions 3.1 - 3.14 Design Questions 4.1 - 4.14 Construction Questions 5.1 - 5.14 Maintenance Questions 6.1 - 6.39 Operations Questions 7.1 - 7.19 Safety Questions 8.1 - 8.11 Distributed Generation Questions 9.1 - 9.6 Practices of Note Questions 10.1
Question 7.1: Do you have a dedicated operator within your control room for operating the network?

Question 7.2: Do you remotely sense / monitor information about network devices beyond the primary feeder substation breaker?

Question 7.3: If you remotely monitor information about network devices, please indicate what information you are monitoring. (Check all that apply)


Question 7.4: If you are using remote sensors, briefly describe what type of sensing device(s) you are using.

Question 7.5: If you are using remote sensing, how is the information communicated? (check all that apply)


Question 7.6: If you are remotely monitoring information about network equipment beyond the primary feeder breaker, is this information tied in with your SCADA System?

Question 7.7: Do you have the ability to remotely control switches, network protectors or other devices on your network system primary beyond the substation breaker?

Question 7.8: If so, what devices are remotely controlled?

Question 7.9: If you do remotely control devices, indicate from which location(s)you have the ability to do so.


Question 7.10: If you are remotely monitoring and/or controlling network equipment, what vendor/system are you using?

Question 7.11: Do your company’s periodic outages drills normally include network situations?


Question 7.12: If not, do you routinely conduct drills for key network processes such as emergency response?

Question 7.13: Do you have documented, up to date procedures for responding to network emergencies?


Question 7.14: Do you have a procedure that provides guidance in responding to vault fires?

Question 7.15: If so, does it provide guidance to an Operator indicating when it is necessary to de-energize a network due to the emergency?

Question 7.16: Do you have a means to do a group feeder pickup in the event of a network outage? (Multiple feeders)


Question 7.17: Do you use separable connectors (such as “T” Bodies and elbows) in your network system?


Question 7.18: Have you experienced failures with these connectors / connector systems (such as 600A T - bodies)?

Question 7.19: If Yes, please rank the primary causes of the failures you’ve experienced.

7.9.1.8 - Safety
Survey Title : Urban Network Practices Inventory, 2009
Summary Overview Questions 1.1 - 1.10 General/Physical Questions 2.1 - 2.6 Planning Questions 3.1 - 3.14 Design Questions 4.1 - 4.14 Construction Questions 5.1 - 5.14 Maintenance Questions 6.1 - 6.39 Operations Questions 7.1 - 7.19 Safety Questions 8.1 - 8.11 Distributed Generation Questions 9.1 - 9.6 Practices of Note Questions 10.1
Question 8.1: How many days per year of safety training do your network field personnel receive per person?

Question 8.2: Please indicate the type(s) of safety meetings you conduct. Check all that apply.

Question 8.3: Do you have a “safety person”, (either a fulltime safety professional, or other employee assigned to a safety role) focused on the network?

Question 8.4: If you have a safety person focusing on the network, is this person a full time safety professional, or another employee assigned to a safety role?

Question 8.5: Do you require your network crews to wear flame retardant (FR rated) clothing?

Question 8.6: If so, what clothing system level is required to work in the network (routine work)?

Question 8.7: Do you require incremental face protection, such as a face shield, or goggles and balaclava when working in the network?


Question 8.8: Is a first aid kit on hand when a crew is working in a vault?

Question 8.9: What procedures / tools do you use to determine that a cable is de energized?

Question 8.10: Do you use continuous air quality monitoring when working in a Manhole? Vault?


Question 8.11: Do you require the use of a lifting crane and worker harnesses when working in an Underground Manhole? Underground Vault?


7.9.1.9 - Distributed Generation
Survey Title : Urban Network Practices Inventory, 2009
Summary Overview Questions 1.1 - 1.10 General/Physical Questions 2.1 - 2.6 Planning Questions 3.1 - 3.14 Design Questions 4.1 - 4.14 Construction Questions 5.1 - 5.14 Maintenance Questions 6.1 - 6.39 Operations Questions 7.1 - 7.19 Safety Questions 8.1 - 8.11 Distributed Generation Questions 9.1 - 9.6 Practices of Note Questions 10.1
Question 9.1: Do you allow inverter based generation to connect to the 208Y/120-volt area network?

Question 9.2: Do you allow induction generators to connect to the 208Y/120-volt area network?

Question 9.3: Do you allow synchronous generators to connect to the 208Y/120-volt area network?

Question 9.4: If you do allow distributed generators to connect to your network, do you have a written guideline that defines the interconnection requirements?

Question 9.5: Do you allow time delay tripping of network protectors that are supplying 208Y/120-volt area networks?

Question 9.6: Are there any administrative codes, rules, regulations, etc established by Public Utility Commissions, Boards of Public Utilities, etc. that cover the connection of co generation to area networks in your service territory?


7.9.1.10 - Practices of Note
Survey Title : Urban Network Practices Inventory, 2009
Summary Overview Questions 1.1 - 1.10 General/Physical Questions 2.1 - 2.6 Planning Questions 3.1 - 3.14 Design Questions 4.1 - 4.14 Construction Questions 5.1 - 5.14 Maintenance Questions 6.1 - 6.39 Operations Questions 7.1 - 7.19 Safety Questions 8.1 - 8.11 Distributed Generation Questions 9.1 - 9.6 Practices of Note Questions 10.1
Question 10.1: How many days per year of safety training do your network field personnel receive per person?

7.9.2 - 2012 Survey Results
7.9.2.1 - Summary - Overview
Survey Title: Urban Network Practices Inventory, 2012
Summary Overview Questions 1.2 & 1.7-1.13 General/Physical Questions 2.1 - 2.11 Planning Questions 3.1 - 3.21 Design Questions 4.1 - 4.21 Construction Questions 5.1 - 5.13 Maintenance Questions 6.1 - 6.35 Operations Questions 7.1 - 7.14 Safety Questions 8.1 - 8.11 Distributed Generation Questions 9.1 - 9.12 Practices of Note Questions 10.1
Question 1.2: Utility Type?

Question 1.7: Total number of electrical meters served (Total Company)?

Question 1.8: Total number of customers served by Urban Networks Systems?

Question 1.9: Annual network load growth (%)?

Question 1.10: Total approximate Peak network load (MW)?

Question 1.11: Total installed capacity of your network (MVA)?

Question 1.12: Average primary circuit loading under no contingencies? (In percent of circuit rating)

Question 1.14: Average primary circuit loading under the worst contingency that is planned for? (Percent of circuit rating)

7.9.2.2 - Summary - Physical/General
Survey Title: Urban Network Practices Inventory, 2012
Summary Overview Questions 1.2 & 1.7-1.13 General/Physical Questions 2.1 - 2.11 Planning Questions 3.1 - 3.21 Design Questions 4.1 - 4.21 Construction Questions 5.1 - 5.13 Maintenance Questions 6.1 - 6.35 Operations Questions 7.1 - 7.14 Safety Questions 8.1 - 8.11 Distributed Generation Questions 9.1 - 9.12 Practices of Note Questions 10.1
Question 2.1: Total number of network feeders?

Question 2.2: What is the number of distinct conventional secondary networks (segregated street grids) served at your company?

Question 2.3: Total Number of Network groups?

Question 2.4: How many feeders make up the network feeder group?

Question 2.5: Total number of network distribution transformers?


Question 2.6: What is the number of spot networks served at your company? (“Spot network” in this question defined as a service to a facility from a single vault and a common secondary bus without connection to the street grid)


Question 2.7: How many feeders (minimum) supply your spot networks?

Question 2.8: Network primary operating voltages(s)? (Check all that apply)

Question 2.9: Please indicate the percentage of each cable type that comprise your network primary cable system (Total should equal 100%)


Question 2.10: For primary cable, which of the following do you utilize (current standards)? check all that apply

Question 2.11: Do you use low smoke zero halogen cable in your secondary?

7.9.2.3 - Planning
Survey Title: Urban Network Practices Inventory, 2012
Summary Overview Questions 1.2 & 1.7-1.13 General/Physical Questions 2.1 - 2.11 Planning Questions 3.1 - 3.21 Design Questions 4.1 - 4.21 Construction Questions 5.1 - 5.13 Maintenance Questions 6.1 - 6.35 Operations Questions 7.1 - 7.14 Safety Questions 8.1 - 8.11 Distributed Generation Questions 9.1 - 9.12 Practices of Note Questions 10.1
Question 3.1: Do you have a distinct Network Planning group, or is network planning performed by a general planning organization?

Question 3.2: To what level of contingency do you plan your network?

Question 3.3: In your typical network design, do all primary feeders sourcing a given network originate from the same substation, or do you source networks from multiple stations?

Question 3.4: Are network primary feeders planned and designed as dedicated feeders?

Question 3.5: Do switch points exist on your network primary feeders for the purpose of sectionalizing a network feeder?

Question 3.6: Do your network primary feeders have tie points with other network feeders?

Question 3.7: If sectionalizing or tie points are installed on your network system, what kind of switches are you using?

Question 3.8: If sectionalizing or tie points are installed on your network system, are the switches manually or automatically controlled?

Question 3.9: Does your design limit the number of primary feeders entering a vault through a given single duct bank?

Question 3.10: In your design, do you allow primary and secondary routed through the same duct bank?

Question 3.11: Are you currently actively planning to increase, decrease, or maintain the geographical size of your network?

Question 3.12: Which of the following best describes your approach to loading your network? (Please check one box only)

Question 3.13: Do you have any network “system hardening” initiatives underway? (for example, rebuilding manholes in flood prone areas, rehabbing deteriorated ceilings, etc.)

Question 3.14: Have you developed any reliability metrics for assessing the performance of the network system?

Question 3.15: Do you use software to perform network circuit analysis? (Load flow studies, voltage drop analysis, etc.)

Question 3.16: If Yes, are you using the software for; • Primary Analysis Only • Secondary Analysis Only • Both Primary and Secondary Analysis

Question 3.17: If you are using load flow software, please indicate which software product(s) you are using.

Question 3.18: How do you collect network load data for modeling purposes?

Question 3.19: Do you perform contingency analysis; that is, review loading and voltage with each feeder out of service?

Question 3.20: In your network system analysis, do you model operation of NP’s due to reverse flows in your system?

Question 3.21: Do you calculate minimum available fault current at the fringes of the street secondary network cables (208Y/120 V) to assure self-clearing of street network cable failures?

7.9.2.4 - Design
Survey Title: Urban Network Practices Inventory, 2012
Summary Overview Questions 1.2 & 1.7-1.13 General/Physical Questions 2.1 - 2.11 Planning Questions 3.1 - 3.21 Design Questions 4.1 - 4.21 Construction Questions 5.1 - 5.13 Maintenance Questions 6.1 - 6.35 Operations Questions 7.1 - 7.14 Safety Questions 8.1 - 8.11 Distributed Generation Questions 9.1 - 9.12 Practices of Note Questions 10.1
Question 4.1: Do you have a dedicated / distinct network design group? Or are your network designers part of a design group that also performs non network design?

Question 4.2: If yes, does your network design group do both electrical and civil designs?

Question 4.3: Does your network utilize vaults located:

Question 4.4: What type of design are you using for new civil structures such as manholes and vaults? Check all that apply.

Question 4.5: What is the size of a typical network vault (new design?)

Question 4.6: If your network utilizes subsurface vaults, do you use automatic sump pumps to clear water accumulation?

Question 4.7: If Yes, does your standard design call for oil sensors on sump pumps in vaults that house oil containing equipment?

Question 4.8: If yes, do these sensors function to prevent the pumping of oil into the street?

Question 4.9: Do you require a firewall between two pieces of equipment in one vault? (example, between two network transformers)

Question 4.10: In designing your network vault, what ground resistance do you require from the ground system inside the vault?

Question 4.11: In a building vault, do you tie your neutral in with the building steel / ground system?

Question 4.12: For the primary termination and switch, does your network transformer specification call for a

Question 4.13: Are you using a separately mounted primary switch (not part of the transformer unit)?

Question 4.14: Does your network transformer specification call for units with taps?

Question 4.15: Have you incorporated skid free vault and manhole covers into your civil designs?

Question 4.16: If so, are you retrofitting older existing covers?

Question 4.17: Are you using manhole cover restraints in parts of your system?

Question 4.18: Do you use cable limiters in your network secondary system(s)?

Question 4.19: If you use cable limiters, do you perform a protection coordination study between the NP fuse, cable limiters and the station’s feeder relay?

Question 4.20: If you use cable limiters please indicate where you install them (check all that apply)


Question 4.21: What type of secondary connection technology is used on your networks?

7.9.2.5 - Construction
Survey Title: Urban Network Practices Inventory, 2012
Summary Overview Questions 1.2 & 1.7-1.13 General/Physical Questions 2.1 - 2.11 Planning Questions 3.1 - 3.21 Design Questions 4.1 - 4.21 Construction Questions 5.1 - 5.13 Maintenance Questions 6.1 - 6.35 Operations Questions 7.1 - 7.14 Safety Questions 8.1 - 8.11 Distributed Generation Questions 9.1 - 9.12 Practices of Note Questions 10.1
Question 5.1: Total number of Network field electrical workers (do not count “civil” workers)


Question 5.2: Do you contract any network electrical (not civil) construction work?

Question 5.3: If using contractors, what % of your total network electrical work is contracted?

Question 5.4: Do you contract any network civil construction work?

Question 5.5: If using contractors, what % of your total network civil construction work is contracted?

Question 5.6: Not counting training that is part of your apprentice programs, how many hours of training (on average, per person) does your network field force receive in a year?

Question 5.7: Do you routinely conduct post construction audits to ascertain / assure the quality of the construction?


Question 5.8: If Yes, what are the major items that are assessed during a post construction audit?

Question 5.9: Do you have a process for inspecting or testing incoming network materials?

Question 5.10: If yes, what material is inspected or tested?


Question 5.11: Do you utilize Mobile Data Units in your network fleet?

Question 5.12: Do you use heat resistant / fire proof tape in your network cable systems?

Question 5.13: When you prepare a splice, do you track and record who prepared the splice?


7.9.2.6 - Maintenance
Survey Title: Urban Network Practices Inventory, 2012
Summary Overview Questions 1.2 & 1.7-1.13 General/Physical Questions 2.1 - 2.11 Planning Questions 3.1 - 3.21 Design Questions 4.1 - 4.21 Construction Questions 5.1 - 5.13 Maintenance Questions 6.1 - 6.35 Operations Questions 7.1 - 7.14 Safety Questions 8.1 - 8.11 Distributed Generation Questions 9.1 - 9.12 Practices of Note Questions 10.1
Question 6.1: Do you have a documented, up to date maintenance guidelines for performing maintenance on network equipment? (Example: network transformer maintenance guideline)

Question 6.2: In determining your maintenance frequency, do you perform a risk or condition assessment of your individual equipment, (manholes, vaults, etc), and vary your maintenance approach based on that assessment?


Question 6.3: Is network maintenance, inspection and testing performed by (Check One)?

Question 6.4: If using contractors, what % of your total network maintenance work is contracted?

Question 6.5: In what applications will you perform network primary cable diagnostic testing? (Check all that apply)


Question 6.6: If you are performing periodic primary network cable withstand testing, what is the frequency of the testing?

Question 6.7: Please indicate / describe what testing techniques you use.


Question 6.8: Do you regularly perform Vault inspections?

Question 6.9: If yes, what is the frequency of the Vault inspections?


Question 6.10: Do you regularly perform Manhole inspections?

Question 6.11: If yes, what is the frequency of the Manhole inspections?


Question 6.12: Do you perform Infrared / heat gun checks as part of your preventive maintenance programs?


Question 6.13: Do you regularly perform Primary cable and splice / connection infrared inspections?

Question 6.14: If yes, what is the frequency of Infrared testing?

Question 6.15: Do you regularly perform secondary cable and splice / connection infrared inspections?

Question 6.16: If yes, what is the frequency of secondary infrared testing?

Question 6.17: Do you regularly perform Secondary / Grid cable testing?

Question 6.18: If yes, what is the frequency of secondary cable / grid testing?

Question 6.19: Do you perform cable limiter continuity checks as part of your preventive maintenance program?

Question 6.20: Do you perform Equipment Fluid sampling and testing (such as transformer oil) as part of your maintenance?

Question 6.21: If yes, what is the frequency of sampling?


Question 6.22: If yes, please indicate which of these tests you perform


Question 6.23: Do you regularly perform pressure testing to identify leaks in the primary termination chamber, ground switch chamber, and/or transformer tank?

Question 6.24: If yes, what is the frequency of testing?

Question 6.25: Do you regularly perform Network protector maintenance and testing?

Question 6.26: If yes, what is the frequency of testing?


Question 6.27: When you perform Network Protector maintenance, please indicate which of the following you do.


Question 6.28: During your network Protector testing, do you know/record how fast the NP opens (in terms of cycles usually) when it sees a reverse power flow?


Question 6.29: Does your NP maintenance include conducting periodic “drop tests”, whereby a primary feeder is opened, and measurements are taken for backfeed voltage to assure that the network protectors function correctly (automatically open)?


Question 6.30: Are you using cameras as part of your manhole inspections?


Question 6.31: Do you use a diagnostic camera to ascertain the condition of ducts and conduits?

Question 6.32: Are you currently implementing replacement programs for any of your network equipment?

Question 6.33: If Yes, Please indicate which equipment is being replaced. (Check all that apply)


Question 6.34: Do your crews utilize tablets or laptop computers for maintenance?


Question 6.35: Is your record keeping done electronically or manually?


7.9.2.7 - Operations
Survey Title: Urban Network Practices Inventory, 2012
Summary Overview Questions 1.2 & 1.7-1.13 General/Physical Questions 2.1 - 2.11 Planning Questions 3.1 - 3.21 Design Questions 4.1 - 4.21 Construction Questions 5.1 - 5.13 Maintenance Questions 6.1 - 6.35 Operations Questions 7.1 - 7.14 Safety Questions 8.1 - 8.11 Distributed Generation Questions 9.1 - 9.12 Practices of Note Questions 10.1
Question 7.1: Do you have a dedicated operator within your control room for operating the network?

Question 7.2: Do you remotely sense / monitor information about network devices beyond the primary feeder substation breaker?

Question 7.3: If you remotely monitor information about network devices, please indicate what information you are monitoring. (Check all that apply)


Question 7.4: If you are using remote sensing, how is the information communicated? (check all that apply)


Question 7.5: If you are remotely monitoring information about network equipment beyond the primary feeder breaker, is this information tied in with your SCADA System?

Question 7.6: Do you have the ability to remotely control switches, network protectors or other devices on your network system primary beyond the substation breaker?

Question 7.7: If so, what devices are remotely controlled?


Question 7.8: If you do remotely control devices, indicate from which location(s) you have the ability to do so:


Question 7.9: If you are remotely monitoring and/or controlling network equipment, what vendor/system are you using?

Question 7.10: Do you have documented, up to date procedures for responding to network emergencies?


Question 7.11: Do you perform periodic drills that include network situations, such as a network outage or network manhole fire?


Question 7.12: Do you have a means to do a group feeder pickup in the event of a network outage? (Multiple feeders)


Question 7.13: For 480 V network protectors, do you de-energize the primary before removing the network protector fuses?


Question 7.14: For 208 V network protectors, do you de-energize the primary before removing the network protector fuses.


7.9.2.8 - Safety
Survey Title: Urban Network Practices Inventory, 2012
Summary Overview Questions 1.2 & 1.7-1.13 General/Physical Questions 2.1 - 2.11 Planning Questions 3.1 - 3.21 Design Questions 4.1 - 4.21 Construction Questions 5.1 - 5.13 Maintenance Questions 6.1 - 6.35 Operations Questions 7.1 - 7.14 Safety Questions 8.1 - 8.11 Distributed Generation Questions 9.1 - 9.12 Practices of Note Questions 10.1
Question 8.1: Do you have a “safety person”, (either a fulltime safety professional, or other employee assigned to a safety role) focused on the network?

Question 8.2: If you have a safety person focusing on the network, is this person a full time safety professional, or another employee assigned to a safety role?


Question 8.3: Do you require your network crews to wear flame retardant (FR rated) clothing?

Question 8.4: If so, what clothing system level is required to work in the network (routine work)?


Question 8.5: Do you require a incremental face protection, such as a face shield, or goggles and balaclava when working in the network?


Question 8.6: For 480 V NP’s, does your company require NP crews to wear Flash Suits when they open an energized NP?


Question 8.7: Is a first aid kit on hand when a crew is working in a vault?


Question 8.8: Do your crews have an AED (Automated External Defibrillator) on their vehicles?

Question 8.9: What procedures / tools do you use to determine that a cable is de-energized?


Question 8.10: Please indicate which of these manhole / vault entry procedures you utilize:


Question 8.11: Please indicate which of the following design, operational or work procedure changes you have implemented to address network arc flash issues


7.9.2.9 - Distributed Generation
Survey Title: Urban Network Practices Inventory, 2012
Summary Overview Questions 1.2 & 1.7-1.13 General/Physical Questions 2.1 - 2.11 Planning Questions 3.1 - 3.21 Design Questions 4.1 - 4.21 Construction Questions 5.1 - 5.13 Maintenance Questions 6.1 - 6.35 Operations Questions 7.1 - 7.14 Safety Questions 8.1 - 8.11 Distributed Generation Questions 9.1 - 9.12 Practices of Note Questions 10.1
Question 9.1: Do you allow inverter based generation to connect to the 208Y/120-volt area network?


Question 9.2: If yes, What is the maximum allowed size for the inverter based generation at any given service?

Question 9.3: Do you allow the inverter based generation to feed real power back into the secondary of the area network under unfaulted conditions?


Question 9.4: Do you place any limits on the total amount of inverter based generation that can be connected to any given area network? If so, how is that defined?


Question 9.5: Do you allow induction generators to connect to the 208Y/120-volt area network?


Question 9.6: If yes, What is the maximum allowed size for the induction generation at any given service?

Question 9.7: Do you allow the induction generator to feed real power back into the secondary of the area network under unfaulted conditions?


Question 9.8: Do you place any limits on the total amount of induction generation that can be connected to any given area network? If so, how is that defined?


Question 9.9: Do you allow synchronous generators to connect to the 208Y/120-volt area network?


Question 9.10: If you do allow distributed generators to connect to your network, do you have a written guideline that defines the interconnection requirements?


Question 9.11: Do you allow time delay tripping of network protectors that are supplying 208Y/120-volt area networks?


Question 9.12: Are there any administrative codes, rules, regulations, etc established by Public Utility Commissions, Boards of Public Utilities, etc. that cover the connection of co generation to area networks in your service territory?


7.9.2.10 - Practices of Note
Survey Title: Urban Network Practices Inventory, 2012
Summary Overview Questions 1.2 & 1.7-1.13 General/Physical Questions 2.1 - 2.11 Planning Questions 3.1 - 3.21 Design Questions 4.1 - 4.21 Construction Questions 5.1 - 5.13 Maintenance Questions 6.1 - 6.35 Operations Questions 7.1 - 7.14 Safety Questions 8.1 - 8.11 Distributed Generation Questions 9.1 - 9.12 Practices of Note Questions 10.1
Question 10.1: Please describe any practices of note being utilized to plan, design, construct, operate, or maintain your network system.

7.9.3 - 2015 Survey Results
7.9.3.1 - Summary - Overview
Survey Title: EPRI Urban Network Practices Survey, 2015
Summary Overview Questions 1 - 13 General/Physical Questions 14 - 32 Planning Questions 33 - 50 Design Questions 51 - 79 Maintenance Questions 80 - 105 Operations Questions 106 - 125 Safety Questions 126 - 134 Practices of Note Questions 135
Question 005: Total Number of Electrical Meters Served (Company Total)

Question 006: Total Number of Electrical Meters Served by Urban Networks Systems?

Question 007: What is the total installed capacity of your network (MVA)?

Question 008: Total Approximate Peak Network Load (MW)?

Question 009: Within your organization, do you have a distinct Network Engineering and Network Planning groups?

Question 010: Which of the following functions does your Network Engineering/Planning group(s) perform? (check all that apply)

Question 011: Within your company, how many Full Time Equivalent resources (FTEs) make up the following functions?


Question 012: Within your company, what percentage of the work for each task is contracted?


Question 013: Within your company, are the following groups centralized or decentralized?

7.9.3.2 - Summary - Physical/General
Survey Title: EPRI Urban Network Practices Survey, 2015
Summary Overview Questions 1 - 13 General/Physical Questions 14 - 32 Planning Questions 33 - 50 Design Questions 51 - 79 Maintenance Questions 80 - 105 Operations Questions 106 - 125 Safety Questions 126 - 134 Practices of Note Questions 135
Question 014: Total number of Network Feeders?

Question 015: How many substations serve your networks?


Question 016: How many distinct conventional distribution secondary network systems (street grids) does your company operate?

Question 017: What is average number of feeders supplying a conventional network (street grid)?

Question 018: What are your network primary operating voltage(s)? (Check all that apply)

Question 019: Do you have networks with primary operating voltages above 15 kV in any of the following configurations?

Question 020: What are your Network Secondary Voltage(s)? (Check all that apply)


Question 021: Total Number of Network Distribution Transformers?


Question 022: What is the average loading during peak for a network transformer? (% of transformer rating)

Question 023: What is the maximum loading you will allow by design for a network transformer under emergency loading?

Question 024: What is the number of secondary spot networks served at your company?

(“Spot network” in this question defined as a service to a facility from a group of network transformers feeding a common bus with little or no connections to a distribution street network.)
Question 025: What is the typical number of feeders required to supply your spot networks?

Question 026: Please indicate the percentage of each cable type that comprise your network primary cable system

Question 027: If you entered Other for the previous question, please specify other conductors and percentages.

Question 028: For primary cable, which of the following do you utilize (current standards)? (check all that apply)


Question 029: Percentage of each Cable Type that Comprise Your Network Secondary Cable System


Question 030: If you entered Other for the previous question(Question029), please specify other conductors and percentages.

Question 031: XLPE insulated conductors (In-network): Installed cables differing from normal operating temp. ratings? (normal operating temp. rating, different rating installed)

If you utilize XLPE insulated conductors in your network, and have installed cables with different normal operating temperature ratings, please list the different normal operating temperature ratings (in Celsius) associated with the different installed cables separated by commas.
Question 032: Do you use faulted circuit indicators (FCIs)? (Check all that apply)


7.9.3.3 - Planning
Survey Title: EPRI Urban Network Practices Survey, 2015
Summary Overview Questions 1 - 13 General/Physical Questions 14 - 32 Planning Questions 33 - 50 Design Questions 51 - 79 Maintenance Questions 80 - 105 Operations Questions 106 - 125 Safety Questions 126 - 134 Practices of Note Questions 135
Question 033: To what level of circuit loading (in % rated circuit capacity) do you design for normal conditions?

Question 034: To what level of circuit loading (in % rated circuit capacity) do you design for a contingency situation?

Question 035: To what level of contingency do you plan your network?


Question 036: To what level of contingency do you plan your spot network (at peak load)?


Question 037: In your typical network design, do all primary feeders sourcing a given network originate from the same substation, or do you source networks from multiple stations?


Question 038: Are network primary feeders planned and designed as dedicated feeders?

Question 039: Do switch points exist on your network primary feeders for the purpose of sectionalizing a network feeder?

Question 040: Outside the substation, do your network primary feeders have tie points with other network feeders?

Question 041: If primary sectionalizing or tie points are installed on your network system, are the switches manually or automatically controlled? (check all that apply)


Question 042: Does your design limit the number of primary feeders entering a vault or a manhole?


Question 043: In your design, do you allow primary and secondary routed through the same duct bank?

Question 044: If you answered yes to the previous question, how do the primary and secondary cables enter the manhole?

Question 045: Which of the following best describes your approach to loading your network?


Question 046: Have you developed any reliability metrics for assessing the performance of the network system?


Question 047:Do you use software to perform network circuit analysis? (Load flow studies, voltage drop analysis, etc)

Question 048: If Yes, are you using the software for…

Question 049: How do you collect network load data for modeling purposes? (check all that apply)


Question 050: In your network system analysis, do you model operation of Network Protectors due to reverse flows in your system?


7.9.3.4 - Design
Survey Title: EPRI Urban Network Practices Survey, 2015
Summary Overview Questions 1 - 13 General/Physical Questions 14 - 32 Planning Questions 33 - 50 Design Questions 51 - 79 Maintenance Questions 80 - 105 Operations Questions 106 - 125 Safety Questions 126 - 134 Practices of Note Questions 135
Question 051: Do you require a firewall between two pieces of equipment in one vault? (example, between two network transformers) (check all that apply)


Question 052: In designing your network vault, what ground resistance do you require from the ground system inside the vault?


Question 053: What neutral sizing standard is used in your designs?


Question 054: What is the X/R impedance design requirement used for substations used to feed network systems?

Question 055: If you have primary termination and switch on your network transformers, does your specification call for?


Question 056: Are you using a separately mounted primary switch (not part of the transformer unit)?


Question 057: Have you incorporated skid free vault and manhole covers into your civil designs?


Question 058: If so, are you retrofitting older existing covers with skid free ones?


Question 059: Have you incorporated vented vault and manhole covers into your civil designs?

Question 060: If you answered yes to the previous question, what criteria is used to select locations for vented cover installations?


Question 061: Are you retrofitting older existing covers with vented covers?


Question 062: Are you using manhole cover restraints in parts of your system?


Question 063: Are you retrofitting older existing covers with cover restraint systems?

Question 064: Are you performing targeted cover restraint retrofits based on (check all that apply):


Question 065: Do you use cable limiters in your network secondary system(s)?

Question 066: If you use cable limiters please indicate where you install them (check all that apply)


Question 067: If you use cable limiters, do you perform a protection coordination study between the Network Protector fuse, cable limiters, and the station’s feeder relay?

Question 068: If you use cable limiters, do you rely on the conductor to burn clear as part of your secondary network protection scheme?


Question 069: If you use limiters, do you perform studies of anticipated bolted fault currents in the secondary to assure that faulted sections burn clear or are isolated by appropriately sized cable limiters?

Question 070: By your estimation, what percentage of the time are cable limiters effective?

Question 071: Do you use cable limiters with a viewing port which provides a visual indication of a blown limiter (such as the Tyco Smart Limiter) on your network?

Question 072: What type of secondary connection technology is used on your networks?


Question 073: Are you using arc proof tape and/or fireproof chemicals in your network designs?


Question 074: Do you use high flash point fluids in the fluid filled tanks of network equipment?


Question 075: Do you seal ducts in your manhole system (in addition to sealing customer service ducts)?

Question 076: If you seal ducts, is the reason to minimize the migration of combustible gases through the manhole / duct system?


Question 077: Do you have any additional network “system hardening” initiatives underway?


Question 078: Do you have a sump pump and discharge system inside your street vaults?

Question 079: If you do discharge from your street vaults, do you use any filtering systems or systems which detect the presence of oil and consequently prevent discharge to the street?

7.9.3.5 - Maintenance
Survey Title: EPRI Urban Network Practices Survey, 2015
Summary Overview Questions 1 - 13 General/Physical Questions 14 - 32 Planning Questions 33 - 50 Design Questions 51 - 79 Maintenance Questions 80 - 105 Operations Questions 106 - 125 Safety Questions 126 - 134 Practices of Note Questions 135
Question 080: In determining your maintenance frequency, do you perform a risk or condition assessment of your individual equipment, (manholes, vaults, etc.), and vary your maintenance approach based on that assessment?


Question 081: In what applications will you perform network primary cable diagnostic testing?


Question 082: If you are performing periodic primary network cable withstand testing, what is the frequency of the testing?

Question 083: If you are performing periodic primary network cable withstand testing, what is the duration of the testing? (in minutes)

Question 084: Please indicate / describe what testing techniques you use.


Question 085: Please indicate if your company performs the following activities on a routine basis and at what frequency.


Question 086: If you perform secondary/grid cable testing, can you please describe testing?

Question 087: Are performing periodic secondary network cable withstand testing?

Question 090: If you perform Equipment Fluid Sampling and Testing, please indicate which of these tests are performed?


Question 091: Do you perform cable limiter continuity checks (amp checks) as part of your preventive maintenance program?

Question 092: Please indicate the approximate percentage of each network protector type used in your company for your network secondary cable system

Question 093: When you perform Network Protector Maintenance, please indicate which of the following you do.


Question 094: Are you using Infrared (iR) technology as part of your manhole and vault assessment process?


Question 095: If you use iR technology, what technologies do you use?


Question 096: If you perform iR testing, which activities do you perform iR testing?


Question 097: If yes, which equipment are you using iR on?


Question 098: Does your Network Protector maintenance include conducting periodic “drop tests”, whereby a primary feeder is opened, and measurements are taken for backfeed voltage to assure that the network protectors function correctly(automatically open)


Question 099: Are you using cameras as part of your manhole inspections?


Question 100: Do you use a non-iR diagnostic camera to assess the condition of ducts and conduits?

Question 101: Do you track cable and equipment failures?

Question 102: If you track equipment failures, which of the following do you track?


Question 103: Please provide failures rates/year (if tracked) for the list below:

Question 104: Please describe the failure investigation process and what drives corrective actions.

Question 105: Are you implementing targeted replacement programs for any of the following equipment?


7.9.3.6 - Operations
Survey Title: EPRI Urban Network Practices Survey, 2015
Summary Overview Questions 1 - 13 General/Physical Questions 14 - 32 Planning Questions 33 - 50 Design Questions 51 - 79 Maintenance Questions 80 - 105 Operations Questions 106 - 125 Safety Questions 126 - 134 Practices of Note Questions 135
Question 106: For your field craft positions, which of the following best describes your approach?


Question 107: Do you have a dedicated operator within your dispatch center/control room for operating the network?

Question 108: Do you remotely sense / monitor information about network devices beyond the primary feeder substation breaker?

Question 109: If you remotely monitor information about network devices, please indicate what information you are monitoring.


Question 110: If you are remotely monitoring information about network equipment beyond the primary feeder breaker, is this information tied in with your SCADA System?

Question 111: Do you have the ability to remotely control switches, network protectors or other devices on your network system primary beyond the substation breaker?

Question 112: If so, what devices are remotely controlled?


Question 113: For 480 V network protectors, do you de-energize the network transformer before removing the network protector fuses?


Question 114: For 208 V network protectors, do you de-energize the network transformer before removing the network protector fuses.


Question 115: Do you require the network primary to be de-energized prior to commencing work inside of a manhole or vault?


Question 116: Do you have documented, up to date procedures for responding to network emergencies?


Question 117: Do you perform periodic drills that include network situations, such as a network outage or network manhole fire?


Question 118: Do you perform a network emergency drill at least once a year where your company will simulate a network emergency with key individuals in a room and everyone discusses how they would respond?


Question 119: Do you have a documented procedure for company personnel responding to a smoking manhole (“a smoker”)?


Question 120: Do you have a documented procedure for company personnel responding to a fire in a manhole?


Question 121: Do you have a documented procedure for first responders responding to smoking manholes or fires in manholes?


Question 122: In response to a manhole/vault fire, do you require the cables in the manhole/vault to be deenergized before first responders attempt to extinguish the fire?

Question 123: In response to a manhole/vault fire, do you allow the fire company to pour water into the hole upon arrival?

Question 124: In response to a manhole/vault fire, which of the following methods of fire extinguishment do you utilize?


Question 125: If there is a network emergency, is there a Network Shutdown protocol?


7.9.3.7 - Safety
Survey Title: EPRI Urban Network Practices Survey, 2015
Summary Overview Questions 1 - 13 General/Physical Questions 14 - 32 Planning Questions 33 - 50 Design Questions 51 - 79 Maintenance Questions 80 - 105 Operations Questions 106 - 125 Safety Questions 126 - 134 Practices of Note Questions 135
Question 126: Do you require your network crews to wear flame retardant (FR rated) clothing?

Question 127: If so, what clothing system level is required to work in the network (routine work)?


Question 128: Please indicate which of these manhole / vault entry procedures you utilize:


Question 129: Please indicate which of the following design, operational or work procedure changes you have implemented to address network arc flash issues:


Question 130: Do you require your network engineers to obtain their Professional Engineering (PE) license before they can move to more senior engineering positions?

Question 131: Do you have a formalized training program for cable splicers, Network Mechanics and other individuals working on the network system?

Question 132: Is advancement from apprentice to the journey worker level in a given period of time required as part of the job function (i.e. – automatic progression job)?

Question 133: If you have an automatic progression, what is the amount of time required to achieve the journey worker level?

Question 134: Can you briefly describe your training program for network workers?

7.9.3.8 - Practices of Note
Survey Title: EPRI Urban Network Practices Survey, 2015
Summary Overview Questions 1 - 13 General/Physical Questions 14 - 32 Planning Questions 33 - 50 Design Questions 51 - 79 Maintenance Questions 80 - 105 Operations Questions 106 - 125 Safety Questions 126 - 134 Practices of Note Questions 135
Question 135: Please describe any practices of note being utilized to plan, design, construct, operate, or maintain your network system

7.9.4 - 2018 Survey Results
7.9.4.1 - Asset Management
Question 005: Please provide the following information for your distribution network infrastructure


Question 006: Please indicate the percentage of each cable type that comprise your network primary (MV) cable system


Question 007: Please indicate the percentage of each cable type that comprise your network secondary (LV) cable system


Question 008: Please indicate if your company performs the following activities on a routine basis and at what frequency


Question 009: Do you have any maintenance programs where the maintenance frequency or approach is dependent, at least in part, on a risk or condition assessment of the assets to be maintained?


Question 010: If you perform periodic network primary cable diagnostic testing, please indicate / describe what testing techniques you use


Question 011: Are you using information from cable diagnostic testing to influence investment decisions, such as when to replace cable?


Question 012: Do you perform cable limiter continuity checks (amp checks) as part of your preventive maintenance program?


Question 013: If you perform Network equipment Fluid Sampling and Testing, please indicate which of these tests are performed? (check all that apply)


Question 014: If you perform equipment fluid sampling and testing of network transformers, please describe how you are analyzing the data and using it to drive investments or replacement of these units

Question 015: Are you using Infrared (iR) technology as part of your manhole and vault assessment process?


Question 016: If yes, with which activities do you perform iR testing? (check all that apply)


Question 017: If yes, which equipment are you using iR on? (check all that apply)


Question 018: If you are performing IR inspections, which of these best describe your approach? (Check all that apply)


Question 019: Are you using cameras (non- iR) as part of your manhole inspections?


Question 020: Do you track cable and equipment failures?


Question 021: If you track equipment failures, which of the following do you track? (check all that apply)


Question 022: Please provide the average number of failures per year you experience for the asset types listed below (if tracked):


Question 023: Provide the number of years upon which the average # of failures / year is based. (ex: 3 yrs, 5 yr-rolling ave, etc)


Question 024: Please indicate if the failure rate for these assets is trending up (worse) or down (better), if tracked. Consider all vintages and types within each asset type.


Question 025: Please describe your failure investigation process. Include a description, if applicable, of what drives corrective actions.

Question 026: Are you implementing targeted replacement programs for any of the following equipment? (check all that apply)


Question 027: If Yes, are any of your replacement programs Aged based, such as replacing all transformers >50 years old?


Question 028: If Yes (to question 26), are any of your replacement programs Design based, such as replacing all high rise fluid filled transformers with dry type units, or replacing a certain type of cable?


Question 029: If you are implementing targeted replacement programs not yet describe above, please describe how you are selecting assets to be replaced

Question 030: Do you remotely sense / monitor information about network devices beyond the primary feeder substation breaker?


Question 031: If you remotely monitor information about network devices, please indicate what information you are monitoring.


Question 032: If you remotely monitor information, are you using that information to make investment decisions, such as replacing equipment?


Question 033: If yes, please describe any software you are using to compile data and perform analysis.

Question 034: Please describe any practices of note being utilized to manage network assets

7.9.4.2 - Manhole Event Preparedness and Response
Question 005: Approximately how many total underground manholes / vaults do you have on your system?

Question 006: Do you require a firewall between two pieces of equipment in one vault? (example, between two network transformers)


Question 007: Are you using a separately mounted primary switch (not part of the transformer unit)?


Question 008: When do you operate a network transformer’s primary switch?


Question 009: Please indicate where you use vented vault and manhole covers to prevent accumulation of gases. (Not including vented gratings for transformer cooling)


Question 010: If you apply vented covers selectively, what criteria do you use to select locations? (check all that apply):


Question 011: Are you using manhole cover restraints in parts of your system?


Question 012: If yes, what criteria do you use to select locations at which to apply a cover restraint? (check all that apply):


Question 013: Are you using arc proof tape in your network designs? (please check all that apply)


Question 014: Do you use high flash point (less flammable) fluids in the fluid filled tanks of network equipment?


Question 015: Do you seal ducts in your manhole system (other than, or in addition to sealing customer service ducts)?


Question 016: If you seal ducts, is the reason to minimize the migration of combustible gases through the manhole / duct system?


Question 017: Do you use cable limiters in your network secondary system(s)?


Question 018: Are you implementing targeted replacement programs for any of the following equipment? (check all that apply)


Question 019: Are any of your targeted replacements driven by equipment that is beyond a particular age?


Question 020: Other than the performance of inspection and maintenance, are you using any other noteworthy approaches aimed at preventing manhole events?


Question 021: Do you remotely sense / monitor information about network devices / vaults beyond the primary feeder substation breaker?


Question 022: If you remotely monitor information about network devices / vaults, please indicate which of the following you are monitoring. (Check all that apply)


Question 023: Do you have a documented procedure for company personnel responding to a smoking manhole (“a smoker”)?


Question 024: Do you have a documented procedure for company personnel responding to a fire in a manhole?


Question 025: Do you have documented, up to date procedures for company personnel responding to other network emergencies?


Question 026: If there is a network emergency, is there a Network Shutdown protocol?


Question 027: Do you have a documented procedure for first responders responding to smoking manholes or fires in manholes?


Question 028: Do you perform periodic drills that include network situations, such as a network outage or network manhole fire?


Question 029: If you perform emergency drills that involve the network, do you sometimes involve other stakeholders, such as first responders (such as the fire department)?


Question 030: In response to a manhole/vault fire, do you require the cables in the manhole/vault to be deenergized before first responders attempt to extinguish the fire?


Question 031: In response to a manhole/vault fire, do you allow the fire company to pour water into the hole upon arrival?


Question 032: In response to a manhole/vault fire, which of the following methods of fire extinguishment do you utilize? (check all that apply)


Question 033: What other noteworthy approaches or technologies are you using to speed the recovery from a manhole event?

7.9.4.3 - Urban Network Safety Practices Survey
Survey Title: EPRI Urban Network Safety Practices Survey, 2018.
Question 005: Approximately how many total network units do you have on your system (area and spot networks)?

Question 006: Total approximate Peak network load (MW)?


Question 007: Do you have a “safety person”, (either a fulltime safety professional or other employee assigned to a safety role) focused on the network?


Question 008: If you have a safety person focusing on the network, is the person a full time safety professional, or another employee assigned to a safety role?


Question 009: Do you perform routine training on how to conduct a tailboard meeting?


Question 010: How to you determine / assess the quality of your tailboard meetings?

Question 011: Do you have documented, up to date procedures for a safety emergency at the jobsite, such as for extracting an injured man from a manhole?


Question 012: Do you periodically conduct a network exercise (drill) for responding to a safety emergency in a manhole, vault, or multi-level vault?


Question 013: What clothing system level is required to work in the network (routine work)?


Question 014: For 480V network protectors, does your company require crews to wear flash suits (i.e. higher than cat four PPE) or other incremental protection when they open or work in an energized NP?


Question 015: Does your utility test the heat rating or arc flash rating of your tools and clothing?


Question 016: Does your utility buy clothing or tools that are arc flash certified / heat certified?


Question 017: What other types of work in the network, if any, require incremental PPE or other tools? Please describe.

Question 018: For 208 V network protectors, do you de-energize the network transformer before removing the network protector fuses?


Question 019: For 480 V network protectors, do you de-energize the network transformer before removing the network protector fuses?


Question 020: Please indicate which of the following work procedures you have implemented to address network arc flash issues. Please check all that apply.


Question 021: Do you use external disconnects, such as Richards Outside Link Boxes or Eaton VisoBlock, to isolate 480V spot network protectors from the secondary network bus?


Question 022: Please indicate which of these manhole / vault entry procedures you utilize:


Question 023: We utilize sectionalizing devices on network feeders, enabling us to isolate a portion of the feeder


Question 024: If you use solid dielectric type switches, will you thump or proof-test into the switch with the terminations attached?


Question 025: Please indicate which of these activities are part of your procedure for determining a feeder to be de-energized and cutting a medium voltage network cable.


Question 026: Please indicate which of the following activities are part of your network feeder clearance procedures.


Question 027: When the feeder has been cleared, in what position have you left the network transformer primary switch?


Question 028: Are there any differences in your network feeder clearance procedures for a routine clearance (such as for adding a new transformer) and an emergency clearance (such as for a cable failure)?


Question 029: Please describe any noteworthy practices associated with worker safety in network systems that have been beneficial to you, and provide any other comments.

7.9.5 - 2019 Survey Results
7.9.5.1 - UG Inspection Practices Survey
Survey Title: UG Inspection Practices Survey, 2019
Question 005: Please provide the number of total submersible enclosures (vaults and manholes) that can be entered by a person. Include both network and conventional (nonnetwork) UG enclosures


Question 006: If you use remotely controlled switches in your Urban UG system, what percent of your total switch fleet in Urban UG is remotely controlled?

Question 007: Please indicate if your company performs the following Inspection activities on a routine basis and at what frequency


Question 008: When performing Urban UG inspections, please indicate which of the following tools you utilize. Check all that apply


Question 009: Does your inspection form provide guidance for prioritizing findings?


Question 010: If so, does the prioritization of the findings drive the time table for performing corrective maintenance?


*Note: Many companies do not have prioritization indicated on the form, however they have defined specific time frames for responding to findings based on priorities.
Question 011: Are you using Infrared (iR) technology as part of your manhole and vault inspection / assessment process?


Question 012: With which activities do you perform iR testing? (check all that apply)


Question 013: Have you established thresholds for action based on iR readings?


Question 014: Are you using cameras (non iR) as part of your manhole / vault inspections (check all that apply)?


Question 015: Do you use faulted circuit indicators (FCI’s) in your Urban UG infrastructure? (Check all that apply)


Question 016: In what applications will you perform network primary cable diagnostic testing? (Check all that apply)


Question 017: In what applications will you perform Non-network primary cable diagnostic testing in urban UG systems? (Check all that apply)


Question 018: If you are performing periodic primary cable withstand testing, what is the frequency of the testing?

Question 019: If you are performing periodic primary cable withstand testing, what is the duration of the testing? (in minutes)

Question 020: Please indicate / describe what testing techniques you use. Check all that apply


Question 021: If you are performing Partial Discharge testing, please indicate which approach(es) you utilize


Question 022: For your network system, do you perform a “Drop test”, where a network feeder is opened at the station and network protectors are tested to assure that they are functioning correctly (automatically open on backfeed)?


Question 023: If you have a secondary network, do you perform any routine diagnostic testing on your secondary cable?


Question 024: In determining your maintenance frequency, do you perform a risk or condition assessment of your individual equipment, (manholes, vaults, etc.), and vary your maintenance approach based on that assessment? (For example, a higher risk vault inspected more frequently than a lower risk vault)


Question 025: Please indicate if your company performs the following Maintenance activities on a routine basis and at what frequency


Question 026: If you perform distribution transformer oil sampling and testing (network and non-network), have you established trigger points for action based on oil sampling results?


Question 027: Do you utilize dissolved gas monitors on UG distribution network transformers?


Question 028: If you utilize dissolved gas monitors on underground distribution, please indicate which devices you utilize and which gasses you are monitoring

Question 029: For primary sectionalizing or tie points installed on your Urban UG system, excluding auto transfer schemes at customer sites, are the switches manually or automatically controlled? (check all that apply)


Question 030: Do you remotely sense / monitor information about devices beyond the primary feeder substation breaker?


Question 031: If you are remotely monitoring information about equipment beyond the primary feeder breaker, is this information tied in with your SCADA System?


Question 032: On your network system, do you have the ability to remotely control switches, network protectors or other devices on your system beyond the substation breaker?


Question 033: If so, what devices are remotely controlled? (check all that apply)


Question 034: On your non- network urban underground system, do you have the ability to remotely control switches, or other devices beyond the substation breaker?


Question 035: If so, what devices are remotely controlled? (check all that apply)


Question 036: Have you been able to leverage remote monitored information to modify your equipment inspection approach?


Question 037: Have you been able to leverage remote monitored information such that it has enabled you to modify your preventive maintenance approach?


Question 038: Please describe any practices of note with respect to Urban UG System Inspection and Maintenance

7.9.6 - 2020 Survey Results
7.9.6.1 - PTO Monitoring Survey
Question 005: Has your utility deployed or do you have plans to deploy PTO (pressure, temperature, and oil level sensors) on your network transformers?


Question 006: If Yes, Please indicate which type of sensing you have deployed on network transformers:


Question 007: If you have deployed PTO, what are the goals or rationale for adding PTO to the network transformer monitoring?


Question 008: Where you are applying PTO, what locations in the Network unit are your monitoring? (check all that apply)


Question 009: During network transformer maintenance, do you test PTO sensor functionality, or perform any sort of monitor calibration?


Question 010: If you have deployed PTO sensors to your network transformers, do you have the ability to remotely monitor the information?


Question 011: How is the PTO communications wiring routed?


Question 012: What communications equipment are used for returning telemetry?


Question 013: If you are leveraging PTO monitoring to manage your network transformer fleet, please briefly describe your approach


Question 014: What PTO telemetry combinations are being used for alarms? (i.e. temp up & press down = leak; temp up & press up = normal load increase; temp normal & press up = potential problem)


Question 015: What SCADA analog alarm levels do you set for PTO (i.e. pressure in psi or kPA and the set point)


Question 016: In addition to active monitoring of PTO levels, are you recording and storing monitored levels?


Question 017: What software does your utility use to analyze PTO data?


Question 018: How well have DGA results compared to any PTO data at the same time the oil sample was taken? (for example, have you seen correlations between higher pressures and the presence of dissolved gases in the oil?)


Question 019: Have you had any near miss or other event avoided due to PTO alarms?


7.9.6.2 - Underground Residential and Underground Commercial Distribution (URD /UCD) Practices Survey
Question 005: How many circuit miles of underground primary URD and UCD cable do you have on your system? (miles)


Question 006: How many total miles of cable do you install in a typical year? (Include new and replacement cable installations)

Question 007: How many total miles of URD / UCD cable do you replace in a typical year?

Summary: Miles of Installs and Replacements of URD/UCD

Question 008: Please indicate the percentage of your installed URD/UCD cable plant by insulation type


Question 009: What percentage of your installed primary URD / UCD cable plant is comprised of unjacketed cable?


Question 010: How many URD / UCD primary cable faults do you experience in a typical year?


Question 011: Please indicate if your company performs the following Inspection activities on a routine basis and at what frequency


Question 012: For the following routine inspection activities, please select the option that best describes your approach

Question 013: If you utilize infrared thermography (IR) in your URD/UCD inspections, have you established thresholds for action based on iR readings?


Question 014: Do you use faulted circuit indicators (FCI’s) in your URD / UCD Infrastructure? (Check all that apply)


Question 015: In what applications will you perform primary URD or UCD cable diagnostic testing? (Check all that apply)


Question 016: If you are performing cyclical primary cable diagnostic or withstand testing on URD/UCD cables; that is, proactive testing of cables on a fixed schedule to ascertain their condition, what is the frequency of the testing? (If you do not perform cyclical diagnostic testing, leave blank)


Question 017: Please indicate / describe what cable diagnostic testing techniques you use on your URD/UCD cables. Check all that apply


Question 018: If you are performing Partial Discharge testing on installed URD/UCD cable systems, please indicate which approach(es) you utilize


Question 019: If you perform partial discharge testing of installed URD/UCD cable systems, do you track failures associated with tested cables for warranty purposes?


Question 020: Do you perform cable injection on URD or UCD cable systems?


Question 021: If you utilize cable injection, do you track failures associated with injected cables for warranty purposes?


Question 022: Which of the following best describes your current prevailing installation approach for new MV URD cables?


Question 023: Which of the following best describes your current prevailing installation approach for new MV UCD cables?


Question 024: Do you perform proactive cable replacement of URD / UCD cables?


Question 025: In analyzing your cable system, are you performing any predictive analysis? If yes, please describe in detail


Question 026: Which of the following best describes your current prevailing practice for replacing or repairing direct-buried URD / UCD cables?


Question 027: In rocky soil areas, do your cable installation / replacement practices deviate from normal practice?


Question 028: If you direct bury cables, either for new installations or for cable replacement, can you share cable standard changes that have taken place over time?

Question 029: Do you perform any routine maintenance (other than inspection) of single phase pad mounted transformers which are part of your URD / UCD system?


Question 030: Do you perform any routine maintenance (other than inspection) of pad mounted switchgear which are part of your URD / UCD system?


Question 031: Do you perform any routine maintenance (other than inspection) of three phase pad mounted transformers which are part of your URD / UCD system?


Question 032: Do you see a need for analytical approaches to better understand underground cable and cable accessory performance? (Example: failure rates by manufacturer, age, insulation type, etc.)


Question 033: Please describe any practices of note with respect to URD / UCD systems

7.9.7 - 2021 Survey Results
7.9.7.1 - Infrared Thermography Survey
Question 001: Are your UG field crews equipped with IR cameras?


Question 002: How many UG crews do you have in the field?


Question 003: How long have your field crews been using IR cameras in the field?


Question 004: What are your top two reasons for conducting IR inspections?


Question 005: Are your UG field crews equipped with IR cameras?


Question 006: Do you have a work procedure for taking IR images


Question 007: When do you conduct IR inspections?


Question 008: What components do you instruct line crews to inspect with IR?


Question 009: How do you approach the interpretation of your IR imagery?


Question 010: Which are your top 3 concerns over IR imaging in the field?


Question 011: What do your crews do about camera emissivity settings?


Question 012: Do you maintain IR records?


Question 013: What IR records do you maintain?


Question 014: Would you be willing to share some of your IR records with EPRI?


7.9.8 - 2022 Survey Results
7.9.8.1 - 2022 Underground Distribution Equipment Commissioning Practices Survey
Question 001: For Underground Switches that would be used as part of a dual feeder throw over scheme, which of these tests are performed when the units are received from the manufacturer? Please check all boxes that apply.


Question 002: For Underground Switches that would be used as part of a dual feeder throw over scheme, which of these tests are performed prior to energizing the unit? (may be done in the warehouse or in the field prior to energization) Please check all boxes that apply.


Question 003: For Underground Switches that would be used as part of a dual feeder throw over scheme, please describe any commissioning tests that are performed after energization.

Question 004: For distribution three phase padmounted transformers, which of these tests are performed when receiving the unit from the manufacturer? Please check all boxes that apply.


Question 005: For distribution three phase padmounted transformers, which of these tests are performed before energizing the unit? Please check all boxes that apply.


Question 006: For distribution three phase padmounted transformers, please describe any commissioning tests that are performed after energization.

Question 007: For distribution three phase radial (non-network) transformers, such as those that may be used in building vaults or below grade vaults, which of these tests are performed when receiving the unit from the manufacturer? Please check all boxes that apply.


Question 008: For distribution three phase radial (non-network) transformers, such as those that may be used in building vaults or below grade vaults, which of these tests are performed before energizing the unit? Please check all boxes that apply.


Question 009: For distribution three phase radial (non-network) transformers, such as those that may be used in building vaults or below grade vaults, please describe any commissioning tests that are performed after energization.

Question 010: For distribution three phase network transformers, which of these tests are performed when receiving the unit from the manufacturer? Please check all boxes that apply.


Question 011: For distribution three phase network transformers, which of these tests are performed before energizing the unit? Please check all boxes that apply.


Question 012: For distribution three phase network transformers, please describe any commissioning tests that are performed after energization.

Question 013: For low voltage underground cable systems, including network systems, which of these tests are performed before energizing the cable system? Please check all boxes that apply.


Question 014: Please describe any practices of note with commissioning UG equipment
