Deliverables on Asset, Reliability & Resiliency Analytics
Recent deliverables on distribution asset, reliability & resiliency analytics are highlighted below.
2020
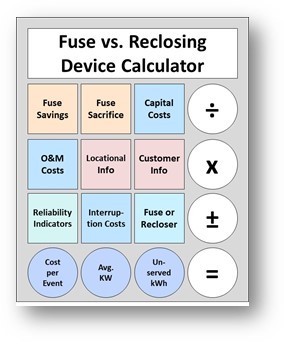
Evaluation and Comparison of Costs/Benefits of Fuses vs. Reclosers v1.0
The calculator and accompanying how-to-use report permit utilities to plan for system improvements and design standards with more confidence in the expected benefits. The calculator is geared to compare the costs and benefits of installing either a fuse or recloser on a tap/lateral. The calculator accepts utility specific inputs and interruption costs and recommends which utility asset to install.
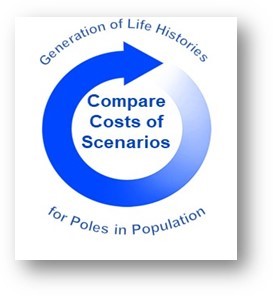
Analysis of Long-Term Cost of Resilient Distribution Pole Options - A Monte Carlo Simulation For Comparing Cost (Version 1)
The conceptual simulation tool and accompanying how-to-use report allow utilities to evaluate the costs and benefits of distribution poles with different anticipated performance characteristics. The simulation tools accepts economical inputs and permits the user to select between performance curves and distributions that simulate real-world pole performance. A Monte Carlo analysis generates life histories of the poles in the population for comparison.
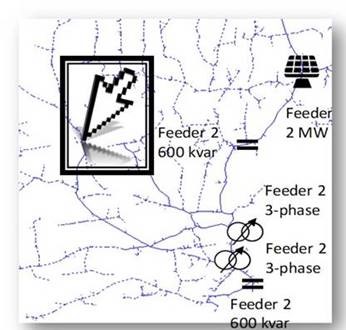
Recloser Settings for Optimizing Reliability and Interoperability of Assets Deliverable Publishing Process
The goal of this research is to improve the reliability of system by ensuring optimal settings of reclosing devices and to ensure interoperability between reclosing devices and other outage-monitoring assets. The analysis of one utility’s data sheds light on using reclosers on taps(lateral), single-phase vs. gang-operated reclosing, number of and time between reclosing attempts, and other recloser operating characteristics.
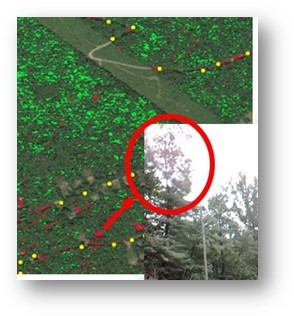
Identification of At-Risk Trees Using Satellite Imagery Deliverable Publishing Process
The accuracy of predicting stressed versus healthy trees adjacent to the distribution ROW using satellite imagery ranged from 60-87%. Techniques were developed to determine the height of trees and the proximity to the distribution line using satellite imagery, LiDAR, and GIS data. These characteristics and whether the tree(s) was stressed or not led to the classification of an at-risk(danger tree). This research used a small sample size. As a result, confirmation of the results and the potential value of the developed techniques can be realized from future demonstrations.
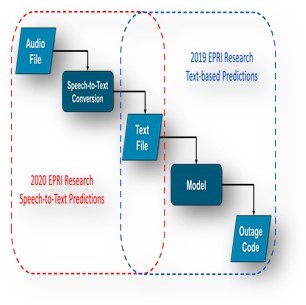
Outage Coding Automation: Speech-to-Text Experiments and Model Testing
The goal of this research was to improve outage record integrity and reduce the burden of current outage follow-up processes. The research investigated machine learning approaches to improve outage record coding efficiency and consistency. The 2019 research found that text-based predictions performed well on historic utility records (0.76 True Positive Rate). In 2020, the research found that Google’s Speech-to-Text model
Distribution Pad Mount Transformer Performance Analytics: Data Model, Definitions and Analysis
focuses on leveraging data science techniques to better understand wood pole and pad mount transformer performance. To date, EPRI has curated and analyzed 3.6 million wood pole inspection records from 6 utilities and 650,000 pad mount transformer visual inspection records from 4 utilities. The report:
- Provides objective data to guide inspections, plan resources and aid compliance
- Helps better understand influence of various factors such as manufacturer, inspection type, material composition etc. on asset performance
- Guides inspection and maintenance through combining data, statistics and leading industry practices
- Guidance on inspection frequency, inspection points and data collection