This the multi-page printable view of this section. Click here to print.
Wildfire Mitigation Technologies Database
- 1: Asset Condition Monitoring
- 1.1: Aerial Asset Inspections - E-Field Sensing
- 1.2: Automated Visual Line Inspections
- 1.3: Charred Pole Integrity
- 1.4: Line Sensing Technology
- 1.5: Line Splice Sensing
- 1.6: Asset Inspections by Multispectral Imagery
- 2: Environmental Monitoring
- 2.1: Gas-Sensing Remote Smoke Detectors
- 2.1.1: Dryad
- 2.1.2: Torch
- 2.1.3: Milesight
- 2.1.4: Libelium
- 2.1.5: Hayden Data Systems
- 2.2: LiDAR - Light Detection and Ranging
- 2.3: Micro Weather Stations
- 2.4: Vegetation Condition Assesssment by Multispectral Imagery
- 2.5: Smoke Detection Cameras
- 2.6: Synthetic Aperture Radar (SAR) from Satellite Imagery
- 3: Fault Count and Frequency Reduction
- 3.1: Covered Overhead Conductors
- 3.2: Hybrid Undergrounding
- 3.3: Optimized Construction Practices
- 3.4: Strategic Undergrounding
- 4: Fault Energy Reduction
- 4.1: Fault Energy Limiting Fuses
- 4.2: Non-Expulsion Fuse Designs
- 4.3: Powerline Carrier (PLC) Signalling
- 4.4: Protective Device Communication
- 4.5: Public Safety Power Shutoff
- 4.6: Pulse Reclosing
- 4.7: Reclose Blocking - Manual
- 4.8: Reclose Blocking Automated
- 4.9: Fault Energy Limiting – Rapid Earth Fault Current Limiter (REFCL)
- 5: Fire Protective Materials
- 5.1: Fire Inhibiting Sprays
- 5.2: Fire Protective Material for Wood Poles
- 5.3: Fire-Resistant Fencing
- 5.4: Flame-inhibiting Coverings
- 5.5: Smoke/Soot Inhibitors
- 5.6: Vegetation Clearing and Brushing
- 6: Grid Monitoring
- 6.1: Falling Conductor Protection
- 6.2: Faulted Circuit Indicators
- 6.3: High-Impedance Fault Detection
- 6.4: IND.T EFD Device
- 6.5: Distribution Fault Anticipator (DFA)
- 6.6: Smart Meters (Advanced Metering Infrastructure or AMI)
- 6.7: Substation PQ and RFI
- 6.8: Substation 60-Hz PQ Monitors
- 7: Modeling and Simulation
1 - Asset Condition Monitoring
1.1 - Aerial Asset Inspections - E-Field Sensing
Risk Reduction Category
Technology Description
Today, utilities commonly use imagery from unmanned aerial systems (UAS) to improve their vantage point when inspecting overhead assets. As of 2023, most UAS used in this way are manually operated, however, as technology improves and regulations are more favorable, automation is increasingly possible. As an example, to supplement manual flight control, UAS are now capable of identifying poles and flying a prescribed path around each pole in order to capture images. While imagery alone is often sufficient for asset inspections, the success of an inspection is dependent on the quality of imagery, which is subject to camera positioning, glare from sunlight, shadowing, and other interference.
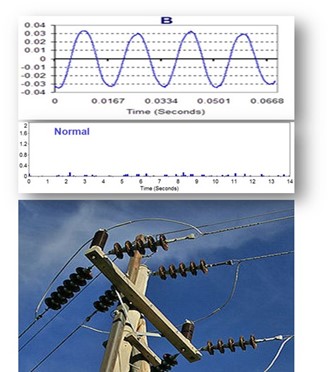
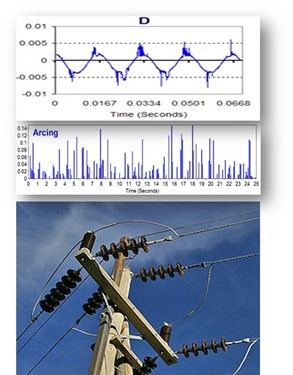
Supplemental information from electric field sensors could improve visual inspections. The idea of an electric field sensor mounted to UAS is an emerging approach for inspecting assets to detect pre-failure conditions. It would be used as a supplement to visual imagery rather than a replacement. As an enhancement to visual inspections, an e-field sensor on the same UAS can improve anomaly detection by capturing arcing signatures. The utility can use this additional layer of intelligence to identify whether an asset needs to be replaced or put on a watch list. In the figures below, compare the normal condition (left) to the abnormal condition (right) where visual inspection alone is unable to discern this anomaly.
Technical Readiness (Commercial Availability)
Electric field sensing is a mature technology and has a very wide range of applications. Additionally, mounting e-field sensors to an unmanned aerial system is also used for a variety of applications. What is innovative is the idea of identifying unique signatures that could warn of insipient failures on utility assets. To deploy such a device, important hardware and software requirements for this application are:
- Signal Analyses, either real-time or post-processed
- Waveform anomaly detection
- Spectrum analysis
- Geo-locating
- Imagery from camera
- Local data storage or streaming to ground support
Implementations/Deployments
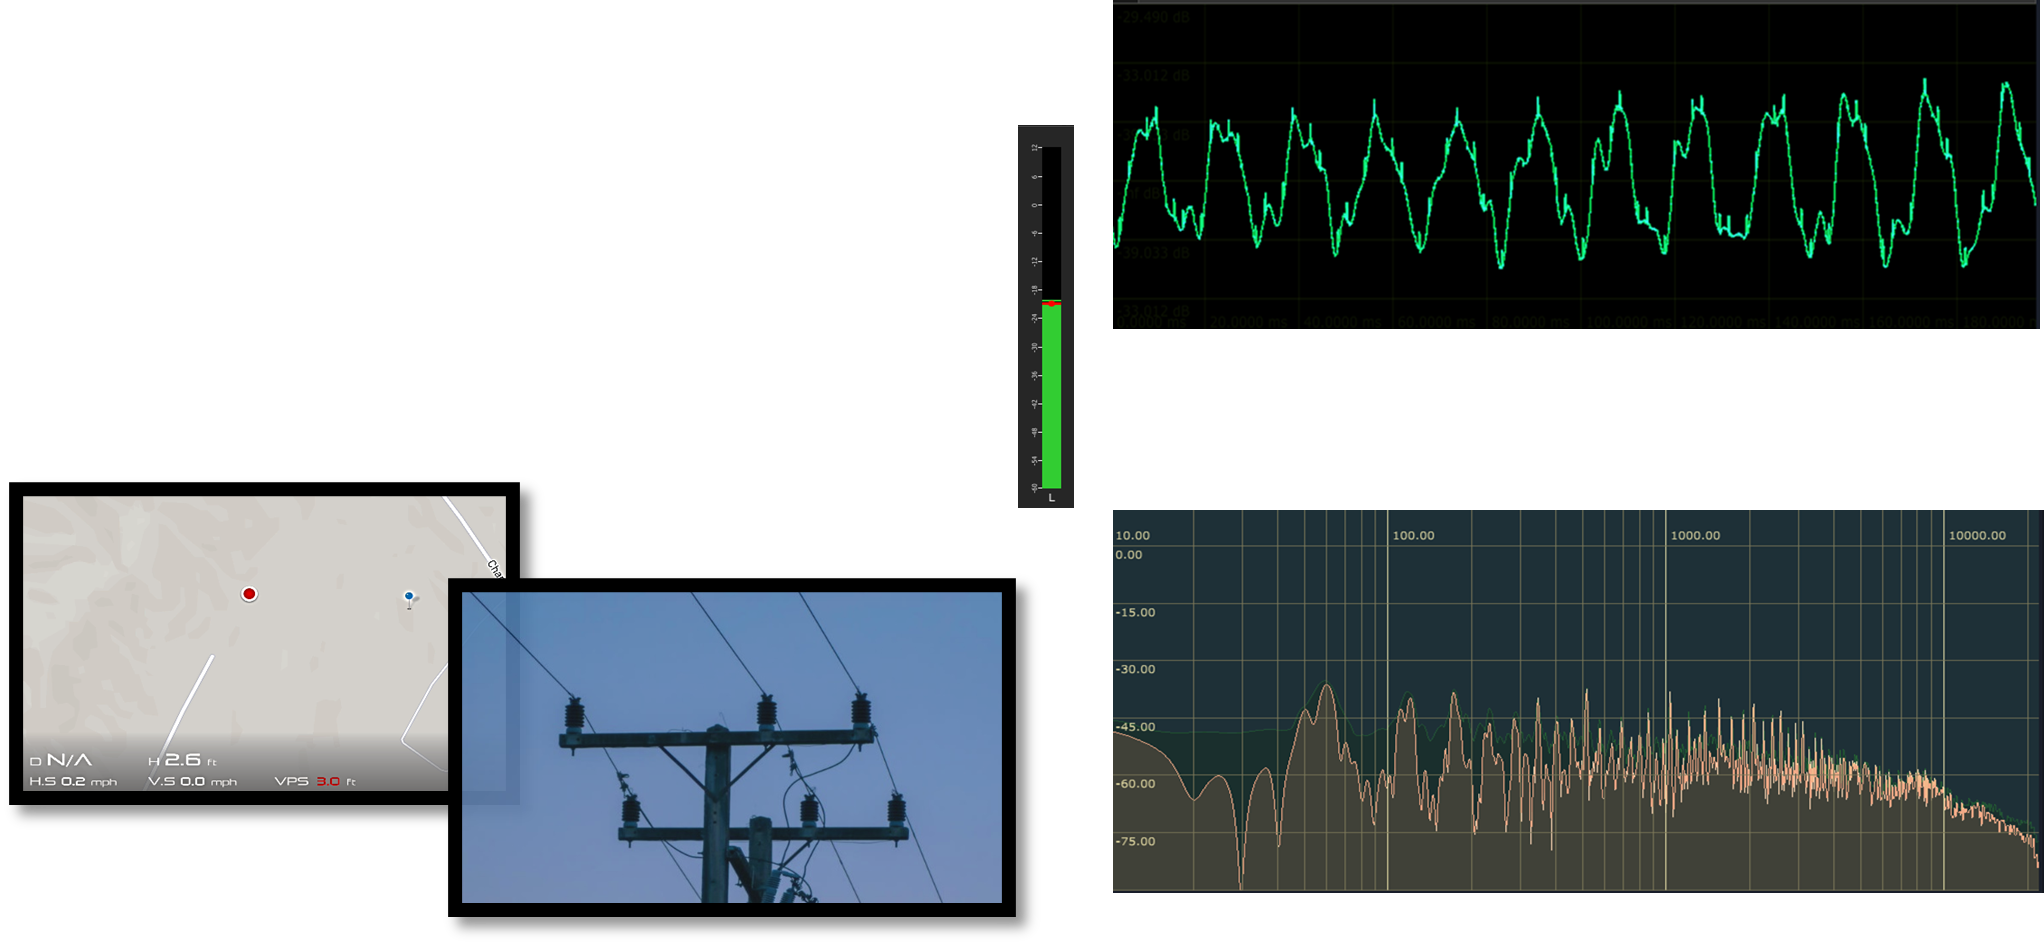
As an emerging application, EPRI is not aware of any commercial vendors innovating in this space. However, in 2019, EPRI developed US Patent 10,501,181 B1 for “Method and Apparatus for Aerial Scanning and Detection of Contact Voltages and Distinguishing Between Normal and Abnormal Electric Fields.” [1] This technology has not yet been field tested outside of proof-of-concept tests in a controlled environment. Snapshots from an experimental trial are shown below, including the following real-time data:
- Geolocation (left)
- Visual imagery (left)
- Waveform capture and streaming (top right)
- Spectrum analysis (bottom right)
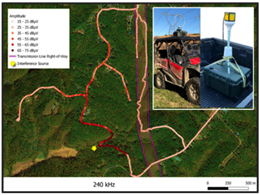
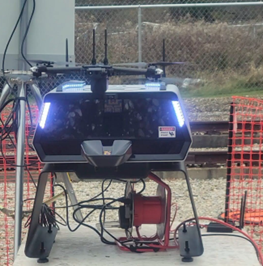
Another EPRI innovation closely related to the topic is what EPRI calls their Portable Radiated Emissions Measurement System, version 2 (PREMS II). EPRI has created a mobile system built on a roboticized platform to enable efficient, accurate, and repeatable electric field measurements over broad geographical areas. See figure below. The tool is designed to quickly and efficiently pinpoint sources of radiated emissions. With a simple web-based interface, PREMS II connects to a suite of available sensors to allow for expedient capturing of GPS coordinated sensor data. As proven in two use cases in 2020 using prototype configurations, the PREMS II system helps the user to observe electric field and frequency spectrum through heat maps overlaid on satellite imagery. This technology can enable utilities to accelerate the measurement and detection of the sources of radiated emissions issues, thereby expediting mitigation and promoting compatibility between the electrical grid, end-use customers, and a myriad of related systems. This system offers a ground-based, versus aerial platform on which to build additional intelligence to potentially detect insipient fault signatures from failing overhead assets.
Innovations as of Mid 2023
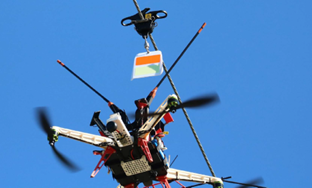
As a related technology, Manifold Robotics, with financial support from New York State Energy Research and Development Authority (NYSERDA) developed an e-field-guided drone that uses electric fields from powerlines to navigate along overhead assets. [2] This technology is used to aid the navigation and positioning of the drone in order to improve the capture of visual imagery. While the usage of e-field data differs in this application, it offers a hardware platform for further developing e-field signature recognition.
Potential Enrichment Work Opportunity
References
[1] https://image-ppubs.uspto.gov/dirsearch-public/print/downloadPdf/10501181
1.2 - Automated Visual Line Inspections
Risk Reduction Category
Technology Description
Utilities commonly employ uncrewed aircraft systems (UAS) to capture imagery, LiDAR, and other data of important assets for monitoring vegetation encroachment and asset conditions. There are at least two advantages to using UAS to perform this work. Depending on terrain and access, an aerial inspection can be done faster versus visual inspections on foot, even with line-of-sight restrictions for drone operation. Additionally, aerial imagery provides a beneficial visual perspective for inspections of overhead assets.
The sheer physical size of the transmission and distribution infrastructure makes inspecting those assets challenging. Utilities usually use a combination of ground-based patrols and manned aircraft flights for routine and emergency response inspections. These traditional approaches are costly, time consuming, and require human involvement. UAS have the potential to reinvent the existing processes, as well as open the door for an automated future. A few of these use cases are listed below.
Transmission Structure and Line Inspection
Utility maintenance best practices require routine detailed inspections of transmission structures and the conductor. The traditional methods for these inspections require helicopters, bucket trucks, or climbers. UAS can supplement or replace these methods in certain scenarios. Some utilities are using UAS for this application. Previous EPRI research has shown there is opportunity for efficiency gains of UAS over bucket trucks or climbing methods inspections. Additionally, EPRI research has shown that UAS can perform high quality inspections due to their small size, and ease of positioning around structures. EPRI expects that with new automation schemes and a relaxation of regulations, UAS will eventually become the preferred method of performing routine overhead asset inspections for utilities.
Transmission Vegetation Inspections
Utilities routinely perform inspections on transmission to reduce vegetation encroachment risks. Utilities use a mix of planes, helicopters, and ground patrols to perform visual inspections, LiDAR, and sometimes photogrammetry. UAS may be used to supplement or replace these methods in certain scenarios. However, for most of the traditional inspections, the costs are much lower than what can be achieved with a UAS primaily because of line-of-sight restrictions on UAS. EPRI expects UAS to replace most of these traditional methods when regulations allow for operations beyond visual line-of-sight.
Transmission Right-of-Way Patrols
Along with vegetation inspections, utilities sometimes also perform right-of-way patrols with fixed-wing airplanes. These inspections are different than the detailed inspections of the transmission structure and line. Instead, these patrols are fast “fly-bys” that look for large transmission risks. These include leaning structures, right-of-way erosion, shooting houses, etc. UAS can certainly capture the same type of data. However, the costs per mile for fixed-wing right-of-way patrols is very low for this use case. The utility industry expect that these inspections won’t be replaced with a UAS until beyond visual line-of-sight operations are allowed.
Transmission LiDAR Surveys
Utilities can use aerial LiDAR for a number of applications. Vegetation growth inspections is one, but transmission construction as-built engineering surveys is another. UAS LiDAR payloads are commercially available. Furthermore, some utilities are using UAS LiDAR surveys for small jobs. However, similar to the vegetation analysis, the inefficiencies of relocating several times due to line-of-sight requirements push the business case to favoring traditional aerial LiDAR surveying methods.
Technical Readiness (Commercial Availability)
There are two main areas for high-value automation: autonomous inspection and autonomous image processing. Autonomous inspection refers to the act of flying around a structure and capturing data. Automated image processing refers to automatically processing images to flag potential abnormal situations. Several vendors are developing automated flight and image processing systems. What is envisioned is a periodically self-deploying UAS, located in a sheltered charging station, that would fly a programmed (or self-guided) route around utility assets. Imagery collected by the UAS could be uploaded to a cloud service or processed locally. Machine learning would analyze the imagery, detect anomalies, and send alerts upon detection of these anomalies.
Using today’s technology, UAS are already capable of flying programmed routes, and while machine learning has been demonstrated to be effective at detecting anomalies in imagery. The effectiveness of combining these technologies for the specific purpose of utility asset inspections is itself an emerging use case.
One of the immediate challenges today involves FAA regulations against flying a drone beyond line of sight of an operator. Gradually, the FAA is loosening some of these restrictions and exceptions are being granted within specified conditions. Another challenge with the use case has to do with the ability to capture useful imagery [1]. Although seemingly straightforward, image capture is highly dependent on precise positioning of the UAS for the best view of an asset. Also, lighting, truncation, and obscuring of the asset of interest can be factors.
Anomaly detection in imagery is accomplished by first identifying asset classes in the image against a catalog of known asset classes. Once an asset class is identified within an image, the AI marks the asset with a bounding rectangle. The AI can then search within that bounding rectangle for defects associated with the class. EPRI has conducted research toward training AI models through capture of thousands of images, defining object recognition parameters for complex physical structures, and making the imagery publicly available for AI researchers [1].
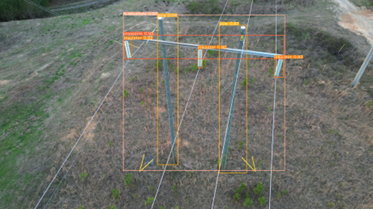
Figure credit [1]
The following list of manufacturers is the product of an Internet search using a general description of the technology as the search term. Sometimes more than one variation on the search term is used. The objective is to identify the most demonstration-ready products available in the category. Toward assessing demonstration readiness, the manufacturer websites typically provide useful information such as writeups of successful use cases or field demonstrations, number of deployments, or other indicators. Where lack of information exists online, further inquiry is made by phone. Generally, one to three frontrunners emerge as being most ready for a field demonstration. Preference is given to manufacturers who sell to the United States, or, if emerging technology, those who have participated in US-based field demonstrations.
Drone Docks
Skydio https://www.skydio.com/
DJI https://enterprise.dji.com/dock
Icaros https://icarosgeospatial.com/sams/
Hextronics
https://www.hextronics.tech/the-atlas
https://www.hextronics.tech/the-universal
Autel Robotics https://www.autelrobotics.com/productdetail/evo-nest/
Strix Drones https://www.strixdrones.com/
Airobotics https://www.airoboticsdrones.com/optimus/
AI Image Processing of Utility Assets
Brains4Drones https://brains4drones.com/docs/Gimbal-plus-product-sheet.pdf
Optelos https://optelos.com/power-utilities/
End-to-End Solutions
Percepto
https://percepto.co/drone-in-a-box/percepto-base/
Volatus https://volatusaerospace.com/aerieport-drone-nesting-station/
Implementations/Deployments
SDG&E is experimenting (2018) with the use of Unmanned Aircraft Systems (UAS) to perform periodic inspections of its distribution facilities to better ascertain system conditions. One expert cited an example of a UAS inspection performed in preparation of a Red Flag Warning. The aerial inspection involved 20 poles located in a canyon with extremely limited access and dense vegetation. The inspection took 3 hours to complete, as compared to a field crew estimate of two days to perform the same inspection by foot. The inspection revealed enough damaged equipment to lead to a decision to de-energize the line after load was transferred to other circuits. The local district immediately began work orders to fix the largest equipment concerns identified, included a leaning pole, cracked insulators and severely hollowed cross arms from wood rot. [2]
Duke Energy, in partnership with EPRI, is capturing imagery of their overhead assets and is actively looking for ways to leverage AI to make best use of this imagery across their service territories in six states [3]. Their goal is to convert processed automated imagery collections into work orders. They are looking a pre-planned routes in order to identify and collect the “right” imagery.
Innovations as of Mid 2023
Potential Enrichment Work Opportunity
References
[1] Artificial Intelligence for Transmission Images: An Object Detection Case Study. EPRI, Palo Alto, CA: 2023. 3002028093.
[2] Reliability and Resiliency Practices: Practices for Serving Critical Infrastructure and Events. EPRI, Palo Alto, CA: 2018. 3002012880.
[3] “Accelerating Transmission and Distribution (T&D) Inspections with Drones and Artificial Intelligence” EPRI, Palo Alto, CA: October 6, 2021. https://www.youtube.com/watch?v=ZXNrew5fieo
1.3 - Charred Pole Integrity
Risk Reduction Category
Technology Description
The degree of damage imposed on utility assets by a wildfire depends upon the temperature of the fire and duration of its presence. Particularly vulnerable to wildfires are wooden poles and crossarms. In 2022, testing of wooden cross arms by the Western Fire Center, Inc. determined that the wooden crossarms retained specified strength (300 pounds at each end of the crossarm) for at least twenty minutes under a combination of radiant heat and flames. For exposure to flames alone, the crossarms retained strength for at least 30 minutes. By comparison, fiberglass crossarms collapsed within around seven minutes.[2]
While crossarms and poles may survive a fire, structural damage may not be evident and the long-term effects unknown as well. What is important to know is the degree of damage that is caused so that a decision can be made whether to leave the asset in service, inspect it again after a time, or replace it.
The United States Department of Agriculture, the Forest Service, Forest Products Laboratory, the Bureau of Land Management (Idaho, Boise District), and university collaborators published a report describing two strategies that may expedite such inspections and identify poles that are structurally unsound due to decay and those damaged during a wildfire.[3] Yet, many of these test devices may indicate weakness at the tested location only—requiring a succession of test points to provide an accurate assessment of the health of the pole.
EPRI has published several reports concerning utility pole tests over the last ten to fifteen years examining various methods of testing power poles for rot and insect damage. One such report examined fifteen non- destructive testing (NDT) methods of examining power poles. [7] Several technologies are compared in an EPRI report: Evaluation of Pole Inspection Technologies. [11] These include traditional methods such as:
- Sounding – Decaying wood sounds different than healthy wood when struck with a hammer. Experienced field workers can generally hear the difference.
- Boring – Drilling into the pole allows an inspector to locate and judge the approximate size of internal voids in the pole cross section.
- Excavation – Digging around the pole base and removing the soil allows inspectors to visually inspect and sound a below-ground portion of the pole.
- Circumference measurements – Measuring the pole’s thickness allows the inspector to quantify exterior cross-section loss of the pole.
- Visual inspection of the pole exterior – Some defects such as bends, burns, and rot can be visually identified.
- Some poles were tested to destruction to measure their remaining pole strength
The above methods require significant skill (pole sounding might require experience with 5,000 poles).
More modern methods include:
- Resistance drilling – This method is similar to boring but measures the physical resistance (torque required) to drill into the pole as a proxy for wood health.
- Sonic and ultrasonic – This method uses sound waves to measure the pole vibrations. It’s similar to sounding but leverages machines to perform the listening.
- X-radiographic tools – This method uses X-rays to produce images that can be used to characterize internal portions of a pole cross section.
- Gamma-ray densiometry – This method uses gamma rays to identify degraded areas in wood poles.
- Vibration analysis – This method is based on the understanding that the vibrational characteristics of a pole depend on its material properties, including the health, i.e., strength and stiffness, of the wood.
The above tend to be complex to use, costly, and lacking in field trials.
The EPRI report used several of the above traditional and more modern NDT methods—but not always on the same pole. An excerpt from the report shows a comparison of results (12 of 42) for the Resistograph, the Vonaq, and the traditional hammer test (not Thor) where they were tested on the same pole. The percent remaining strength was from destructive testing on the poles afterward.
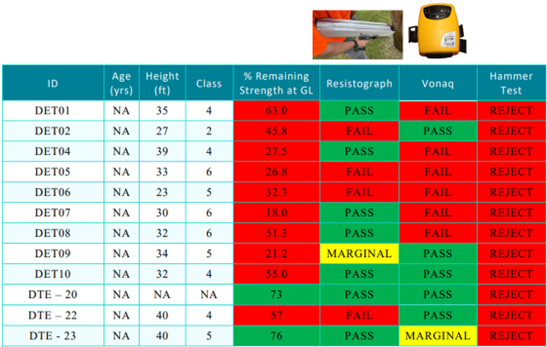
Testing overall observed that the conservative and traditional sonic test tended to reject poles that might still be functional. The Resistograph identified decay at the groundline (where it was employed) but could not identify weakness further up the pole (such as charring); thus, a high number of false positives resulted. Of the poles tested by the Vonaq, roughly one third were “passed” where they might have been marginal or rejected—possibly due to close-by vegetation and/or truss-work above the groundline.
While many hours of training were required for the traditional methods, the two newer methods above required only a few hours of training and hands-on experience.
Of the above modern methods, the sonic methods may be most applicable to charred poles if only due to the likely change in cross-sectional area over the length of the pole which would affect pole strength and could be assessed using the Vonaq or Thor Pole tester. However, an electronic reference history of poles and corresponding sonic tests may be necessary to have an accurate assessment of the pole-strength degradation due to the wildfire.
Technical Readiness (Commercial Availability)
Professor Bruce Allison, working closely with the University of Wisconsin and the USDA Forest Products Laboratory and the University of Wisconsin, developed a stress-wave tool called Tree Check.[4] While initially intended for trees, this method can work for utility poles.
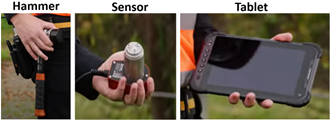
Another method involves using a small drill to assess the resistance of the wood to the drilling process. This resistance is much less for decayed wood than for uncompromised wood.[3] One version of this tool is shown below.
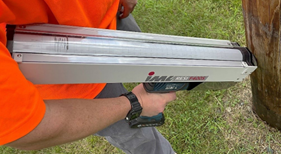
The same company producing the drill tool above also produces the IML Micro Hammer which measures the sound velocity in wood in response to hammer taps as illustrated below.
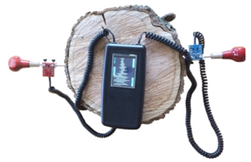
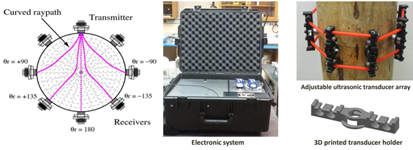
Another method developed for use with utility poles specifically involves using ultrasound. In 2009, Fernando Talavo wrote a thesis on using ultrasound to assess the structural integrity of utility poles [5] and went on to develop a tool for use in the field.[6] An ultrasound transmitter along with multiple receivers are used to assess the internal structure of the pole as shown below.
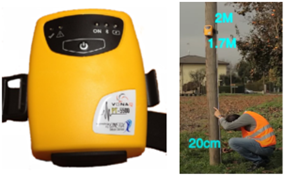
One apparently efficient development for utility pole testing might be the CXI PT5500 Pole Tester developed by Oxys Solutions (a Cinetix Group company). A probe is mounted on the pole at a measured height of 2 meters from the ground (for a charred pole, it may be necessary to scrape off a charred patch to get to uncharred wood at the 2-meter level). The person doing the test strikes the pole with a hammer. The probe analyzes the induced vibrations.
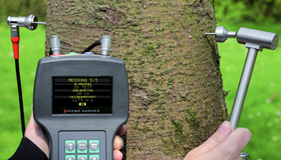
Another sonic method is the THOR Pole Tester by Groundline Engineering. This is a handheld device set—the specially designed hammer and sensor, and a tablet as shown below. One hand holds the sensor against the pole just above ground level while the hammer is struck on the opposite side of the pole (again, charred wood may have to be removed to expose solid wood). The tablet has the software that registers the sonic vibrations picked up by the sensor and may interact with the human tester to correct the sensor angle with the pole and/or the force of the hammer blow. Related software organizes all pole data with GIS coordinates which may be laid out on a map. [10] The charred wood on such a pole may have dampening effects. Many such tests (from the same pole tested previously or from a known good pole) may be required to gauge the results more accurately.
The following list of manufacturers is the product of an Internet search using a general description of the technology as the search term. Sometimes more than one variation on the search term is used. The objective is to identify the most demonstration-ready products available in the category. Toward assessing demonstration readiness, the manufacturer websites typically provide useful information such as writeups of successful use cases or field demonstrations, number of deployments, or other indicators. Where lack of information exists online, further inquiry is made by phone. Generally, one to three frontrunners emerge as being most ready for a field demonstration. Preference is given to manufacturers who sell to the United States, or, if emerging technology, those who have participated in US-based field demonstrations.
American Arborist – Tree Check
https://www.arborist.com/product/M130001-00/Tree-Check-Sonic-Wave-Decay-Detector.html
IML-RESI F-Series
https://www.iml-service.com/product/iml-resi-f-serie/
IML Microhammer
https://www.iml-service.com/product/iml-micro-hammer/
Vonaq Ltd - CXI PT5500 Pole Tester
https://www.etesters.com/catalog/ADBB546E-1422-08DF-AAC7-09285A92D511/vonaq-ltd/
THOR Pole Tester
Innovations as of Mid 2023
Potential Enrichment Work Opportunity
References
[1] https://woodpoles.org/Issues/Fire-Protection
[2] https://woodpoles.org/portals/2/documents/WFC_Crossarm_Test_Report.pdf
[3] https://www.fs.usda.gov/features/reducing-wildfires-through-better-utility-pole-inspections
[4] https://www.wxpr.org/natural-resources/2017-11-14/sound-waves-what-trees-can-tell-us
[5]https://uwspace.uwaterloo.ca/bitstream/handle/10012/4588/FT-Thesis.pdf;jsessionid=F9B80D282A954DA266F4504979E05144?sequence=1
[6] https://www.ndt.net/events/NDTCanada2016/app/content/Slides/12_Rodriguez-Roblero_Rev1.pdf
[7] A Review of Technologies for Detecting Decay or Insect Attack and Estimating Residual Wood Pole Properties. EPRI, Palo Alto, CA: 2020. 3002019302.
[8] https://www.youtube.com/watch?v=YQDaB_6bn3I
[9] https://www.etesters.com/catalog/ADBB546E-1422-08DF-AAC7-09285A92D511/vonaq-ltd/
[10] https://www.thorpoletest.com/
[11] Evaluation of Pole Inspection Technologies: 2023 Update. EPRI, Palo Alto, CA: 2023. 3002026858.
1.4 - Line Sensing Technology
Risk Reduction Category
Technology Description
Gridware is a tech startup out of California, having designed a unique, multi-detection monitoring tool for overhead lines that does not fit into any single functional category. The Gridscope is designed for mechanical and electrical anomaly detection, fault detection, fault location, and automatic categorization of the condition. For example, it can distinguish between vegetation and animal contact, as well as line breaks, pole tilt, insulator failure, conductor clash, and a variety of other conditions. Because of its fault locating capability and deployment density, crews are directed to the precise location of the issue, without scouting the line, and can arrive with the equipment and materials needed to address the specific issue.
The hardware is typically installed on every other pole, each unit having multiple monitoring variables such as vibration, spatial orientation, and electric field sensing. It is a completely wireless sensing unit in that it has no externally connected probes or taps. Additionally, it is powered from solar energy and communicates wirelessly in a mesh configuration and outbound to the Internet using cellular communications.
Monitoring of the hardware is currently provided as a service, where the vendor alerts subscribing utilities of detected conditions via telephone. Communication by telephone is viewed by the vendor as an air gap that avoids complications with IT and cyber security. Similarly, the inter-communicating hardware on the poles avoids these same issues by communicating independently of SCADA.
Technical Readiness (Commercial Availability)
Gridware https://www.gridware.io
The Gridware system is in commercial production with utilities in 6 states having deployed them: Washington, California, Utah, Colorado, New York, and Georgia.
Implementations/Deployments
ConEdison and EPRI participated in a pilot project with Gridware in 2023 [1]. In this pilot, ConEdison installed 100 sensors in storm-prone areas. During the demonstration period, they received 3 alerts which were verified by ConEdison as accurate with no false or inaccurate alerts.
EPRI Testing
EPRI conducted a series of blind tests involving several field applied scenarios shown below. The Gridscope device and software was able to accurately determine the event type and time for each test including whether the line was still energized on the ground or not. Several of the live test did not draw enough fault current to trip the 40T fuse nor the hotline tag enabled U4 curve of the upstream recloser.
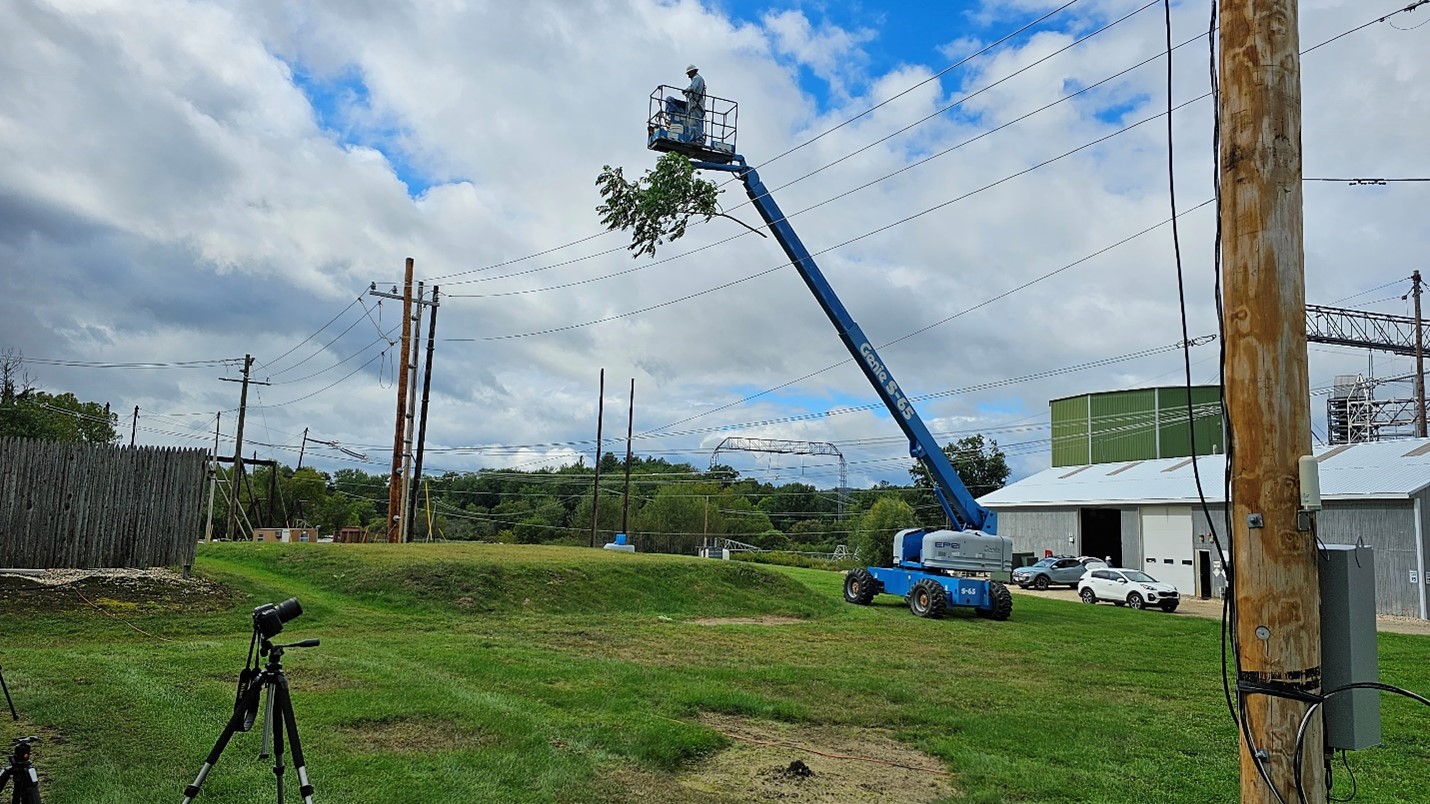
Vegetation drop on de-energized three phase line
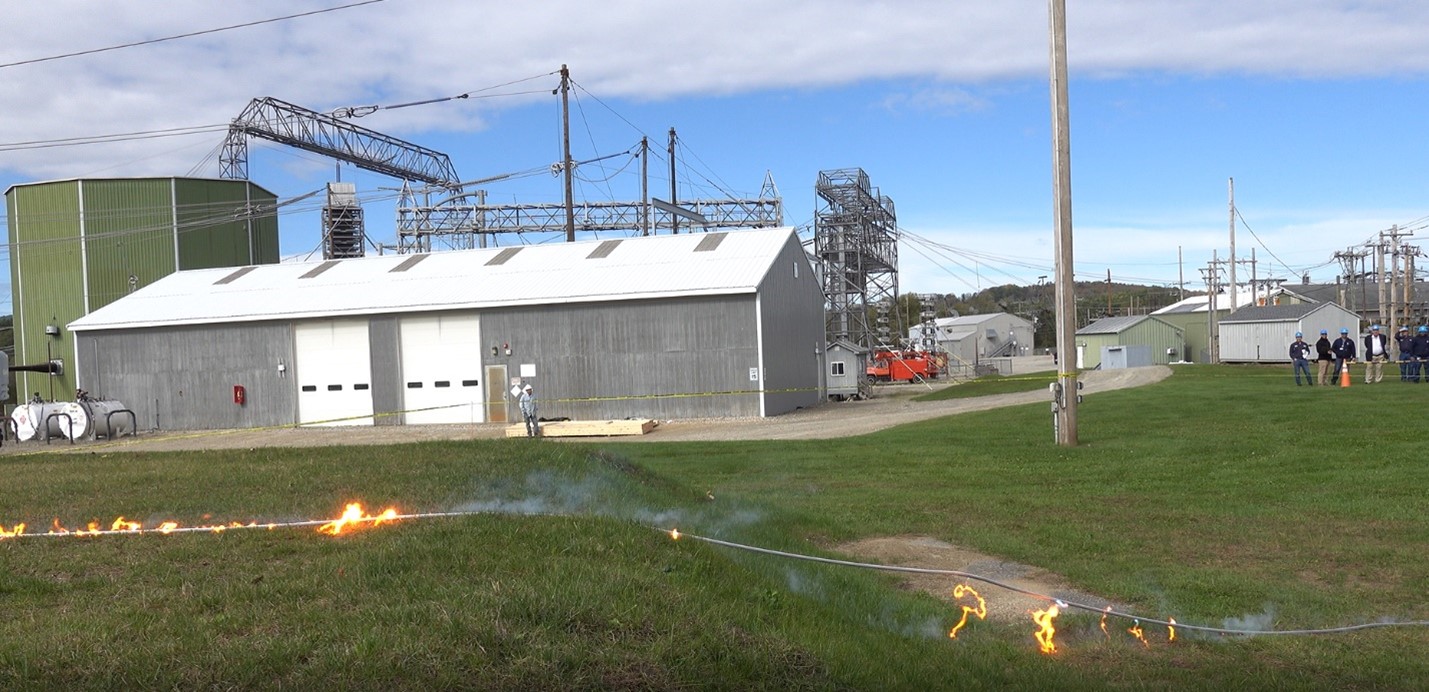
Energized 13.2/23 kV bare conductor break onto grass
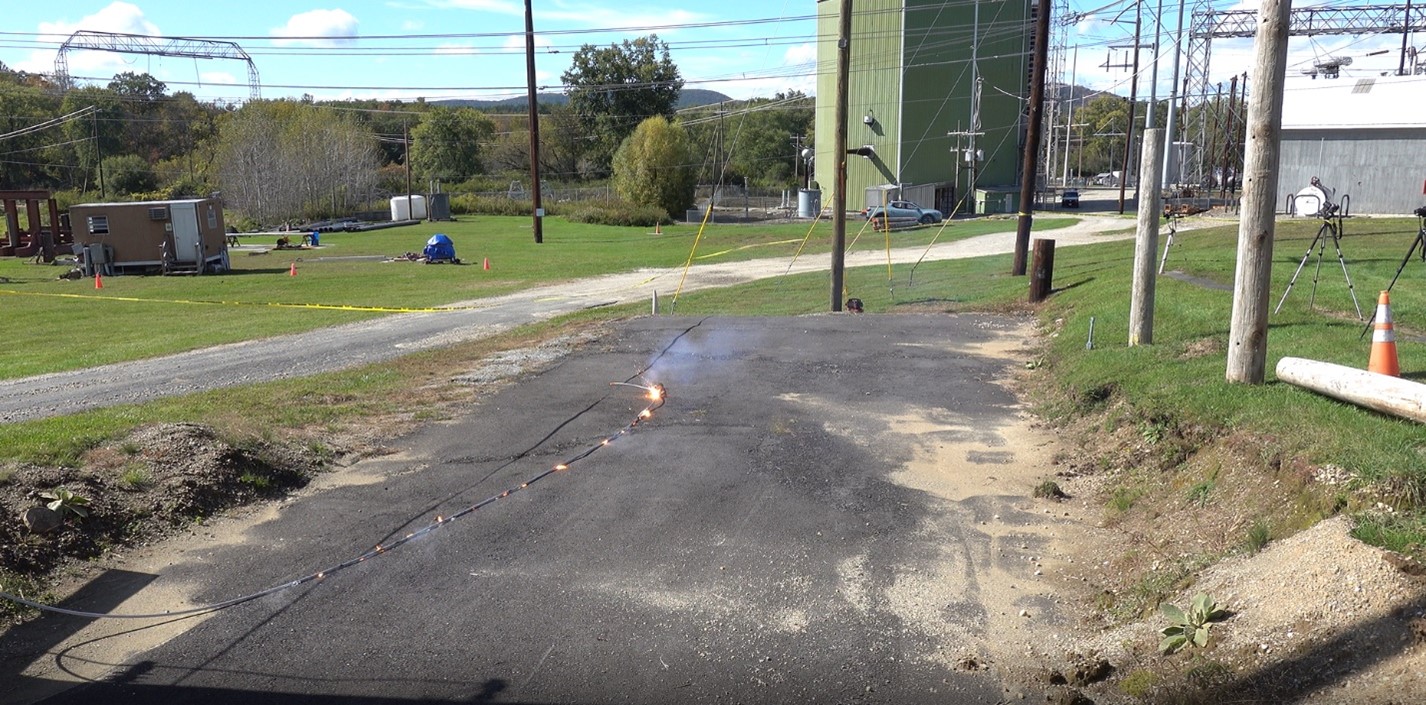
Energized 13.2/23 kV & 7.2/12.47 kV bare conductor breaks into asphalt.
Innovations as of Mid 2023
Potential Enrichment Work Opportunity
Having the solar power and the communications at every pole or every other pole, an opportunity exists to add environmental sensing such as wind speed, humidity, and the like, in order to feed models for fire risk and spread.
References
1.5 - Line Splice Sensing
Risk Reduction Category
Technology Description
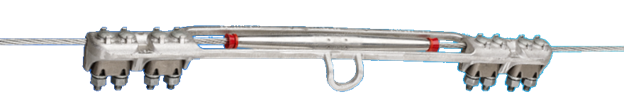
Line splices are ubiquitous, and while generally robust, sometimes, these splices may not have been constructed optimally such that the splice is weakened and/or may have greater impedance than specification. Thus, it may fail due to mechanical stress or the result of excess heating. One source indicated that many splice failures occur due to poor workmanship and/or due to corrosion after improperly applying a corrosion inhibitor. Should the splice physically fail, the broken conductor ends may fall upon dry, combustible vegetation and ignite a fire.
Inspection of electrical lines should occur with some regularity to identify weakened or overheated splices. A few tools that are commonly used today are described briefly:
- A micro-ohmmeter mounted to a hotstick can measure resistance across a splice while energized and inservice. [2]. Elevated resistance may indicate a failing splice.
- Infrared (IR) sensing may be used to detect heating of the splice. However, due to the reflective metallic surface (low emissivity) of many splices, infrared measurements can yield inaccurate results and therefore elevated surface temperatures may only be confirmed when the splice is close to failure.
- Thermal imaging cameras may be used to identify hotspots on the power line, on splices, or on other power line equipment, but are subject to the same emissivity concerns as infrared spot sensing.
- One company markets a device to mitigate faulty splices called the ClampStar, an electrical/mechanical shunt, that serves to brace and effectively bypass the weakened splice with no interruption of power as shown below [4].
Oak Ridge National Lab (ORNL) has developed an innovative sensor system using “smart” patches affixed to the exterior of a compression connector. The motivation for this development is to provide information about the structural integrity of the connector, where current inspection methods only warn of electrical impedance that is out of specification. In the ORNL work, a piezoelectric ceramic material (PZT) is integrated with the splice. This smart patch produces an electrical signal, that when processed, corresponds to a damage index. Laboratory tests included tensile strength and thermal cycling perturbations on the joint. The electrical signature is sensitive to variations in structural conditions so that utilities can correlate this analysis to the structural health of a connector, providing potential application in routine structural health monitoring. [5].
Technical Readiness (Commercial Availability)
The smart patch is a research and development effort by Oak Ridge National Laboratory. To the author’s knowledge, there has been no commercialization. This technology is subject to a US patent: J.-A. Wang, F. Ren, “Systems, methods and patches for monitoring a structural health of a connector in overhead transmission lines”, U.S. Patent, US 10,641,840 B2, May 5, 2020. [6].
Regarding tools that are commonly used by utilities today, the following list of manufacturers is the product of an Internet search using a general description of the technology as the search term. Sometimes more than one variation on the search term is used. The objective is to identify the most demonstration-ready products available in the category. Toward assessing demonstration readiness, the manufacturer websites typically provide useful information such as writeups of successful use cases or field demonstrations, number of deployments, or other indicators. Where lack of information exists online, further inquiry is made by phone. Generally, one to three frontrunners emerge as being most ready for a field demonstration. Preference is given to manufacturers who sell to the United States, or, if emerging technology, those who have participated in US-based field demonstrations.
Sensorlink – Ohmstik Plus
https://sensorlink.com/products/ohmstik
Teledyne FLIR (thermal imaging)
https://www.flir.com/instruments/utilities/electric-power-distribution/
HIKMICRO
https://www.hikmicrotech.com/en_us/
Fluke
https://www.fluke.com/en-us/products/thermal-cameras/product-selector
Implementations/Deployments
Innovations as of Mid 2023
Potential Enrichment Work Opportunity
References
[1] https://classicconnectors.com/downloads/understanding_automatic_splices.pdf
[2] https://classicconnectors.com/do-you-know-the-condition-of-your-splices/
[3] https://linestar.ca/specialty-items/clampstar-connector-corrector/clamp-star-flexible-frame/
[4] https://classicconnectors.com/products/
[5] Structural health monitoring of compression connectors for overhead transmission lines (spiedigitallibrary.org)
[6] DOE OE Wildfire Webinar Series - Sensing & Detection | Fire Testing Capabilities - YouTube
1.6 - Asset Inspections by Multispectral Imagery
Risk Reduction Category
Technology Description
Today, utilities commonly use imagery from unmanned aerial systems (UAS) to improve their vantage point when inspecting overhead assets. Depending on terrain and access, an aerial inspection can be done faster versus visual inspections on foot, even with current line-of-sight restrictions for drone operation. Additionally, aerial imagery provides a beneficial visual perspective for inspections of overhead assets.
The sheer physical size of the transmission and distribution infrastructure makes inspecting those assets challenging. Utilities usually use a combination of ground-based patrols and manned aircraft flights for routine and emergency response inspections. These traditional approaches are costly, time consuming, and require human involvement.
Multispectral cameras can extend the information gathered during aerial inspections, capturing information that is otherwise indetectable with standard visual (RGB) cameras. Most multi-spectral cameras capture RGB imagery along with imagery in the infrared and ultraviolet wavelengths. The extended bands can be captured at the same frame rates and resolutions as their visual counterparts, providing layers of imagery that can be analyzed by humans or AI.
- Visual (RGB) – captures bands detectable with the human eye (red, blue, and green)
- Infrared (IR)– detects heat signatures
- Ultraviolet (UV)– can reveal arcing, partial discharge, and flame
The addition of the IR band to traditional visual inspections increases the use cases to include: [1]
- Detecting issues with underground electrical distribution [2]
- Detecting water leakage from underground piping systems [4]
- Detecting methane emissions from natural gas infrastructure [3]
- Detecting evidence of corrosion from re-bar and cracking due ASR in containment structures
- Using TIR/NIR sensors to conduct nesting bird surveys and bat emergence counts
The addition of the UV band to traditional visual inspections increases the use cases to include: [1]
- Helping determine locations of power line corona discharge [3]
- Improving personnel safety by eliminating the need to access elevated locations.
- Reducing operating costs by identifying faults more quickly, which reduces time to inspect equipment.
Hyperspectral cameras operate in the same energy spectrum as multispectral cameras, but with many narrower bands. Hyperspectral cameras are not typically used today for aerial inspections because of cost and complexity, but the extra capability expands use cases, including: [1]
- Identifying deteriorating wood pole top conditions due to moisture ingress
- Detecting biological growth around plant coolant intakes and discharge areas
- Detecting evidence of corrosion from re-bar and cracking due to alkali-silica reaction (ASR) in containment structures
What is envisioned is a periodically self-deploying UAS, located in a sheltered charging station, that would fly a programmed (or self-guided) route around utility assets. Imagery collected by the UAS could be uploaded to a cloud service or processed locally. Machine learning would analyze the imagery, detect anomalies, and send alerts upon detection of these anomalies.
Technical Readiness (Commercial Availability)
Aerial inspections of utility asset via multispectral camera technology is a complex combination of state-of- the-art technologies:
- Automated UAS flight - As of 2023, most UAS deployed by utilities are manually operated, however, as technology improves automation is increasingly possible. A challenge with automated aerial asset inspections has to do with the ability to capture useful imagery [1]. Although seemingly straightforward, image capture is highly dependent on precise positioning of the UAS for the best view of an asset. Also, lighting, truncation, and obscuring of the asset of interest can be factors. This challenge is being addressed by improvements in navigation technology. For example UAS are now capable of identifying poles in flight and moving in a prescribed path around each pole in order to better capture visual attributes of the asset. Another of the immediate challenges today involves FAA regulations against flying a drone beyond line of sight of an operator. Gradually, the FAA is loosening some of these restrictions and waivers are being granted within specified conditions.
- Camera technology - As of 2023, multispectral cameras are suitable for drone mounting, having portability and capability to capture images from a moving camera at focal distances of a few meters. With today’s technology, imagery can be stored on the machine itself or transmitted wirelessly during capture.
- Data processing and anomaly detection – As of 2023, with sufficient training data, machine learning has been demonstrated to be effective at detecting anomalies in imagery.
- Use case: Asset Inspections by Multispectral Imagery – Combining technologies into an asset inspection use case is the next step. More needs to be known about the efficacy of the data gathered, the ability to retrieve actionable information, number of false positives and missed positives, and costs of the effort.
The following list of manufacturers is the product of an Internet search using a general description of the technology as the search term. Sometimes more than one variation on the search term is used. The objective is to identify the most demonstration-ready products available in the category. Toward assessing demonstration readiness, the manufacturer websites typically provide useful information such as writeups of successful use cases or field demonstrations, number of deployments, or other indicators. Where lack of information exists online, further inquiry is made by phone. Generally, one to three frontrunners emerge as being most ready for a field demonstration. Preference is given to manufacturers who sell to the United States, or, if emerging technology, those who have participated in US-based field demonstrations.
Implementations/Deployments
While the technologies involved in carrying out the use case are commonly used today, combining them effectively into an asset inspection use case is the next step. More needs to be known about the efficacy of the data gathered, the ability to retrieve actionable information, number of false positives and missed positives, and costs of the effort.
Innovations as of Mid 2023
.
Potential Enrichment Work Opportunity
References
[1] UNMANNED AIRCRAFT SYSTEMS (UAS): Advanced Payloads. EPRI, Palo Alto, CA: 2018. 3002015063.
[2] Weisenfeld, Neil et al. “Infrared Scanning Reveals Defects.” Tdworld.com. https://www.tdworld.com/underground- tampd/infrared-scanning-reveals-defects. (Accessed September 2018).
[3] Rebecca DelPapa Moreira Scafutto et al. “Evaluation of thermal infrared hyperspectral imagery for the detection of onshore methane plumes: Significance for hydrocarbon exploration and monitoring.” International Journal of Applied Earth Observation and Geoinformation 64 (2018) 311-325. https://www.sciencedirect.com/science/article/pii/S0303243417301411. (Accessed September 2018).
[4] Santovasi, Steve and Evans, Laron. “UAS Technology Offers Soaring Potential.” Burnsmcd.com.https://www.burnsmcd.com/insightsnews/tech/uas-technology-offers-soaring-potential. (Accessed September 2018).
2 - Environmental Monitoring
2.1 - Gas-Sensing Remote Smoke Detectors
Risk Reduction Category

Technology Description
Remote smoke sensors are based on similar proven technology as smoke detectors for the home but are specifically suited for forest application. Modern solid-state sensors are capable of detecting a wide range of Volatile Organic Compounds (VOCs) and gases [1], having many potential applications such as measuring air quality or detecting the presence and/or concentration of specific gases. Early wildfire warning is one potential application for these sensors, where the sensor output is monitored and interpreted by supporting electronics that will then send a positive detection message if the sensor output meets any of the defined profiles of smoke.
Technical challenges for use in the forest are twofold: lack of availability of a power source, and lack of an existing communications network. Further, the remotely installed equipment must be able withstand harsh outdoor environments.
Fortunately, the sensors and supporting electronics require very little power, allowing operation from a small solar panel and/or battery. Pioneers in remote smoke detection have overcome the communications obstacle by using a low bandwidth LoRaWAN mesh network. With sensors sending messages to local gateways, status information for the entire covered area is sent to a border gateway that connects to the Internet.
Technical Readiness (Commercial Availability)
The electronic sensors themselves are proven technology, however, the adaptation of that technology for detecting a smoldering fire in a rural forest is a relatively new concept. The following list of manufacturers is the product of an Internet search using a general description of the technology as the search term. Sometimes more than one variation on the search term is used. The objective is to identify the most demonstration-ready products available in the category. Toward assessing demonstration readiness, the manufacturer websites typically provide useful information such as writeups of successful use cases or field demonstrations, number of deployments, or other indicators. Where lack of information exists online, further inquiry is made by phone. Generally, one to three frontrunners emerge as being most ready for a field demonstration. Preference is given to manufacturers who sell to the United States, or, if emerging technology, those who have participated in US-based field demonstrations.
Implementations / Deployments
Dryad
- Launched in December 2022 [2].
- Fully commercialized and ready to scale [2].
- 50+ Proof-of-concept and pilot installations, each involving 20-400 sensors [2].
- Shipped 10,000 sensors worldwide [2].
- Deployments with CalFIRE (400 sensors) and PG&E [2].
- 40 worldwide resellers [2].
Torch
- Completed a number of short and longer-term tests at prescribed burning locations in California: mainly in Sonoma, Napa Valley, and Butte counties.
- Continuing to perform a wide range of testing on various burns and geographies to maximize accuracy.
- Now accepting pre-orders with availability in 2024.
Milesight
- No published materials found regarding field studies or pilot programs related to wildfire application of this product.
Libelium
- Website mentions 11 nodes deployed in a wildfire setting, but no outcome reported
- No published materials found regarding field studies or pilot programs related to wildfire application of this product.
Innovations as of Mid 2023
Potential Enrichment Work Opportunity
References
[1] Bosch Corporation. “BME860 Lower Power Gas, Pressure, Temperature & Humidity Sensor.” Document Number: BST-BME680-DS001-08 Revision_1.8_082022.
[2] Brinkschulte, Carsten. “Re: Dryad Catch Up call” Received by Doni Nastasi, 2 Nov. 2023.
2.1.1 - Dryad
Designed to detect smoke in the smoldering stage, Dryad sensors are built in the form of a hanging tag and mount directly to the trunk of a tree. They detect hydrogen, carbon monoxide, and other gases. In addition, they measure temperature, humidity and barometric pressure. They are powered by an integrated solar panel with supercapacitor storage. Multiple units communicate to a gateway using LoRaWAN for low bandwidth long-range communications. Multiple local gateways connect over a mesh network and to Internet through a gateway.
2.1.2 - Torch
Torch sensors detects smoke via camera (visible), infrared (thermal), and air chemical (smoke) detection. They are powered by an integrated solar panel and rechargeable battery, lasting up to 5 days without solar recharge. They communicate over a mesh network with hundreds of units communicating through one Internet connection. Coverage is one tree-mounted unit per ten acres according to the website.
2.1.3 - Milesight
Model EM500-CO2 is a multi-application indoor/outdoor device. It measures CO2, temperature, humidity, and barometric pressure. It operates from a non-rechargeable battery for up to 10 years. It communicates over a LoRaWAN to a gateway where it connects to the Internet. The update rate is between 2 minutes and 30 minutes.
2.1.4 - Libelium
Libelium manufactures an array of environmental sensing products and communication gateways. Wildfire detection is one of the possible use cases for their sensor and cloud platform. Their outdoor sensors are powered from solar panels and rechargeable batteries. Their communication technology includes LoRaWAN, Bluetooth, Wi-Fi, 868 MHz radio and others.
2.1.5 - Hayden Data Systems
Multi-awareness sensors on a mesh network and paired with custom awareness software platform.
2.2 - LiDAR - Light Detection and Ranging
Risk Reduction Category
Computer vision and situational awareness
Technology Description
LiDAR is data collection technology by which pulsed laser light is used to measure distances to surrounding objects. This data can be used to create visual maps or images of an area in which a LiDAR sensor has passed though. This data can be used to create three dimensional images with very precise detail. There are some limitations to data collection with regards to surfaces that diffract the laser pulses from returning to the LiDAR sensor; examples are water or wet asphalt.
LiDAR technology has been around for several years and has been used in many different applications. Some examples of applications are in automobiles for their autonomous driving ability, robotic platforms for autonomous navigation, and even in airport baggage handling conveyors tracking luggage. The data can be used to create 3D images of a wide area. Because the system uses a laser for measurement of the distance to nearby objects, the data can very accurately represent the dimensions of objects. Many models and manufacturers of LiDAR sensors are now commercially available, some purpose-built for specific applications, most of which are mobile mapping applications. The technology ranges from small and inexpensive enough to be used in hobby projects, to commercial and industrial grades producing higher resolution output at greater distances.

The LiDAR sensor produces what is known as a “point cloud” of data. Processing the point cloud into a visual rendering is a fairly intensive computing process. This is an area that is continually growing and improving. Further, any use-case-specific analysis such as those involving distance tolerances, is applied during post processing. For example, in the LiDAR image (right side of above image), objects are colored yellow or red to indicate encroachment in the utility right of way beyond specified limits.
Use Case Description
The advances in this technology when paired with a Unmanned Aerial System (UAS) allows it to be used to locate encroachment of vegetation near Utility Right of Ways and Infrastructure. It can also be used to identify dead trees that are near power lines, especially those that are already in the process of leaning towards power lines. Data files from LiDAR surveys can be saved and referenced against future surveys to determine the growth of vegetation for maintenance scheduling purposes. Surveys post-storm events can be used to help with tasking for problem areas to maximize restoration crews’ time.
EPRI recently conducted a project where a LiDAR sensor was mounted to a UAS as part of a demonstration project. The focus of this project looked at the use of a UAS mounted LiDAR system to help survey vegetation along a power line right of way. The project focused on the accuracy of the sensor data collected against a reference image.[2]
Some researchers are already looking at using the scanning properties of LiDAR to help establish algorithms by which LiDAR scans can be used to help locate smoke plumes as part of early warning of fires.[3]
Another group of researchers is compiling data sets of forest canopy to help identify areas of potential vulnerability.[4] More efficient data collections yield more frequent and up-to-date information that can be used in conjunction with fire risk modeling.
VeriDaaS has worked on an enhanced LiDAR detection system that allows LiDAR to better detect under canopy levels of foliage.[5] This technology detects potential fuel on the ground, improving situational awareness and prioritizing areas of highest risk for fire ignition and spread.
Technical Readiness (Commercial Availability)
LiDAR sensor technology was developed in the early 1960’s. It first uses were for mapping of the surface of the moon during NASA’s moon explorations and then to study weather phenomena such as clouds, smog, and pollen. This is a very mature technology that continues to improve with increases in semiconductor technology and software development for post processing of data for visualization.
The following list of manufacturers is the product of an Internet search using a general description of the technology as the search term. Sometimes more than one variation on the search term is used. The objective is to identify the most demonstration-ready products available in the category. Toward assessing demonstration readiness, the manufacturer websites typically provide useful information such as writeups of successful use cases or field demonstrations, number of deployments, or other indicators. Where lack of information exists online, further inquiry is made by phone. Generally, one to three frontrunners emerge as being most ready for a field demonstration. Preference is given to manufacturers who sell to the United States, or, if emerging technology, those who have participated in US-based field demonstrations.
LiDAR USA
Unmanned Systems Technology
https://www.unmannedsystemstechnology.com/expo/drone-lidar/
Phoenix LiDAR Systems
Microdrones
https://www.microdrones.com/en/
Implementations / Deployments
Innovations as of Mid 2023
Potential Enrichment Work Opportunity
References
[1] https://www.fabbaloo.com/news/can-apples-lidar-system-be-used-for-3d-scanning
[2] 3002016591_Unmanned Aircraft System Based LiDAR versus Photogrammetry A Critical Comparison for Vegetation, 2019, Electric Power Research Institute
[3] https://www.firelab.org/resource/lidar
[4] https://www.mdpi.com/2072-4292/12/6/1000
[5] https://veridaas.com/2022/08/remotely-sensed-lidar-data-supports-wildfire-management/
2.3 - Micro Weather Stations
Risk Reduction Category
Technology Description
Conditions on the ground before a wildfire event—wind direction, speed, temperature, humidity—can provide clues about the conditions leading to development of the wildfire, conditions that may help predict the likelihood of a fire developing in a particular area so that preventive measures may occur. Likewise, monitored ground conditions can help in controlling prescribed burns intended to pre-empt wildfires.
Remote, local ground conditions may be communicated through the placement of “micro” weather stations within areas prone to wildfires as well as in nearby residential areas needing protection from those wildfires. Various sensors are available to measure air and/or water temperatures, humidity, soil temperatures, soil dampness, leaf wetness, perhaps several at once. Some of these stations and sensors may be somewhat expensive. One IEEE publication described a model developed by yet another reference—using soil moisture and temperature data obtained through remote sensing—for predicting the extent of wildfires.[6] [7]
One company, Onset, supplies dataloggers, and field sensors it has developed for such purposes. Historically, it developed relatively inexpensive, battery-operated devices—such as the HOBO. The HOBO® Weather Station may be set to collect readings on the hour or half-hour for weather parameters. The collected fire weather data may be used as inputs to fire modeling software such as FSpro (a predictive model that looks at the probability of the spread of fire). [1]
Intellisense Systems developed its Fire Weather Observation System (FWOS)—weighing 5 pounds and quickly deployable in sixty seconds or less. Fire weather-related data, including solar radiation, fuel moisture, particulate monitoring, and thermal imaging data may be transmitted wirelessly through cell-phone coverage or via satellite. They also provide software, Quantimet®, for handling the data. [2]
Advanced Engine Management (AEM), an organization producing monitoring systems for a wide variety of potentially disastrous situations (dam safety, flood risk, severe weather risk, etc.) owns Forest Technology Systems (FTS) which focuses on wildfire risks (monitoring and detection). Services and products include remote, automated weather stations (RAWS), wildfire PTZ cameras, quick deploy RAWS, and software integrating all sensors—the FTS360. A one-hour webinar (free) details their system and its use. [5]
Technical Readiness (Commercial Availability)
The following list of manufacturers is the product of an Internet search using a general description of the technology as the search term. Sometimes more than one variation on the search term is used. The objective is to identify the most demonstration-ready products available in the category. Toward assessing demonstration readiness, the manufacturer websites typically provide useful information such as writeups of successful use cases or field demonstrations, number of deployments, or other indicators. Where lack of information exists online, further inquiry is made by phone. Generally, one to three frontrunners emerge as being most ready for a field demonstration. Preference is given to manufacturers who sell to the United States, or, if emerging technology, those who have participated in US-based field demonstrations.
Advanced Engine Management/ Forest Technology Systems AEM/FTS
Implementations / Deployments
Southern California Edison (SCE) has an interactive Weather and Fire Detection Map system indicating areas under fire weather watch, red flag warning, wind advisory, high wind watch, and high wind warning. Such areas are indicated on an accompanying map. Power safety power shutoff (PSPS) action information is also provided. They may have helpful information concerning the sensors used in their system.[3] The map is powered by software from Environmental Systems Research Institute, Inc. (Esri) [4]
Innovations as of Mid 2023
Potential Enrichment Work Opportunity
References
[1] https://www.onsetcomp.com/resources/application-stories/weather-station-aids-wildfire-management
[2]https://www.intellisenseinc.com/news-events/news/fire-weather-observation-system-from-intellisense-helps-combat-wildfires-in-yosemite-national-park/
[3] https://www.sce.com/wildfire/situational-awareness
[4] https://www.esri.com/en-us/home
[5] https://aem.eco/solution/wildfire-risk-management/
[6] Three Lines of Defense for Wildfire Risk Management in Electric Power Grids: A Review, Ali Arab, et al., IEEEAccess, 4/28/2021.
[7] D. Chaparro, M. Vall-llossera, M. Piles, A. Camps, C. Rüdiger, and R. Riera-Tatche, ‘‘Predicting the extent of wildfires using remotely sensed soil moisture and temperature trends,’’ IEEE J. Sel. Topics Appl. Earth Observ. Remote Sens., vol. 9, no. 6, pp. 2818–2829, Jun. 2016.
2.4 - Vegetation Condition Assesssment by Multispectral Imagery
Risk Reduction Category
Technology Description
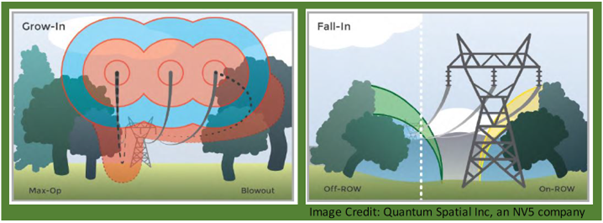
Vegetation threat analysis refers to identifying vegetation that may encroach upon powerlines, transformers, and support structures. Depending on line voltage, elevation, and local concerns, vegetation clearance requirements may range from as little as 1 foot (0.3 m) for a low-voltage conductor to 13 feet (3.0 m) for a high-voltage line at high elevation [7]. Vegetation should be considered when it grows towards utility assets (e.g. grow-in threat), and when the vegetation extends above assets and could fall on a conductor or other component (e.g. fall-in threat).[6] Trees stressed by drought leads to additional risk of premature falling into power lines. Additionally, areas impacted by drought may have increased amounts of dry biomass ‘fuel’ underneath the tree canopy.
Utility rights of way are often inspected manually. Even with the aid of helicopter or fixed wing aircraft, any imagery that is collected during the inspection is analyzed post-flight by humans. Further, utilities routinely dispatch arborists to manually inspect trees on a watch list or to place additional trees on the watch list – a time consuming and costly exercise.
Because utility Vegetation Management (VM) programs are one of the largest recurring maintenance expenses for electric utility companies in North America [5], it is important to identify ways of reducing these costs. Technology improvements including automated UAS, multispectral imagery, and image processing offer new opportunities for utilities to improve the efficiency and accuracy of their vegetation inspections. Multispectral cameras can extend the information gathered during aerial inspections, capturing information that is otherwise indetectable with standard visual (RGB) cameras. Most multi-spectral cameras capture RGB imagery along with imagery in both the infrared and ultraviolet wavelengths. The extended bands can be captured at the same frame rates and resolutions as their visual counterparts, providing layers of imagery that can be analyzed by humans or AI.
- Visual (RGB) – captures bands detectable with the human eye (red, blue, and green)
- Infrared (IR)– detects heat signatures. This band is ideally suited for vegetation condition because chlorophyll, an indicator of healthy vegetation, reflects in the IR band.
- Ultraviolet (UV)– can reveal arcing, partial discharge, and flame. While perhaps not the primary focus for vegetation inspection, this band can detect arcing caused by overgrown vegetation. Because it is included in the data being gathered, it can be simply another layer of intelligence gathered on the ROW.
What is envisioned is a periodically self-deploying UAS, located in a sheltered charging station, that would fly a programmed (or self-guided) route along utility rights of way. Imagery collected by the UAS could be uploaded to a cloud service or processed locally. Machine learning would analyze the imagery, detect conditions of interest, and send alerts upon detection of these anomalies. This same equipment can be dispatched for various other purposes such as asset inspections, fault location, or even suspected fire ignitions.
Technical Readiness (Commercial Availability)
The vision for the future of aerial vegetation inspections involves a complex combination of state-of-the-art technologies:
- Automated UAS flight - As of 2023, most UAS deployed by utilities are manually operated, however, as technology improves automation is increasingly possible. A challenge with automated aerial asset inspections has to do with the ability to capture useful imagery [1]. Lighting, truncation, and obscuring of the subject can be factors. This challenge is being addressed by improvements in navigation technology. Another of the immediate challenges today involves FAA regulations against flying a drone beyond line of sight of an operator. Gradually, the FAA is loosening some of these restrictions and waivers are being granted within specified conditions.
- Camera technology - As of 2023, multispectral cameras are suitable for drone mounting, having portability and capability to capture images from a moving camera at focal distances of a few meters. Multispectral cameras are ideally suited and commonly used for vegetation health assessment in a variety of ecological use cases. Purpose-built RedEdge cameras focus more narrowly and specifically on the band centered on the wavelength reflected by chlorophyll.
- Data processing and anomaly detection – As of 2023, with sufficient training data, machine learning has been demonstrated to be effective at detecting anomalies in imagery. Vegetation assessment may involve detecting trees that are leaning or fallen (detectable with RGB bands) and assessment of health of vegetation (detectable with the infrared band).
Combining these technologies into a vegetation inspection use case is the next step toward the vision of fully automated vegetation inspections. More needs to be known about the efficacy of the data gathered, the ability to retrieve actionable information, number of false positives and missed positives, and costs of the effort.
The following list of manufacturers is the product of an Internet search using a general description of the technology as the search term. Sometimes more than one variation on the search term is used. The objective is to identify the most demonstration-ready products available in the category. Toward assessing demonstration readiness, the manufacturer websites typically provide useful information such as writeups of successful use cases or field demonstrations, number of deployments, or other indicators. Where lack of information exists online, further inquiry is made by phone. Generally, one to three frontrunners emerge as being most ready for a field demonstration. Preference is given to manufacturers who sell to the United States, or, if emerging technology, those who have participated in US-based field demonstrations.
Implementations / Deployments
While the technologies involved in carrying out the use case are commonly used today, combining them effectively into a vegetation condition use case is the next step. More needs to be known about the efficacy of the data gathered, the ability to retrieve actionable information, number of false positives and missed positives, and costs of the effort.
Innovations as of Mid 2023
Potential Enrichment Work Opportunity
References
[1] UNMANNED AIRCRAFT SYSTEMS (UAS): Advanced Payloads. EPRI, Palo Alto, CA: 2018. 3002015063.
[2] Weisenfeld, Neil et al. “Infrared Scanning Reveals Defects.” Tdworld.com. https://www.tdworld.com/underground- tampd/infrared-scanning-reveals-defects. (Accessed September 2018).
[3] Rebecca DelPapa Moreira Scafutto et al. “Evaluation of thermal infrared hyperspectral imagery for the detection of onshore methane plumes: Significance for hydrocarbon exploration and monitoring.” International Journal of Applied Earth Observation and Geoinformation 64 (2018) 311-325. https://www.sciencedirect.com/science/article/pii/S0303243417301411. (Accessed September 2018).
[4] Santovasi, Steve and Evans, Laron. “UAS Technology Offers Soaring Potential.” Burnsmcd.com. https://www.burnsmcd.com/insightsnews/tech/uas-technology-offers-soaring-potential. (Accessed September 2018).
[5] Federal Energy Regulatory Commission. “Tree Trimming & Vegetation Management.” Federal Energy Regulatory Commission. https://www.ferc.gov/industries/electric/indus-act/reliability/vegetation-mgt.asp.
[6] Maximizing the Value of Right-of-Way (ROW) Unmanned Aircraft Systems (UAS) Collected Data: Four Applications for Remotely Sensed Data. EPRI, Palo Alto, CA: 2020. 3002018898.
[7] Vegetation Indexes for Hazard Tree Management. EPRI. Palo Alto, CA. May 2020. 3002017448. https://www.epri.com/research/programs/025032/results/3002017448
2.5 - Smoke Detection Cameras
Risk Reduction Category
Technology Description
The technology consists of a network of long-range, geo-located cameras that are mounted to existing or dedicated structures and are coupled with image processing and AI to alert on early detection of smoke. This technology has been field-proven to alert fire responders before receiving the first 911 call. Rapid confirmation of fire, size approximation, and geolocation are additional benefits of the technology compared to eyewitness reports via 911.
While many of such cameras are mounted to existing mountaintop towers, having long range views, others are designed for more remote locations where power supply and communications may be scarce. Additionally, some manufacturers couple their visual cameras with other detection means such as infrared sensing and chemical (smoke) detection.
Technical Readiness (Commercial Availability)
A few vendors are currently supplying equipment and/or software commercially with small-scale deployments. Two broad categories of vendors exist in this space: first, those who supply turnkey systems – both hardware and software, consisting of purpose-built camera/sensor systems, paired with software including an AI engine, visualization, alerting system, and web portal. A second category of vendors provides the software components only, utilizing a camera-agnostic platform that can accept any standard source of video. These vendor platforms can utilize, for example, publicly available imagery from California’s network of ALERT Wildfire cameras.
Leaders in early fire detection can support the intake of additional data such as temperature, humidity, wind speed, etc. to improve the AI and to predict severity and spread of fire.
The figure below shows a typical view from a fixed, tower-mounted camera. If desired, panoramic views can be provided by an array of fixed cameras or by motorized PTZ (pan, tilt, zoom) cameras. Image processing and AI discern smoke from fog and clouds. Although the view is long range, the typical distance for accurate detection of small fires, measuring 3’ x 3’, is about 300 yards. With increasing distance, the fire must be larger to be detected. Accuracy of detection is expressed in terms of false positives and false negatives. These systems can detect smoke or flame during daylight hours and flame during periods of low light. AI analyzes the image for smoke and produces bounding rectangles (simulated in the figure below) indicating a positive detection.
Related Technology
Vendors with Hardware and Software
Pano https://www.pano.ai/
Delphire, Inc. https://delphiretech.com/ www.wildfireai.com viewing portal (experimental)
Delphire offers a multi-sensor platform with built-in infrared detection, chemical smoke sensor. Additionally, external inputs, such as wireless soil moisture sensors, can be connected via Wi-Fi. Delphire also performs edge computing on the unit, reducing the communications requirements. Low power requirements allow it to operate from a solar panel and battery.
IQ FireWatch (Germany) https://www.iq-firewatch.com/
SmokeD
www.smokedSystem.com
Vendors with Software Only
FireScout - uses ALERT Wildfire camera network https://firescout.ai/
Chooch https://www.chooch.com/solutions/wildfire-detection/
Exci www.exci.ai
Implementations / Deployments
Pano: 33 cameras in CA, approximately 100 total (TechCrunch July 2023) [1]
Delphire: approximately 10 cameras installed during various pilots and grant-funded installations. [2], [3], [4]. Commercially available with production capability of approximately 30 units per month (phone interview with Gilberto DeSalvo 1/29/24).
SmokeD, a Polish company, has deployed cameras in Austin, TX and in California.
ALERT Wildfire
https://www.alertwildfire.org/
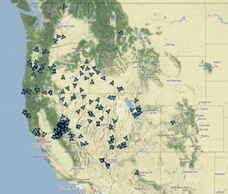
Publicly available imagery from approximately 175 cameras online as of 9/5/2023 across parts of California, Nevada, Oregon, and reaching into Arizona, Colorado, Washington, and Montana (see map below).
ALERT California
Originally part of ALERT Wildfire, but became a state-specific program focused on covering California. Publicly available imagery from a network of 1000+ “cameras and sensor arrays” including partner equipment such as Caltrans traffic cameras.

High Performance Wireless Research and Education Network (HPWREN)
Approximately 280 cameras reporting publicly available imagery as of 9/5/2023 with locations in southern California (see locations below). Update rate is approximately one frame per minute. Some older cameras are monochrome and fixed. Newer cameras are full color and PTZ. Archived data accessible.

Innovations as of Mid 2023
- AI layers filter out false positives like clouds and fog
- AI obfuscates private residences, humans and other non-public imagery
- Real time imagery is viewable via web portal
- Flexible Machine Learning platform that can add physical security (people detection), for example
Potential Enrichment Work Opportunity
Added data layers and data fusion such as: Wind, Weather, Vegetation Condition, Power Line Proximity to a Fire, Emergency Response Agent Locations, etc.
References
2.6 - Synthetic Aperture Radar (SAR) from Satellite Imagery
Risk Reduction Category
Computer vision and situational awareness
Technology Description
Data from Synthetic Aperture Radar (SAR) is captured by equipment mounted on low earth orbiting satellites. Normally, satellites orbit in a North-South direction and view a swath of some width as they travel. The width and the spatial resolution are dictated by the purpose and requirements of the collection.
SAR operates on the fundamental radar principle, by emitting energy and sensing the energy being reflected by the subject. Synthetic aperture refers to the technique by which very high resolution can be achieved by propelling the transmitter and receiver over a distance while focusing on the subject. For the wavelengths needed to achieve high resolution of around 10 m, an impractically long antenna, on the order of 2.5 miles long, would normally be required. However, a similar result can be achieved by taking multiple captures over that distance with a much smaller antenna.

Satellite imagery of a right-of-way (left: optical image, right: processed SAR image) [1]
SAR does not require visible light, as it provides the radiating energy source. It can therefore be used day or night and is unincumbered by clouds and smoke. Properties of the energy being emitted, such as the wavelength and polarization, can be optimized for desired results; for example, reflecting from the surface of a tree canopy versus penetrating deeper into the tree canopy.
Use Case Description
Attaining a comprehensive overview of damage severity across a wide area immediately after severe weather is a challenging task. Typically, the storm danger must pass, and daylight is essential before assessors can safely identify damage extent and location of access-obstacles. The damage assessment process is also very labor intensive, at times requiring days to gain full visibility of damage from severe winds, hurricanes, or tornadoes. Synthetic aperture radar may offer an improved approach to damage assessment. Current satellite technology provides the availability to acquire a SAR image four times per day or once every six hours, and this frequency may improve as more SAR enabled satellites are launched. Because these are radar images, cloud cover and night-time visibility are non-factors in the image acquisition. [1]
SAR is a good tool for showing changes over time. With pre- and post-storm imagery, change detection algorithms could determine where vegetation and structures are no longer present in their original location or appear to have fallen. By comparing the downed trees to the geospatial locations of the lines and structures, the vegetation damage may provide early insights into likely locations of power system damage. The approach may effectively project storm damage locations and severity before damage assessors can safely get out to start their work.
Technical Readiness (Commercial Availability)
SAR has existed for at least 10 years and is currently being collected via satellite routinely for public and private use. Both historical collections and ongoing collections are available to the public at the following URL, which is an opportunity for an introductory glimpse at example SAR data for those unfamiliar with the topic: https://search.earthdata.nasa.gov/search?q=SAR
With 2022 era availabilty, each opportunity to acquire a SAR image by satellite can happen as frequently as four times per day or once every six hours. Data availability is expected to improve as more SAR-enabled satellites are launched. The storm use case would require working with a vendor to acquire imagery on specific dates of precisely the area of interest and with high spatial resolution. In many cases, two vendors will be required, as the satellite vendor is concerned with positioning and data capture, whereas the processing of SAR data is another specialty.
For best results, the use case ideally would include three collections in same area immediately before the storm and in dry conditions (rain on leaves can interfere with wave refraction). Another consideration is the orientation of orbit: ascending pass versus descending pass. For better performance of the image comparison, all data would ideally be captured in the same direction of orbit.
SAR Data Providers
-
Capella Space (USA)
Commercial satellites producing SAR data. Analytics partners provide change detection solutions.
-
ICEYE (Finland)
Commercial satellites for purchase, lease, or for data collections.
-
LiveEO (Germany)
SAR image processor with focus on infrastructure such as railways, electric power grid, and pipelines.
Implementations / Deployments
In 2021, EPRI, Ameren, and Fortis BC sponsored a proof-of-concept field demonstration with SAR provider LiveEO [2]. Objectives of the study were focused on feasibility of using the proven technology for the unique application of storm damage assessment. Specifically, the team was interested in the following aspects:
- the time required to task satellites and capture imagery,
- the time required to process and analyze SAR imagery,
- the resolution and accuracy of the imagery, and
- the effectiveness of AI-based algorithms to assess storm damage.
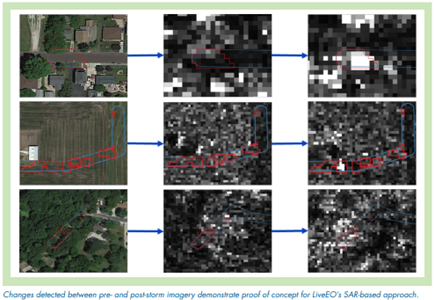
LiveEO analyzed pre- and post-storm imagery and detected a number of plausible changes in conditions that can be attributed to fallen trees and other damage. Results were provided to Ameren within 17 hours of post-storm imagery acquisition, demonstrating the feasibility of adequate turnaround in producing actionable information relating to storm damage even with the existing constellations of satellites in orbit. Some challenges were identified during the field trial, the details of which are publicly available. [2]
Innovations as of Mid 2023
Potential Enrichment Work Opportunity
References
[1] Assessment of Satellite Derived Radar Imagery for Initial Storm Damage Assessment. EPRI, Palo Alto, CA: 2023. 3002026273.
3 - Fault Count and Frequency Reduction
3.1 - Covered Overhead Conductors
Risk Reduction Category
Technology Description
Utilities with heavy tree cover have greater exposure not only to contact with trees, but also increased contact with squirrels and other wildlife. Even when the electrical system is resilient against these external forces, utilities are affected negatively in terms of perceived power quality and performance metrics such as the annual count and duration of interruptions. Additionally, every fault creates another risk of fire ignition due to arcing near vegetation. One potential remediation is a covered conductor system that can prevent a number of these more common faults.
Covered conductor is distinguished from bare conductor by its insulating outer layer. “Tree wire” is a commonly used term that has been used since the 1970s, at the time, referring to technology using a single layer of covering. As technology has improved, modern covered conductor is multi-layered and more resistant to the elements. A variant on the covered conductor is “spacer cable”, which is a tight trapezoidal configuration of three covered phase conductors separated by insulated spacers and suspended by a messenger wire. An advantage of spacer cable is that it allows tighter construction where space is limited. Another common configuration is ABC (aerial bundled cable), which is another legacy term referring to a bundle of covered conductors twisted together with a bare neutral.
Covered conductor is a well-known and selectively used overhead solution for areas with high tree cover. It is available with a variety of covering compounds and thicknesses. The insulation materials polyethylene, XLPE, and EPR are common. Insulation thicknesses typically range from 30 to 150 mils (1 mil = 0.001 in = 0.00254 cm) [1]. The covering is not rated for full conductor line-to-ground voltage, but it is thick enough to reduce the chance of flashover when a tree branch falls between conductors. Covered conductor also helps reduce the number of animal faults and allows tighter conductor spacings enabling utilities to use armless or candlestick designs or other tight configurations [1]. Covered conductors reduce the chances of fires starting from arcing between conductors and trees and other debris on the power line.
Although covered conductors have been in use by utilities for more than 20 years, modern polymers are designed to overcome some of the limitations of earlier chemistries. For example, older polymers would break apart under prolonged exposure to heat or UV light, where modern polymers are cross-linked, resulting in better cohesion.
Safety is sometimes cited as a reason for using covered conductor, but these systems do not necessarily offer safety advantages, and in some ways the covering is a disadvantage. Covered conductors may reduce the chance of death from contact in some cases, but they are in no way a reliable barrier for protection to line workers or the public. From a design and operating viewpoint, covered conductors must be treated as bare conductors according to the National Electrical Safety Code (NESC)155. If a covered wire breaks and contacts the ground, it is less likely to show visible signs that it is energized, such as arcing or jumping, which would help keep bystanders away [1].
Fault-current arcs can damage overhead conductors, especially covered conductors. The arc itself generates tremendous heat, and where an arc attaches to a conductor, it can weaken or burn conductor strands. On bare conductors, the arc is free to move, and the magnetic forces from the fault cause the arc to move in the direction away from the substation—this is called motoring. The covering constricts the arc to one location, so the heating and melting is concentrated on one part of the conductor. As an example, if the covering is stripped at the insulators and a fault arcs across an insulator, the arc motors until it reaches the covering, stops, and burns the conductor apart at the junction [1]. Several utilities have had burndowns of covered conductor circuits when the instantaneous trip was not used or was improperly applied [3] [4].
Technical Readiness (Commercial Availability)
Despite commercial availability, manufacturing standards for covered conductor are not fully defined. The result can be variances in insulation thickness and concentricity from one manufacturer to another, or from one period of time to another. These variances can impact splices and terminations in the field, especially for insulation displacement connectors. Even experienced linemen are often new to installing covered conductors, so workmanship, training, and experience can impact performance of connections.
Some utilities in the USA have extensively deployed covered conductor and are generally satisfied with the performance. However, there is no standard for assessing the performance, but only a comparison of reliability metrics before and after the change. When a limb falls onto covered conductor, for example, there may be no response from the system and no record of the occurrence, therefore, the success is not counted.
There is some skepticism, among utilities who have not yet adopted covered conductors, about the benefits and trade-offs. For example, while minor faults can be avoided completely, repair and restoration work can take much longer than for bare conductor. Also to consider is whether damaged or fallen wire needs to be replaced or re-hung. No standards exist for evaluating fallen cable or for determining which conditions warrant replacement.
Following are manufacturers in the US and abroad who provide covered conductors and/or accessories. This is not a comprehensive list, but illustrates commercial availability.
| Manufacturer | HQ Location | Voltage | Conductor Size | Stranding | Number of Layers | Thickness of Outer Layer | Overall Diameter | Outer Insulation Material |
| Southwire | USA | 15 kV | 336.4 kcmil | 18/1 | 3 | 0.075" | 1.014" | HDTRPE |
| Southwire | USA | 15 kV | 336.4 kcmil | 18/1 | 3 | 0.075" | 1.014" | TR-XLPE |
| General Cable (Prysmian) | USA (Italy) | 15 kV | 336.4 kcmil | 18/1 | 2 | 0.075" | 0.982" | TR-HDPE |
| General Cable (Prysmian) | USA (Italy) | 15 kV | 336.4 kcmil | 18/1 | 2 | 0.075" | 0.982" | TR-HDXLPE |
| Hendrix | USA | 15 kV | 336.4 kcmil | 18/1 | 3 | 0.075" | 1.014" | HDPE |
| Amokabel | Sweden | 66 kV | 200 kcmil* | 7 | 3 | TR-XLPE | ||
| Amokabel | Sweden | 66 kV | 200 kcmil* | 7 | 3 | TR-HDPE |
* Largest size listed in ACSR. Larger sizes listed in AAAC.
Southwire
http://cabletechsupport.southwire.com/en/search_products/?search_field=tree+wire
General Cable
http://general-cable.dcatalog.com/v/Electric-Utility-(CA)/?page=140
Hendrix
https://www.marmonutility.com/overhead/tree-wire/
Implementations/Deployments
Although thousands of miles of covered conductor have been deployed worldwide, what is not clear is the primary driver for doing so, whether reliability, wildfire prevention, safety, or other factors. At least in the case of Australia, wildfire prevention is cited as the main justification for using covered conductors. [2] Australia has been using it extensively for more than 20 years [1].
Information on a few other utility installations in the USA, where wildfires are likely to be a driver, are provided in the table below. [5]
| Utility | First Installation (Year) | Type of Covered Conductor Installed | Approx. Miles Deployed through 2021 |
|---|---|---|---|
| SCE | 2018 | Covered Conductor | 2900 |
| Installed Historically | Tree Wire | 50 | |
| Installed Historically | ABC | 64 | |
| PG&E | 2017 | Covered Conductor | 883 |
| Installed Historically | ABC | 3 | |
| SDG&E | 2020 | Covered Conductor | 22 |
| Tree Wire | 2 | ||
| Spacer Cable | 6 | ||
| Liberty | 2019 | Covered Conductor | 9 |
| Spacer Cable | 53 | ||
| Pacificorp | 2007 | Spacer Cable | 53 |
| Bear Valley | 2018 | Covered Conductor | 20 |
Innovations as of Mid 2023
Potential Enrichment Work Opportunity
References
[1] T&D System Design and Construction for Enhanced Reliability and Power Quality. EPRI, Palo Alto, CA: 2006. 1010192.
[2] Barber, K., “Improvements in the Performance and Reliability of Covered Conductor Distribution Systems,” International Covered Conductor Conference, Cheshire, UK, January 1999.
[3] Barker, P. P. and Short, T. A., “Findings of Recent Experiments Involving Natural and Triggered Lightning,” IEEE/PES Transmission and Distribution Conference, Los Angeles, CA, 1996.
[4] Short, T. A. and Ammon, R. A., “Instantaneous Trip Relay: Examining Its Role,” Transmission and Distribution World, vol. 49, no. 2, 1997.
[5] Pacific Gas and Electric Company, “2022 Wildfire Mitigation Plan Update, Section 4.6, Attachment 1,” 2022.
3.2 - Hybrid Undergrounding
Risk Reduction Category
Technology Description
Overhead lines are exposed to many natural hazards such as storms, ice, tree cover, and animals. Attempts to harden overhead distribution include covered conductors, spacer cable, and construction techniques among others. When these measures are insufficient to meet the requirements – whether reliability indices, public safety, or other governance – utilities consider taking the circuit underground. Traditional undergrounding is effective but very expensive, and therefore, used as a last resort. It can be prohibitively expensive when the terrain is rocky.
Hybrid undergrounding is defined in a 2020 EPRI technology publication as any approach that gets power lines out of the air where they are no longer exposed to wind, ice, trees, and animal damage threats without having to be buried with traditional undergrounding methods. [3] While the safety related challenges of hybrid undergrounding are numerous, the cost benefit and ignition reduction efficacy are significant.
Ground Level Distribution System (GLDS) is an implementation on the hybrid undergrounding concept. GLDS is a “no excavate” approach that negates the costs of excavation whilst providing similar benefits of traditional undergrounding
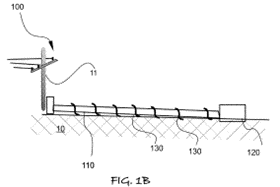
GLDS conceptual diagram from US patent [1]
Technical Readiness (Commercial Availability)
This is an emergent technology in the ideation and small-scale pilot stage. A solution is not commercially available. A patent was issued in 2022 for a Ground Level Primary Electric Distribution System [1] and a proof-of-concept is being deployed by PG&E. [2] In the proof-of-concept, PG&E is packaging the electric cable in conduit in a specially molded tray, tied in with a basalt rebar, then sealed with a special geopolymer cement, placed at ground level, and capped in thermoplastic. It is a reinforced box-like package that wraps the electric wire in materials to ensure safe operation and is secured to the ground to prevent movement [4]. Recently, the GLDS pilot project at PG&E just reached a significant milestone as the first half mile of GLDS circuit was energized in early November on the Woodside 1101 circuit in San Mateo County, California [4].
Outstanding challenges include:
- How can the GLDS be monitored to ensure continued operation? – as the system exists at ground level it may be impacted by uncontrolled surface excavation groundworks (landscaping which changes the thermal environment)
- What level of public education will be required to roll out this new system? – GLDS will have a different appearance to traditional systems
- What new training and tools will the Line Crews require to work on this system? – the cables use conduits and long lengths thus different tooling and work methods are likely required to undertake the work
- How to make a GLDS protection system robust to protect the cables, yet accessible to enable maintenance?
- What are the available repair / replace strategies and components? – although well protected by the geo polymer; large impacts (snowplough etc) or the need for expansion / relocation will require that the cable system will need to maintenance
- Quantifying the ability of GLDS to survive the passage of a “Wildfire Event” and continue to provide power thereby supporting other restoration efforts?
- Establishing the impact of the novel installation environment upon the power carrying capacity? – do the cables and joints run hotter or cooler, is there a summer derating requirement
Implementations/Deployments
Through a field trial, PG&E is exploring the idea of moving overhead powerlines to ground level, using GLDS, to eliminate ignition risk and enhance grid resilience. PG&E anticipates this innovative approach could provide comparable risk reduction and to traditional undergrounding. [2] EPRI is concurrently working with the patent holders on some custom testing geared toward safety and robust lifecycle operation of this type of system.
Innovations as of Mid 2023
Potential Enrichment Work Opportunity
References
[1] Movafagh, Roozbeh. Ground Level Primary Electric Distribution System. US 2022/0216682 A1, United States Patent and Trademark Office, 7 July 2022.
[3] EPRI, “Wildfire Risk Reduction Methods”, 2020.
3.3 - Optimized Construction Practices
Risk Reduction Category
Technology Description
Several construction practices can be utilized to potentially reduce the number of wildfire events. This document will discuss three categories:
- Practices to avoid conductor slap and galloping
- Resilient wire practices
- Resilient pole practices
Practices to Avoid Conductor Slap and Galloping
Conductor slapping due to short circuits is a phenomenon caused by the magnetic forces associated with short circuit currents flowing in the line. Depending on where a fault is located on the system, short circuit currents can be 10-100 times larger than typical load currents and the onset of a fault will result in a significant magnetic force between the phase conductors. This force can cause substantial overhead conductor movement. If the conductors are spaced too closely (poor clearances) and/or if there is too much play (easily achieved due to high sag) a short circuit at one location may trigger enough motion in a conductor upstream to cause a subsequent momentary fault at another location. The lines that are most easily affected are those with a combination of lighter weight conductors, tight conductor spacing, above average sag, long spans and relatively high fault levels. Any span where these characteristics occur together could be particularly susceptible to short circuit induced conductor slapping [1]. Clearly construction practices that avoid any or all of these characteristics will help to minimize conductor slapping, and therefore reduce ignition sources that could cause wildfire.
In cases where conductor slapping is an identified problem on already existing circuits, there are solutions available that utilities can consider. These include the installation of spacers at midspan to reduce conductor excursions on the impacted spans. In addition, shortening the duration of faults by using faster tripping times for circuit breakers and reclosers is another technique to reduce the total displacement of the conductors during the fault. Identifying that there is a problem is a key part of the process, and utilities can use monitoring resources (like digital relays) to look for signs of this problem. A telltale sign is when line-to-line faults occur that are followed within 1-2 seconds by a fault of larger magnitude. This would be an indication that a downstream fault has triggered a new fault closer to the substation probably as a result of slapping conductors [1].
A strong wind alone, without any tree debris, can cause faults by forcing conductors into momentary contact. Aeolian vibrations and galloping effects are types of conductor movement and oscillations that can lead to faults. While these effects may be less critical on distribution systems than on transmission systems, they still play a role in many faults. The best approaches for mitigating these problems are very similar to those discussed earlier for short circuit current conductor slapping faults. That is, make sure the spans are not too long, that the conductor clearances are very large (not just NESC minimums), and that sag is limited. Use of spacers and vibration dampers can help in cases where these conditions can’t easily be satisfied. The EPRI Transmission Line Reference Book [3] has a complete chapter on wind-induced motions in conductors. The physics and equations discussed there, while focused on compact transmission line designs, can be applied to distribution scale lines since compact transmission is in some ways not that much different [1]
Resilient Wire
Resilient wire practices include the use of covered conductors, which are discussed in another wildfire article published in this compendium, entitled Covered Overhead Conductors.
Although not necessarily a new type of technology, the application of oversized bare conductors can provide additional resilience. Typical distribution planning determines the specific wire size to use on three-phase, two-phase, and single-phase lines based on existing and projected loading (amperage) as well as standardized conductor sizes available at the utility company.
Oversizing the conductor, beyond what is required for serving existing and future loads, will help to increase the strength of each span and be better able to withstand such incidents as tree branches falling on to the line, cars hitting poles, hurricanes, and other such events. Disadvantages of oversizing bare conductors relate to material cost, installation cost, increased weight on poles, possibly taller poles, and cross-arms designed withstand the additional weight, sag, and tension.
Resilient Pole
Utilities have designed and constructed overhead structures to deliver electricity for well over 100 years. Modern structure design has largely been driven by the National Electric Safety Code (NESC). The NESC provides guidelines that help structures withstand certain wind and ice loads, have adequate clearances from nearby objects and buildings, use appropriate grounding, and have added strength in areas more accessible to the public, such as at road crossings.
In the twenty-first century, utilities are identifying opportunities to increase reliability and resilience through structural design. Designing structures to avoid issues related to common outage causes could help utilities improve future reliability and resilience and overall quality of service [4], and reduce potential fire related incidents.
Wood is the default choice for distribution because wood is a renewable material, it is the most cost- effective, and exhibits a good strength and longevity. In specific cases where wood poles are deemed insufficient to meet requirements for strength, durability, or other specific properties, alternatives may include galvanized steel, concrete, and fiber-reinforced plastic. For example, if survivability during fire is the primary concern, galvanized steel may be chosen because it will not burn, but the thin layer of galvanization may be compromised, accelerating the rust and therefore the longevity of the steel pole. Further, if a steel pole is struck with sufficient force to cause indentation, that crease becomes a structural weak point. This is one example of a need to understand the strengths and weaknesses of each material and choose appropriately for the use case and the environment where the pole will be used
Technical Readiness (Commercial Availability)
Avoiding Conductor Slap and Galloping
Duke Power found that an easy but effective way of reducing the chance of conductor slapping faults is to always mount the middle-phase pin insulator on the pole rather than on the crossarm. In addition to gaining more horizontal separation, the additional vertical separation helps separate the conductor swinging motions. By changing the force vectors to include a vertical as well as a horizontal component, the force pushing the conductors apart is reduced [1].
Ward [2] provides some excellent graphs for common distribution feeder designs which were analyzed for slapping faults. While these results apply mainly to one company’s designs, they are generic enough to be useful to many others. These results show the critical fault levels and clearing times where conductor slapping could become an issue for various conductor spacings and span lengths. The results suggest that most problems occur with time-delayed faults and that instantaneous trips would mitigate many problems [1]
Resilient Wire
Following are manufacturers in the US and abroad who provide covered conductors and/or accessories. This is not a comprehensive list, but illustrates commercial availability.
| Manufacturer | HQ Location | Voltage | Conductor Size | Stranding | Number of Layers | Thickness of Outer Layer | Overall Diameter | Outer Insulation Material |
| Southwire | USA | 15 kV | 336.4 kcmil | 18/1 | 3 | 0.075" | 1.014" | HDTRPE |
| Southwire | USA | 15 kV | 336.4 kcmil | 18/1 | 3 | 0.075" | 1.014" | TR-XLPE |
| General Cable (Prysmian) | USA (Italy) | 15 kV | 336.4 kcmil | 18/1 | 2 | 0.075" | 0.982" | TR-HDPE |
| General Cable (Prysmian) | USA (Italy) | 15 kV | 336.4 kcmil | 18/1 | 2 | 0.075" | 0.982" | TR-HDXLPE |
| Hendrix | USA | 15 kV | 336.4 kcmil | 18/1 | 3 | 0.075" | 1.014" | HDPE |
| Amokabel | Sweden | 66 kV | 200 kcmil* | 7 | 3 | TR-XLPE | ||
| Amokabel | Sweden | 66 kV | 200 kcmil* | 7 | 3 | TR-HDPE |
Southwire
http://cabletechsupport.southwire.com/en/search_products/?search_field=tree+wire
General Cable
http://general-cable.dcatalog.com/v/Electric-Utility-(CA)/?page=140
Hendrix
https://www.marmonutility.com/overhead/tree-wire/
Resilient Poles
EPRI has demonstrated, in a controlled lab environment, the performance Class 2 ductile iron poles when exposed to a tall structure (simulating a tree) falling into the lines, at mid-span. The demonstration showed that a wood pole snaps under the test conditions, but the ductile iron pole did not break. Generally, if the pole breaks, the lines come down, but if the pole does not break, cable ties or other weak points break. Regardless of the wires, sparing the pole has the advantage of faster restoration. It is ultimately up to the utility to determine the desirable outcome in this condition.
McWane
https://www.mcwaneductile.com/
Creative Pultrusions
https://www.creativecompositesgroup.com/products/utilities/utility-pole-fire-resistant
Trident
Implementations/Deployments
Innovations as of Mid 2023
Potential Enrichment Work Opportunity
References
[1] T&D System Design and Construction for Enhanced Reliability and Power Quality. EPRI, Palo Alto, CA:2006. 1010192.
[2] Ward, D. J., “Overhead distribution conductor motion due to short-circuit forces,” IEEE Transactions on Power Delivery, vol. 18, no. 4, pp. 1534-1538, 2003.
[3] EPRI, Transmission Line Reference Book: 115 - 138 kV Compact Line Design, Second ed, Electric Power Research Institute, Palo Alto, California, 1978. 13948023.
[4] EPRI, Resilient Overhead Distribution Design Guide: 2023 Edition. EPRI, Palo Alto, CA: 2023. 3002026835
3.4 - Strategic Undergrounding
Risk Reduction Category
Technology Description
Strategic undergrounding is a data-driven approach that identifies critical overhead distribution feeders, equipment, and lines as candidates for proactive undergrounding. A strategic undergrounding program helps identify the lines most prone to outages and considers undergrounding to improve grid resilience and the total time of restoration of overhead distribution lines [1].
A strategic undergrounding program can provide heightened wildfire resiliency and electric reliability by undergrounding electric distribution lines near key community facilities. Removing overhead power lines and placing them underground helps remove the risk of sparking fires during adverse weather. It also enables the power lines to remain energized during PSPS which reduces the impact of power outages on fire-prone communities [2].
While undergrounding can be an effective means of fire hardening the electrical system, it is likely much more expensive and may have a lower cost-to-benefit ratio relative to other methods of fire hardening [3]. In Southern California Edison’s (SCE) current Grid Safety and Resiliency Program Application (A.)18-09-002, SCE compares the costs and benefits between three different wildfire mitigation options for their overhead infrastructure located in the High Fire Threat District:
- Re-conductoring and pole replacement with conventional wires and wooden poles
- Installing or re-conductoring and pole replacement with covered (insulated) conductors and fire- resistant metal poles
- Underground conversion of overhead infrastructure
SCE calculated the data in the following table which compares these fire mitigation options:
| Mitigation Effectiveness-to-cost Ratios for Undergrounding Alternatives | ||||
|---|---|---|---|---|
| Mitigation Option | Relative Mitigation Effectiveness Factor* | Cost per Mile | Mitigation Effectiveness-to-Cost Ratio | |
| Southwire | Re-conductor 0 Conventional poles and conductors | 0.15 | $300,000 | 0.5 |
| Covered Conductors and Fire-Resistant Metal Poles | 0.6 | $480,000 | 1.4 | |
| Underground Conversion | 1 | $3,000,000 | 0.33 |
*Undergrounding serves as the baseline for measuring mitigation effectiveness
According to SCE, underground conversion is roughly 7 times more expensive than covering the conductors and replacing wooden poles with fire resistant poles. Additionally, the latter option has a mitigation benefit- to-cost ratio that is significantly higher than both undergrounding and conventional pole and wire replacement [3]
Technical Readiness (Commercial Availability)
Implementations/Deployments
Innovations as of Mid 2023
Potential Enrichment Work Opportunity
References
[1] https://www.tdworld.com/intelligent-undergrounding/article/21146693/strategic- undergrounding
4 - Fault Energy Reduction
4.1 - Fault Energy Limiting Fuses
Risk Reduction Category
Technology Description
A line-to-line or line-to-ground fault commonly results in the ionization of air (or arcing), which can be directly attributable to ignition of a fire when a fuel source is present. In a common scenario, a tree branch falling into a distribution circuit causes a fault while also supplying the ignition fuel. A second risk of ignition occurs when an arcing fault releases molten material to the ground. Circuit protection is designed to protect the utility infrastructure and humans during a fault. However, until the protection operates, an arc can be developed and will be sustained for as long as sufficient electrical energy is available.
Reducing the fault energy (by reducing peak current) significantly reduces the magnitude and duration of an arc. In the context of wildfire prevention, the purpose is to reduce the likelihood of ignition.
Current-limiting fuses are a mature technology for low voltage circuits, but are not widely used in transmission or distribution because of high cost and some technical limitations. Current limiting fuses are not suitable for cold starting loads. They must therefore be bypassed during startup and put into service when needed.
The “CLiP” (Current Limiting Protector), a product manufactured by G&W Electric (Figure 1), is an application of a current limiting fuse for distribution circuits that can be put into and taken out of service via SCADA. The CLiP might be considered by a utility that has frequent fire risk events. A utility with infrequent fire risk may opt for a more cost-effective deployment of current limiting fuses that require manual activation.
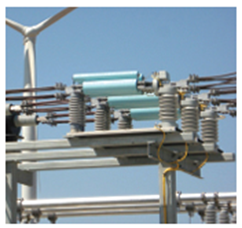
Technical Readiness (Commercial Availability)
Current limiting fuses are a mature technology that is readily available. However, depending on the use case, there may be some important unknowns to consider. For example:
- Methods to place current limiting fuses into and out of service (CLiP is available from one vendor).
- How close to load limits can current limiting fuses be sized? (smaller sizing may result in additional fault limiting)
- How will fault indicators and traditional fuses behave in areas protected by current limiting fuses?
- Will the reduction in energy be enough to prevent an ignition in all cases?
Disadvantages of current limiting fuses are as follows:
- Current limiting fuses do not work well with low current faults. Care must be taken to size them correctly.
- Current limiting fuses can cause current chopping which may result in transients when low current levels occur, such as during a cold-load pickup event. The current limiting fuse portion of the CLiP device is bypassed most of the time until a SCADA command is sent.
- Current limiting fuses be impacted by inrush. Thus, they cannot be in service all the time.
Vendors with Hardware and Software
G&W Electric
https://www.gwelectric.com/products/current-limiting-system-protection/clip/
Implementations / Deployments
The CLiP device is an established product utilized by many utilities in substations that have an available fault current that exceeds the ratings of their distribution breakers. CLiP devices are installed in lieu of replacing the feeder breakers with high fault interrupting devices. If the high fault current is only available during specific conditions, such as when banks are paralleled, the CLiP may only be in service when the high fault current conditions exist.
Innovations as of Mid 2023
Potential Enrichment Work Opportunity
References
https://www.gwelectric.com/webfoo/wp-content/uploads/GW12-2019-CLiP-Bro-FINAL-0722.pdf
4.2 - Non-Expulsion Fuse Designs
Risk Reduction Category
Technology Description
An expulsion Fuse is defined as a vented fuse in which the expulsion effect of gasses produced by the arc and lining of the fuse holder, either alone or aided by a spring, extinguishes the arc [1].
Non-explusion fuse designs on the other hand, including current-limiting fuses, have means to contain the gasses and molten particles. For example, current-limiting fuses have four parts common to all designs: tube, end ferrules, element, and arc quenching filler. The tube must have a high burst strength to withstand the pressures generated during interruption. Fuse elements are typically made from silver. Silver is the most common material used for high voltage fuse elements because of its predictable melting properties. Finally, an arc quenching filler is added to aid in the interruption process. During interruption the arc quenching filler is changed into an insulating material called a fulgurite [1].
While current-limiting fuses are one type of non-expulsion fuse, SMD power fuses are also available [2]
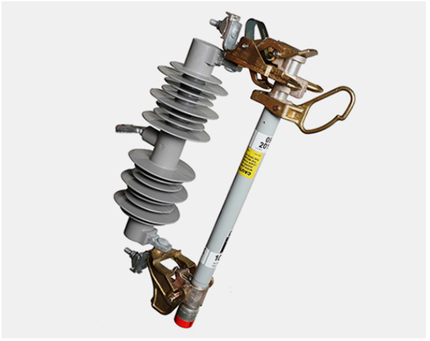
Figure 1: S&C SMD Power Fuse [2]
Under maximum fault conditions, heat from the confined arc causes solid material in the large-diameter lower section of the arc-extinguishing chamber to undergo thermal reaction, generating turbulent gases and effectively enlarging the bore diameter so that the arc energy is released with a mild exhaust. Under low- to-moderate fault conditions, the arc is extinguished in the small-diameter upper section of the arc- extinguishing chamber, where deionizing gases are effectively concentrated for efficient arc extinction [2].
Another fuse type that is non expulsion is any under-oil fuse like you find in padmounted transformers or in CSP transformers. These are still expulsion fuses, but the energy should be contained in the housing [3].
Technical Readiness (Commercial Availability)
Current limiting fuses are a mature technology that is readily available. However, depending on the use case, there may be some important items to consider. For example:
- Methods to place current limiting fuses into and out of service.
- How close to load limits can current limiting fuses be sized? (smaller sizing may result in additional fault limiting)
- How will fault indicators and traditional fuses behave in areas protected by current limiting fuses?
Vendors with Hardware and Software
The following list of manufacturers is the product of an Internet search using a general description of the technology as the search term. Sometimes more than one variation on the search term is used. The objective is to identify the most demonstration-ready products available in the category. Toward assessing demonstration readiness, the manufacturer websites typically provide useful information such as writeups of successful use cases or field demonstrations, number of deployments, or other indicators. Where lack of information exists online, further inquiry is made by phone. Generally, one to three frontrunners emerge as being most ready for a field demonstration. Preference is given to manufacturers who sell to the United States, or, if emerging technology, those who have participated in US-based field demonstrations.
S&C
https://www.sandc.com/en/products--services/products/smd-power-fuses-outdoor-distribution/
Eaton
Implementations / Deployments
Non-expulsion fuse designs, including current-limiting fuses are widely used, taking into account their technical limitations.
Innovations as of Mid 2023
Potential Enrichment Work Opportunity
References
[2] https://www.sandc.com/en/products--services/products/smd-power-fuses-outdoor-distribution/
[3] Email conversation, 1/19/2024 11:49 AM…tshort@epri.com
4.3 - Powerline Carrier (PLC) Signalling
Risk Reduction Category
Technology Description
Powerline Carrier (PLC) Signaling was first developed around 1910-1920, becoming a mature technology by the 1930s [1]. While PLC might have been thought obsolete with the advent of fiberoptic cables, and Wi-Fi technologies, it remains an economic choice for utility powerline communications—and is widely used in transmission systems. Moreover, narrowband PLC offers greater security against data eavesdropping and falsification than other communication technologies [6].
However, the PLC signals may be affected by line impedance, transformers, conductors not being uniform or of the same specifications, three-phase line transpositions, and non-homogenous lines—all of which can reduce the strength of the conducted PLC signal. Above-ground-to-underground transmission cables have frequency/wavelength considerations [2].
While PLC may be used without license from the FCC, the narrowband frequencies that may be used are regulated by the FCC (between 9 kHz and 490 kHz). The PLC system operates on a non-interference, unprotected basis, that is, should it experience or cause harmful interference, the electric power utility shall stop using it or adjust the PLC operation such that the interference is remedied—particularly around 100 kHz [2]. This is the LORAN C navigational frequency band—90 kHz to 110 kHz—which went away around 2010 but appears to be coming back as eLORAN operating at the same frequency band [3].
A basic power-line carrier terminal for operation of a protective relay system might resemble the following simplified diagram [2].

Today’s gap in the 4kV to 34KV distribution systems space, is the lack of automatic detection and triggering of protection for the affected circuit segment. Today’s passive detection algorithms yield an undesirable number of false positive and false negatives. The false positives create increased outage durations for customers while the false negatives result in fire and safety concerns that go undetected.
A novel approach is the use of Powerline carrier (PLC) as a relatively low-cost technology to support this use case. PLC is an established one-way or two-way communication scheme whereby signals are injected onto conductors that are primarily used to deliver power. PLC has been used for communications and protection on the transmission system for many years. TWACS® is one example of a proprietary two-way communication protocol within the family of powerline carrier communications. This long-haul, low bandwidth technology is in use today by utilities and is ideal for simple messaging and control such as meter reading and demand response.
Technical Readiness (Commercial Availability)
Powerline carrier (PLC) has been available for many years in the transmission system. According to Aclara, a Hubbell company, more than 400 utilities use their product, TWACS® to collect revenue-critical meter data as well as monitor line conditions, detect faults or outages and monitor power restoration [5]. The technology has other uses such as real-time pricing and demand response [5].
Repurposing existing PLC technology or developing new PLC signaling technologies is an R&D question. Field trials with an active power line carrier or other signal injection technology may help manufacturers bridge the performance gap that today’s options yield. The concept is that a low-cost signal injection system (for example a variation of TWACS repurposed for protection) could be applied to the power distribution system and all the “listening” protective devices could appropriately respond in a coordinated way to de-energize the live downed conductor section.
The following list of manufacturers is the product of an Internet search using a general description of the technology as the search term. Sometimes more than one variation on the search term is used. The objective is to identify the most demonstration-ready products available in the category. Toward assessing demonstration readiness, the manufacturer websites typically provide useful information such as writeups of successful use cases or field demonstrations, number of deployments, or other indicators. Where lack of information exists online, further inquiry is made by phone. Generally, one to three frontrunners emerge as being most ready for a field demonstration. Preference is given to manufacturers who sell to the United States, or, if emerging technology, those who have participated in US-based field demonstrations.
Transmission Line PLC
Hubbell Power Systems
https://www.rflelect.com/images/products/CA10250E_RFL_PLC_Solutions_Catalog.pdf
Siemens
General Electric (GE)
https://www.gegridsolutions.com/communications/power-line-carrier.htm
Medium and Low Voltage Line PLC
General Electric (GE)
https://www.gegridsolutions.com/communications/catalog/e-terrapowercom.htm
Hubbell Power Systems
Implementations / Deployments
PLC might be used to send commands around the electric power grid and may serve to open faulted circuits very quickly and likewise reclose after arc clearing—although no PLC supplier was identified online as specifically emphasizing this possibility for wildfire prevention.
This gap poses an important Research and Development opportunity. While a few passive monitoring approaches are being used and being demonstrated, none of the technology identified to date fully resolves the false positive and false negative challenges. Field trials with an active power line carrier or other signal injection technology may bridge this gap.
Innovations as of Mid 2023
Potential Enrichment Work Opportunity
References
[1] AIMS Electronics and Electrical Engineering 2022, Volume 6, Issue 3: 265-284. doi: 10.3934 /electreng.2022016 Power line communication: A review on couplers and channel characterization Martial Giraneza, Khaled Abo-Al-Ez https://www.aimspress.com/article/doi/10.3934/electreng.2022016?viewType=HTML
[2] https://www.pes-psrc.org/kb/report/060.pdf
[4] https://www.rflelect.com/images/products/CA10250E_RFL_PLC_Solutions_Catalog.pdf
[6] https://nessum.org/media/technology-blog/what-is-power-line-communication
4.4 - Protective Device Communication
Risk Reduction Category
Technology Description
Communication (e.g., pilot wire, fiber optics, etc) has been used on transmission protective devices for many years. And recently, distribution protective devices also use communication for specific applications. Just as high-speed tripping is important to the stable and secure operation of the bulk transmission system, it is important to the distribution system, although for different reasons. Individual customers have operating systems that require reliable power. There are also voltage conditions that can be aggravated by delayed fault clearing. For example, in areas with a large amount of air conditioning load or induction generators, such as some older wind farms, the drop in voltage caused by a fault can initiate a voltage collapse [1] [2].
In the case of the distribution feeder to the industrial load, system frequency stability is not a consideration; however, other factors may necessitate high-speed tripping. The most important factor may be keeping motors in the factory online. The Information Technology Industry Council has established a curve, the CBEMA curve, shown in Fig. 1, that indicates a generally acceptable voltage range for power delivery [2].
Powerline carrier (PLC) has been available for many years in the transmission system. According to Aclara, a Hubbell company, more than 400 utilities use their product, TWACS® to collect revenue-critical meter data as well as monitor line conditions, detect faults or outages and monitor power restoration [5]. The technology has other uses such as real-time pricing and demand response [5].
Repurposing existing PLC technology or developing new PLC signaling technologies is an R&D question. Field trials with an active power line carrier or other signal injection technology may help manufacturers bridge the performance gap that today’s options yield. The concept is that a low-cost signal injection system (for example a variation of TWACS repurposed for protection) could be applied to the power distribution system and all the “listening” protective devices could appropriately respond in a coordinated way to de-energize the live downed conductor section.
The following list of manufacturers is the product of an Internet search using a general description of the technology as the search term. Sometimes more than one variation on the search term is used. The objective is to identify the most demonstration-ready products available in the category. Toward assessing demonstration readiness, the manufacturer websites typically provide useful information such as writeups of successful use cases or field demonstrations, number of deployments, or other indicators. Where lack of information exists online, further inquiry is made by phone. Generally, one to three frontrunners emerge as being most ready for a field demonstration. Preference is given to manufacturers who sell to the United States, or, if emerging technology, those who have participated in US-based field demonstrations.
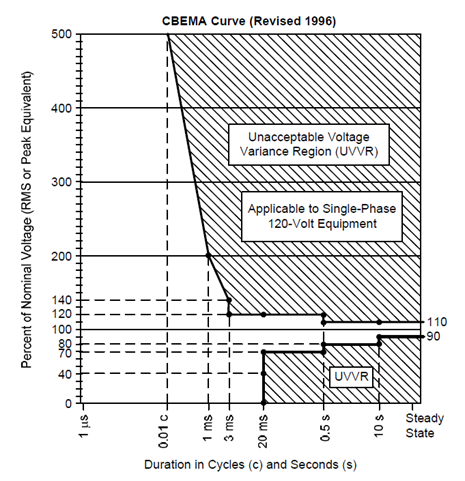
Figure 1: CBEMA Curve
The problem of the operating speed requirement is compounded by the speed of the distribution breaker as compared to the transmission breaker. While typical transmission breakers will interrupt fault current in 2 or at most 3 cycles, distribution breakers will usually have an interrupt time of 5 cycles. This leaves a total of 5 cycles for the relaying system on the incoming distribution feeder to operate for a fault to make sure the voltage recovers quickly enough to prevent motor contactors from dropping out [2].
The problem that comes up is one of coordination. Even though these overcurrent units can operate with the speed required, under practical conditions of coordinating with downstream devices, the speed is much reduced. Fig. 2 shows operating times of a 34.5 kV overcurrent-based fault clearing at a large utility [3]. These are all the faults on the entire 34.5 kV network during an 18-month period.
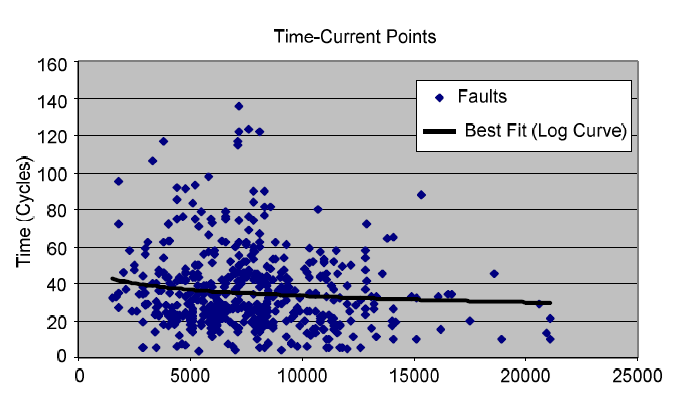
Figure 2: Fault Clearing Times (cycles vs. Fault Current [amps])
As can be seen, the average clearing time for a 10 kA fault is in excess of 30 cycles. In fact, only 32 out of 535 faults on lines with overcurrent relaying were cleared in 10 cycles or less.
Clearly, then, overcurrent relaying is generally not able to operate fast enough to prevent major costs from being incurred at industrial loads on a distribution system. To get the necessary speed, some form of communications-assisted tripping scheme is necessary [2]. This is critical also to the amount of energy that is supplied to a fault, that potentially is an ignition source. Shortening the fault clearing times on distribution, then is important for wildfire mitigation.
Choices for distribution system communications to improve operating times can include one or all of the following:
- Direct pilot wire.
- Leased direct phone line.
- Leased digital phone line—channel service unit/data
- service unit (CSU/DSU).
- Direct fiber-optic cable.
- Multiplexed fiber-optic cable.
- Licensed radio.
- Spread-spectrum radio [2].
Some typical operation times are shown in the following table (Table VI from reference 2).
| Protection Scheme Comparison | |||
|---|---|---|---|
| POTT | DCB | Current Differential | |
| Operating Speed | High (1.5 to 2 cycles) | Medium to high (2 to 2.5 cycles) | Very high (1 to 1.5 cycles) |
| Loss of signal consequence | Failure to trip | False trip | False trip |
| Loss of signal mitigation | Add trip window | Continuous channel monitor | Continuous channel monitor |
When applying communications-assisted protection schemes to distribution applications, the following should be considered:
- In order to ensure protection quality, communications should be monitored during normal and trip conditions and alarmed for prolonged failures.
- The protection scheme must consider the speed and quality of the communications system.
- Backup protection, even if contained in the primary relay, must be designed with consideration of the anticipated failure mode and rate of the communications system.
- Protection logic values need to be assigned for the condition of channel failure to reduce possible false trips and failures to trip.
Technical Readiness (Commercial Availability)
Protective devices with communications are available from such vendors as SEL, GE, and ABB.
Among many others
Implementations / Deployments
Although initially published in the early 2000s there have been increasing numbers of deployments of distribution protective devices for years, especially with utility-scale DER.
Innovations as of Mid 2023
Potential Enrichment Work Opportunity
References
[1] J. Roberts, T. L. Stulo, and A. Reyes, “Sympathetic Tripping Problem Analysis and Solutions,” proceedings of the 24th Annual Western Protective Relay Conference, Spokane, WA, October 1997.
[2] Roy Moxley and Ken Fodero (SEL), “High-Speed Distribution Protection Made Easy: Communications- Assisted Protection Schemes for Distribution Applications”, SEL Journal of Reliable Power, Volume 3, Number 2, August 2012.
[3] R. Moxley, “Analyze Relay Fault Data to Improve Service Reliability,” proceedings of the 30th Annual Western Protective Relay Conference, Spokane, WA, October 2003.
4.5 - Public Safety Power Shutoff
Risk Reduction Category
Technology Description
Utilities may temporarily turn off power to specific areas to reduce the risk of fires caused by electric infrastructure. This action is called a Public Safety Power Shutoff (PSPS) [1]. Energy companies make the decision to turn off power by monitoring local fire danger conditions across their service territory taking into consideration a combination of weather and environmental factors [2]. Some of the larger challenges utilities are encountering are:
- Frequency of PSPS events (if not governed by state public utility commission (PUC)/public service
commission (PSC)):
- Exercise PSPS too often, and a utility may see increased customer complaints.
- Exercise PSPS too conservatively, and a fire may be ignited.
- Utilities have expressed a need to standardize on exactly when to use PSPS to justify the decision on when and for how long to exercise a PSPS.
- Exactly which circuits should be included in a PSPS event:
- While utilities have some guidance from weather stations, state and federal agencies, and other data sources, the circuits to be included in a PSPS event needs to be minimized.
- Serving critical loads:
- Hospitals and other critical loads might need to be served by a microgrid or other stand- alone energy grid while the PSPS is engaged, and for long periods of time until the environmental conditions necessitating a PSPS have passed.
- Pre-event communication:
- Having more time to prepare for an upcoming PSPS event, customers can better prepare for the loss of power.
AI software packages are closing the loop between operations and analytics. The objective of the AI is to streamline data management across disparate utility platforms to improve operations in general. For example, vegetation management, grid hardening, and undergrounding efforts each rely on their own sets of data. Combining these datasets into a single platform enables new optimization opportunities. Workflow within vegetation management can coordinate with undergrounding efforts in this scenario.
Technical Readiness (Commercial Availability)
While most of the PSPS events have occurred in the state of California (from the North American viewpoint), PSPS has been, and is being, adopted across the country and around the world. Optimization of PSPS efforts using AI software is in the early stages of development and field deployment.
Palantir Technologies
Palantir Technologies is a software company that builds enterprise data platforms for use by organizations with complex and sensitive data environments. From building safer cars and planes, to discovering new drugs and combating terrorism, Palantir helps customers across the public, private, and nonprofit sectors transform the way they use their data. [3]
Implementations / Deployments
Pacific Gas and Electric Company (PG&E) has deployed Palantir’s Foundry software beginning around 2020, working across multiple business units to provide a single, integrated platform, giving decision-makers complete and real-time information.
The use of this novel technology, in its early stages of deployment, has already enabled PG&E to make effective, timely, data-driven decisions related to its Public Safety Power Shutoff program and is intended to further inform its wildfire risk mitigation programs and initiatives in the future. Palantir reports a 65% reduction in reportable ignitions based off of data in PG&E’s burn scar database. Palantir also reports that two other west coast utilities are using their product
Innovations as of Mid 2023
Potential Enrichment Work Opportunity
References
[1] https://www.cpuc.ca.gov/psps/
[2] https://prepareforpowerdown.com/
[3] https://www.palantir.com/newsroom/press-releases/palantir-technology-to-enhance-California- electric-grid-safety-and-reliability/
4.6 - Pulse Reclosing
Risk Reduction Category
Technology Description
Faults on distribution circuits are often momentary in nature.
High-current faults (low-impedance) happen when energized conductors make contact or insulation flashes over. Several examples of high current faults include:
- Tree limb bridging phase-to-phase or phase-to-neutral
- Balloon, animal, or another external object
- Conductor slap
- Equipment failure
These are the most common type of fault on distribution systems, and protection equipment (circuit breakers, fuses, and reclosers) are designed to protect the system when these faults occur. In a high-current fault, the main ignition risk is burning sparks created by a high-current arc. If vegetation or flammable materials such as oil or polymer animal guards are ignited by an arc, these can increase risks of wildfire ignition[1].
Strategically located on distribution feeders, traditional line reclosers operate similar to substation circuit. A new type of reclosing device has been developed by S&C Electric called a PulseCloser®. This device is functionally similar to a recloser in that the device trips to isolate fault current [2]. After clearing a fault, however, the IntelliRupter® tests for continued presence of the fault. “IntelliRupter intelligently closes at a precise point on the voltage wave, resulting in a short pulse that’s less than half the symmetrical fault current. The key difference is that the pulse closing technology recloses very quickly and for a short duration to limit the amount of energy supplied to the fault. Like a recloser, if the fault is still present the switch will ultimately lock out”[3]. A photo of an IntelliRupter is shown from [2].
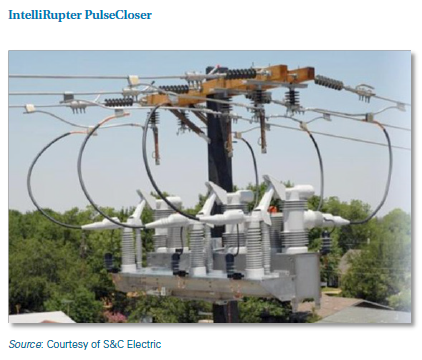
While often applied in an effort to reduce voltage sags, the IntelliRupter also reduces the amount of energy supplied to the fault, as previously noted. This can result in the reduction of potential fire incidents due to faults and reclosing. S&C indicates that using PulseClosing Technology, the IntelliRupter fault interrupter uses 95% less energy to test for faults[4].
Technical Readiness (Commercial Availability)
This product is unique to S&C Electric. The IntelliRupter has been installed at a number of utilities around the world since early 2010s.
S&C Electric
https://www.sandc.com/en/products--services/products/intellirupter-pulsecloser-fault-interrupter
Implementations / Deployments
The IntelliRupter has been installed at a number of utilities around the world since the early 2010s
Innovations as of Mid 2023
For a utility in Australia, upgraded firmware/logic has been applied to work with high-impedance low fault current situations[5].
Potential Enrichment Work Opportunity
References
[1] Ignition Scenarios and Solution Options, Technical Brief: Distribution Systems, Tom Short, EPRI 3002025027, Palo Alto, CA, June 2022.
[2] PQ TechWatch: Minimizing Voltage Sags Due to Distribution Faults by Limiting Fault Current Magnitudes, EPRI, Palo Alto, CA, October 2014.
[3] S&C Electric Company, “S&C IntelliRupter ® PulseCloser: Outdoor Distribution, 15.5 kV through 38 kV,” December 2, 2013, www.sandc.com/edocs_pdfs/EDOC_036231.pdf.
[4] S&C Electric Company, “The Difference Pulse Closing Technology”, https://www.sandc.com/en/products--services/products/intellirupter-pulsecloser-fault-interrupter/#TheDifferencePulseClosingTechnology, January 3, 2024.
[5] S&C Electric Company, “IntelliRupter® PulseCloser® Fault Interrupter Algorithm Enhances Bushfire- Mitigation Strategy”, 11/18/2019, retrieved from page listed in reference [4], January 3, 2024.
4.7 - Reclose Blocking - Manual
Risk Reduction Category
Technology Description
Reclosers are a mature technology and are ubiquitous because they are cost effective and beneficial to both utility and customer. Utilities avoid truck rolls for temporary faults, while customers benefit from increased uptime.
A distribution circuit recloser operating in its normal capacity restores power automatically after a temporary fault. However, it can also reclose into a condition that is not self-clearing, such as a fallen tree that has come to rest on the phase conductors. Despite the benefits of automatic reclosing, there exists a possibility of spark or flame at the location of the fault, and therefore a risk of wildfire each time a recloser energizes the circuit into a fault. While the risk of fire in this scenario is not a common threat in most regions of the country, utilities serving fire-prone areas would rather not take that risk especially during the dry season. These utilities may opt to temporarily disable reclosing. In this scenario, a fault would cause the circuit to open and remain open until crews arrive to assess the situation, check for fire ignition, and restore power manually when safe to do so.
Thus, the term reclose blocking refers to the prevention of automatic reclosing. This can be done remotely via communications (wired, wireless) or through sending a troubleshooter (or crew) to change the configuration of the recloser controls. This type of adjustment is termed manual reclose blocking in that it is either an ON (block reclosing) or OFF (allow reclosing) via a ‘command’ to the recloser and the setting will persist until changed. The decision to enter a priod of blocked reclosing is one that prioritizes public safety over convenience, cost, and reliability of service. Further, the decisions on where and when to make these adjustments are based on utility policy and/or operators’ assessment of risk. In the most “manual” of scenarios, the recloser settings are adjusted only seasonally, at the beginning and end of the season of high fire risk. For dynamically determined recloser settings, see also Reclose Blocking - Automated.”
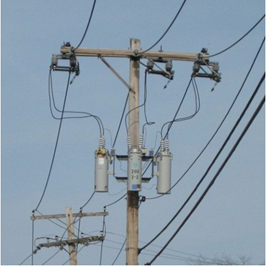
Single-phase reclosers. Photo credit [1].
Technical Readiness (Commercial Availability)
Reclosers are available from a large number of vendors. Some of the more well-known suppliers of distribution gear are represented here. These will be widely deployed and integrated into utility systems.
Eaton
https://www.eaton.com/us/en-us/products/medium-voltage-power-distribution-control- systems/reclosers.html
G&W Electric
https://www.gwelectric.com/products/distribution-reclosers-and-overhead-switches
S&C Electric
https://www.sandc.com/en/products--services/products/?c=326
Implementations / Deployments
California utilities in fire-risk areas are operationally blocking reclosing seasonally and within specific rural areas of their service territory. When intelligent and communicating reclosers are installed, manual reclose blocking is fairly straightforward. However, some rural circuits may have non-communicating reclosers, requiring truck rolls.
Innovations as of Mid 2023
Potential Enrichment Work Opportunity
References
[1] https://www.eaton.com/us/en-us/products/medium-voltage-power-distribution-control-systems/reclosers/reclosers--fundamentals-of-reclosers.html - Retrieved 01/17/2024.
4.8 - Reclose Blocking Automated
Risk Reduction Category
Technology Description
Automatic reclosers improve reliability for customers by allowing the circuit to attempt to clear faults without human intervention. Depending on utility configuration, reclosers may attempt fault clearing two or three times, typically within approximately 30 seconds, before locking out. If these automated attempts fail to clear the fault, then crews must be dispatched to assess the condition. While reclosers are very common, they may pose a risk of wildfire ignition in fire-prone regions of the country. Utilities who operate in these regions may temporarily disable the reclose feature of specific automated reclosers during the fire season.
Thus, the term reclose blocking refers to the prevention of automatic reclosing. This can be done remotely via communications (wired, wireless) or through sending a troubleshooter (or crew) to change the configuration of the recloser controls. This type of adjustment is termed manual reclose blocking in that it is either an ON (block reclosing) or OFF (allow reclosing) via a ‘command’ to the recloser and the setting will persist until changed. Further, the decisions on where and when to make these adjustments are based on utility policy and/or operators’ assessment of risk. In contrast to manual reclose blocking, where a decision to enter (and exit) a period of reclose blocking is done on a seasonal basis, automated reclose blocking is more aligned with current conditions.
Because wind, humidity, and other risk drivers for wildfires are dynamic in nature, protection schemes should also be dynamically controlled and responsive. Operators need to quickly disable reclosing and sectionalize areas of high fire risk based on changing conditions. Operators can use real-time fire risk models to make these decisions.
Technical Readiness (Commercial Availability)
Manual control of reclose blocking is a common practice in fire-prone areas. California utilities in fire-risk areas are operationally blocking reclosing seasonally and within specific rural areas of their service territory. When intelligent and communicating reclosers are installed, manual reclose blocking is fairly straightforward. However, some rural circuits may have non-communicating reclosers, requiring truck rolls. Automated reclose blocking is emergent and can be practiced in various forms, where the frequency, duration, and thresholds may vary widely from one utility to another. There is currently no standard for implementation, and doing so is ultimately driven by the risk posture of the utility. Any automated reclose equipment that communicates over SCADA can be used to implement an automated reclose blocking use case, including the following and many others:
Eaton
https://www.eaton.com/us/en-us/products/medium-voltage-power-distribution-control- systems/reclosers.html
G&W Electric
https://www.gwelectric.com/products/distribution-reclosers-and-overhead-switches
S&C Electric
https://www.sandc.com/en/products--services/products/?c=326
Schweitzer Engineering Labs (SEL)
Implementations / Deployments
Innovations as of Mid 2023
Potential Enrichment Work Opportunity
References
4.9 - Fault Energy Limiting – Rapid Earth Fault Current Limiter (REFCL)
Risk Reduction Category
Protection & Detection for Reduced Fault/Ignition Energy
Technology Description
First, some background. An arc suppression coil (ASC) is an inductance which is connected to the neutral of a transformer to cancel out the current caused by the capacitance of the system. This device can be a fixed inductance, a variable inductance which is automatically adjusted with a plunger or a fixed inductance which is varied by the switching of capacitors. The terms Petersen Coil, Arc Suppression Reactor are synonyms [1]. Figure 1 shows an ASC on a distribution system, schematically.
![Figure 1: Arc Suppression Coil (ASC) [1]](/wildfire/public/wildfire-tech-database/fault-energy-reduction/refcl/fault-energy-2.png)
As new feeders are added to distribution grids or taken out of service, the arc-suppression coil may no longer be tuned to match the zero-sequence capacitance of the downstream grid. In such cases, the level of ground fault current would increase. Specifically for delta distribution systems without grounded neutrals and line-to-ground fault scenarios, Rapid Earth Fault Current Limiter Technology (REFCL) has been applied to provide a dynamically variable neutral impedance, which will respond to single-line-to ground faults to choke off any remaining ground fault current. With this technology, a power electronic switch is connected across a neutral grounding reactor on the supply transformer. When a downstream ground fault occurs, the system detects the ground fault current and injects a current of equal magnitude but opposite polarity. Field deployments have shown that this impedance tuning effect completes within approximately 5 cycles of fault initiation and can reduce ground fault current from the order of amps to tens of amps at the time of fault initiation to below 0.5 A once tuning completes. Because the fault current is very low, fault location can be difficult to calculate, but the fault arc should self-extinguish. Therefore, in the majority of cases, circuit breakers are not required to trip unless the fault persists for an extended period (such as more than 30 seconds). Source: Distribution Protection Options to Reduce Damage and Improve Public Safety, Tom Short et al. EPRI 3002018773
A ground fault neutralizer is one type of REFCL technology. The term is loosely defined as a device consisting of an arc suppression coil and an inverter used to restrict fault current. Figure 2 shows an example of a residual current compensator system with ASC.[1].
![Figure 2: Arc Suppression Coil and Residual Current Compensator [1]](/wildfire/public/wildfire-tech-database/fault-energy-reduction/refcl/fault-energy-3.png)
Southern California Edison (SCE) have piloted multiple variations of REFCL technology to better understand how the available alternatives apply to the wide variety of circuit designs on the SCE system. The diversity of SCE circuit types means that no single variation is cost-effectively applicable across the entire SCE system. For example, for large substations feeding tens to hundreds of miles of high fire risk circuitry, Ground Fault Neutralizer projects modeled on the Australian REFCL program may be a good choice. However, the Ground Fault Neutralizer is neither economically viable nor necessary for fire risk reduction for smaller distribution systems. For these smaller facilities grounding conversion projects to unground or resonant ground them can achieve a similar reduction in risk at a much lower cost [1].
An interesting finding by SCE is that it is necessary that the charging current on the three phases be balanced. Voltage regulators can cause voltage imbalance if the three phases are being set to different voltages. This can occur either from open delta connections where only two regulators are used or from settings which allow independent operation of the three phases. Open delta voltage regulators therefore require upgrade to closed delta with all three phases controlled by a single controller [1].
The distribution network requires capacitive balancing, replacement of equipment intolerant to overvoltage and the installation of equipment to support REFCL operation. The cost of this aspect of work is material. HV customers also require equipment to be replaced or isolated where existing equipment is not rated to the expected higher voltages from REFCL operation[2].
Technical Readiness (Commercial Availability)
REFCL technologies have been trialed and rolled out by AusNet (report, 2018) and Powercor (report, 2018) 22-kV grids since 2017.
“Rapid Earth Fault Current Limiter (REFCL) Program: HV Customer Policy for REFCL Protected Networks (Load & Generator),” AusNet Services, 2018. https://www.aer.gov.au/system/files/Attachment%2018%20-%20REF%2030-10%20REFCL%20Program%20HV%20Customer%20Policy%20Issue%202%20-%20Public.pdf
“Rapid Earth Fault Current Limiter Explained,” PowerCor, 2018. https://media.powercor.com.au/wp-content/uploads/2018/11/23143431/2018-09-04-a4-hvc-collateral-final.pdf
Vendors with Hardware and Software
Swedish Neutral – Ground Fault Neutralizer http://www.swedishneutral.se/main.php?name=start
Implementations / Deployments
Approximately 100 installations of Swedish Neutral Ground Fault Neutralizer mostly in Europe. Primary customers are electric utilities and large manufacturing plants who have substation equipment on site. This product is being used to improve reliability and reduce shock hazards in Europe and is also being used in Australia to prevent wildfires.
Pilot test of Ground Fault Neutralizer technology in southern California involving at least one substation is ongoing as of 2023.
Innovations as of Mid 2023
Potential Enrichment Work Opportunity
References
[1] Rapid Earth Fault Current Limiter (REFCL) Projects at Southern California Edison, Jesse Rorabaugh Nicole Rexwinkel Austin William Fresquez, 12/29/2022.
[2] REFCL Tranche 3 Program, PowerCor Austalia, July 2020
5 - Fire Protective Materials
5.1 - Fire Inhibiting Sprays
Risk Reduction Category
Technology Description
Fire inhibiting sprays may be categorized as fire retardants or fire suppressants—the latter being considered short-term retardants. Fire suppressants, that may include gels based on superabsorbent polymers or perfluorinated surfactant-based foams, may be applied to an active fire. While the perfluorinated foams have been found very effective in suppressing fires these are considered toxic environmental contaminants. The gels lose effectiveness when the water evaporates—perhaps within an hour of application.[1]
According to the USDA, long-term retardants contain about 85% water with 10% fertilizer (typically ammonium phosphate fertilizers), along with 5% colorant, stabilizers, bactericides, corrosion inhibitors, and thickener (clay and natural gum). The colorants make the fire retardant visible both from the air (so that pilots can more accurately deliver subsequent drops) and from the ground (to help firefighters in positioning themselves).[2]
A Study from the 1970s found phosphate chemistry to be among the most effective according to three parameters involving effectiveness: fuel weight loss, amount of radiation emitted, and amount of residue after all combustion had ended as the fuel burned. The chemicals rated highest in effectiveness were monoammonium phosphate, diammonium phosphate, potassium carbonate, and phosphoric acid. Those showing high to moderate effectiveness were boric acid, ammonium pentaborate, and sodium tetraborate. [3]
Proprietary sprays intended for the protection of structures are also available.
Technical Readiness (Commercial Availability)
The following list of manufacturers is the product of an Internet search using a general description of the technology as the search term. Sometimes more than one variation on the search term is used. The objective is to identify the most demonstration-ready products available in the category. Toward assessing demonstration readiness, the manufacturer websites typically provide useful information such as writeups of successful use cases or field demonstrations, number of deployments, or other indicators. Where lack of information exists online, further inquiry is made by phone. Generally, one to three frontrunners emerge as being most ready for a field demonstration. Preference is given to manufacturers who sell to the United States, or, if emerging technology, those who have participated in US-based field demonstrations.
Perimeter Solutions: Phos-Chek (currently in use by the United States Forest Service (USFS) in their firefighting air tanker fleets.) Phos-Chek is a long-term fire-retardant employing water and fertilizer as described previously. Products are developed in compliance with NFPA FIREWISE USA® Guidelines
https://www.perimeter-solutions.com/en/
Barricade International: Barricade ® II liquid fire gel concentrate(LC): Barricade has been approved by the US Forest Service to be used in Single Engine Air Tankers (SEATs), helicopters using buckets and firefighters on the ground using fire engines. It is described as having negative impacts on the environment and is said to be easy to store, maintain and mix for aerial operations. Barricade provides a thermally protective coating intended to protect structures from burning due to fire conditions. This spray may be applied using a garden hose and may last 24 hours or longer according to the website.
https://firegel.com/wildfire-applications/
Sunseeker Enterprises, Inc.: doing business as Sun FireDefense: offers a patented spray for application to buildings, SPF3000 (patent #11441076). The coating may be applied to wood, polymers, metals, plastic, fiberglass, and fabrics. This coating technology, according to the patent, provides a layer of protection that expands, prevents oxygen from getting to the flames and then self-extinguishes. [4]
Implementations / Deployments
Phos-Chek has been used in firefighting air tanker fleets for over 55 years. A non-colored version is available for use in residential environments.
In California, on a four-mile stretch of Route 118 (between Ventura and Los Angeles County), PHOS-CHEK FORTIFY was applied before the 2019 fire season. While 37 fire starts were recorded for this location in 2018, none were recorded in 2019.[3]
Barricade appears to be intended for towns and homes in wildfire-prone areas. Its materials indicate that it has been used on wildfires from aircraft.
SPF3000 has been applied to homes in California to protect them against wildfires. In 2018, Corral Canyon, Malibu, one house treated with SPF3000 is said to have survived the Woolsey wildfire that destroyed neighboring homes. Likewise, in 2017, one house in Bel Air also treated with SPF 3000 is said to have survived the Skirball wildfire while other nearby houses did not
Innovations as of Mid 2023
From Perimeter Solutions: ground-based, or ground-applied fire retardants for wildfire prevention in high risk areas: PHOS-CHEK Fortify and PHOS-CHEK LC-95W. These may be found on the USDA Forest Service Qualified Products List (QPL). [3]
Potential Enrichment Work Opportunity
References
[1] PNAS site (Proceedings of the National Academy of Sciences of the United States of America) Wildfire prevention through prophylactic treatment of high-risk landscapes using viscoelastic retardant fluids. Anthony C. Yu, et al. https://www.pnas.org/doi/10.1073/pnas.1907855116#data-availability
[3] Perimeter Solutions https://www.perimeter-solutions.com/wp-content/uploads/2022/05/PERI1216_LTR_White_Paper_v4b.pdf
[4] Sun FireDefense website https://www.prnewswire.com/news-releases/us-patent-granted-to-sun-firedefense-for-wildfire-coating-technology-301635665.html
5.2 - Fire Protective Material for Wood Poles
Risk Reduction Category
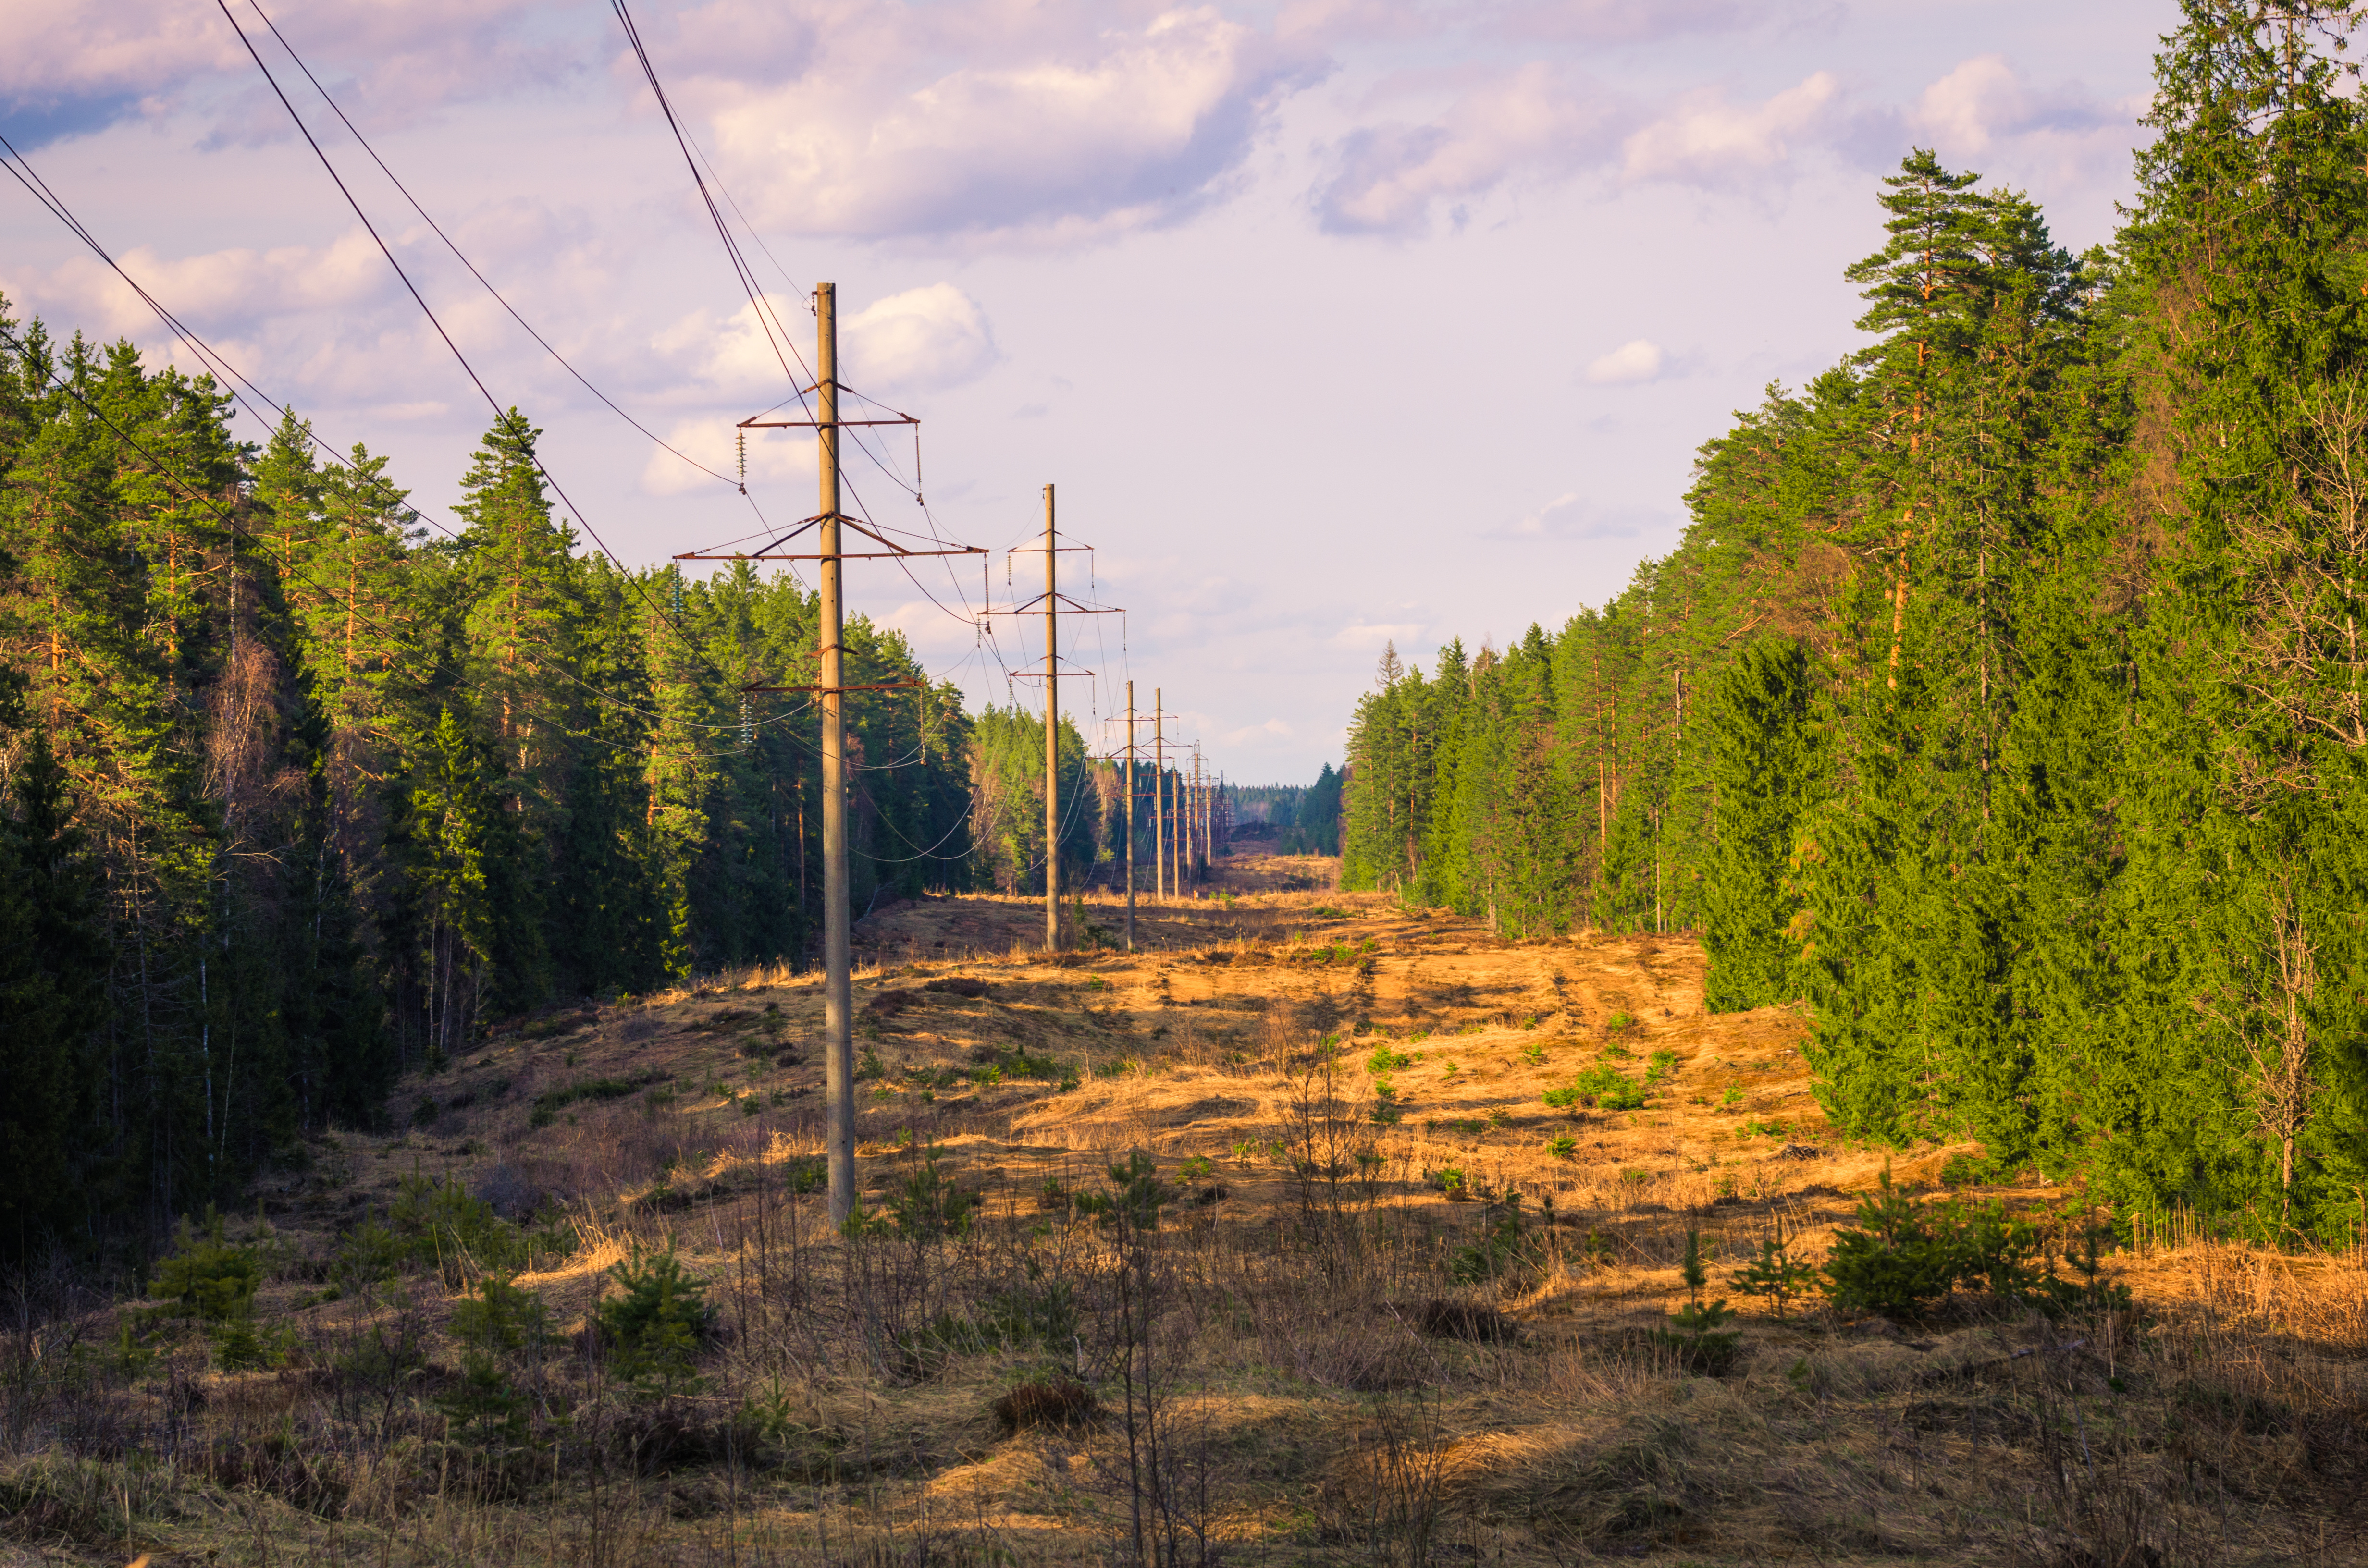
Technology Description
Wood poles are inherently combustible, and they are also unique among utility assets because of their long-reaching distribution even into forests and wildfire-prone areas. Wood is chosen over synthetic materials for construction of utility poles because wood provides the most attractive combination of cost, strength, and durability. Chemical treatment during manufacture of the poles improves their resistance to natural decay, but, depending on the compound, may support smoldering when exposed to fire, and, if not destroying the pole, reducing its load-bearing strength.
To minimize fire damage to utility assets, not necessarily limited to wood poles, aftermarket flame-resistant insulating materials can be applied to the surfaces of the assets, usually after installation. These aftermarket remedies are available in the form of spray-on products, fiber wraps, and rigid materials. When applied properly, these products are simply one component of a fire-hardening strategy. The effectiveness of the treatment is naturally influenced by the intensity and duration of the fire. Thus, part of an effective fire protection strategy includes the minimization of vegetation fuel near the asset.
An example is a fabric wrap applied to the surface of wood poles. The fabric wrap is attached with staples beginning at or just below the surface and as high up the pole as needed. The wrap inhibits fire damage by simply reflecting heat and restricting airflow, two essential ingredients that set up smoldering in wood. While fire resistant materials are not new, the technological innovations available today provide superior fire protection without introducing negative side effects that might interfere with climbing or that might promote wood decay throughout the lifetime of the pole, and, in fact may provide some benefit. Some manufacturers may accomplish this via intumescent material, maintaining a breathable and UV-protective form until hardened by chemical activation when exposed to fire.
Technical Readiness (Commercial Availability)
The following list of manufacturers is the product of an Internet search using a general description of the technology as the search term. Sometimes more than one variation on the search term is used. The objective is to identify the most demonstration-ready products available in the category. Toward assessing demonstration readiness, the manufacturer websites typically provide useful information such as writeups of successful use cases or field demonstrations, number of deployments, or other indicators. Where lack of information exists online, further inquiry is made by phone. Generally, one to three frontrunners emerge as being most ready for a field demonstration. Preference is given to manufacturers who sell to the United States, or, if emerging technology, those who have participated in US-based field demonstrations.
Polesaver https://polesaver.com/products/polesaver-fire-fabric/
Hexion https://www.hexion.com/en-us/brand/armorbuilt
PoleCare https://polecare.com/products/fire-retardant
Implementations / Deployments
Hexion
- Commercial launch of the ArmorBuilt product in 2020 [1].
- Currently in use by BC hydro, SaskPower, PG&E, and others [1].
- Participated in three prescribed canyon burns [1].
- Multiple poles involved in the Mosquito Fire of 2022 [1].
Genics
- Tested to ASTM standards at Western Fire Center, Kelso, Washington [2].
- Participated in several controlled burns in different climactic zones [2].
- Installed by a west coast US utility and tested under wildfire conditions [2].
Polesaver
- Product launch of fire protection fabric in 2014.
- Independently tested by a major African Utility company (Test report available from PoleSaver).
- Effective for low-lying brush fires.
Innovations as of Mid 2023
Potential Enrichment Work Opportunity
References
[1] Scott McIntyre. “Hexion’s ArmorBuilt Wildfire Shield is a Proven Solution for Utility Pole Protection.” YouTube, uploaded by Electricity Today Magazine, 10 Apr. 2023, https://www.youtube.com/watch?v=-WXufa0srnQ
[2] The Energy Network. “Fire Hardening Wood Pole Assets.” 2021, https://www.tengroup.com.au/attachments/Product/20589/TEN%20Group_Genics%20Fire%20Mesh%20-%201221.pdf?ts=1638405637
5.3 - Fire-Resistant Fencing
Risk Reduction Category
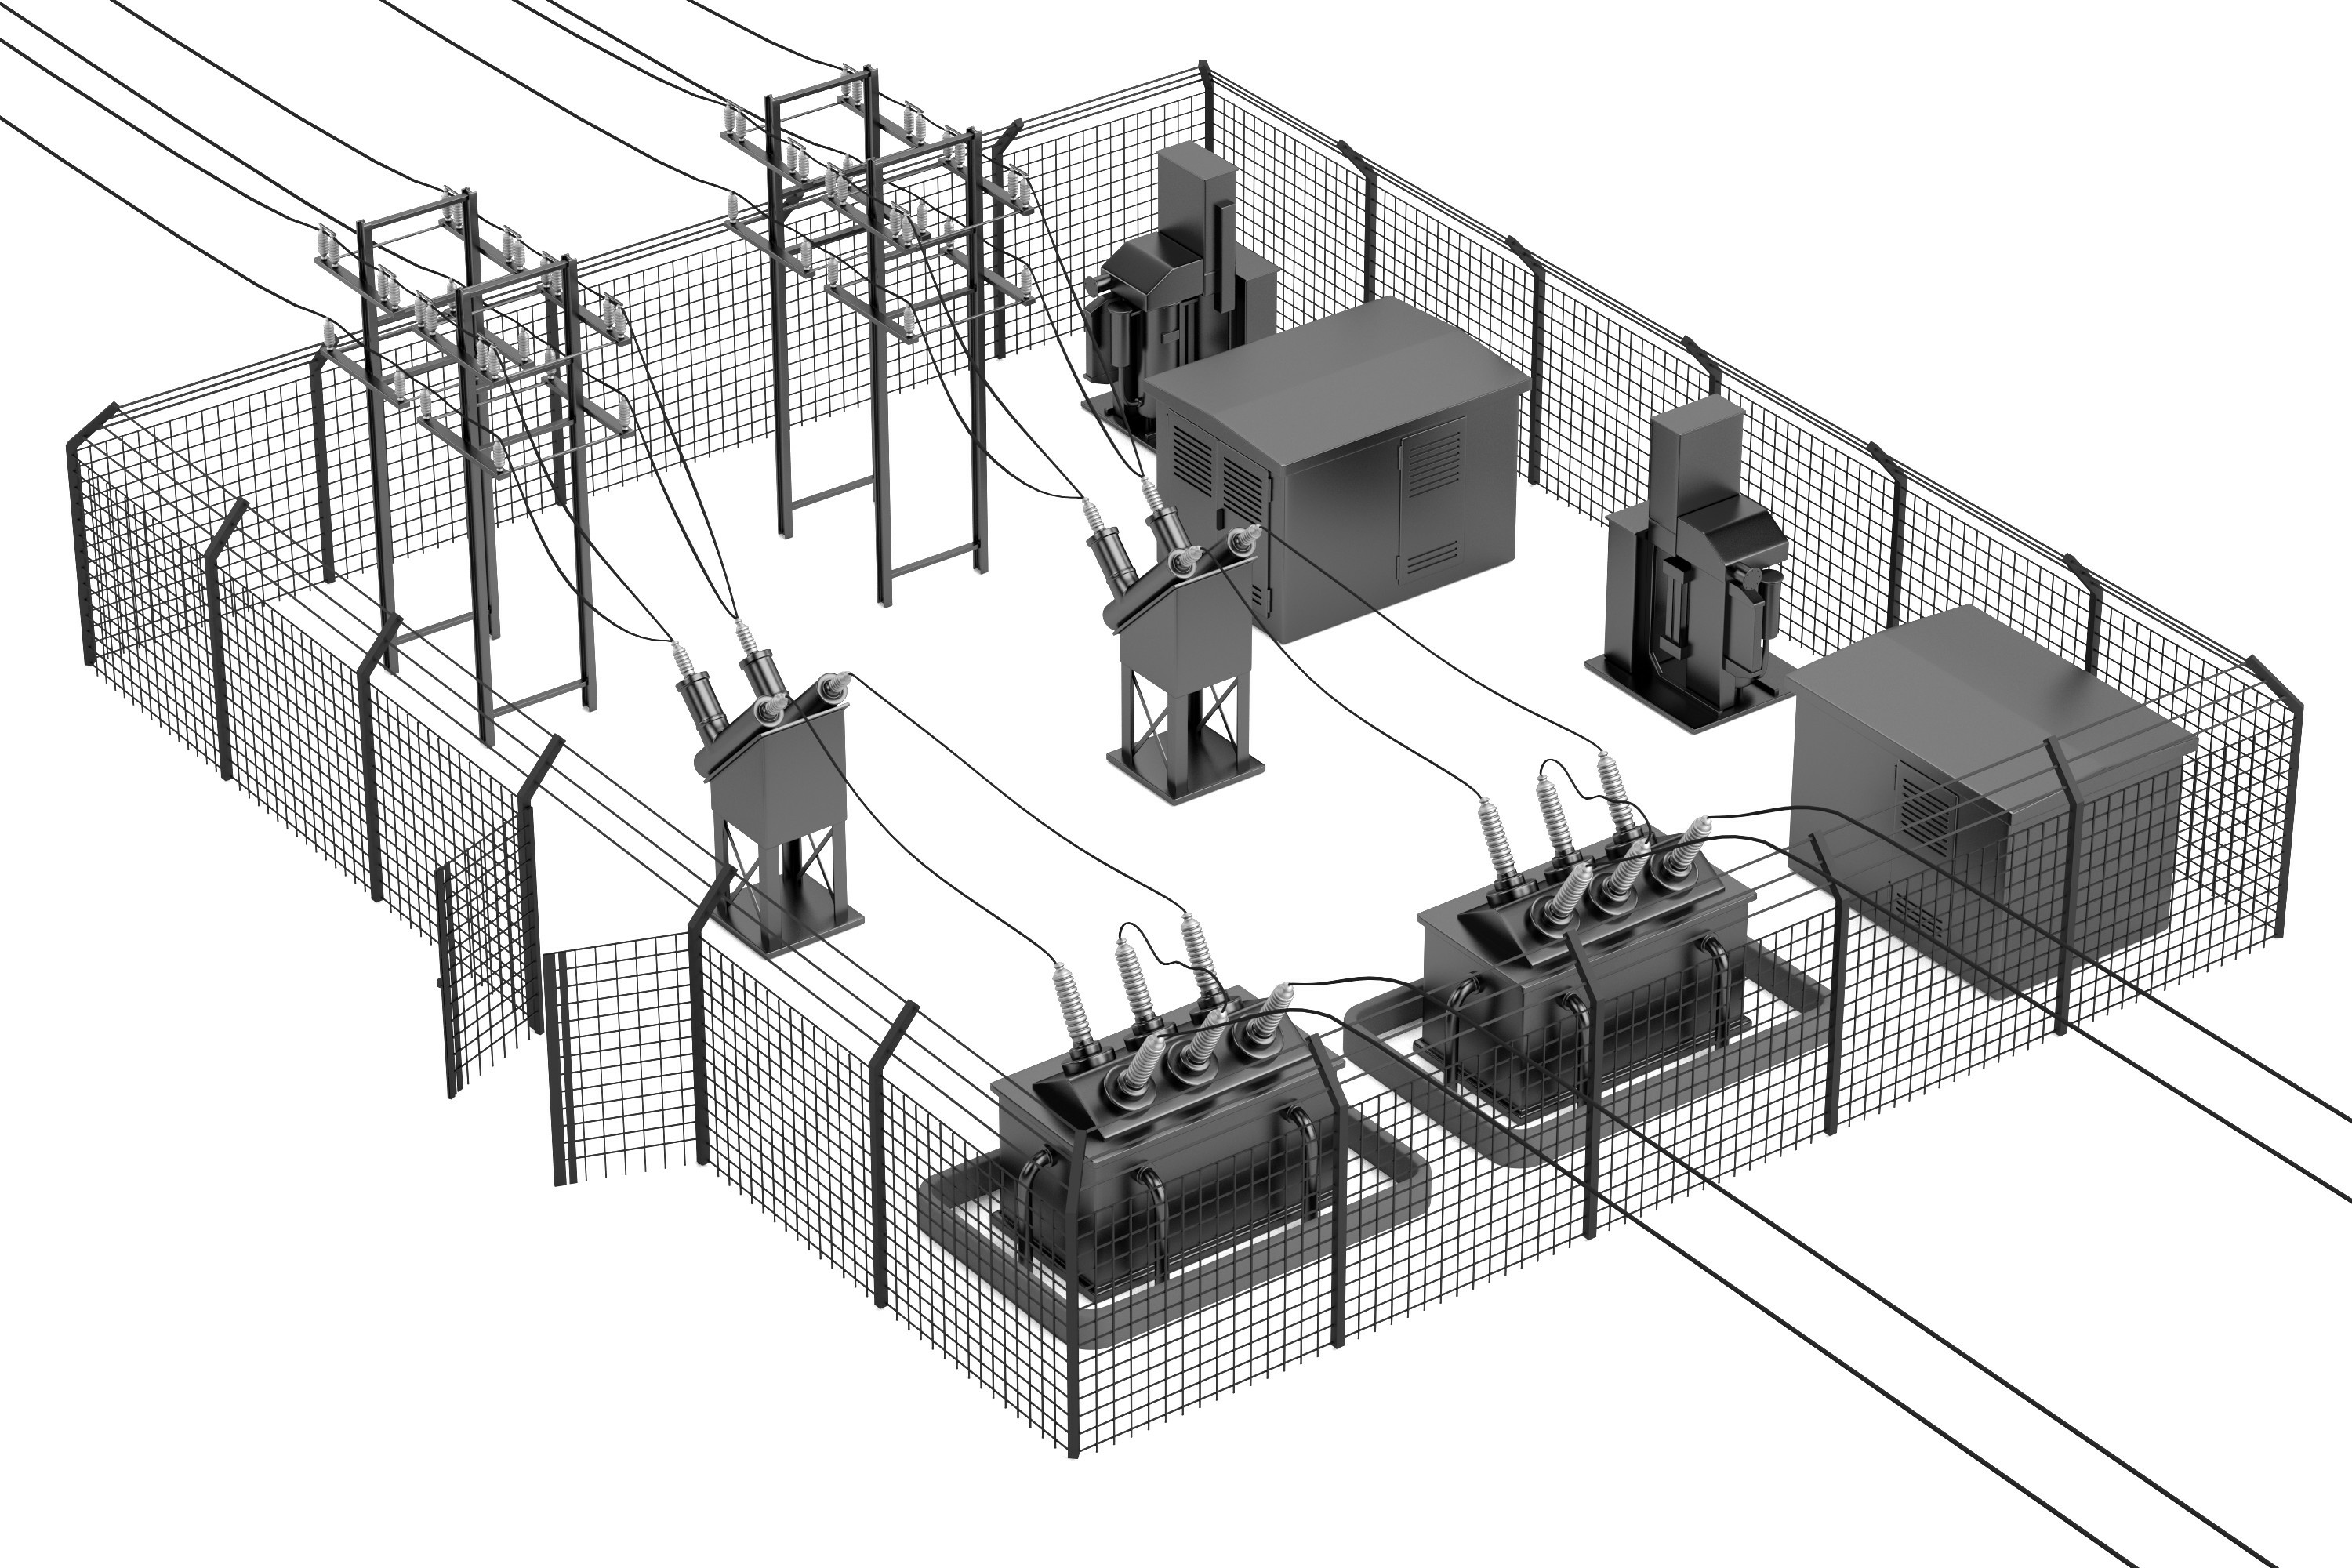
Technology Description
Utilities require a perimeter barrier around assets such as substations and switch yards for safety and security, protecting both the equipment inside and the public. Chain link, constructed of galvanized, low-carbon steel, is the most common material used by utilities to deter intrusion, safeguarding animals and humans from electric shock, while providing a measure of physical security for the utility assets against theft and vandalism. A perimeter fence around utility assets should be electrically safe to the touch while being durable against the elements, affordable, and effective against cutting, climbing, burning, and battering.
An alternative to traditional galvanized steel for fencing is fiber-reinforced polymer (FRP), which is a combination of plastic-based matrices reinforced with fibers. Technically, when the fibers are glass, the product is called glass-reinforced polymer (GRP) but is also correctly identified in the broader FRP category, which includes fiber materials other than glass. FRP can have strength and rigidity suitable for structural applications such as piers, catwalks, handrails, skids, and the like. Being non-conductive, it can be used safely near energized equipment. When constructed as rigid mesh, FRP can be used as an alternative to chain link, having comparable wind-resistant properties, visual barrier, and aesthetics. The product in this configuration is often referred to as ENC (electrically non-conductive) fencing. Additionally, being a fire-resistant material, it may provide a containment benefit for substation fire or it may protect utility assets from an external fire. It also survives a fire at higher temperatures than chain link, which deteriorates quickly when the zinc coating is compromised.
Technical Readiness (Commercial Availability)
FRP is a mature technology, with history dating back to the 1930s when it was introduced as fiberglass. Since then, the formulation has evolved into a vast variety of products optimized for specific applications. Electric utilities have an established and tested familiarity with FRP as a rigid and nonconductive material suitable for use as manhole covers, grating, handrails, and other applications.
Because the material can be refined, colored, and textured, it is often used as an alternative to wood for privacy and ornamental fencing. A few manufacturers offer FRP as a mesh panel, designed in its appearance and performance to be an alternative to chain link fencing. Some utilities are using FRP fencing around substations. While fire resistance is also one of the properties of FRP, it typically is not the primary selling point. For example, polyester-based FRP is inherently fire-resistant and is the material from which ENC is commonly manufactured. Meanwhile, phenolic-based polymers are more fire resistant, but are rarely used in ENC fence construction because of the added cost and incremental benefit.
AIMS Composites https://aimscomposites.com/enc-security-fencing/
Fibergrate https://www.fibergrate.com/products/unique-product-solutions/enc-fencing/
AMICO/Seasafe https://amicosecurity.com/anc-fencing/
ICE Composites https://icecomposites.com/downloads/ICE%20General%20Brochure%20GB%2003%2021%20NE.pdf
Implementations / Deployments
AIMS Composites
Installed by CenterPoint Energy in Houston, TX for its hurricane resistance (rated for up to 150mph winds).
https://www.facebook.com/100063697352112/videos/294284379892225?__so__=permalink
Innovations as of Mid 2023
Potential Enrichment Work Opportunity
References
5.4 - Flame-inhibiting Coverings
Risk Reduction Category
Technology Description
Wildfire is a twofold issue for electric utilities who must take precautions to prevent ignition along their widely distributed assets as well as protect those assets from damage caused by passing wildfires. Wood poles are particularly vulnerable to fire and because of their unique characteristics, commercial products have been developed specifically for the unique treatment of wood poles. Therefore, the topic of wood poles is written up separately in the technology database. The more general topic of flame-inhibiting coverings includes a variety of synthetic coatings and materials that can be used to protect a other types of assets.
SunFire Defense advertises flexible flame retardant that can be manufactured into covers and frames for windows. One spray-on material called SPF 3000 (patented by SunFire Defense) may be used to treat various materials and fabrics to withstand up to 2300 degrees. This group creates wildfire home-protection systems. [1]
CanAm Scientific provides fire retardant coating applied to materials such as fabrics, wood, and plastics to make them nonflammable for a period of time. Fire Inhibitor, said to be non-toxic and non-corrosive, will not flame or spread fire. It is biodegradable, water soluble, and can reduce heat transfer up to 95%. [2] Buildings placed in areas prone to wildfires should be made of ignition-resistant construction materials (example Section 704A Ignition-Resistant Construction); typically, ignition-resistant construction materials include building materials such as stone, brick, and steel. [3]
Non-flammable composite materials, as used for composite utility poles, may be made into fire-resistant coverings. Composed of glass-fiber-reinforced polymers (FRP), these thermoset plastic, fire-resistant poles provided by RS Technologies have been through actual wildfires in California without burning, melting, or suffering structural damage. Therefore, glass-fiber-reinforced thermoset polymers might be formed into other shapes such as outdoor utility cabinets, fire shields, etc. [4]
Technical Readiness (Commercial Availability)
The following list of manufacturers is the product of an Internet search using a general description of the technology as the search term. Sometimes more than one variation on the search term is used. The objective is to identify the most demonstration-ready products available in the category. Toward assessing demonstration readiness, the manufacturer websites typically provide useful information such as writeups of successful use cases or field demonstrations, number of deployments, or other indicators. Where lack of information exists online, further inquiry is made by phone. Generally, one to three frontrunners emerge as being most ready for a field demonstration. Preference is given to manufacturers who sell to the United States, or, if emerging technology, those who have participated in US-based field demonstrations.
- SunFire Defense: Fire Shield Fabric (home defense system) https://sunfiredefense.com/products
- CanAm Scientific: Fire Inhibitor https://canamscientific.com/fire-inhibitor/
- Hardening Your Home https://www.readyforwildfire.org/
- Composite Poles Stand Up to Gigafires https://www.tdworld.com/wildfire/article/21236723/composite-poles-stand-up-to-gigafires
- RS Poles (manufacturer of composite poles) https://www.rspoles.com/solutions/products/poles
Implementations / Deployments
Southern California Edison (SCE) has installed composite poles in 40% of its service territory accounting for its high fire threat areas. This composite material has survived wildfires and has maintained its service strength.
Innovations as of Mid 2023
From Perimeter Solutions: ground-based, or ground-applied fire retardants for wildfire prevention in high risk areas: PHOS-CHEK Fortify and PHOS-CHEK LC-95W. These may be found on the USDA Forest Service Qualified Products List (QPL). [3]
Potential Enrichment Work Opportunity
References
[1] https://sunfiredefense.com/products
[2] https://canamscientific.com/fire-inhibitor/
[3] https://www.readyforwildfire.org/
[4] https://www.tdworld.com/wildfire/article/21236723/composite-poles-stand-up-to-gigafires
5.5 - Smoke/Soot Inhibitors
Risk Reduction Category
Technology Description
While a method to prevent smoke and soot residue specifically may not exist, methods to clean outdoor electrical equipment such as insulators can be found online. One existing method involves pressure washing using deionized hot water [1] while another employs so-called dry ice (frozen CO2).[2] The former is already used to clean high-voltage insulators on transmission towers without having to turn off power to the structure. The latter currently seems to be used on substation insulators—again, without having to depower the equipment. The hot deionized water method can be performed from a helicopter using a mobile version of the hot water system [1] The cleaning approach begins at the bottom and gradually moves up to the top in stages. Wind direction and velocity can interfere with either approach.

Example images only; PG&E left, British group right (YouTube images)
An alternative to cleaning the insulators might be to use RG glaze insulators, which are said never to need cleaning even in highly polluted environments.[3] The RG (resistive graded) porcelain insulator acts as a semiconductor that allows 1 mA (±0.5) of controlled, continuous current to flow across the surface of the insulator—creating a heating effect and preventing dry band arcing. While these can be cleaned, they may not ever require it.
Technical Readiness (Commercial Availability)
The following list of manufacturers is the product of an Internet search using a general description of the technology as the search term. Sometimes more than one variation on the search term is used. The objective is to identify the most demonstration-ready products available in the category. Toward assessing demonstration readiness, the manufacturer websites typically provide useful information such as writeups of successful use cases or field demonstrations, number of deployments, or other indicators. Where lack of information exists online, further inquiry is made by phone. Generally, one to three frontrunners emerge as being most ready for a field demonstration. Preference is given to manufacturers who sell to the United States, or, if emerging technology, those who have participated in US-based field demonstrations.
Wilorton Holding Inc (automated and mobile systems)
https://wilorton.com/insulator-washing.php
Cryonomic (specifically for insulators, yet might be adaptable to power lines)
Lapp Insulators
https://kafactor.com/content/technical-resources/lapp_rg_substation_contamination.pdf
Implementations / Deployments
PG&E has used the hot water method and has a demonstration on YouTube (https://www.youtube.com/watch?v=2z3qYlCUMfg).
The RG porcelain insulators have been targeted for coastal, desert, heavily contaminated areas, and roadways with 1 million units currently in service according to one source.
Innovations as of Mid 2023
Potential Enrichment Work Opportunity
References
[1] Wilorton Holding Inc. ttps://wilorton.com/insulator-washing.php
[2] Cryonomic https://www.cryonomic.com/en/applications/1249/dry-ice-blasting-for-power-generation/high-voltage-insulator-cleaning
[3] Lapp Insulators https://kafactor.com/content/technical-resources/lapp_rg_substation_contamination.pdf
5.6 - Vegetation Clearing and Brushing
Risk Reduction Category
Technology Description
Preventing wildfire intrusion into a utility right of way (ROW) involves removing brush and trees from the area. Typically, this involves the physical removal of vegetation and/or applying herbicide to inhibit future growth—environmental compliance may become an issue. While such actions may have been be ad hoc in the past, the increasing likelihood of wildfires due to drought conditions in many areas not previously experiencing such dry conditions may require a more active and systematic approach to ROW vegetation removal. Therefore, a methodical plan specifying which areas are to be cleared along with the methods to be used should be in place. Should clearing as needed prove more economical than clearing on a set schedule, the plan should include regular surveillance of all ROW areas to assess that need. Over time, trees and brush may grow significantly as may be seen in the figure below.
![]()
These activities should include brush clearing around poles having an electrified asset or expulsion fuse (10- foot radius suggested). Otherwise, regular pole spans may be skipped. Trees within the ROW should be removed and clearance distances should be maintained to prevent contact with tree lines. Overhanging limbs should be pruned, and tall trees outside of the transmission ROW that may fall or blow into the ROW should be removed. Weed abatement may also be necessary. The removal of pruned/trimmed/mowed vegetation thus cleared should be considered as leaving the debris on the ground can pose a fire hazard in the event of a wildfire—especially in High Fire Risk Areas (HFRA). Forested areas may allow coordination with US Forest Service maintenance activities where applicable. Depending on the location and availability of sufficient numbers of herbivores, grazing may become an option for clearing brush in the ROW. Permits and environmental impact studies may be necessary at certain locations prior to any brush-clearing activity.[1] San Diego Gas and Electric (SDGE) has used goats in this way as well.[2]
Tools and machinery may be used for pruning, trimming, and tree removal. Clearing of understory growth (grass, brush, and small trees—a chipper or shredder may be necessary) in a forested area may prevent flames from reaching the crowns of tall trees.[1]
In the future, satellite imagery may be used to examine poles and surrounding areas to determine whether or not mowing is necessary. Also, sprays may be available to prevent growth in the ROW for up to two growth seasons
Technical Readiness (Commercial Availability)
The following list of manufacturers is the product of an Internet search using a general description of the technology as the search term. Sometimes more than one variation on the search term is used. The objective is to identify the most demonstration-ready products available in the category. Toward assessing demonstration readiness, the manufacturer websites typically provide useful information such as writeups of successful use cases or field demonstrations, number of deployments, or other indicators. Where lack of information exists online, further inquiry is made by phone. Generally, one to three frontrunners emerge as being most ready for a field demonstration. Preference is given to manufacturers who sell to the United States, or, if emerging technology, those who have participated in US-based field demonstrations.
Large mulching machines are available including various attachments for specific uses (mulching, stump removal, etc.):
https://fecon.com/clearing-right-of-way-land-requires-the-right-equipment/
Various contractors perform vegetation clearing activities. Two examples are provided for reference:
https://lanracorp.com/right-of-way-clearing2/
https://www.steintree.com/why-is-right-of-way-clearing-important/
Implementations / Deployments
Southern California Edison (SCE) is in the process of developing a Fuel Removal Assessment Plan for Wildfire Management to aid with their wildfire mitigation efforts.[1]
Allowing goats to graze on non-native shrubs in ROW may work in small, contained areas; however, goats will also consume native plant species, possibly interfering with restoration projects. [3]
Innovations as of Mid 2023
From Perimeter Solutions: ground-based, or ground-applied fire retardants for wildfire prevention in high risk areas: PHOS-CHEK Fortify and PHOS-CHEK LC-95W. These may be found on the USDA Forest Service Qualified Products List (QPL). [3]
Potential Enrichment Work Opportunity
References
[1] SCE Fuel Removal Assessment for Wildfire Mitigation. EPRI, Palo Alto, CA: 2022. 3002023370.
[2] 2022, No.1 Winter edition and the EPRI Journal 1988 No.2
[3] Electric Transmission Right-of-Way Invasive Non-Native Woody Plant Species Control. EPRI, Palo Alto, CA:2006. 1010127.
6 - Grid Monitoring
6.1 - Falling Conductor Protection
Risk Reduction Category
Protection & Detection to remove fire ignition source.
Technology Description
Downed electrical conductors pose a public safety risk due to the possibility of human contact with the conductors and the potential for arcing to ignite wildfires. Downed or fallen conductors are over-head conductors that have contacted the ground or objects connected to the ground [1].
A California utility has worked with Quanta and Schweitzer Engineering Laboratories (SEL), Inc., to develop a falling conductor protection (FCP) system. A broken overhead distribution conductor falling from a height of 30 feet (9 m) will accelerate from the moment of the break, and one or both ends reach the ground 1.37 s later [2]. The system will detect the break from circuit voltage signatures and issue trip commands so that the affected section is de-energized 200 to 500 ms after the break–when the conductors have fallen only a few feet, or about 1 meter [2].
The system uses distribution phasor measurement units (PMUs), standard protection equipment, and high-speed communication to detect the break from circuit voltage signatures and issue trip commands so that the affected section is de-energized 200 to 500 ms after the break [2].
A conceptual diagram is shown in [2], below. At the substation, there is a PMU, a real-time automation controller (RTAC) with clock and a private LTE cellular network. Multiple zones are shown in the diagram with standard protection equipment outfitted with PMUs, synchronized clocks and the communications network of private LTE cellular network.
![Figure 1: Conceptual Diagram of FCP [2]](/wildfire/public/wildfire-tech-database/grid-monitoring/downed-conductor-detection/down-cond-1.png)
The RTAC uses five voltage-based methods to detect the falling conductor condition. They are as follows:
- Rate-of-change of per phase voltage (dV/dt)
- Negative-sequence voltage magnitude (V2Mag)
- Negative-sequence voltage angle (V2Ang)
- Zero-sequence voltage magnitude (V0Mag)
- Zero-sequence voltage angle (V0Ang)
The design permits the user to individually enable or disable each of the five methods, previously described. A voting scheme is available for added security; whereby, a certain number of methods must be asserted for the RTAC to issue GOOSE trip commands, as shown in Figure 2.
![Figure 2: Voting scheme for FCP Trip Signal Issuance [2]](/wildfire/public/wildfire-tech-database/grid-monitoring/downed-conductor-detection/down-cond-2.png)
To make the FCP scheme more reliable and secure, there were several enhancements and security checks added to the pilot version of the FCP solution, which was first implemented during the 2014–2015 timeframe. These are illustrated in Figure 3.
![Figure 3: Blocking conditions for FCP [2]](/wildfire/public/wildfire-tech-database/grid-monitoring/downed-conductor-detection/down-cond-3.png)
This technology has been publicly discussed since 2019 and is presently an offering by SEL.
A second vendor, GE, with Southern California Edison has also deployed a similar system. HFCP (High-speed Falling Conductor Protection) detects increase in feeder impedance ratio, measured at PMU location and coordinates with downstream PMUs after conductor breaks [4].
![Figure 4: GE/SCE HFCP Diagram [4]](/wildfire/public/wildfire-tech-database/grid-monitoring/downed-conductor-detection/down-cond-4.png)
Technical Readiness (Commercial Availability)
San Diego Gas & Electric Company (SDG&E) has implemented a falling conductor protection (FCP) solution based on synchrophasor technology and high-speed IEC 61850 Generic Object-Oriented Substation Event (GOOSE) messaging/tripping. This solution detects and trips the affected circuit section within milliseconds of the break. The affected circuit section is de-energized before the conductor touches the ground, thereby eliminating the risk of safety hazards caused by an energized downed conductor. SDG&E has implemented this solution to date on multiple 12 kV circuits with traditional communications layouts using Ethernet radios [3].
SCE and GE have also implemented a HFCP for distribution.
Vendors with Hardware and Software
Schweitzer Engineering Laboratories, Inc.: https://selinc.com/mktg/135956/
General Electric Grid Solutions: https://www.gegridsolutions.com/services/catalog/gridnode-highspeed-falling-conductor-protection.htm
Implementations / Deployments
Several 12 kV circuits at SDG&E
Southern California Edison
Innovations as of Mid 2023
Potential Enrichment Work Opportunity
References
[1] Fire Mitigation for Distribution: Achieve Quick Progress With Advanced Technology Solutions, Anthony Rahiminejad and Daqing Hou Schweitzer Engineering Laboratories, Inc., Nick Nakamura and Manoj Bundhoo G&W Electric, 2019.
[2] Transmission Line Falling Conductor Protection System Development at SDG&E, Chris Bolton, Tariq Rahman, Daniel Dietmeyer, San Diego Gas & Electric Company, Eric A. Udren, Quanta Technology, LLC, USA, PACWorld magazine, March 2023.
[3] Detecting and Isolating Falling Conductors in Midair – First Field Implementation Using Private LTE at Protection Speeds, Charlie Cerezo and Caleb Murphy San Diego Gas & Electric Company Tanushri Doshi, Rohit Sharma, and Jay Lopes Schweitzer Engineering Laboratories, Inc., 76th Annual Conference for Protective Relay Engineers College Station, Texas March 27–30, 2023.
[4] High-Speed Falling Conductor Protection in Distribution Systems using SynchrophasorData, Y. Yin, H. Kruger, H. Bayat, M. Leyba and N. Dunn GE Grid Solutions A. Marquez, A. Torres, I. Sanchez, K. Tran, M. Webster Southern California Edison Company, Conference for Protective Relay Engineers College Station, Texas March, 2022.
6.2 - Faulted Circuit Indicators
Risk Reduction Category
Technology Description
When a fault occurs on a line, crews are typically dispatched to the general area of the fault based on customers reporting outages. Line crews patrol lines visually, looking for interference from fallen trees, vehicular accident, and so forth. Finding the fault consumes time and cost to the utility. While technology exists to estimate the distance to a fault by analyzing signals being injected into the system, this type of fault location on distribution circuits has a number of challenges such as:
- Non-homogenous circuits (conductor sizes vary; often even along ‘main line’)
- Large number of laterals
- Typically, waveforms exist only at a substation breaker
- Impact of fault resistance on the measuement
- Evolving faults and conductor slapping
- Distributed Generation - fault location becomes more challenging with increasing levels of DG
penetration
- Synchronous generators can provide up to 5pu short circuit current
- Three-phase inverters can provide 1.0-1.6pu positive sequence current during faults, negative sequence current less than 10%
- Single-phase inverters may provide up to 2.5pu current during faults
- Grounding Practices
- No impact on faults not involving ground
- Solidly grounded: Enough ground current for fault location
- Grounding through impedance: Faults currents lower than load currents
- Ungrounded: First ground fault cannot be easily detected and located
Line fault indicators, or fault current indicators (FCI) simply clamp onto an overhead conductor and monitor the current through the conductor. If the peak current detected is consistent with a fault (to be distinguished from inrush current), then typically a visual indicator will illuminate or flash. The idea is that these simple, cost-effective, and self-powered indicators provide a visual aid to help line crews to quickly identify the location of a fault as they patrol the lines. By decreasing the amount of time it takes to located faults on the distribution system the utility can more quickly address any fires, with appropriate governmental entities (fire departments, forest service fire crews, etc). Key to the success of such a strategy involves optimizing the number and placement of FCI devices. This are most helpful in areas where other methods of fault location are ineffective or do not exist.
One factor to keep in mind is the effectiveness of FCI when another wildfire mitigation strategy is also in use. An example is a current limiting fuse, which may interfere with the ability of the FCI to detect a fault.
Fault indicators are available with varying capabilities. Table 1 shows some of those capabilities.
| FCI | Line Sensor/Smart FCI | |
| Fault Detection | Yes | Yes |
| Local Fault Indication | Yes | Depends on Design |
| Communication | No | Yes |
| Fault Current Measurement | No | Yes |
| Load Current Measurement | No | Yes |
| Voltage Measurement | No | Depends on Design |
Technical Readiness (Commercial Availability)
Fault current indicators are not a new technology, but an option for utilities possibly to improve their response time after a fault. Improved fault location is important from a wildfire perspective, as crews can arrive at the location of the fault sooner and service or contain hazardous conditions. Basic and advanced faulted circuit indicators are available from a number of vendors at the present time. FCI are a mature technology.
The following list of manufacturers is the product of an Internet search using a general description of the technology as the search term. Sometimes more than one variation on the search term is used. The objective is to identify the most demonstration-ready products available in the category. Toward assessing demonstration readiness, the manufacturer websites typically provide useful information such as writeups of successful use cases or field demonstrations, number of deployments, or other indicators. Where lack of information exists online, further inquiry is made by phone. Generally, one to three frontrunners emerge as being most ready for a field demonstration. Preference is given to manufacturers who sell to the United States, or, if emerging technology, those who have participated in US-based field demonstrations.
Looking specifically at the Line Sensor/Smart FCI grouping, the following vendors have solutions for overhead construction:
- Without waveform capture
- Aclara Technologies - https://www.aclara.com/products-and-services/sensors-and- controls/gridmonitoring-platform/mv-sensor
- CNI Guard - https://www.cniguard.com/products/overline/ Four-Faith Smart Power - https://en.four-faith.net/Overhead-Line-Fault-Indicator/
- SEL - https://selinc.com/products/distribution/fault-indicators/overhead-fault-location/
- Eaton - https://www.eaton.com/content/dam/eaton/products/medium-voltage-power-distribution-control-systems/line-installation-and-protective-equipment/faulted-circuit-ndicator-application-guide-ca320001en.pdf
- With waveform capture
- InHand Networks - https://www.inhandnetworks.com/solutions/overheadline- monitoring.html
- Sentient Energy - https://www.sentientenergy.com/products/mm3-line-sensor
Implementations / Deployments
Fault Location Using Fault Sensors by Elektro (Brazilian utility):
- Use Intelligent Fault Sensors that communicate status back to the Distribution Operation Center (DOC)
- Communication takes place over a satellite network where 2G/3G coverage is limited/unreliable
- Due consideration was needed to make sure devices would stay powered to reliably communicate with the DOC
- The pilot project reduced fault location time by 50% and total outage time by 10%
A large number of US-based utilities have deployments of basic and advanced line fault indicators.
Innovations as of Mid 2023
Potential Enrichment Work Opportunity
References
Utility Experience and Novel Technologies for Distribution Grid Event Analysis and Fault Location. EPRI, Palo Alto, CA: 2022. 3002024378.
6.3 - High-Impedance Fault Detection
Risk Reduction Category
Technology Description
Faults on distribution circuits are often momentary in nature. Low impedance faults, such as a bare conductor in contact with a ground conductor, cause protection to quickly operate. High impedance faults, by contrast, draw insufficient current to be recognized by circuit protection. While high impedance faults may not damage utility equipment, they pose a public safety risk and can also cause ignitions. Scenarios include:
- Tree touching one conductor
- Tree limb bridging phase-to-phase or phase-to-neutral
- Downed conductor on a shrub
- Downed conductor on grass
For a tree in contact with one medium-voltage conductor, the resistance of the tree is high enough to remain a high-impedance connection; it will not draw enough current to operate a fuse or other protective device. (EPRI 1016219, 2007; EPRI 1018463, 2008). Currents in the hundreds of milliamperes can be drawn if the contact point is to a larger-diameter main structural component of the tree. Such a condition may ignite flames. If a branch or trunk of a tree bridges between two conductors (phase to phase or phase to neutral), the fault will start out as a high-impedance fault. A tree branch between two conductors can progress to a low-impedance (nearly bolted) fault. Arcing occurs at each end where the wire is in contact with the branch. At this point in the process, the current is small (the tree branch has high impedance). The arcing burns the branch and creates carbon by oxidizing organic compounds. The carbon provides a good conducting path. Arcing then occurs from the carbon to the unburned portion of the branch. Once the carbon path is established completely across the branch, the fault is a low-impedance path. Now, the current is high—it is effectively a bolted fault. It is also a permanent fault. The likelihood of a low-impedance fault depends on the voltage gradient along the branch. Smaller diameter branches can burn clear before the burning transitions to a low-impedance fault. That is still an ignition risk because the burning branch can fall into other vegetation.
Energized, downed conductors are a significant ignition source. Arcing normally happens at multiple locations where a conductor contacts the earth. A conductor can remain energized on the ground because the current is often much lower than needed to operate a relay or a fuse. Fault currents range from 0 to 100 A (EPRI DRC-1, 2022; EPRI 3002012882, 2018). Ignition can happen quickly (Marxen Consulting report, 2014).
High-impedance faults can have unique characteristics. The currents from these are high in harmonics, and the current varies with time as the arcs flicker in and out. Energized, downed conductors often involve a broken conductor, and the broken conductor affects currents and downstream voltages.
A 2021 IEEE publication offers a description of three approaches, “lines of defense,” to addressing wildfires: wildfire prevention, wildfire risk mitigation and proactive response, and recovery preparedness. The first approach, wildfire prevention, is most applicable to this technology/use case. The authors list several studies relevant to the detection of conditions involving the distribution circuit that may contribute to the development of a wildfire such as HIF.[3] While various techniques for detecting HIF were outlined with supporting references, none appeared to have been implemented in a commercial product as of 2021.
General Electric (GE) markets a Multilin F60 Feeder Protection System with an HIF Detection module option said in its materials to provide “Reliable Detection of Faults Caused by Downed Conductors” with “Over 10 years of Proven Field Experience” “Using Advanced Algorithms.”[4] This device is said to maintain security against false operations. An internet search identified an IEEE publication in 2006 that indicated the detection of HIFs by the 280 Multilin F60s installed by Potomac Electric Power Company (Pepco) was “quite good.” [5] The 2006 publication observed that 280 Multilin F60s were evaluated over an average of 2 years (560 relay-years). Over this evaluation period, these relays were not set to trip automatically nor to send an alarm through SCADA. Pepco wanted to examine only the Multilin F60’s logs to confirm that a downed conductor event had been correctly identified. Unfortunately, other events overwrote these logs on several occasions due to the passage of time between the downed conductor event and its identification. Of these 280 relays, 71 incidents of downed and still energized conductors were identified from operator logs and target logs, of which 48 of the Multilin F60 logs had not been overwritten. Of these 48 event logs (for documented downed and still energized conductor events), 28 events (58%) had issued a “downed conductor” output. None of these 48 events had been cleared by conventional methods. Pepco’s bias toward security rather than outright tripping during the evaluation period played a role in this outcome. It may be that other relevant inputs such as humidity and vegetation dryness in the area of a downed conductor might be used to make tripping more likely. Out of the 560 relay-years examined, only two “false positive” incidents occurred whereby relay targets or logs identified a downed conductor fault, yet Pepco could find no documentation in their system of such an occurrence. These GE Multilin F60 outcomes are summarized here:
| Feeder-years | 560 | |
| Confirmed HIF evaluated | 71 | |
| Faults with available relay data | 48 | |
| 46 | 96% of 48 |
| 28 | 58% of 48 |
| False alarms | 2 |
Technical Readiness (Commercial Availability)
Although, detection of high impedance faults remains a challenge today, there are several commercial products available, including those developed by well-known manufacturers of distribution equipment.
General Electric (GE)
https://www.gegridsolutions.com/multilin/catalog/f60.htm
Schweitzer Engineering Labs (SEL)
https://cdn.selinc.com/assets/Literature/Product%20Literature/Flyers/Arc- Sense_PF00160.pdf?v=20161031-073656
Implementations / Deployments
Potomac Electric Power Company (Pepco) installed 280 GE Multilin F60s in 2006
Georgia Power has demonstrated downed-conductor detection comparing SCADA to OMS predictions in their operations center. Their operators have found three broken-conductor scenarios in three months. [6]
CPS Energy has demonstrated a working system that pings AMI meters for each predicted outage in the OMS to automatically detect scenarios indicating a possible live, downed conductor. [6]
Innovations as of Mid 2023
Potential Enrichment Work Opportunity
References
[1] Ignition Scenarios and Solution Options, Technical Brief: Distribution Systems, Tom Short, EPRI 3002025027, Palo Alto, CA, June 2022.
[2] PQ TechWatch: Minimizing Voltage Sags Due to Distribution Faults by Limiting Fault Current Magnitudes, EPRI, Palo Alto, CA, October 2014.
[3] Three Lines of Defense for Wildfire Risk Management in Electric Power Grids: A Review, Ali Arab, et al., IEEEAccess, 4/28/2021.
[4] https://www.gegridsolutions.com/multilin/products/hiz/index.htm
[5] A. C. Depew, J. M. Parsick, R. W. Dempsey, C. L. Benner, B. D. Russell and M. G. Adamiak, “Field experience with high-impedance fault detection relays,” 59th Annual Conference for Protective Relay Engineers, 2006., College Station, TX, USA, 2006, pp. 6 pp.-, doi: 10.1109/CPRE.2006.1638693.
[6] Modern Approaches to High Impedance Fault Detection. EPRI, Palo Alto, CA: 2018. 3002012882.
6.4 - IND.T EFD Device
Risk Reduction Category
Technology Description
Overhead transmission and distribution (T&D) lines connect urban environments and span continental grids, frequently traversing remote and difficult-to-access terrain. Stringent reliability, vegetation management, and fire protection standards create the need for utilities to navigate along power line corridors and to conduct inspections from the ground, by helicopter, and by unmanned aerial vehicle. Periodic inspection is inefficient and incapable of detecting many failures, creating opportunity for innovation.
In the Incubatenergy Labs 2020 Pilot Project the early fault detection (EFD) technology developed by IND Technology (IND.T), was tested. The EFD technology which applies radio-frequency (RF) sensors and advanced analytics for monitoring power line conditions to detect and accurately locate failing network assets—those that are deteriorated, damaged, or compromised by external factors such as vegetation encroachment. In essence, EFD finds failure-causing faults before they happen.
EFD data collection units are installed about every 3 to 5 miles along power lines to supply RF signal data for algorithms running on a secure cloud server and trained for electrical circuit diagnostics. EFD systems could potentially revolutionize utilities’ network operation, asset management, and work planning processes while cutting the number of T&D line faults causing customer supply outages and fires.
Working in collaboration with IND.T, Ameren and EPRI initiated a pilot project to assess EFD technology by importing 15 RF sensor and data collection units from Australia and installing them on 138kV wood pole and steel lattice tower lines and 34kV lines with underbuilt 12kV distribution circuits remotely located in rugged terrain in rural Missouri. As a secure EFD cloud server was already in place to support trials on high-fire-risk networks in California, installation of the RF sensor units was the only step required to commission the EFD systems.
Ameren’s EFD systems almost immediately identified and accurately located a range of issues on the trial power lines. The first suspect asset became apparent just 15 hours after commissioning the EFD system. Problems identified included a 138kV porcelain insulator string with partial discharge and a handful of distribution transformers with internal discharge, plus instances of suspected conductor damage and vegetation encroachment. Ameren responses, including some forensic investigations, have been scheduled for each of these issues.
The EFD system located issues within plus or minus 30 feet and demonstrated very sensitive detection of incipient faults. Its frequency-time signature analysis and pattern recognition gave indications of the type of failure detected and whether it was located on the monitored power line path or away from it on a tap-line or secondary supply service line. Issues were identified down to individual phases [1].
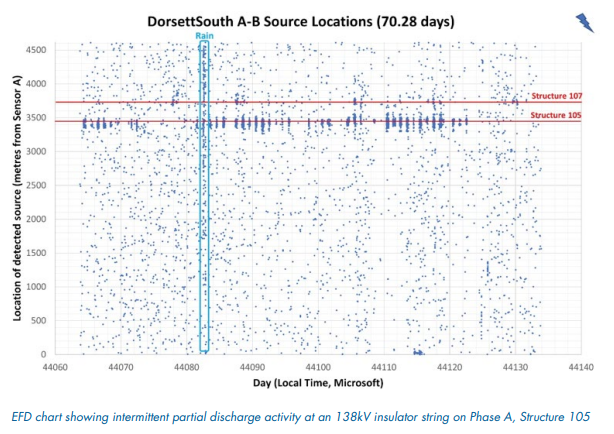
In Australia, Victoria state, the SWER (single-wire earth return) distribution has had EFD devices installed along with the requisite software. Some initial findings are:
- Successful concept development and proof-of-concept tests of a radical new approach for monitoring powerlines using sensors attached to low-voltage (LV) customer service wiring.
- Successful design and manufacture of low-cost easy-install EFD data collection units using the new sensor approach.
- Successful deployment of FireSafe SWER EFD units across Victoria to monitor 1,120 km of SWER powerlines in Victoria’s highest fire-risk areas.
- Successful confirmation of the new technology’s ability to detect and locate powerline defects, documented in case studies.
- Deployment of add-on weather stations to allow assessment of the value to network [2].
Technical Readiness (Commercial Availability)
Presently available from Australian-based company (IND Technology Pty Ltd).
Vendors with Hardware and Software
https://ind-technology.com/efd_system/
Implementations / Deployments
Ameren and Australian Utility in Victoria State
Innovations as of Mid 2023
Potential Enrichment Work Opportunity
References
[1] Incubatenergy Labs 2020 Challenge: Final Report & Pilot Demonstration Summaries, EPRI 3002020189, Palo Alto, CA, March 2021.
[2] FireSafe SWER EFD Trial Final report,17 June 2022, IND Technology Pty Ltd.
6.5 - Distribution Fault Anticipator (DFA)
Risk Reduction Category
Technology Description
When conditions are favorable, namely dry fuels, low humidity, and high winds, all that is needed for a fire is an ignition heat source. When electric energy “escapes” the normal bounds of conductors and power delivery apparatus, often by some arcing mechanism, fire ignition is possible. The various ignition mechanisms can be characterized as follows.
- Failure of a part or device such as a switch, clamp, or connector (e.g. arcing, heating, melting)
- A downed arcing conductor
- Explosion of apparatus such as transformers and capacitors
- Clashing of conductors in the air
- Arcing across conductors bridged by foreign objects (e.g. Mylar balloons)
- Vegetation interference
Often there are multiple mechanisms in play. When a tree or branch falls and tears down powerlines, arcing may occur between multiple contacting conductors or between conductors to ground. Electrical arcing is the heat source, but the vegetation interference with powerlines is the true cause. Capacitor failures which create significant electrical transients can cause the failure of arrestors or connection devices at other very remote locations resulting in a distant fire ignition. Clearly, ignition from powerline causes is often a complex series of events [1].
If the incipient stage of a failing device or line fault can be detected and located, the final catastrophic failure may be avoided and a fire will not be ignited. No existing protection device or powerline monitoring system commonly used today can detect the incipient stage of a clamp or switch failure. However, it has been shown that waveform analytics applied in real time to high fidelity captures of the electrical signatures of failing devices can identify certain failures at an early stage, long before catastrophic failure [2]. By using the results of these analytic algorithms, coupled with other utility tools such as AMI, failures can often be found and fixed in a timely manner, thereby preventing a fire.
For more than a decade, researchers at Texas A&M University have conducted substantial research, funded primarily by EPRI and EPRI-member utilities to detect and anticipate incipient failures on distribution feeders using high-fidelity waveforms and sophisticated waveform analytics. [3] This work, which has become known as Distribution Fault Anticipation (DFA) technology, has identified signatures produced by failing equipment; external intrusions into power lines; and improper or unexpected feeder events, including fault-induced conductor slaps. In many cases, utility companies have used this newfound “awareness” of feeder conditions and events to locate and correct incipient failures before they could escalate and produce catastrophic damage [4].
The DFA consists of substation-based monitoring hardware and software, connected to available potential transformers (PTs) and current transformers (CTs) used for relaying and metering. A representation of the DFA system is shown in Figure 1 in the form of a data-processing hierarchy.

Figure 1: Data-processing hierarchy employed by DFA field devices[5]
Technical Readiness (Commercial Availability)
The DFA is commercially available from Power Solutions Incorporated.
Implementations / Deployments
There are roughly 1000 DFA deployments around the world. Principally in North America and some in Europe.
The DFA has been demonstrated for specific use cases, involving multiple utilities, with EPRI involvement. These use cases are listed below [5].
- Event Category: Incipient Faults and Recurring Interruptions
- Recurrent, Vegetation-Caused Breaker Operations
- Recurrent Fault and Breached Lid of Service Transformer
- Recurrent Fault Caused by Broken Strand in Long Span
- Fault-Induced Conductor Slap
- Feeder Lockout Cause by Fault-Induced Conductor Slap
- Event Category: Line Switch and Clamp Failures
- Failure of Line Switch
- Failure of Hot-Line Clamp
- Event Category: Capacitor Monitoring
- Capacitor Restrike
- Capacitor Switch Bounce
- Capacitor Phase Failure
Innovations as of Mid 2023
Potential Enrichment Work Opportunity
References
[1] Russell, B. D., Benner, C. L., Wischkaemper, J. A., “Detection of Distribution Circuit Wildfire Ignition Mechanisms Using Substation-Only Sensors and Data Analytics” T&D World Wildfire Conference, December 8, 2020. [2] Wischkaemper, J. A., Benner, C. L., Russell, B. D., and Manivannan, K., “Application of Waveform Analytics for Improved Situational Awareness of Electric Distribution Feeders” IEEE Transactions on Smart Grid, vol. 6, pp. 2041-2049, 2015. [3] “Distribution Fault Anticipation: Phase III System Integration and Library Enhancement,” Final Report Prepared for the Electric Power Research Institute (EPRI), Document #1016036, Palo Alto, CA. July 2009. [4] Jeffrey A. Wischkaemper; Carl L. Benner; B. Don Russell; Karthick Muthu Manivannan, “Application of advanced electrical waveform monitoring and analytics for reduction of wildfire risk”, IEEE ISGT 2014. [5] “Automated Waveform Analytics for Improved Reliability and Operational Support: Demonstration of DFA Technology at Multiple Utility Companies”. EPRI, Palo Alto, CA: 2014. 3002004136.
6.6 - Smart Meters (Advanced Metering Infrastructure or AMI)
Risk Reduction Category
Technology Description
By 2023 most utilities are using Advanced Metering Infrastructure (AMI), replacing the spinning disk and monthly meter reading with solid state, multi-function, and two-way communicating smart meters. Besides benefits in streamlining the billing process, these meters provide benefits to utilities (and their customers) via increased system awareness. Most meters, regardless of manufacturer provide features such as counters, registers, and flags that can be used by utilities if their head end systems are configured to ingest and process these inputs.
Utilities can configure a smart meter installed at a residence or commercial building to detect momentary interruptions. The voltage threshold and time duration defining a momentary interruption varies according to utility policy and is programmed into the configuration file of the smart meter. After the threshold for a momentary interruption is exceeded, the smart meter increases the count within a local storage register. The cumulative value of the storage register is often referred to as the click count, where the word “click” represents a momentary interruption, and the value of click count corresponds to the number of momentary interruptions experienced by the end user. [1]
The click count from an individual meter is transmitted to a central repository and cleared from the register at some time interval determined by utility policy. Once received by the utility, the click count is time-stamped and placed within a database. Application software is used to analyze the data. With appropriate software, the combination of GIS information and the electric circuit model overlaid with information about momentary interruptions enables utility planners to identify areas for both vegetation management and inspection of conductors and equipment in the suspect area. Subsequent analysis of adjacent customers, data from the SCADA system, and other databases such as the past schedule for vegetation management are used to isolate and identify the source of the momentary interruption. [1] Mapping and analysis of momentary interruption data enable a utility to identify priority areas with a likelihood of future disruption of service and to flag those areas as high-priority candidates for preventive maintenance. [2] All of these benefits indirectly feed into a wildfire prevention strategy. Yet another use case is benchmarking performance of a wildfire mitigation investment before and after installation. For example, a utility may want to measure the fault reducing performance of covered conductor on a test circuit before committing to widespread use. Doing so could include analysis of historical AMI data from all customers on the test circuit compared with data from the same meters after installation of the covered conductor. Depending on the capabilities of the meters, they may include minor faults that are not otherwise captured by substation monitors or relay operations.
Technical Readiness (Commercial Availability)
While the overall system for such a momentary interruption analyzer application is complex, it builds upon the existing AMI investment and infrastructure. Custom queries, which can be considered a form of proprietary software, are needed that reside on top of existing software. In-house expertise is needed to design and perform the queries.
The following are well known manufacturers of AMI systems, each of which claims at least hardware support for detecting voltage sags (indicating that a fault occurred, but not necessarily with an accompanying interruption). These manufacturers make the data available for 3rd party developers to build custom applications.
General Electric
https://www.gegridsolutions.com/products/brochures/kv2-family_gea-12673.pdf
Eaton
Itron
Implementations / Deployments
While AMI is mature technology and widely deployed, specific use cases such as those described here may be provided either by in-house resources as a one-off analysis or by application extension by 3rd party developers who integrate software within an enterprise head-end system.
Innovations as of Mid 2023
Potential Enrichment Work Opportunity
References
[1] Application Readiness Guide Version 2: Assessment of AMI and DSCADA Applications with High Value Volume 2. EPRI, Palo Alto, CA: 2015. 3002007029.
[2] NEMA. “Smart Meters Can Reduce Power Outages and Restoration Time.” National Electrical Manufacturers Association. https://www.nema.org/Storm-Disaster-Recovery/Smart-Grid-Solutions/Pages/Smart-Meters-Can-Reduce-Power-Outages-and-Restoration-Time.aspx.
6.7 - Substation PQ and RFI
Risk Reduction Category
Technology Description
Power quality (PQ) events are recorded by PQ meters whenever anomalous events are detected on the power grid. Such events can be indicative of grid conditions that presage wildfire events, or can be indicative of their occurrence. Waveform data is among the most important types of measurement records due to its rich technical content; however, it is also one of the most difficult to use as, often, only detailed visual review by highly trained personnel can identify the pertinent data. The objective is to enable utilities to obtain faster situational awareness using automated waveform identification.
Using neural networks with machine learning can aid in accurately classifying the recorded waveforms and help power system engineers diagnose and rectify the root causes of problems. However, many of the waveforms captured during a disturbance in the power system need to be labeled for supervised learning, leaving a large number of data recordings for engineers to process manually or go unseen. For example, faulted voltage and current waveforms can be analyzed by AI to determine root causes. Common and unique signatures can be identified and used to classify a large data set based on the nature and cause of the fault. These classes include cable faults (cable, joint or splice, and termination failures), animal and tree contact faults, lightning induced faults, and faults cleared by current-limiting fuses.[1]
There are a number of important known power quality phenomena for which automated waveform identification would be valuable. Three such examples are described here:
- Arcing: An obvious factor in preventing wildfire is detection of electrical arching. This phenomenon is readily detectible in waveforms and automating that ability could be pivotal.
- Conductor slap: Overhead conductors coming into contact also produces unique signatures. Automated identification of these occurrences can dramatically improve mitigating and preventative measures.
- Foliage ingress: Proactive detection of the impingement of plant life on electrical circuits is an on- going and expensive task for utilities. Identification of direct contact between plant life and conductors as it is occurring can allow quick intervention as well as optimization of investment in mitigation and prevention.
- Incipient faults: Early detection of incipient faults can prevent catastrophic failure of equipment. Recognizing these faults and remediating the issue proactively can prevent fires and improve grid performance.
 |  |
Current Waveform having Incipient Faults and Their Reactance-to-Fault Estimate [1] | Voltage Waveforms of a Cable Splice Failure [1] |
Technical Readiness (Commercial Availability)
Next steps that are required in order to advance the usefulness of waveform data and achieve the visionary objectives of an AI sandbox would include these broad tasks:
- Assembly and deployment of a large and comprehensive waveform and event signature library by incorporating large, existing resources available at EPRI (over 600,000 waveforms currently), and adding additional libraries from key stakeholders such as electric utilities, national labs, universities, etc.
- Training of the waveform library using modern AI and Machine Learning techniques.
A remaining challenges in achieving the ultimate objective includes integrating the monitoring data from a wide variety of data sources like relays and meters, integrating circuit information from Cyme or GIS, and incorporating a user interface into a control center.
Implementations / Deployments
Innovations as of Mid 2023
Potential Enrichment Work Opportunity
References
[1] Distribution Fault Location and Waveform Characterization. EPRI, Palo Alto, CA: 2009. 1017842.
6.8 - Substation 60-Hz PQ Monitors
Risk Reduction Category
Technology Description
The term power quality monitor, here, refers to any monitoring device from a relay-based power quality monitor, to a fault recorder, to a dedicated PQ monitor. While most individuals are familiar with using power quality monitors to record voltage sags due to faults for later analysis, the data collected by PQ monitors is presently under-utilized with respect to wildfire detection and mitigation. In short, they can be used to improve situational awareness as described in the following points:
- Understanding how many times potential ignition events occurred that didn’t actually ignite (i.e., fault count)
- Establish baseline for the number of faults that have occurred, historically, in order to determine the effectiveness of a mitigation approach. For example, before compared to after installing covered conductor.
- When data from PQ monitors are combined with smart meters and add V, I, PF, etc from SCADA, improve opportunities to better understand where recurrent faults are happening, location, possibly cause & send someone out to do an inspection.
A PQ monitor on each distribution feeder exiting a substation might pick up electrical signals on that feeder perhaps indicating a fault or the potential for a fault. Moreover, impedance characteristics of these signals might provide an indication of the location of an issue. Thus, repair crews or fire crews could be alerted and sent to that location.
Technical Readiness (Commercial Availability)
The following list of manufacturers is the product of an Internet search using a general description of the technology as the search term. Sometimes more than one variation on the search term is used. The objective is to identify demonstration-ready products available in the category.
General Electric (GE)
https://www.gegridsolutions.com/multilin/catalog/f60.htm
ABB
https://library.e.abb.com/public/64e517269f719a5bc12573af006d2dd2/REF_550_DB41-902%20Rev.E.pdf
Schweitzer Engineering Labs (SEL)
https://selinc.com/products/735/
Dranetz
https://www.dranetz.com/product-services/encore/
Power Montiors, Inc.
https://powermonitors.com/products/
Implementations / Deployments
Countless numbers of power quality monitors are deployed, but may be presently under-utilized for wildfire situational awareness, such as mitigation approaches.
TVA has operated an impressive grid-monitoring system that may be able to calculate fault locations and possibly arcing locations. While a PQ monitor might be programmed to send alerts about high-frequency events that could be related to high-impedance faults (HIF), capacitor-switching events also cause similar high-frequency patterns.
280 Multilin F60s installed by Potomac Electric Power Company (Pepco) in 2006
Innovations as of Mid 2023
Potential Enrichment Work Opportunity
References
[1] Three Lines of Defense for Wildfire Risk Management in Electric Power Grids: A Review, Ali Arab, et al., IEEEAccess, 4/28/2021.
[2] A. C. Depew, J. M. Parsick, R. W. Dempsey, C. L. Benner, B. D. Russell and M. G. Adamiak, “Field experience with high-impedance fault detection relays,” 59th Annual Conference for Protective Relay Engineers, 2006., College Station, TX, USA, 2006, pp. 6 pp.-, doi: 10.1109/CPRE.2006.1638693.
7 - Modeling and Simulation
7.1 - Active Fire Spread Modeling
Risk Reduction Category
Technology Description
Wildfire spread modeling is an important tool for utilities, first responders, evacuation planners, insurance actuaries, and many others. Separate from risk analysis, a fire spread model predicts the direction and speed of travel of a fire based on factors such as fuel condition, windspeed and humidity.
Utilities, for example benefit from a fire spread model to predict when and where critical infrastructure maybe become threatened assets. Utilities desire to keep circuits operational as much as possible, especially where the cost of an interruption is very high. Therefore these models help to narrow the focus to specific areas and provide warning for impending actions by the utility. Knowing gust potentials in certain locations can provide an indication of where and when to remediate via undergounding power conductors or shutting off power.
A gap that exists today is the lack of integration of sensors. For example, San Diego Gas & Electric (SDGE) has hundreds of weather stations providing data on windspeed, however, while these sensors may be providing useful information, they are underutilized in terms of the potential benefits for this particular use case.
To perform a consequence analysis, detailed information concerning the involved materials, assets, and hazards must be available and understood. The consequence-analysis model has an existing fire risk where assets might include demographic data along with hospitals, assisted living facilities, etc. and possibly including a health & safety layer.
Fire spread forecasting can reveal where areas may be most threatened. One wildfire-modeling system in use for 50 years is the Rothermel Fire Spread Model first published in 1972 and referenced by the USDA and US Forest Service [2]. This model is used in multiple computerized fire behavior models. Modeling is essential in identifying risk to downstream communities taking into account windspeed, dryness of vegetation, and other factors. Modeling should include a fuel condition layer that should be updated on a weekly basis to provide accurate predictions based on the condition of vegetation
Technical Readiness (Commercial Availability)
Fire spread modeling is not a technical gap today, but can be cost prohibitive. Larger utilities and fire agencies such as CAL FIRE, along with state and federal government agencies are among the current subscribers to a commercially available product by Technosylva. Technosylva combines multiple fire-related models to predict wildfire behavior, mitigate wildfire risk, and improve wildfire operations, response, and firefighter safety.[1] Their software provides the following functionality: [3]
- Comprehensive situational awareness
- Resource and incident management
- Collect and view real-time data from the field
Individual models, such as those used by Technosylva, have been developed for the open source community and are available license-free. With this in mind, Pacific Northwest National Lab is developing a suite of tools offering similar capability and functionality as the commercial product.
Technosylva
https://technosylva.com/products/wildfire-analyst/firesim/
Pacific Northwest National Lab (PNNL)
https://www.pnnl.gov/news-media/taming-tomorrows-wildfires
Implementations / Deployments
Larger utilities and fire agencies such as CAL FIRE, along with state and federal government agencies are currently subscribed to the commercially available Technosylva product. Cost is a barrier for smaller utilities and co-ops.
Innovations as of Mid 2023
Potential Enrichment Work Opportunity
References
[1] https://www.thehartford.com/insights/home-workplace-safety/protecting-against-increased-wildfire- risk
7.2 - Event Response
Risk Reduction Category
Technology Description
Seasonal wildfire poses a substantial risk to private citizens who may be forced to evacuate as fires encroach on residential areas. Exacerbating the issue is continued housing construction near fire-prone areas. For first responders, the potential for fast-moving burns demands situational awareness in near-real-time. The objective is not only timely response, but prioritized response.
Multiple sensors located in potential wildfire zones may provide any or all of this information which may be organized on a geospatial and interactive map similar to that found at the National Interagency Fire Center map as illustrated below [1]. A number of layers with corresponding information may be seen at left.

Figure source [1]
Because the speed and direction of fire spread are mainly driven by fuel and by weather, responders need geographically and temporally resolute data. There is currently no single source of truth for fuel density and what fuel data exists can be either outdated or spatially sparse. Similarly, weather may be obtained from the National Weather Service, but more timely updates and more weather stations reporting are helpful for predicting fire spread.
Other layers of intelligence that are needed for timely and prioritized response may include factors that affect access, such as road congestion, smoke (for aerial support), downed powerlines, and other hazards. Additional intelligence may include automatic warnings of wildfire proximity to critical infrastructure and a priority marker for infrastructure feeding critical services such as hospitals, food supply, etc.
Technology goals for improving the future state of event response would include:
- Single source of truth for fuel condition
- A software platform to ingest data from multiple disparate data sources
- Visualizations that improve decision making
Technical Readiness (Commercial Availability)
Fire Spread Modeling
Pacific Northwest National Lab (PNNL) is studying a different approach to identifying the potential path of wildfires came from atmospheric scientists: two new models employ twenty-eight “wildfire predictors” to project current wildfire behavior. Used with climate change modelled estimates, these two models may project future wildfire behavior. Several variables such as atmospheric moisture levels, vegetation dryness, density of nearby population and others may better determine wildfire likelihood, the extent of the burn, and the amount of smoke sent into the atmosphere. [2]
Data-driven Wildfire Analytics
Sandia National Labs (SNL) is modeling wildfires using accurate and current characterization of vegetation fuel along with existing work from the Resilient Energy Systems-funded Lab Directed Research and Development (LDRD). Use weather station data and satellite imagery to generate machine learning (ML)- derived characterization of vegetation. Thus, utilities may better assess, plan, and adapt to wildfires. Outputs from the model include burn probability, energy release component, and wildfire behavior. Sandia proposes to run simulations with active fire perimiters as inputs. [3]
In a separate effort SNL is working on near-real-time determination of wildfire risk with respect to critical infrastructure including wildfire impacts leading to cascading failure. Determine near-real-time fuel moisture by applying machine learning to weather station data. Identify component damage by using wildfire-spread software and Sandia grid modeling and interactive map. [3]
Sandia is also studying how visualizations impact decision making. Various representations of uncertainty may result in differing decision patterns—regarding when or if homes should be evacuated, for instance, or when a Public Safety Power Shutoff (PSPS) may be necessary. Sandia hopes to support optimal decision making regarding grid operations through better understanding of how those decisions may be affected by visualization. [3]
Implementations / Deployments
Innovations as of Mid 2023
Potential Enrichment Work Opportunity
References
[1] https://maps.wildfire.gov/sa/#/%3F/%3F/38.7471/-87.3725/6
[2] https://www.pnnl.gov/news-media/taming-tomorrows-wildfires
[3] https://energy.sandia.gov/programs/electric-grid/wildfire-electric-grid-resilience/
7.3 - Evacuation Route Analytics
Risk Reduction Category
Technology Description
Evacuation route planning is a complex and multi-variable challenge. Issues arising in California due to recent wildfire events have identified the need for quantitative evaluations concerning evacuation routes and travel times. Project-level California Environmental Quality Act (CEQA) analyses should include these. Recent court rulings have underscored the need for the CEQA to more fully consider the potential effects on evacuation routes of projects located in high wildfire-prone areas.
The range of evacuation conditions including time of day, fire behavior, route options, automobile availability, and shelter locations greatly complicate forecasting evacuation trip demands. For instance, at night, nearly 100% of population may be at home whereas at 5 pm, people returning home from work would be mixing with the traffic trying to escape the emergency. Further complications include multiple cars and drivers per household that might add even more vehicles on the road as people try to save as many vehicles as possible in a crisis.
Planning scenarios should consider historical evidence from past events, and expert opinions (also based on evidence) from local fire and law enforcement personnel. Another consideration involves “the State of the Practice” that may inform analysis methods. For instance, travel demand data (whatever its source) along with Highway Capacity Manual (HCM) methodologies might be used within a simulation model to estimate delays within the transportation network.
However, travel demand models during non-emergency situations have been found to underestimate travel times in often-congested corridors by 50% to 100%. This may be even worse during an evacuation event. Dynamic Traffic Assignment (DTA) models may use uncongested speed and capacity data coming from a local travel demand model along with how queues build in the travel corridor over time along with evacuation demand to generate evacuation time estimates. The traffic operations analysis should fit the congestion context [1].
Geolocation services, relying on the Global Positioning System (GPS), and Geographic Information Systems (GIS) may be instrumental in identifying potential escape routes and routes to avoid. Smartphones, vehicles, and wearable devices may access this information [4]. Thus, Real-time location tracking, proactive communication, and situational awareness may be available to emergency officials and citizens alike.
Technical Readiness (Commercial Availability)
Fehr & Peers has developed a tool called EVAC+ to work out an emergency evacuation capacity assessment [8]. This tool addresses complex emergency evacuation challenges by interfacing with regional travel demand models. It considers inputs such as number of people and vehicles per household, the distribution of evacuation trips during the event, and a dynamic traffic assignment (DTA) model to estimate travel times. “Our understanding of traffic operations and travel demand forecasting provides a unique platform to assist in evaluating emergency evacuation scenarios as part of this effort. Ultimately, our goal is to provide meaningful information to our clients that will benefit the community during an evacuation event.” [8]
The Federal Highway Administration has produced a series of tools/articles on the subject of Using Highways During Evacuation Operations for Events with Advance Notice [5]. Examples are Evacuation Traffic Information System (ETIS), and Evacuation Travel Demand Forecasting System among several others. ETIS is a web-based application that.
Plume Modeling Tools predict the direction and speed that a plume may travel from its release location. The plume may be created by fire, radiological or chemical release, or other causes of traveling airborne contaminants. Many plume models exist, most being specific to the type of event that caused the plume. These models accept site-specific data such as wind speed, direction, and other factors. [5]
Implementations / Deployments
Innovations as of Mid 2023
Sandia National Lab is taking into account an additional layer of complexity to planning for disaster evacuations by considering a new and growing segment of drivers: those owning electric vehicles.
The study identifies the impacts of vehicle charging load on the grid during evacuation periods as well as the impact of limited range on passage through planned routes. The study discusses optimizing infrastructure related to EV charging to maximize charging capability and to minimize evacuation time. According to Sandia’s website, the impacts of this project are: [7]
- Impacts analyses of EV penetration on the power grid during evacuation
- Solutions to satisfy the unserved EV load during evacuations
- Multi-objective optimization models to maximize evacuation efficiency and utilization of EV supporting infrastructure.
Potential Enrichment Work Opportunity
References
[1] Fehr & Peers, “Evacuation Planning & Resilience” https://www.fehrandpeers.com/evacuation-travel-time-analysis\
[4] Utilities One: https://utilitiesone.com/geolocation-solutions-empowering-community-specific-emergency-evacuations
[5] https://ops.fhwa.dot.gov/publications/evac_primer/23_monitoring.htm
[7] https://energy.sandia.gov/programs/electric-grid/wildfire-electric-grid-resilience/
[8] https://www.fehrandpeers.com/wp-content/uploads/2022/08/Evacuation-Planning-Resiliency-Packet.pdf
7.4 - High Resolution Weather Forecasting
Risk Reduction Category
Technology Description
The key enabler for high resolution weather forecasting is data. Current weather conditions are the input to the prediction models, so the more accurate, spatially dense, and timely this data, the better the prediction. New forecasts can be generated on demand to keep pace with rapidly evolving weather scenarios. This is not possible using commodity data products, which are generated on a rigid, fixed production schedule.
Instead, a dedicated deployment of multiple strategically-located weather stations can provide the data needed at the desired update rate. This is known as a mesonet, a mesh network of weather stations containing various sensors that blanket a region to account for perturbed atmospherics due to significant changes in the terrain. Researchers predicted that feeding a forecasting model that is tailored for a particular region would provide predictions that are far superior to commodity weather forecasts, which may be prone to false positives. A mesonet can aid in preventing such false positives in addition to providing more accurate magnitude, type, duration, location, and timing of events. The atmospheric conditions at a single weather station within a mesonet can be gathered frequently—such as once per minute—to ensure that changes in weather determinants are accurately represented in the model. Data from a mesonet is quality controlled periodically—such as every five minutes. Quality-assurance tests are also conducted periodically to ensure that mesonet data is reliable. [1]
In addition to more common measurements like temperature, humidity, wind speed, and solar radiation, weather stations can transmit data from external sensors nearby such as precipitation gauges, ultrasonic snow depth sensors, and buried sensors that monitor soil temperature and moisture. Additionally, web cameras can monitor sky conditions.
With weather station technology and mesonets fairly established as of 2023, the cutting edge technology is not the hardware itself, but the applications and use cases that are enabled by this hardware.
Public Safety Power Shutoff
Due to the extensiveness of the electric grid, it is not technically or economically feasible to fully eliminate risks through grid hardening. Electric utilities therefore also use proactive de-energization of certain high-risk pathways, widely known as Public Safety Power Shutoffs (PSPS), during critical fire weather, to avoid or minimize fire risks. Unfortunately, PSPS events coupled with an extreme fire danger may negatively impact and introduce new risks to society and to vulnerable customers. Emergency and community support services (e.g., emergency communication, transportation for potential evacuation, water delivery systems for firefighting, medical support services) may be in high demand during these events and difficult to access [2]. Because of these societal disruptions, utilities are cautious to exercise this option. Intelligence feeding this decision is therefore critical. Precise location of storm activity, its strength, and direction are critical pieces of information that feed the decision. With accurate storm information, utilities can localize their efforts more precisely than without it. [Andre]
Strategic Undergrounding
San Diego Gas and Electric (SDGE) gathers data from hundreds of weather stations within its service territory. From this data, they obtain knowledge on wind gust potential. This historical record can be used to determine when and where to remediate via undergounding as well as PSPS. [Andre]
Overloaded Transmission Lines
Another use case for high resolution wind data is related to overloading of transmission lines. Where lines are overloaded in areas of steady and moderate wind (e.g. 3 mph), the cooling effect of the wind reduces negative effects of overloading. However, during extended periods of lower than normal wind, heating in the lines increases sagging, and, under more extreme conditions, can cause annealing of the conductor. [Andre]
Fire Spread Warnings
High resolution data on windspeed and direction can also feed fire spread prediction models and assess risk to downstream communities. [Andre]
Technical Readiness (Commercial Availability)
Following are examples of professional and research grade weather station hardware currently available commercially.
Campbell Scientific
-
https://www.campbellsci.com/fire-weather (fire-centric weather station)
Implementations / Deployments
The topic of interest is not the weather station technology itself as much as it is about the deployment of mesonets and how data from those mesonets can inform utility decision-making. The number of mesonets is growing in the USA, with several state-wide mesonets existing as of 2023.
A listing of statewide mesonets in the USA is provided at https://nationalmesonet.us/nmp-partners/
A few examples from that website are:
Kentucky: https://www.kymesonet.org/
North Carolina: https://econet.climate.ncsu.edu/
Delaware: http://www.deos.udel.edu/
New York: http://www.nysmesonet.org/
Hawaii: https://www.hawaii.edu/climate-data-portal/hawaii-mesonet/
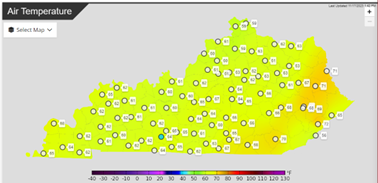
Nearly 100 Campbell Scientific weather stations monitor meteorological parameters as part of New Zealand’s fire weather network. The stations record temperature, relative humidity, wind speed and direction, and rainfall. Both hourly and daily data from the stations are stored. The data is entered into the Fire Weather Index component of the New Zealand Fire Danger Rating System. The stations' ability to operate unattended on low power and withstand environmental extremes make them ideal for this kind of monitoring.[3]
Innovations as of Mid 2023
Regarding PSPS, Pacific Northwest National Lab (PNNL) is working on ways to identify exactly what needs to be shut off. Using historical weather data and records of past warnings, PNNL seeks to learn how much of a county optimally would have been affected.
Potential Enrichment Work Opportunity
Integrating external “enrichment” data into their existing (but disparate) datasets confers greater foresight because of the immense volume of data available from system sensors, consumer reports from social media and other channels in the public domain, and data from weather services, just to name a few. In addition, visualizing analyzed data—often in layers—and subsequently presenting the data to operators and other stakeholders enhance planning, tactical operations, and communication to customers, to regulators, and especially to workers with boots on the ground. Data visualization improves system-restoration efforts in a service territory that may span many square miles—even in several service territories that straddle multiple states.[1]
References
[1] Ameren Missouri Tackles Storm Forecasting to Anticipate System Damage and Accelerate Restoration of Service. EPRI. Palo Alto, CA: September 2015. 3002006638.
[2] Wildfires and Public Safety Power Shutoffs: Distributed Energy Resources for Community Electricity Resilience. EPRI. Palo Alto, CA: December 2021. 3002017505.