Electric distribution systems are large and complex, composed of many different functional components installed at different points in time. This diversity of age / design / function makes reliability analysis a complicated problem. Nevertheless, as distribution systems age and more distribution assets are placed underground, engineers and planners use failure rate information as inputs to their decision matrices. This page provides the most recent analysis of collected failure data from utilities.
Based on information from 19 utilities. The median average, excluding third party damage, for all components is estimated at:
2.89 failures / 100 conductor miles / year. – Extruded cables account for more than 50% of these failures.
The utility systems, for which EPRI has received data, will have differing ages and compositions. Approximate timelines for the use of selected cable insulations in North America are listed in the 2023 EPRI Bronze Book.
The figure below shows the density distribution of the distribution failure rate for all components.
Analysis
Utilities (Investor Owned, Cooperative, and Public Power) were requested to provide their estimates for numbers of failures, excluding third part damage, and their split between failures in cable, joints, and terminations. The figure below shows the density distribution of cable failure rates after adjusting for the length of each underground system. The spread of the data shows the diversity in failure rates experienced by different cable users, with the majority in the range of 0.7 to 4 failures / 100 miles / year.
Reported Cable Failure Rates
The current estimates of the median failure rates are tabulated below.
Median Failure Rates (Failures / 100 conductor miles / year)
Cable
1.2
Joints
0.7
Terminations
0.2
It is anticipated that these estimates will be refined as more utilities provide data.
Notes:
The designation of an accessory failure vs a cable failure has been made by each contributing utility. Thus, it is possible that different separation criteria were used.
The cables and accessories within the utility systems, for which EPRI has received data, will have differing ages and compositions. Approximate timelines for the use of selected cable insulations in North America are listed below (further information in the 2023 EPRI Bronze Book).
Analysis of the anticipated lifetimes has not yet been conducted as part of this work.
Insulation Technology Timeline (approximate usage in North America)
Discussion and Future Work
Underground assets follow the typical “Bathtub Curve” where early in their life some locations experience failure due to manufacturer and installation issues; then there is a long middle-life period of low and relatively stable failures; finally, the equipment begins to wear out and aging causes the failure rate to accelerate. Moreover, utilities operate a mix of designs (see estimate below) and installations each with their own longevity characteristics. Yet, the annual failure rates, experienced by utilities are a composite of all these factors.
Research is underway that will investigate ways to tease the age and mix factors apart such that members will have access to more granular data.
In 2024, EPRI will provide opportunities for you to contribute and derive value from these studies for your utility.
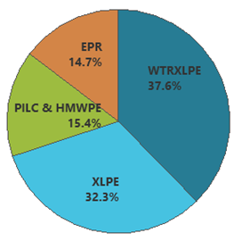
Estimated Installed Cable System Population (by insulation type)
Bibliography
EPRI Underground Systems Reference Book 2023 Edition – Chapters 12 & 17
Lawson JH and Thue WA: “Summary of service failure of high voltage extruded dielectric insulated cables in the United States,” ICEI Boston, 1980, pp. 100-104
1 - Underground Components
All Cable Component Failure
Electric distribution systems are large and complex, composed of many different functional components installed at different points in time. This diversity of age / design / function makes reliability analysis a complicated problem. Nevertheless, as distribution systems age and more distribution assets are placed underground, engineers and planners use failure rate information as inputs to their decision matrices. This page provides the most recent analysis of collected failure data from utilities.
The utility systems, for which EPRI has received data, will have differing ages and compositions. Approximate timelines for the use of selected cable insulations in North America are listed in the 2023 EPRI Bronze Book.
The figure below shows the density distribution of the distribution failure rate for all components/ This is based on information from 19 utilities. The spread of the data shows the diversity in undergrounding rates, with the median average being:
2.89 failures / 100 conductor miles / year.
Inspection shows that the distribution is skewed to the lower failure rates.
Utilities may determine the context for own failure rates using the cumulative distribution to the left.
As an example a utility with 5 failures / 100 conductor miles / year would be at the 83rd percentile ie only 17% of utilities would have a higher failure rate.
2 - Cable Failures
Extruded Cables
Electric distribution systems are large and complex, composed of many different functional components installed at different points in time. This diversity of age / design / function makes reliability analysis a complicated problem. Nevertheless, as distribution systems age and more distribution assets are placed underground, engineers and planners use failure rate information as inputs to their decision matrices. This page provides the most recent analysis of collected cable failure data from utilities.
The cables and accessories within the utility systems, for which EPRI has received data, will have differing ages and compositions. Approximate timelines for the use of selected cable insulations in North America are listed in the 2023 EPRI Bronze Book. At this stage the data does not permit estimating the separate failure rates for different insulation materials and cable vintages.
The designation of an accessory failure vs a cable failure has been made by each contributing utility. Thus, it is possible that different separation criteria were used.
The figure below shows the density distribution of the distribution failure rate for extruded cables only. This is based on information from 18 utilities. The spread of the data shows the diversity in undergrounding rates, with the median average being:
1.67 failures / 100 conductor miles / year.
Inspection shows that the distribution is skewed to the lower failure rates.
Utilities may determine the context for own failure rates using the cumulative distribution to the left.
As an example a utility with 2 cable failures / 100 conductor miles / year would be at the 61st percentile ie 39% of utilities would have a higher cable failure rate.
3 - What Components Fail
Disbursement of Failures
Failures on the distribution system can come from many sources The pie chart below shows the disbursement of failures (median) by component
Utilities may determine the context for own failure rates using the cumulative distribution to the below.
As an example a utility with 25% of the failures ascribed to joints would be at the 62nd percentile.
4 - Composition of Underground Systems
% Undergrounded
All utilities will have a portion of their distribution assets installed underground. The amount installed underground varies between utilities and depends upon a number of factors:
Climate
Cost perspectives
Geology and Geography
Population Density
Reliability Goals
Data for > 30 utilities has been collated to estimate the distribution for the percentage of distribution circuits placed underground
The figure below shows the density distribution of undergrounding at utilities. The spread of the data shows the diversity in undergrounding rates, with the median average being:
37.5% of the distribution system is underground.
Inspection shows that the distribution is skewed to the smaller percentages underground.
Utilities may determine the context for their percentage underground using the cumulative distribution the left.
As an example a utility with 20% of their distribution assets installed underground would be at the 13th percentile ie only 13% of utilities have a smaller amount of distribution undergrounded.
5 - Participate in this Research
To participate in this research and help refine the knowledge please download and complete the Table below and return to:
In this work EPRI is trying to collate some of the basic information for Underground Distribution Systems – the sort of information that gets asked regularly but where there is no one place where it resides.
Moreover, it is the style of background information that we use to guide EPRI’s research programs.
Could you please use the resources on hand or your best judgement to fill in the attached Table below? Please leave blank the parts where you have no information.