Visualize: Gaining Insights Faster
Data analytics can be highly effective to help you make decisions and solve problems — but only if people can understand the results. Presenting data visually helps make your analysis more accessible and engaging. Consider all the possibilities of analysis if you could combine data from legacy sources (such as old databases, spreadsheets, and outdated proprietary systems) with current data, and use it in different ways. Applying data visualization techniques early in the process enables you to reveal new insights faster, so you can take action.
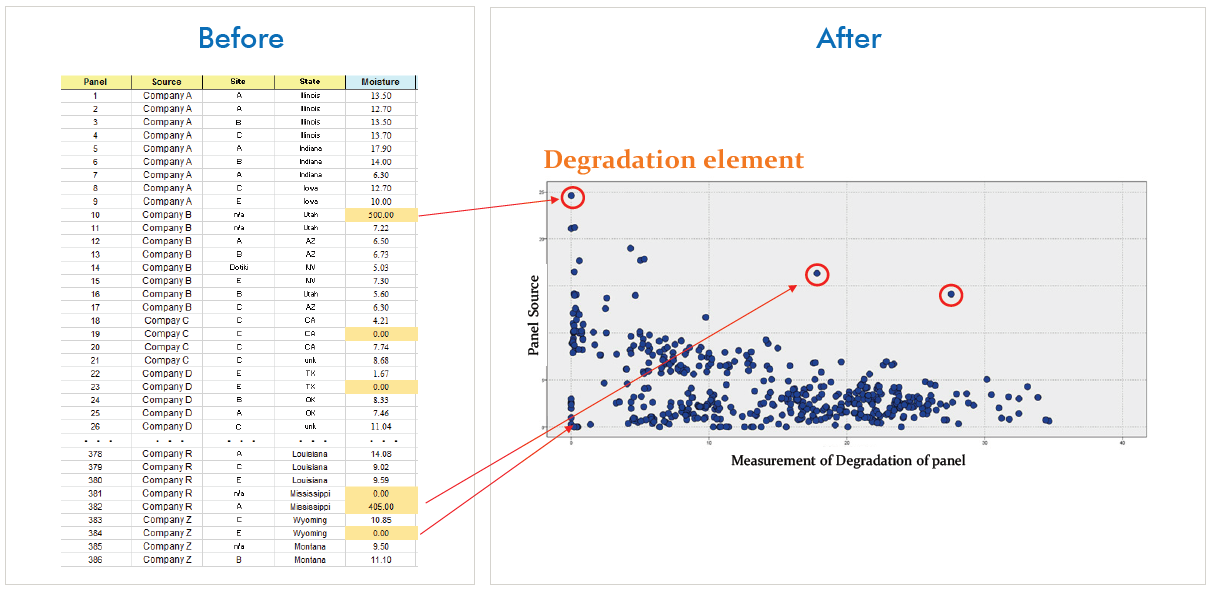
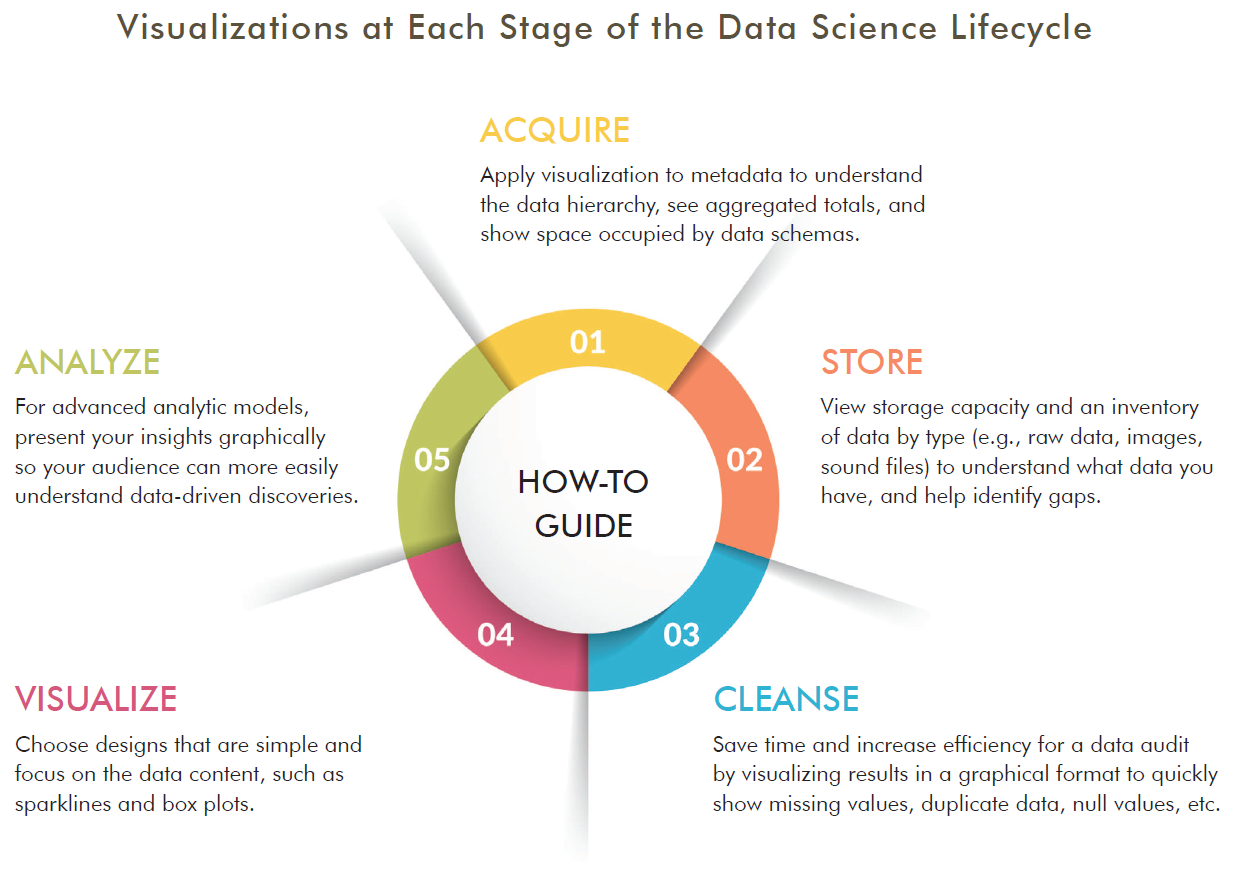
Graphical displays of data are an effective practice that should not just wait until your final presentation. It’s helpful to incorporate visualization techniques at every stage of the Data Science Lifecycle. As an example, the images below use the same data related to the Cleanse stage. In the “Before” view, you can see how a table with hundreds of rows can make it hard to find patterns. In the “After” view, in a quick glance at a scatterplot chart, you can easily identify patterns and detect outliers.
Objective
Your objective is to experiment with new ways to apply data visualization techniques to gain insights faster. When you can see patterns, you increase your understanding of the data. This may give you a headstart in planning how to improve the preparation and cleansing required to obtain meaningful results.
Below is an example of how data visualization is helpful in making it easier to understand and identify trends. This “After” view shows data for a solar corrosion analysis using box plots. Box plots provide a simple, intuitive way to show the overall range, median, and any outliers for each of the variables in the data.
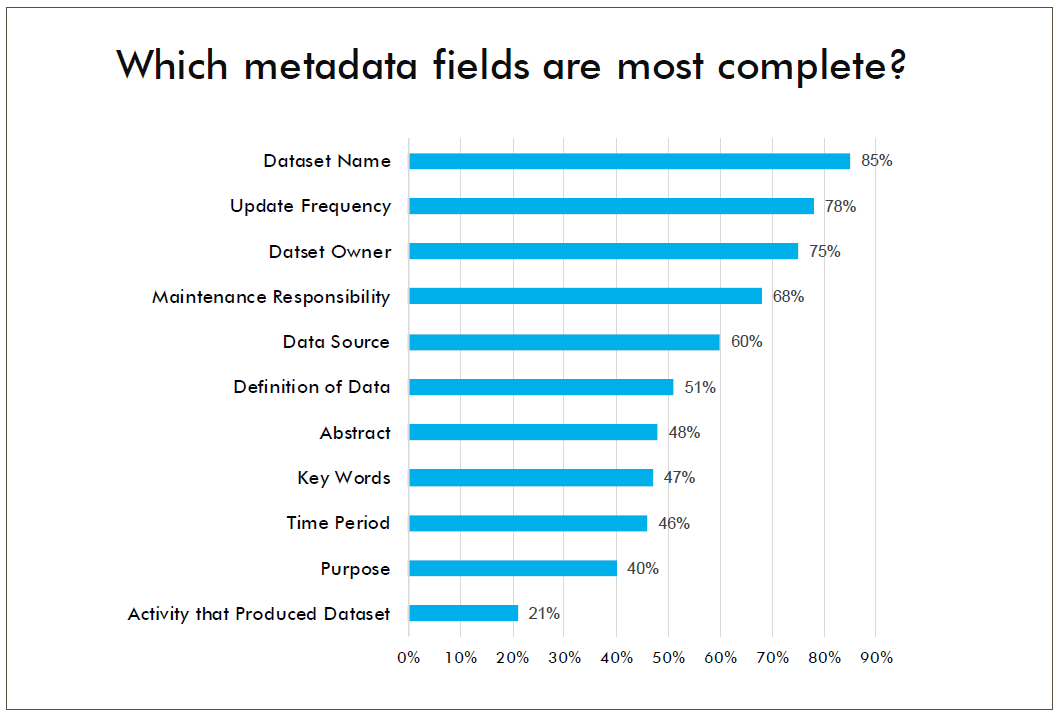
The graph below displays aggregated totals for metadata, which is part of the Acquire stage. It shows areas where metadata fields are mostly complete (e.g., Dataset Name, Update Frequency) and fields where information is missing (e.g., Abstract, Key Words, Time Period, Purpose).
Quick Tips
- Expand your thinking about visualization. Explore classes, webinars, and online tutorials. New approaches and tools can help you present data in interesting ways.
- Begin by creating simple visual presentations of your data that clearly communicate key concepts, then branch out and experiment.
- Apply visualization at each stage of the Data Science Lifecycle to gain insights faster. The more you practice, the more comfortable you will become with the tools and techniques.
- Get ready to think differently about your data. Graphics are successful when data patterns and insights are easy to understand. This simplicity takes time and practice.
Key Insights
- Presenting data visually helps reduce complexity and facilitates seeing unique characteristics, such as patterns and outliers.
- Visuals help spark ideas about the data and help you and your stakeholders discover insights faster.
- Visualization tools enable you to enhance how you communicate insights by presenting data in multiple ways. These tools also expand the ways you can explore information.
Conclusion
Data visualization can expedite processes in the Acquire, Store, and Cleanse stages of the Data Science Lifecycle by displaying insights that help advance your work to the next stage. Using these techniques is a more efficient way to understand insights faster for informed decision making.
To help you select the right visualization software tools, below you can download sample business and technical requirements, and use a sample scorecard for evaluating solutions to best meet your needs.