Conferences, Training and Webcasts
Resources for getting started and learning about AI.

Use Cases
Explore various data science EPRI use cases to further here.
External Resources
Additional data science resources.
This the multi-page printable view of this section. Click here to print.
Resources for getting started and learning about AI.
Explore various data science EPRI use cases to further here.
Additional data science resources.
Predictive Analytics World The “premier machine learning conference.” Tracks in industry, deep learning, business, and more. Includes speakers, workshops, and networking opportunities.
Machine Learning and Data Mining (MLDM) Brings together researchers on machine learning and data mining. Conference includes talks, workshops, tutorials and exhibition.
AI & Big Data Expo Expo showcases next gen technologies and strategies from AI and big data. Tracks include Enterprise AI & Digital Transformation, Data Analytics for AI & IoT, Big Data Strategies and more.
Learn Data Science from the comfort of your browser, at your own pace with DataCamp’s video tutorials & coding challenges on R, Python, Statistics & more.
Get the latest tech skills to advance your career. Browse Nanodegree programs in AI, automated systems & robotics, data science, programming and business.

AI, Analytics, Data Science, and Machine Learning Courses, online and on-site.
Self-paced learning is the new trend and we must say, it’s really effective. With the evolution of technology, one of the benefits that have reached the common man is the exposure to educational content and information that will help him or her evolve as a person. With YouTube, this has gone to the …

Get a quick introduction to data science from Data Science for Beginners in five short videos. This video series is helpful if you’re interested in doing data science - or work with people who do data
( TensorFlow Training - https://www.edureka.co/ai-deep-learning-with-tensorflow )This video on Artificial Intelligence gives you a brief introduction to AI a….
Learn about evaluating your data to make sure it meets some basic criteria so that it’s ready for data science. This second video in the Data Science for Beginners series h…
This Data Science Tutorial will help you understand what is Data Science, who is a Data Scientist, what does a Data Scientist do and also how Python is used …
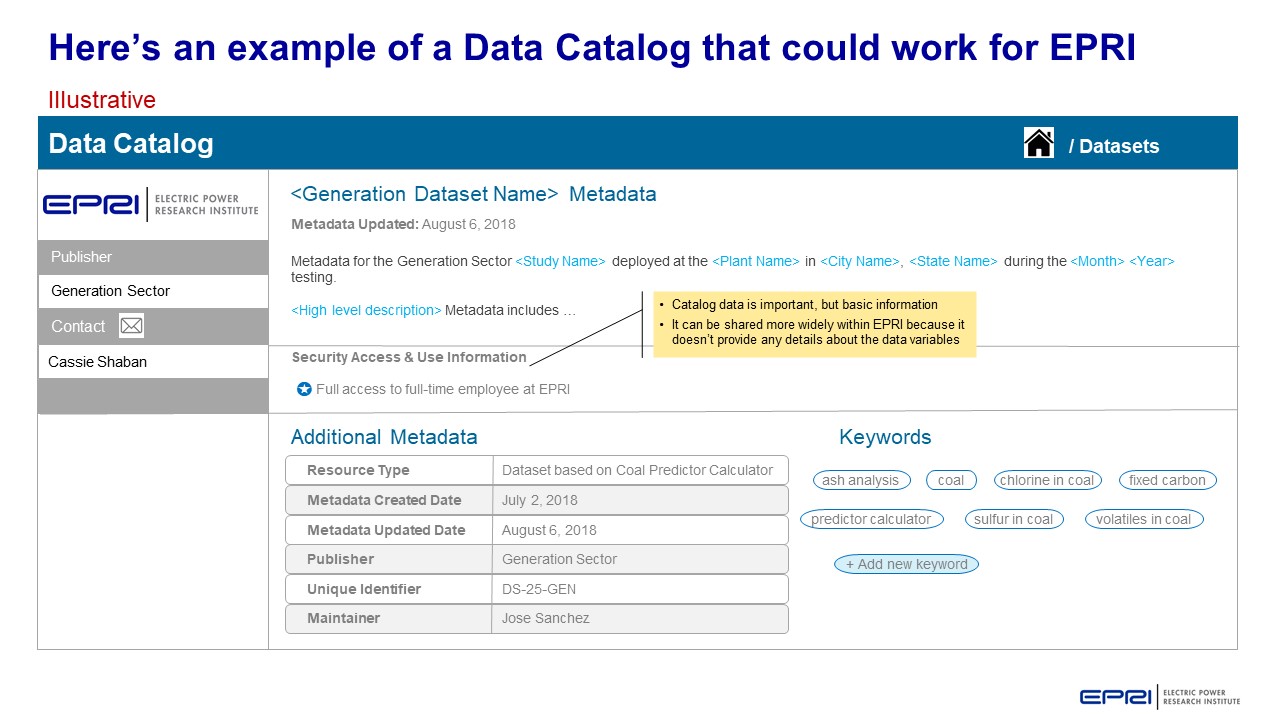
Metadata schema examples that help others at EPRI know what kind of data is available for them to use in research and how to search for this data.
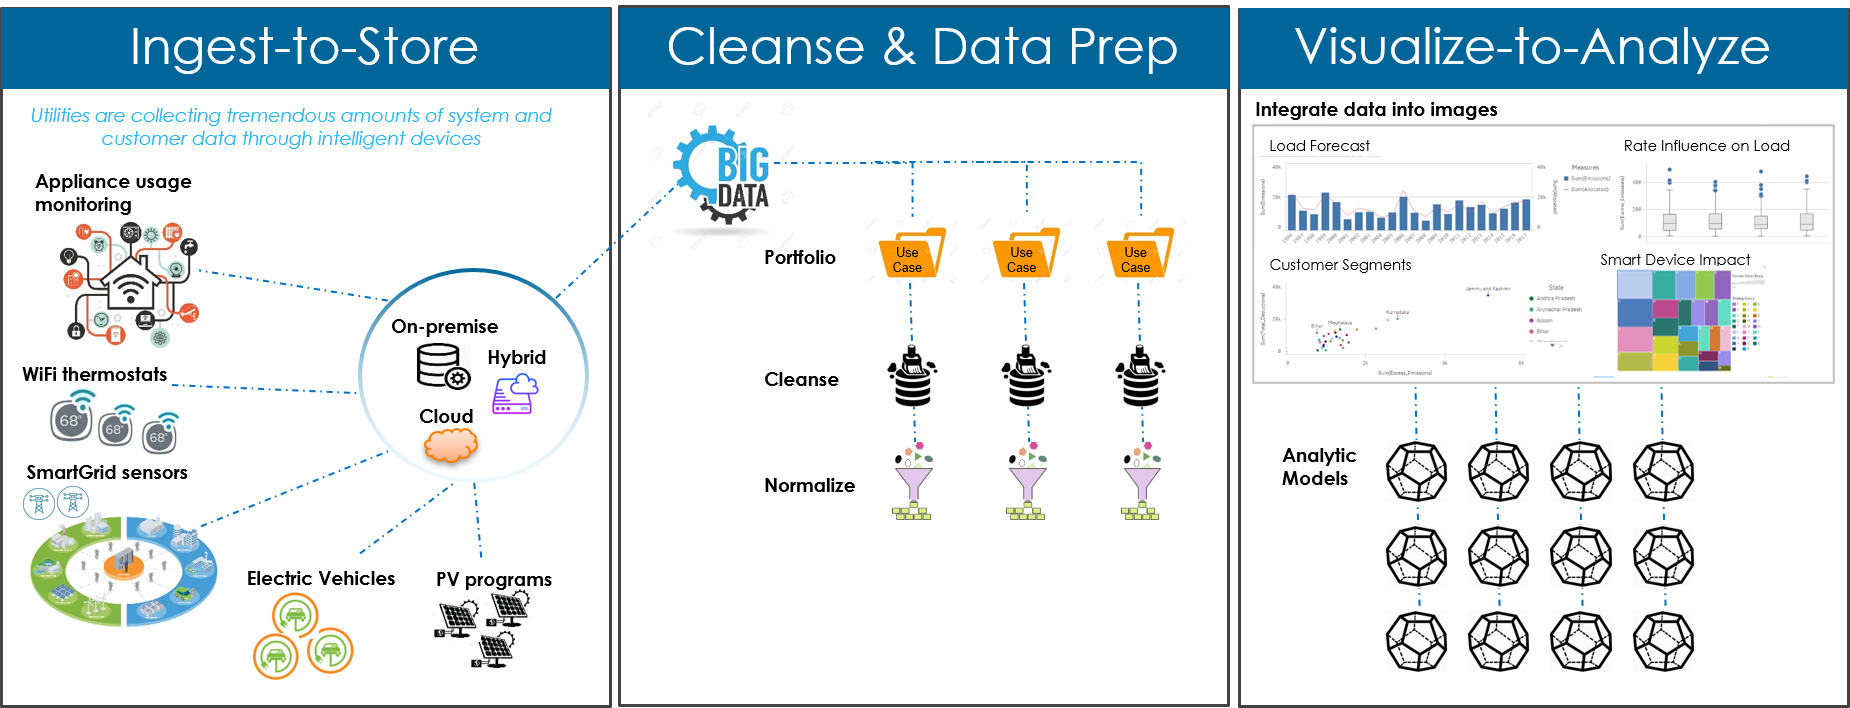
This is a high level overview of the journey that PDU and its members are likely to follow for Data Analytics.
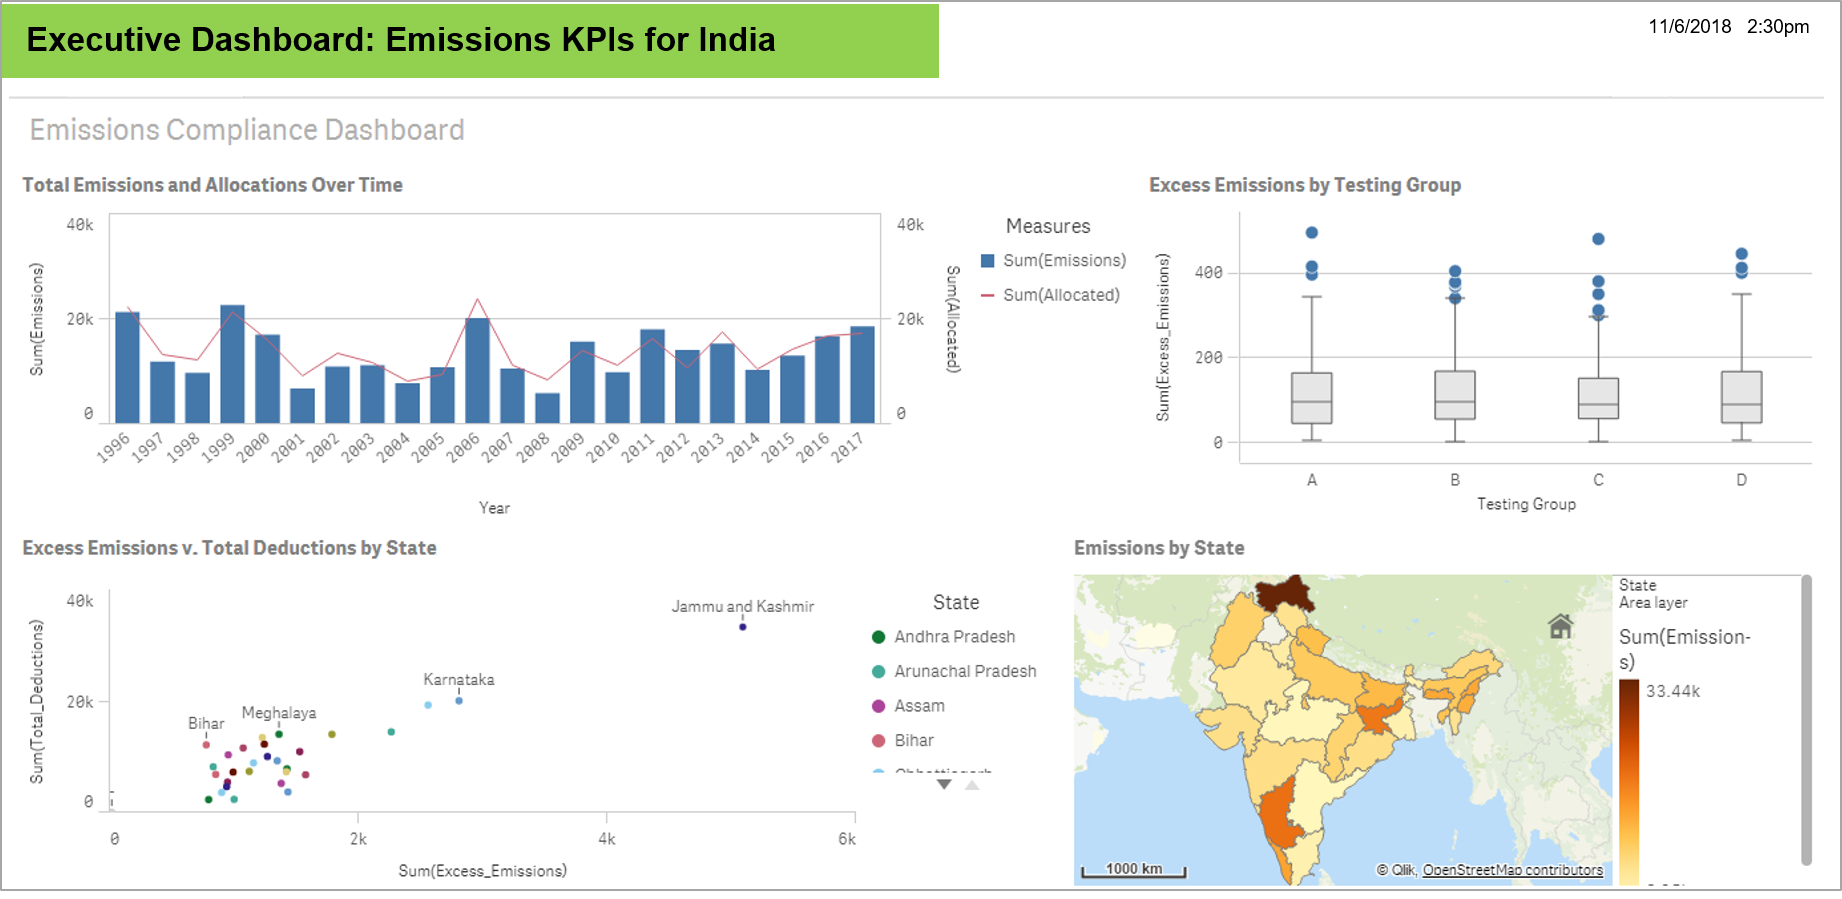
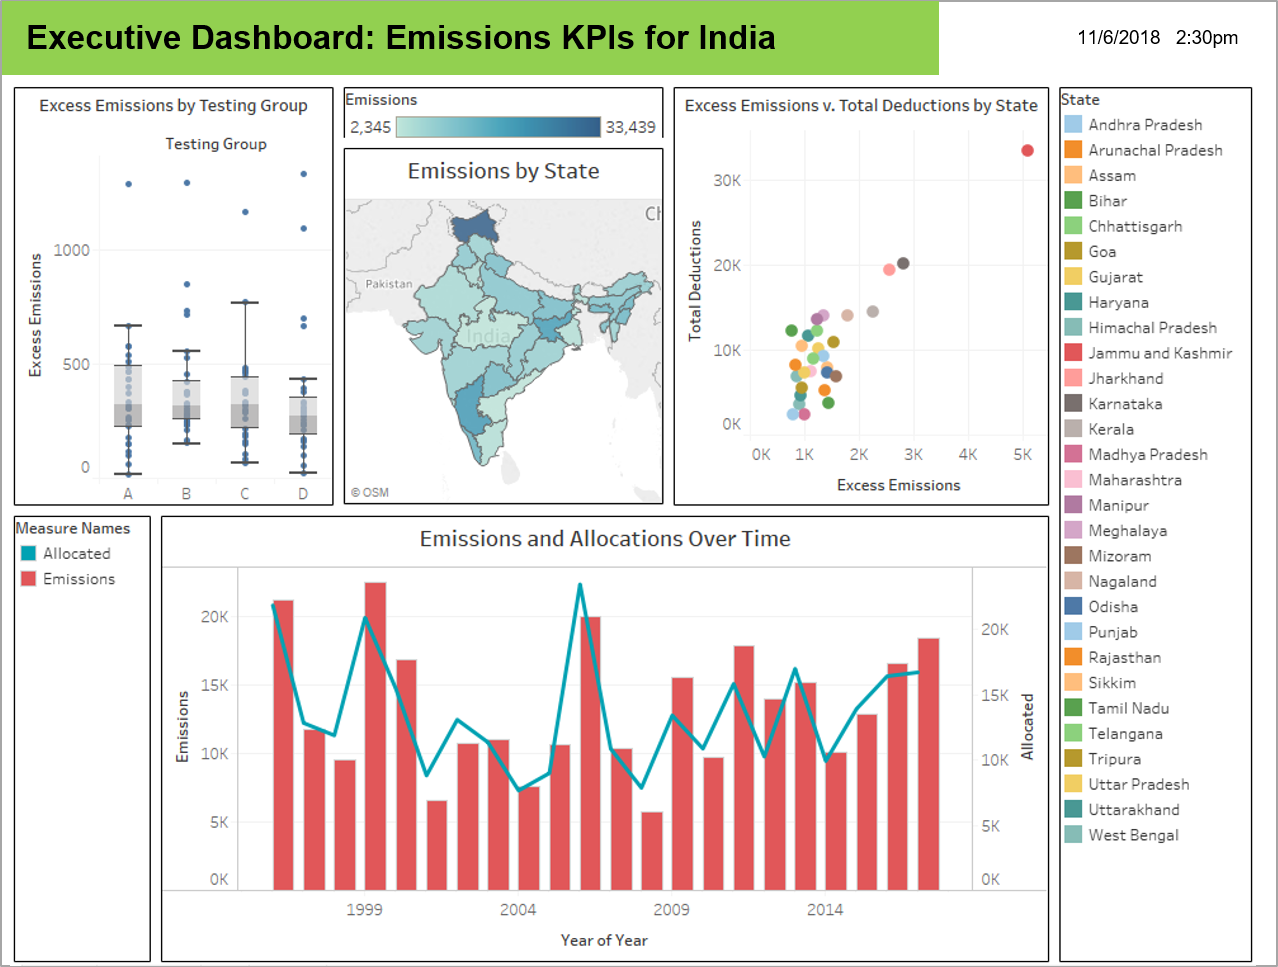
Data visualizations that highlight new insights. This use case took dat from a predictor tool in Generation to discover new insights with visualizations.
This use case shared preliminary data science findings with members to demonstrate a different view of their metrics.
Find more information on how to Leverage Data Science Smartly here.
Find more information here.
Visualizations help to identify patterns in data to discover and understand stories.
Target = FeS in Ash (% weight)
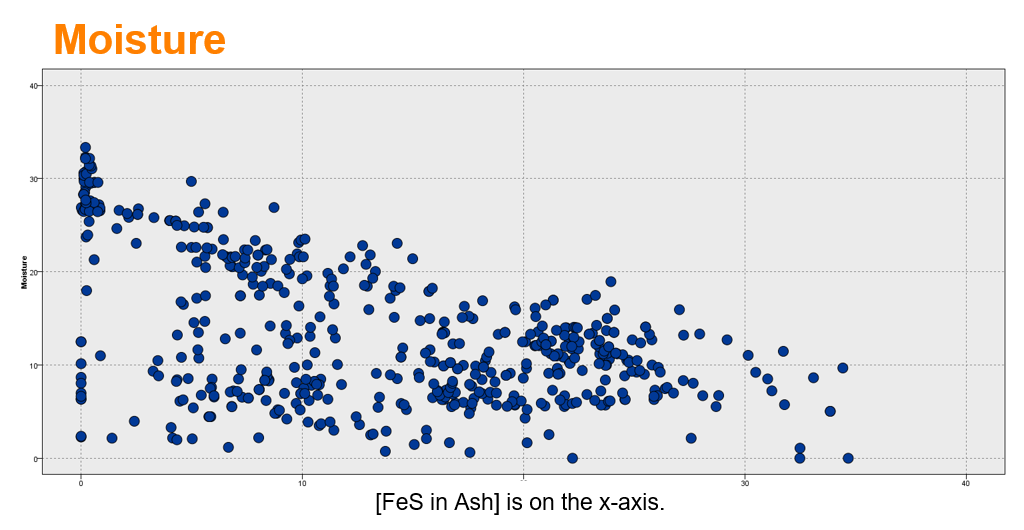
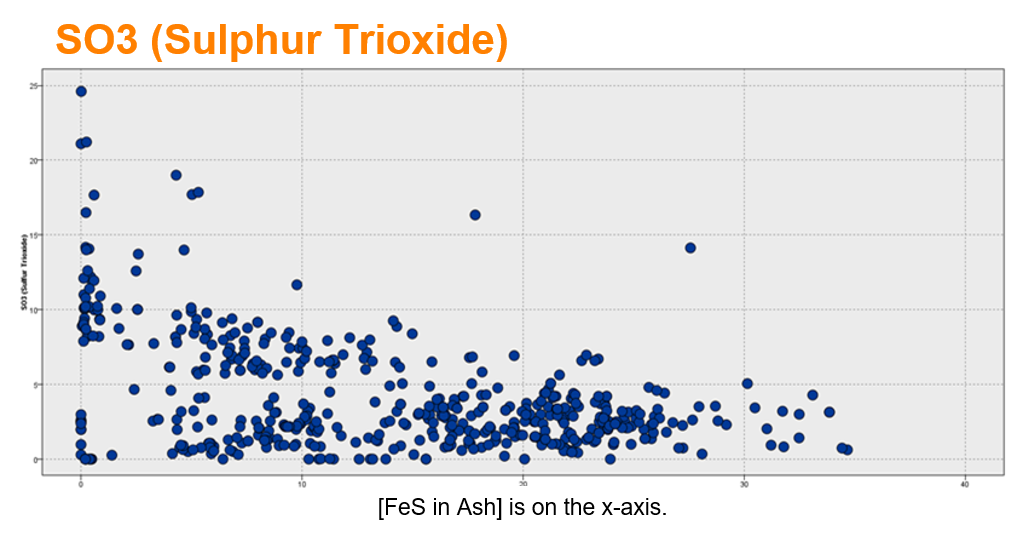
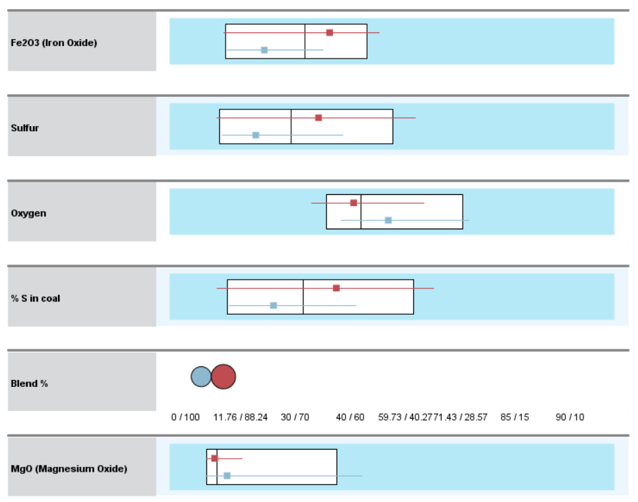
These charts show a mixed relationship with FeS in Ash (% weight). There may be two (or more) patterns.
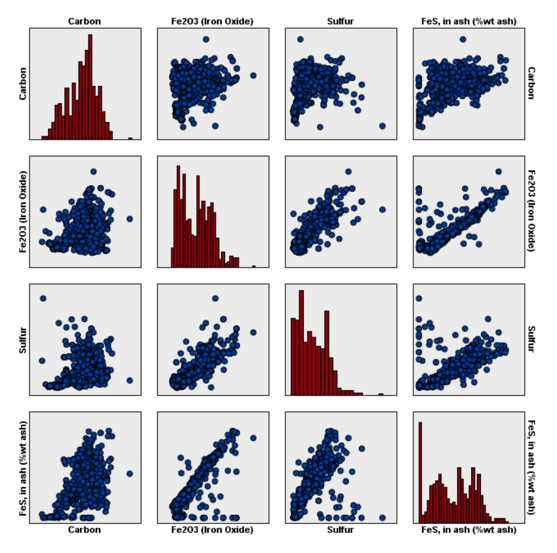
Box plots show the median surrounded by the interquartile range (25th percentile to 75th percentile. The 2 clusters are well-separated.)
Learn more here.
Opportunity to use data science share with members a different point of view of their data.
Multivariate analysis: Provide members with more sophisticated understanding of the benchmark data by applying multivariate analysis. Discover the interrelationships between multiple variables in the study.
Predictive analysis: Members are interested in the interrelationship of the sustainability efforts. There is an opportunity to understand the causation that may be correlated to sustainability variables in the study.
External data: Provide members with greater context for the metrics by incorporating external data to understand climate, demographics, GIS/mapping and plant operations data may affect sustainability results. For example, the EPA has emissions and water flow data at a high level of detail that can inform the member’s sustainability strategy.
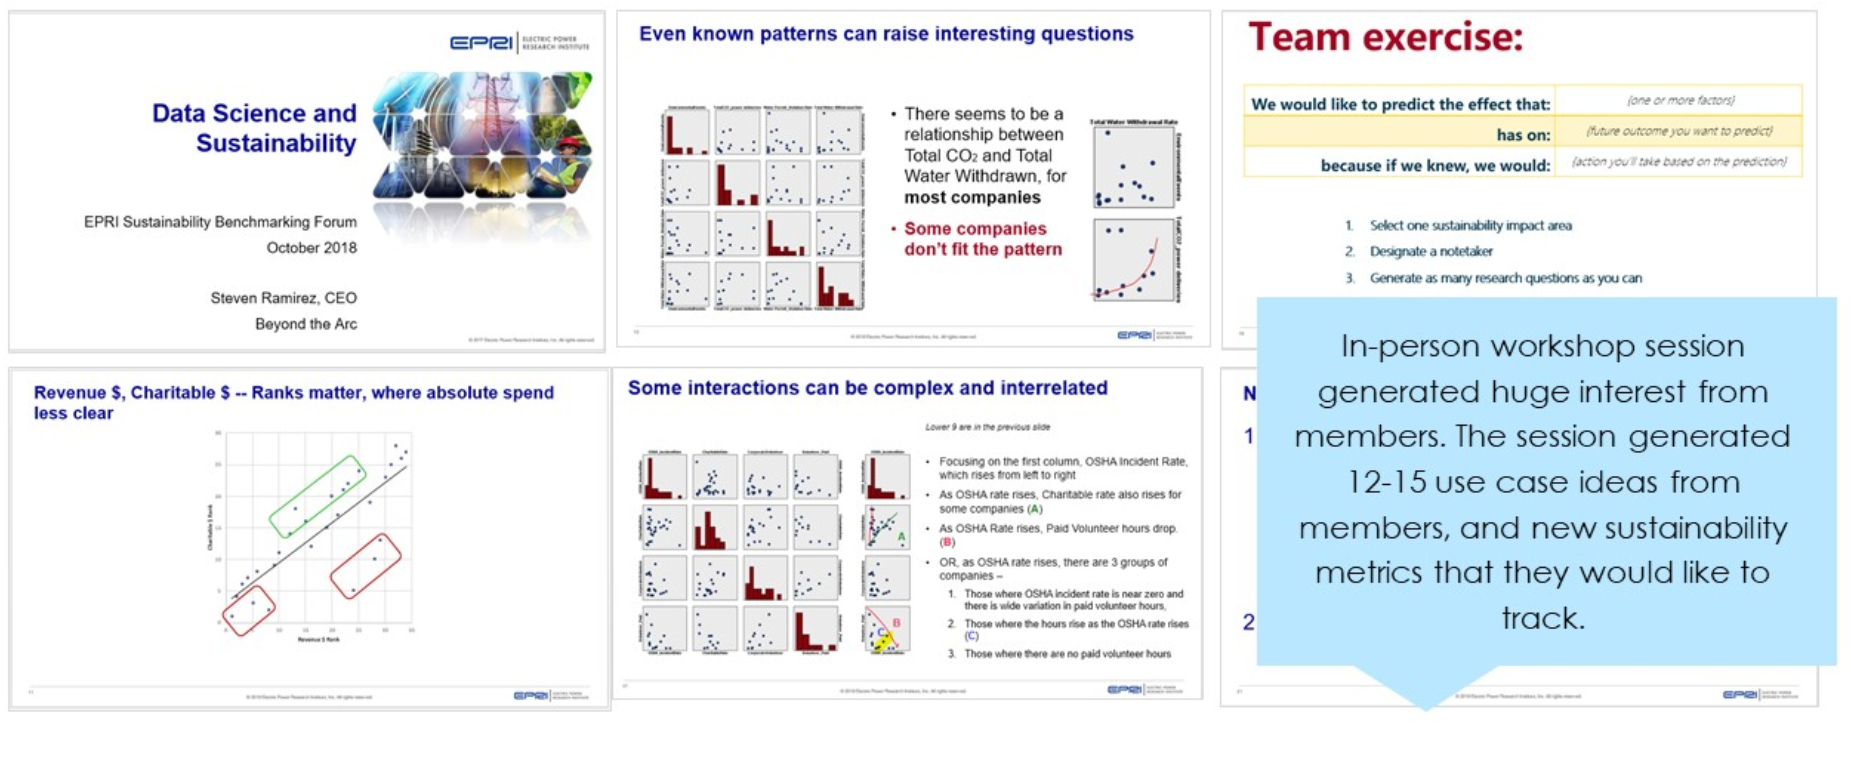
Member engagement: The TI project gave the Sustainability team an opportunity to start a dialogue with members about their hypothesis and the metrics that are of greatest importance to them. The workshop with members generated 12-15 hypothesis to explore.
Predictive variables: Through our analysis, we identified variables that might be better predictors of future performance and tagged them as valid and invalid variables.
SPSS Training: Provided Morgan Scott and a her analyst with training on using SPSS Modeler so that they can continue to explore her data without restrictions and pursue the issue of interests that the members identified during the workshop.
The Air Quality System (AQS) is EPA’s repository of ambient air quality data. AQS stores data from over 10,000 monitors, 5000 of which are currently active.
National Atmospheric Deposition Program
EPA’s Critical Loads Mapper Tool enables access to information on atmospheric deposition, critical loads, and their exceedances to better understand vulnerability to atmospheric pollution.
National Atmospheric Deposition Program
Detailed estimate of air emissions of both criteria and hazardous air pollutants from all air emissions sources.
The Toxics Release Inventory tracks the management of certain toxic chemicals that may pose a threat to human health and the environment.
https://earthdata.nasa.gov/earth-observation-data/near-real-time/hazards-and-disasters/air-quality
https://www.usgs.gov/centers/eros/science/national-land-cover-database
https://www.nodc.noaa.gov/ocads/oceans/
https://www.ncdc.noaa.gov/cdo-web/datatools/lcd
https://www.nrel.gov/analysis/jedi/index.html
Using JEDI, you can analyze the energy impacts of wind, biofuels, concentrating solar power, geothermal, marine and hydrokinetic power, coal, and natural gas power plants.
https://openei.org/wiki/Utility_Rate_Database
Rate structure information from utilities in the U.S. maintained by the U.S. Department of Energy
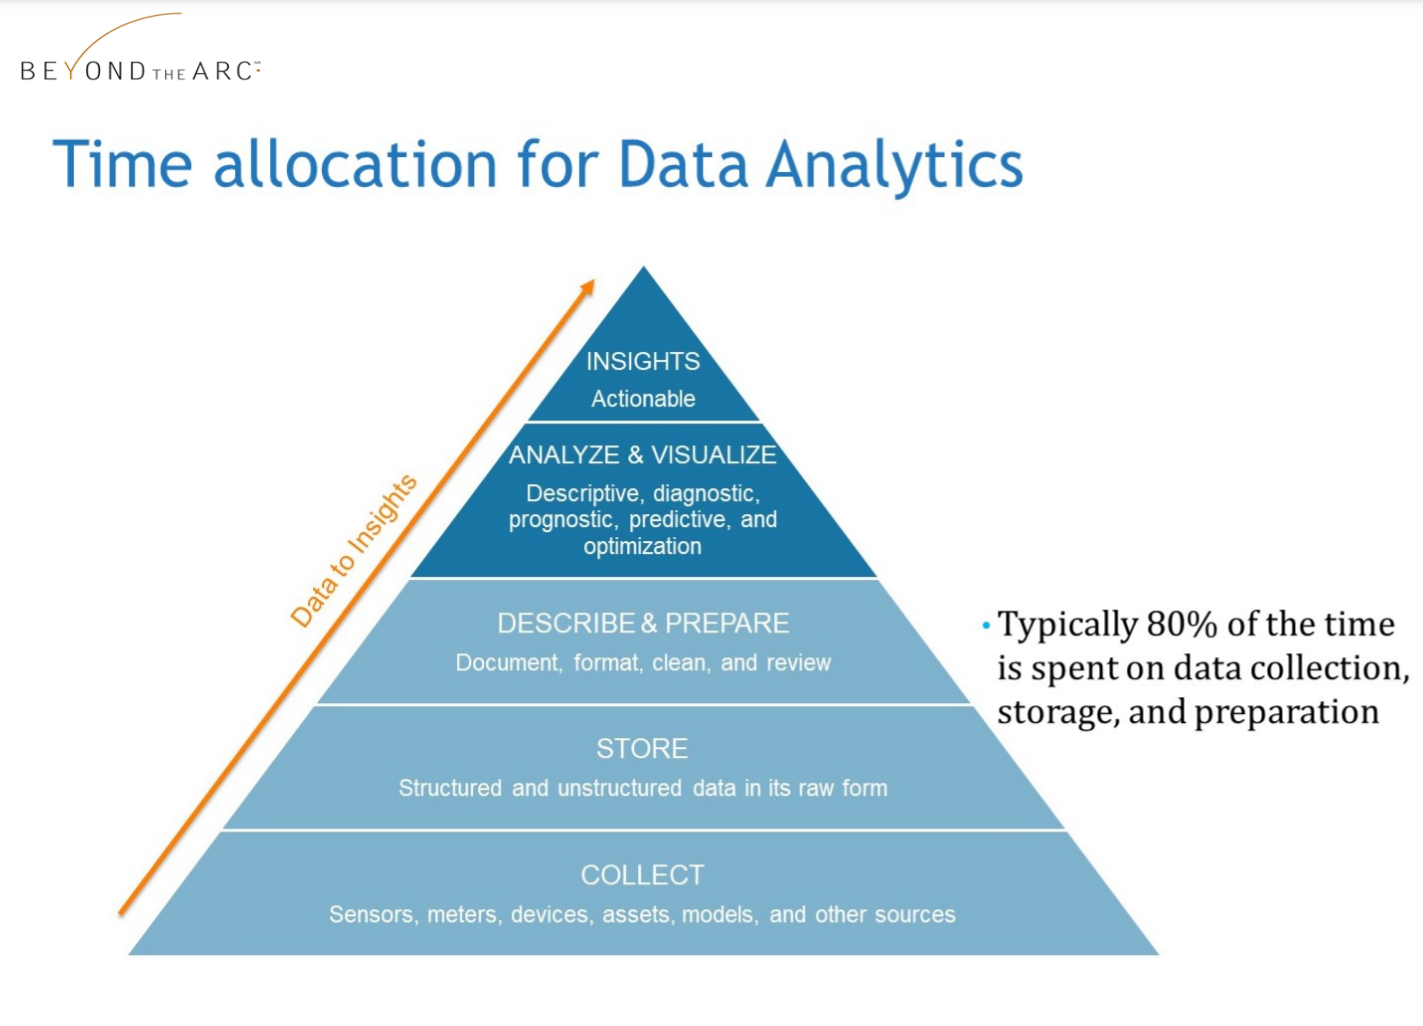
A. 3 Major Steps to Data Science Project
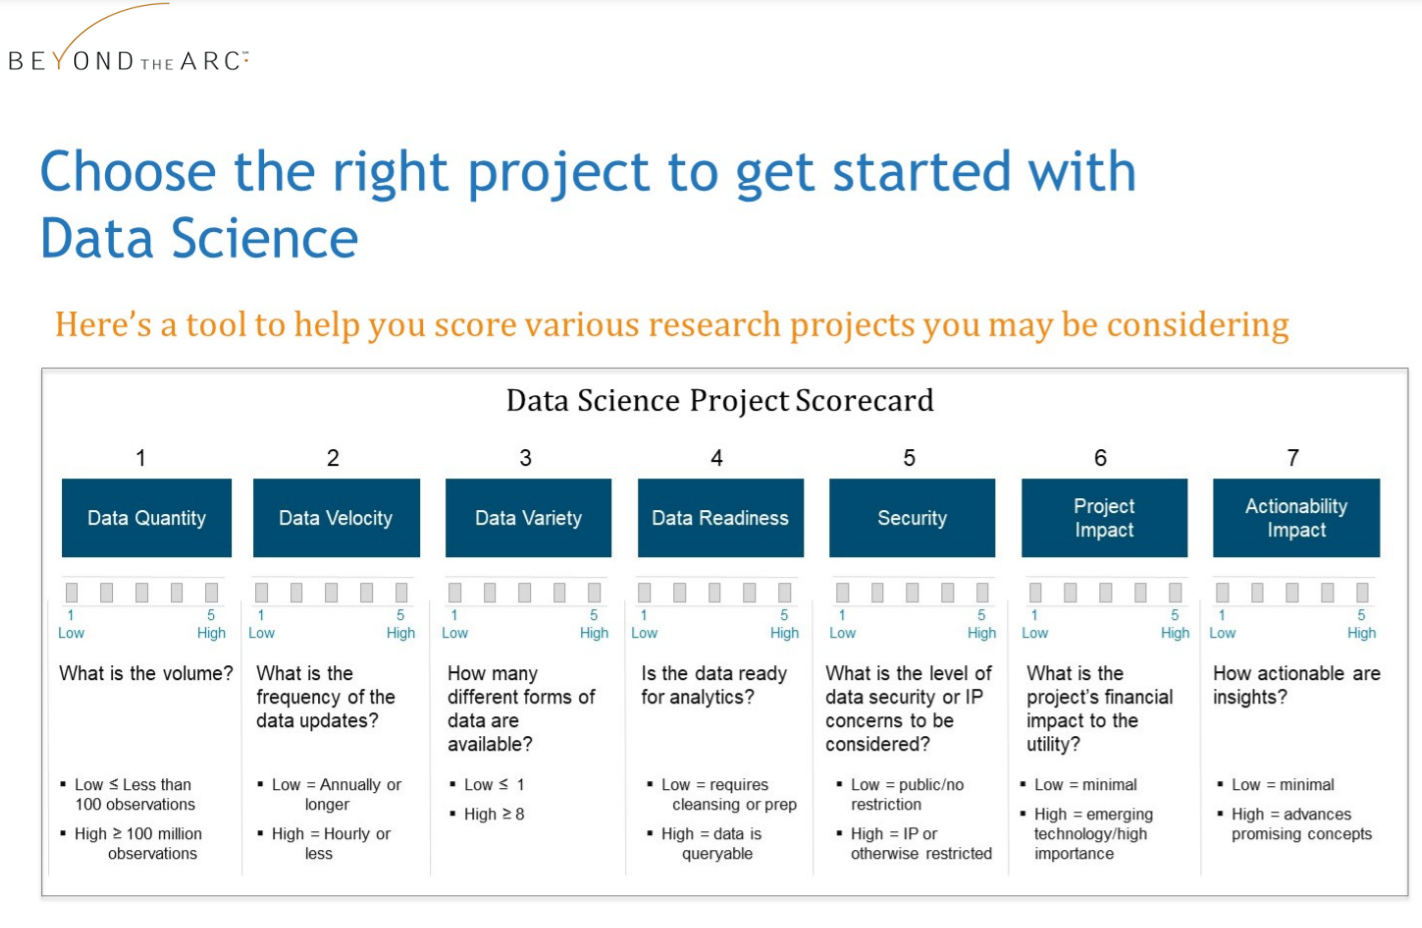
C. Data Science Project Scorecard
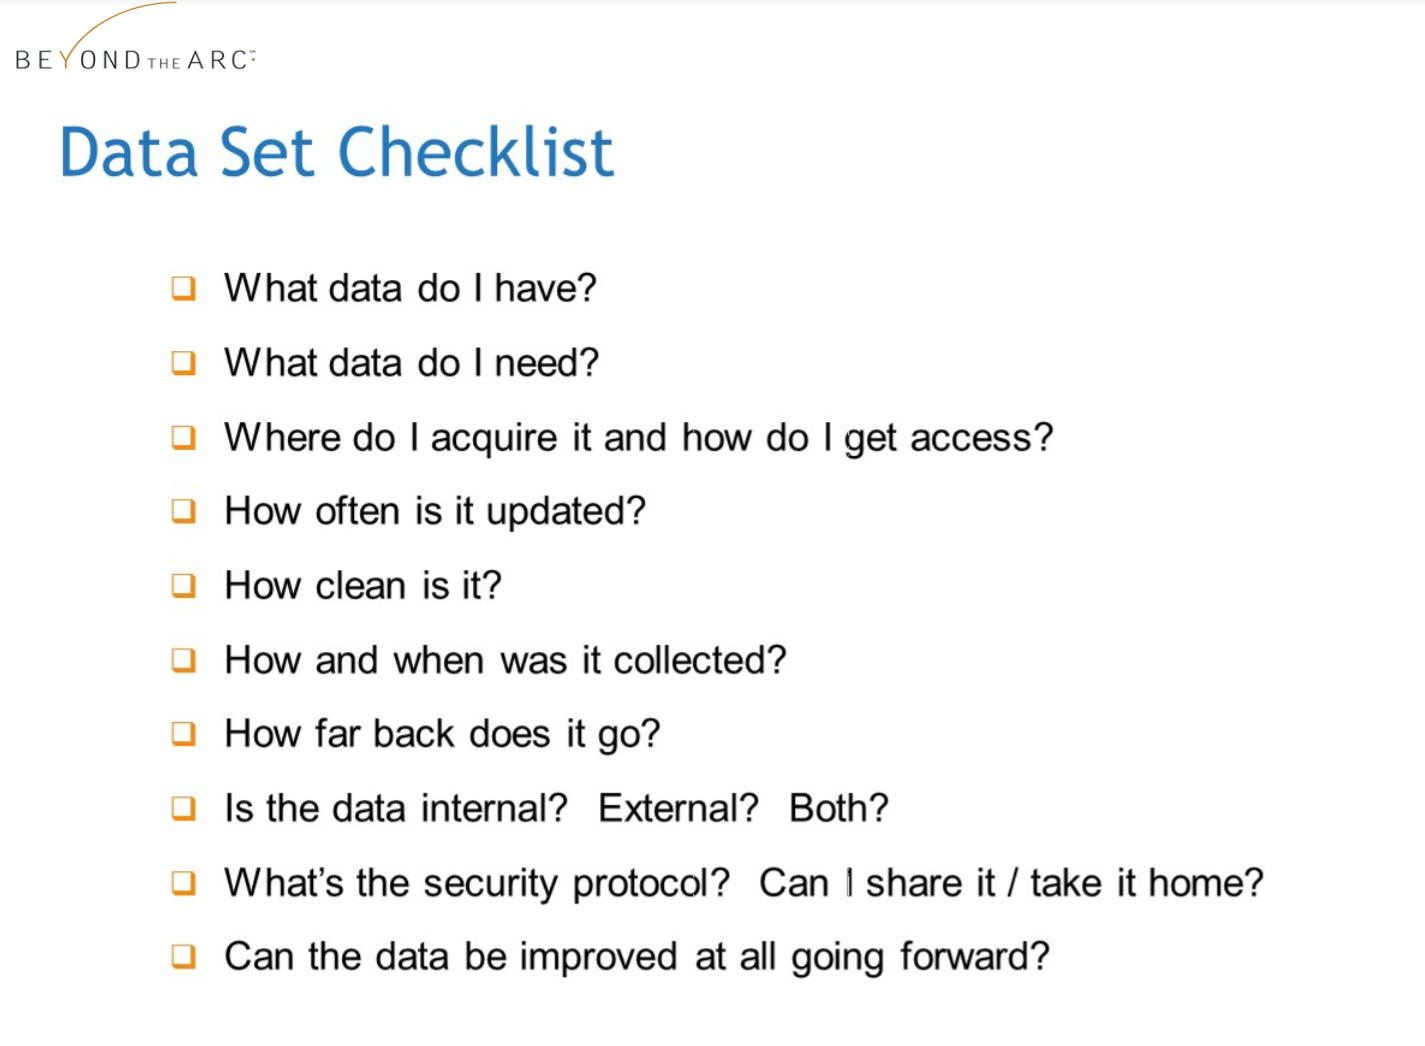
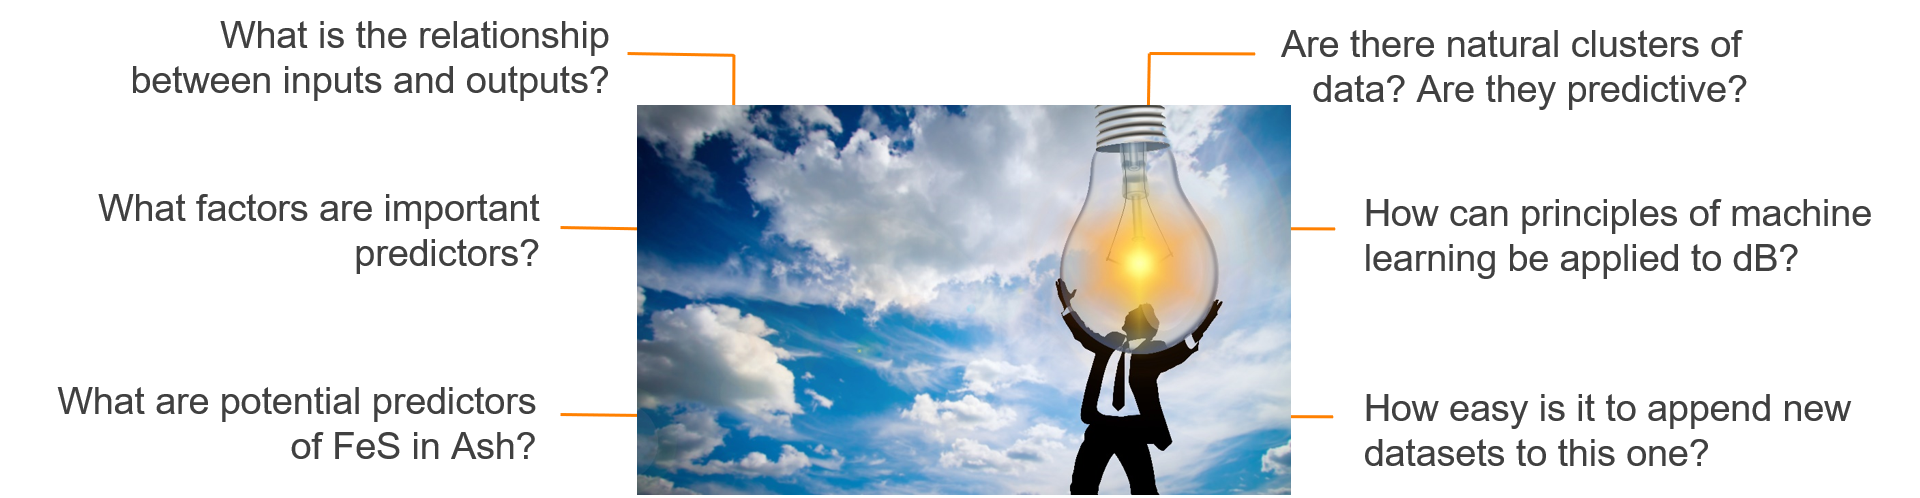
D. 10 Questions to Understand Your Data
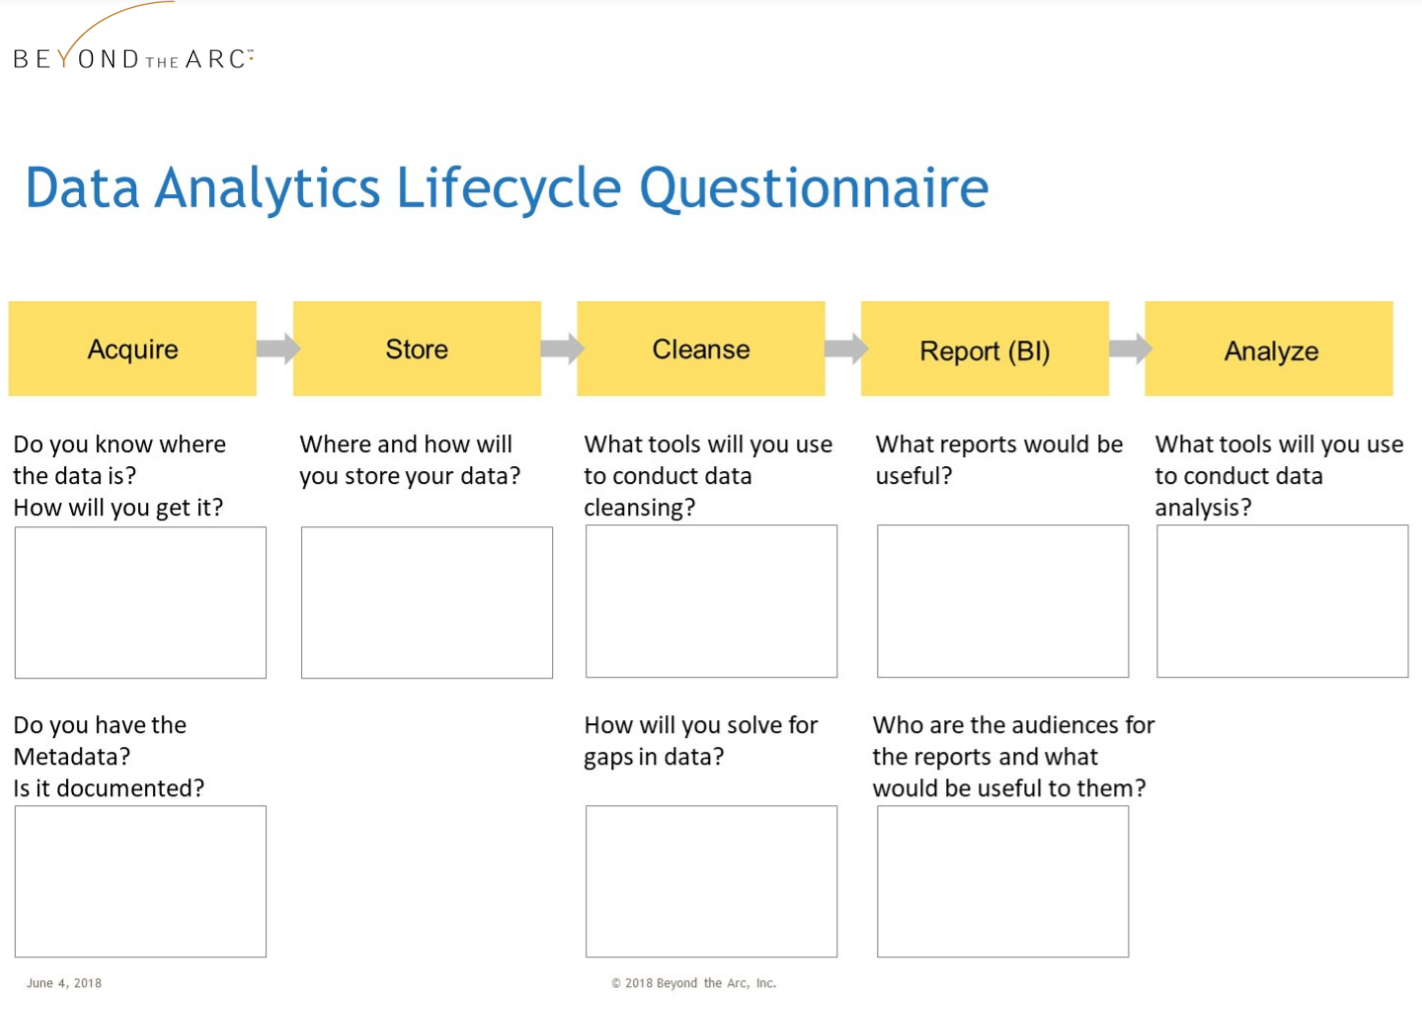
E. Data Analytics Lifecycle with Questionnaire
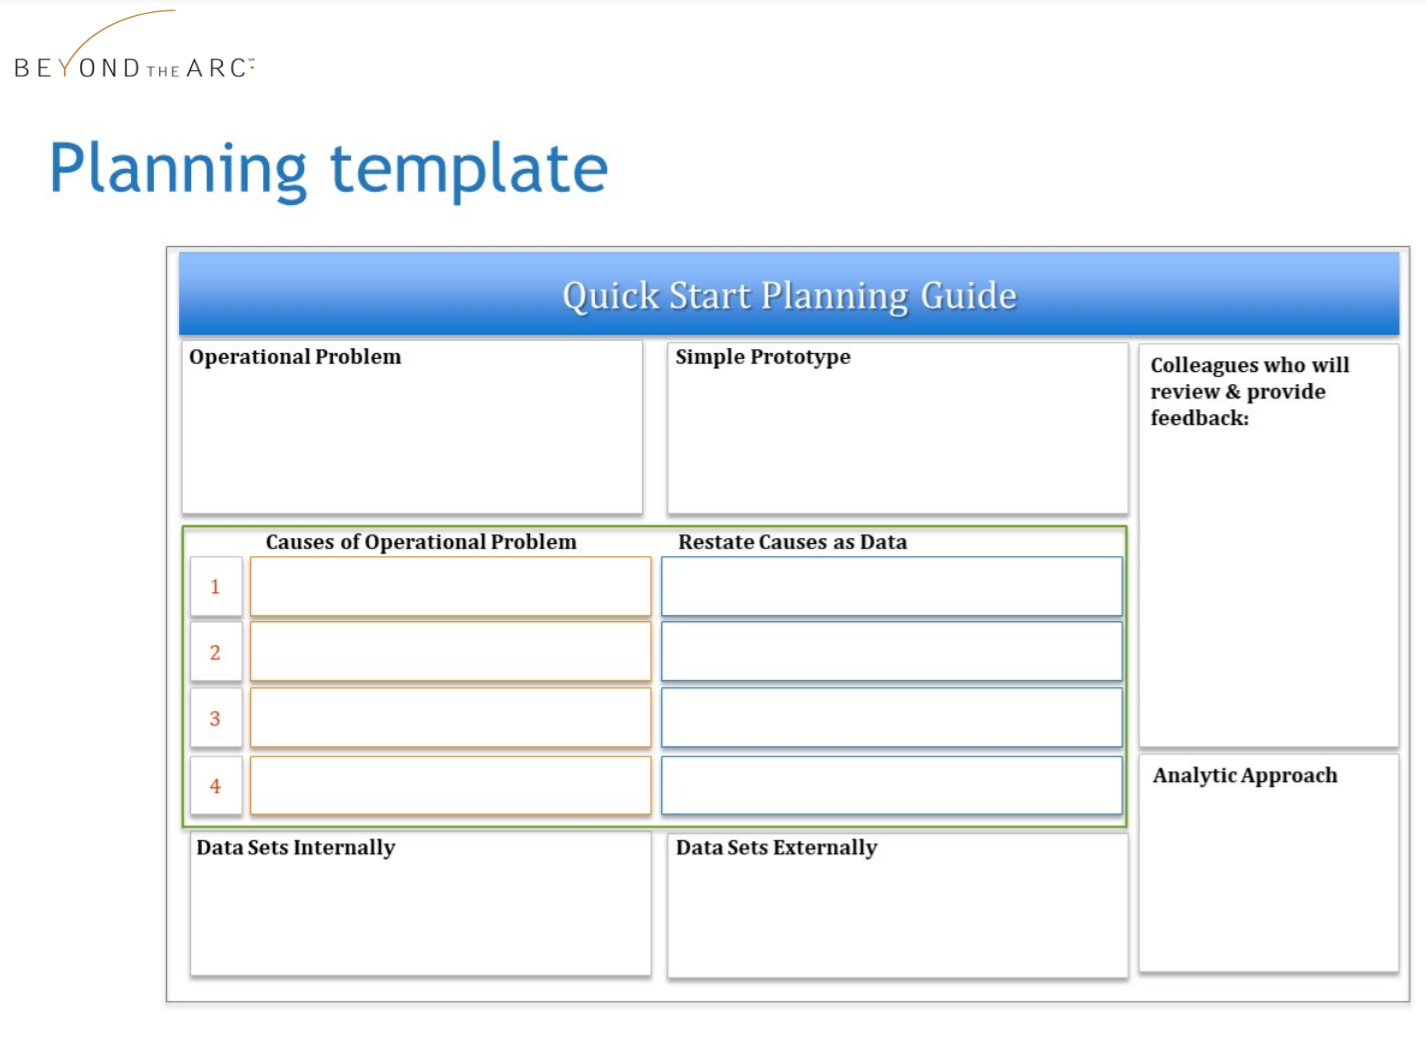
F. Data Analytics Planning Template